Loyalty in Heritage Tourism: The Case of Córdoba and Its Four World Heritage Sites

 ,
,  , and
, and
Abstract
:1. Introduction
2. Theorical Background
Turistification, Gentrification and Tourismphobia
3. Research Objective, Methodology and Data
3.1. Data
3.2. Methodology
4. Results
4.1. Analysis of the Individual Reliability of the Items
4.2. Analysis of the Reliability of the First-Order Constructs
4.3. Convergent Validity
4.4. Hypothesis Testing
5. Discussion
6. Conclusions
Author Contributions
Funding
Conflicts of Interest
References
- De Simone, E.; Canale, R.R.; Di Maio, A. Do UNESCO World Heritage Sites influence international tourist arrivals? Evidence from Italian provincial data. Soc. Indic. Res. 2019, 146, 345–359. [Google Scholar] [CrossRef]
- Nguyen, T.H.H.; Cheung, C. The classification of heritage tourists: A case of Hue city, Vietnam. J. Herit. Tour. 2014, 9, 35–50. [Google Scholar] [CrossRef]
- Saqib, N. A positioning strategy for a tourist destination, based on analysis of customers’ perceptions and satisfactions. J. Tour. Anal. Rev. Análisis Turístico 2019, 26, 131–151. [Google Scholar] [CrossRef]
- Fornell, C.; Johnson, M.D.; Anderson, E.W.; Cha, J.; Bryant, B.E. The American customer satisfaction index: Nature, purpose, and findings. J. Mark. 1996, 60, 7–18. [Google Scholar] [CrossRef] [Green Version]
- Bezerra, G.C.; Gomes, C.F. Determinants of passenger loyalty in multi-airport regions: Implications for tourism destination. Tour. Manag. Perspect. 2019, 31, 145–158. [Google Scholar] [CrossRef]
- Ali, S.S.; Kaur, R. An analysis of satisfaction level of 3PL service users with the help of ACSI. Benchmarking Int. J. 2018, 5, 24–46. [Google Scholar] [CrossRef]
- Fornell, C. A national customer satisfaction barometer: The Swedish experience. J. Market. 1992, 56, 6–21. [Google Scholar] [CrossRef]
- Anderson, E.W.; Sullivan, M.W. The antecedents and consequences of customer satisfaction for firms. Market. Sci. 1993, 12, 125–143. [Google Scholar] [CrossRef]
- Cronin, J.J., Jr.; Brady, M.K.; Hult, G.T.M. Assessing the effects of quality, value, and customer satisfaction on consumer behavioral intentions in service environments. J. Retail. 2000, 76, 193–218. [Google Scholar] [CrossRef]
- Anderson, E.W.; Fornell, C.; Lehmann, D.R. Customer Satisfaction, Market Share, and Profitability: Findings from Sweden. J. Market. 1994, 58, 53–66. [Google Scholar] [CrossRef]
- Hult, G.T.M.; Morgeson, F.V.; Morgan, N.A.; Mithas, S.; Fornell, C. Do managers know what their customers think and why? J. Acad. Mark. Sci. 2017, 45, 37–54. [Google Scholar] [CrossRef]
- Fornell, C.; Michael, D.; Anderson, E.; Cha, J.; Bryant, B. The American Customer; American Customer Satisfaction Index: Ann Arbor, MI, USA, 1996. [Google Scholar]
- Baveye, P.C.; Baveye, J.; Gowdy, J. Soil “ecosystem” services and natural capital: Critical appraisal of research on uncertain ground. Front. Environ. Sci. 2016, 4, 41. [Google Scholar] [CrossRef]
- Altunel, M.C.; Erkurt, B. Cultural tourism in Istanbul: The mediation effect of tourist experience and satisfaction on the relationship between involvement and recommendation intention. J. Destin. Mark. Manag. 2015, 4, 213–221. [Google Scholar]
- Craik, J. The culture of tourism. In Touring Cultures; Routledge: London, UK, 2002; pp. 123–146. [Google Scholar]
- Poria, Y.; Butler, R.; Airey, D. Links between tourists, heritage, and reasons for visiting heritage sites. J. Travel Res. 2004, 43, 19–28. [Google Scholar] [CrossRef] [Green Version]
- Ramires, A.; Brandao, F.; Sousa, A.C. Motivation-based cluster analysis of international tourists visiting a World Heritage City: The case of Porto, Portugal. J. Destin. Mark. Manag. 2018, 8, 49–60. [Google Scholar] [CrossRef]
- Burns, L.; Eaddy, M.; Moore, C.; Speno, L.; McRae, H. Heritage Tourism Handbook: A How-To Guide for Georgia; Georgia Department of Natural Resources and Georgia Department of Natural Resources: Atlanta, GA, USA, 2010. [Google Scholar]
- Parasuraman, A.; Zeithaml, V.A.; Berry, L.L. A conceptual model of service quality and its implications for future research. J. Mark. 1985, 49, 41–50. [Google Scholar] [CrossRef]
- Chang, S. Experience economy in hospitality and tourism: Gain and loss values for service and experience. Tour. Manag. 2018, 64, 55–63. [Google Scholar] [CrossRef]
- Cossío-Silva, F.-J.; Revilla-Camacho, M.-Á.; Vega-Vázquez, M. The tourist loyalty index: A new indicator for measuring tourist destination loyalty? J. Innov. Knowl. 2019. [Google Scholar] [CrossRef]
- Kuo, N.-T.; Cheng, Y.-S.; Chang, K.-C.; Chuang, L.-Y. The asymmetric effect of tour guide service quality on tourist satisfaction. J. Qual. Assur. Hosp. Tour. 2018, 19, 521–542. [Google Scholar] [CrossRef]
- Wu, H.-C.; Li, M.-Y.; Li, T. A study of experiential quality, experiential value, experiential satisfaction, theme park image, and revisit intention. J. Hosp. Tour. Res. 2018, 42, 26–73. [Google Scholar] [CrossRef]
- Du Plessis, E.; Martin, J.C.; Roman, C.; Slabbert, E. Fuzzy logic to assess service quality at arts festivals. Event Manag. 2018, 22, 501–516. [Google Scholar] [CrossRef]
- Azhar, M.E.; Prayogi, M.A.; Sari, M. The Role Of Marketing Mix And Service Quality On Tourist Satisfaction And Loyalty At Samosir. Rev. Tur. Stud. Cercet. Tur. 2018, 10, 1662–1678. [Google Scholar] [CrossRef]
- Azhar, M.E.; Jufrizen, J.; Prayogi, M.A.; Sousa, M.J. The role of marketing mix and service quality on tourist satisfaction and loyalty at Samosir. Indep. J. Manag. Prod. 2019, 10, 1662–1678. [Google Scholar] [CrossRef] [Green Version]
- Bramtika, S.L.; Listyaningsih, E.; Purwanto, B. The Effect Of Service Quality, Price And Promotion On Visitors Satisfaction Toward Puncak Mas Tourism Object In Bandar Lampung. In Proceedings of 1st International Conference on Life, Innovation, Change and Knowledge (ICLICK 2018); Atlantis Press: Amsterdam, The Netherlands, 2019. [Google Scholar]
- Suhartanto, D.; Brien, A.; Primiana, I.; Wibisono, N.; Triyuni, N.N. Tourist loyalty in creative tourism: The role of experience quality, value, satisfaction, and motivation. Curr. Issues Tour. 2020, 23, 867–879. [Google Scholar] [CrossRef]
- Wong, I.A.; Ji, M.; Liu, M.T. The effect of event supportive service environment and authenticity in the quality–value–satisfaction framework. J. Hosp. Tour. Res. 2018, 42, 563–586. [Google Scholar] [CrossRef]
- Alkhurshan, M.; Rjoub, H. The Scope of an Integrated Analysis of Trust Switching Barriers, Customer Satisfaction and Loyalty. J. Compet. 2020, 12, 5. [Google Scholar] [CrossRef]
- Alrawadieh, Z.; Alrawadieh, Z.; Kozak, M. Exploring the impact of tourist harassment on destination image, tourist expenditure, and destination loyalty. Tour. Manag. 2019, 73, 13–20. [Google Scholar] [CrossRef]
- Suchánek, P.; Králová, M. Customer satisfaction and different evaluation of it by companies. Econ. Res. Ekon. Istraživanja 2018, 31, 1330–1350. [Google Scholar] [CrossRef]
- del Romero Renau, L. Touristification, sharing economies and the new geography of urban conflicts. Urban. Sci. 2018, 2, 104. [Google Scholar] [CrossRef] [Green Version]
- Freytag, T.; Bauder, M. Bottom-up touristification and urban transformations in Paris. Tour. Geogr. 2018, 20, 443–460. [Google Scholar] [CrossRef]
- Sequera, J.; Nofre, J. Touristification, transnational gentrification and urban change in Lisbon: The neighbourhood of Alfama. Urban. Stud. 2020, 57, 3169–3189. [Google Scholar] [CrossRef]
- Jover, J.; Díaz-Parra, I. Gentrification, transnational gentrification and touristification in Seville, Spain. Urban. Stud. 2020, 57, 3044–3059. [Google Scholar] [CrossRef]
- Kim, H.; Kim, Y.G.; Woo, E. Examining the impacts of touristification on quality of life (QOL): The application of the bottom-up spillover theory. Serv. Ind. J. 2020, 1–16. [Google Scholar] [CrossRef]
- Gravari-Barbas, M.; Jacquot, S. Mechanisms, actors and impacts of the touristification of a tourism periphery: The Saint-Ouen flea market, Paris. Int. J. Tour. Cities 2019, 3, 370–391. [Google Scholar] [CrossRef]
- Mínguez, C.; Piñeira, M.J.; Fernández-Tabales, A. Social Vulnerability and Touristification of Historic Centers. Sustainability 2019, 11, 4478. [Google Scholar] [CrossRef] [Green Version]
- Outón, S.M.T. Gentrification, touristification and revitalization of the Monumental Zone of Pontevedra, Spain. Int. J. Tour. Cities 2019, 2, 347–369. [Google Scholar] [CrossRef]
- González-Pérez, J.M. The dispute over tourist cities. Tourism gentrification in the historic Centre of Palma (Majorca, Spain). Tour. Geogr. 2019, 2, 171–191. [Google Scholar]
- Robertson, D.; Oliver, C.; Nost, E. Short-term rentals as digitally-mediated tourism gentrification: Impacts on housing in New Orleans. Tour. Geogr. 2020, 1–24. [Google Scholar] [CrossRef]
- Totah, F.M. Tourism Gentrification of the Old City of Damascus. In Gentrification around the World; Springer: Berlin/Heidelberg, Germany, 2020; Volume I, pp. 245–264. [Google Scholar]
- Sequera, J.; Nofre, J. Shaken, not stirred: New debates on touristification and the limits of gentrification. City 2018, 22, 843–855. [Google Scholar] [CrossRef]
- Tulumello, S.; Allegretti, G. Articulating urban change in Southern Europe: Gentrification, touristification and financialisation in Mouraria, Lisbon. Eur. Urban. Reg. Stud. 2020. [Google Scholar] [CrossRef]
- Tong, B.; Gunter, U. Hedonic pricing and the sharing economy: How profile characteristics affect Airbnb accommodation prices in Barcelona, Madrid, and Seville. Curr. Issues Tour. 2020, 1–20. [Google Scholar] [CrossRef]
- Aguilera, T.; Artioli, F.; Colomb, C. Explaining the diversity of policy responses to platform-mediated short-term rentals in European cities: A comparison of Barcelona, Paris and Milan. Environ. Plan. A Econ. Space 2019, 0308518X19862286. [Google Scholar] [CrossRef]
- Hoffstaedter, G. Representing culture in Malaysian cultural theme parks: Tensions and contradictions. In Anthropological Forum; Routledge: Abingdon, UK, 2008; pp. 139–160. [Google Scholar]
- Lovell, J.; Bull, C. Authentic and Inauthentic Places in Tourism: From Heritage Sites to Theme Parks; Routledge: New York, NY, USA, 2017. [Google Scholar]
- Seraphin, H.; Gowreesunkar, V.; Zaman, M.; Lorey, T. Limitations of Trexit (tourism exit) as a solution to overtourism. Worldw. Hosp. Tour. Themes 2019, 11, 566–581. [Google Scholar] [CrossRef]
- Perkumienė, D.; Pranskūnienė, R. Overtourism: Between the right to travel and residents’ rights. Sustainability 2019, 11, 2138. [Google Scholar] [CrossRef] [Green Version]
- Insch, A. The challenges of over-tourism facing New Zealand: Risks and responses. J. Destin. Mark. Manag. 2020, 15, 100378. [Google Scholar] [CrossRef]
- García-Hernández, M.; la Calle-Vaquero, D.; Yubero, C. Cultural heritage and urban tourism: Historic city centres under pressure. Sustainability 2017, 9, 1346. [Google Scholar] [CrossRef] [Green Version]
- Nomura, R.; Shan, S.; Mori, S. Analyzing Spatial Structure of Traditional Houses in Old Towns with Tourism Development and Its Transformation toward Sustainable Development of Residential Environments in Hexia Old Town, in China. Sustainability 2018, 10, 3809. [Google Scholar] [CrossRef] [Green Version]
- Shahab, A.; Zhang, H.; Ullah, H.; Rashid, A.; Rad, S.; Li, J.; Xiao, H. Pollution characteristics and toxicity of potentially toxic elements in road dust of a tourist city, Guilin, China: Ecological and health risk assessment✰. Environ. Pollut. 2020, 266, 115419. [Google Scholar] [CrossRef]
- Alegre, J.; Garau, J. Tourist satisfaction and dissatisfaction. Ann. Tour. Res. 2010, 37, 52–73. [Google Scholar] [CrossRef]
- Zhang, X.; Yang, Y.; Zhang, Y.; Zhang, Z. Designing tourist experiences amidst air pollution: A spatial analytical approach using social media. Ann. Tour. Res. 2020, 84, 102999. [Google Scholar] [CrossRef]
- Worthing, M.; Bosworth, L.; Papandrea, M.; Poehler, E.; Ellis, S.; Laurence, R. HHpXRF study of recent zinc and lead pollution on lava stepping stones from Pompeii: Tourist footfall, tyre dust and leaded petrol. Archaeometry 2020, 62, 1042–1066. [Google Scholar] [CrossRef]
- Milano, C.; Novelli, M.; Cheer, J.M. Overtourism and Tourismphobia: A journey through Four Decades of Tourism Development, Planning and Local Concerns. Tour. Plan. Dev. 2019, 16, 353–357. [Google Scholar]
- Milano, C.; Novelli, M.; Cheer, J.M. Overtourism and degrowth: A social movements perspective. J. Sustain. Tour. 2019, 27, 1857–1875. [Google Scholar] [CrossRef]
- Namberger, P.; Jackisch, S.; Schmude, J.; Karl, M. Overcrowding, overtourism and local level disturbance: How much can Munich handle? Tour. Plan. Dev. 2019, 16, 452–472. [Google Scholar] [CrossRef]
- Agyeiwaah, E. Over-tourism and sustainable consumption of resources through sharing: The role of government. Int. J. Tour. Cities 2019, 6, 99–116. [Google Scholar] [CrossRef]
- Cheer, J.M.; Milano, C.; Novelli, M. Tourism and community resilience in the Anthropocene: Accentuating temporal overtourism. J. Sustain. Tour. 2019, 27, 554–572. [Google Scholar] [CrossRef]
- Pechlaner, H.; Innerhofer, E.; Erschbamer, G. Overtourism: Tourism Management and Solutions; Routledge: New York, NY, USA, 2019. [Google Scholar]
- Nepal, R.; Nepal, S.K. Managing overtourism through economic taxation: Policy lessons from five countries. Tour. Geogr. 2019, 1–22. [Google Scholar] [CrossRef]
- Navarro-Ruiz, S.; Casado-Díaz, A.B.; Ivars-Baidal, J. Cruise tourism: The role of shore excursions in the overcrowding of cities. Int. J. Tour. Cities 2019, 6, 197–214. [Google Scholar] [CrossRef]
- Kuščer, K.; Mihalič, T. Residents’ attitudes towards overtourism from the perspective of tourism impacts and cooperation—The case of Ljubljana. Sustainability 2019, 11, 1823. [Google Scholar] [CrossRef] [Green Version]
- O’Reilly, A.M. Tourism carrying capacity: Concept and issues. Tour. Manag. 1986, 7, 254–258. [Google Scholar] [CrossRef]
- Garau-Vadell, J.B.; Gutierrez-Taño, D.; Diaz-Armas, R. Economic crisis and residents’ perception of the impacts of tourism in mass tourism destinations. J. Destin. Mark. Manag. 2018, 7, 68–75. [Google Scholar] [CrossRef]
- Martínez-Garcia, E.; Raya, J.M.; Majó, J. Differences in residents’ attitudes towards tourism among mass tourism destinations. Int. J. Tour. Res. 2017, 19, 535–545. [Google Scholar] [CrossRef] [Green Version]
- Lopez-Sanchez, Y.; Pulido-Fernández, J.I. Factors influencing the willingness to pay for sustainable tourism: A case of mass tourism destinations. Int. J. Sustain. Dev. World Ecol. 2017, 24, 262–275. [Google Scholar] [CrossRef]
- Weaver, D. Mass tourism and alternative tourism in the Caribbean. In Tourism and the Less Developed World: Issues and Case Studies; CABI Publishing: Wallingford, UK, 2001. [Google Scholar]
- Nolasco-Cirugeda, A.; Martí, P.; Ponce, G. Keeping mass tourism destinations sustainable via urban design: The case of Benidorm. Sustain. Dev. 2020, 28, 1289–1303. [Google Scholar] [CrossRef]
- Judd, D.R. Constructing the tourist bubble. In Tourist City; Yale University Press: Morrisville, NY, USA, 1999. [Google Scholar]
- Csapo, J. The role and importance of cultural tourism in modern tourism industry. In Strategies for Tourism Industry: Micro and Macro Perspectives; IntechOpen: London, UK, 2012. [Google Scholar]
- Farooq, M.S.; Salam, M.; Fayolle, A.; Jaafar, N.; Ayupp, K. Impact of service quality on customer satisfaction in Malaysia airlines: A PLS-SEM approach. J. Air Transp. Manag. 2018, 67, 169–180. [Google Scholar] [CrossRef]
- Ozdemir, B.; Çizel, B.; Bato Cizel, R. Satisfaction with all-inclusive tourism resorts: The effects of satisfaction with destination and destination loyalty. Int. J. Hosp. Tour. Adm. 2012, 13, 109–130. [Google Scholar] [CrossRef]
- Mansor, N.; Ariffin, R.; Nordin, R.; Salleh, M. Mosque Tourism Certification in Waqf Management: A Model by Ukhwah Samara. Soc. Sci. Humanit. 2015, 23, 291–304. [Google Scholar]
- Nguyen, T.H.H.; Cheung, C. Chinese heritage tourists to heritage sites: What are the effects of heritage motivation and perceived authenticity on satisfaction? Asia Pac. J. Tour. Res. 2016, 21, 1155–1168. [Google Scholar] [CrossRef]
- Wu, H.-C.; Li, T. A study of experiential quality, perceived value, heritage image, experiential satisfaction, and behavioral intentions for heritage tourists. J. Hosp. Tour. Res. 2017, 41, 904–944. [Google Scholar] [CrossRef]
- Kempiak, J.; Hollywood, L.; Bolan, P.; McMahon-Beattie, U. The heritage tourist: An understanding of the visitor experience at heritage attractions. Int. J. Herit. Stud. 2017, 23, 375–392. [Google Scholar] [CrossRef]
- Qi, L.; Wang, R.; Hu, C.; Li, S.; He, Q.; Xu, X. Time-aware distributed service recommendation with privacy-preservation. Inf. Sci. 2019, 480, 354–364. [Google Scholar] [CrossRef]
- Hallak, R.; Assaker, G.; El-Haddad, R. Re-examining the relationships among perceived quality, value, satisfaction, and destination loyalty: A higher-order structural model. J. Vacat. Mark. 2018, 24, 118–135. [Google Scholar] [CrossRef]
- Cheng, B.L.; Gan, C.C.; Imrie, B.C.; Mansori, S. Service recovery, customer satisfaction and customer loyalty: Evidence from Malaysia’s hotel industry. Int. J. Qual. Serv. Sci. 2019, 11, 187–203. [Google Scholar] [CrossRef]
- Hosany, S.; Prayag, G. Patterns of tourists’ emotional responses, satisfaction, and intention to recommend. J. Bus. Res. 2013, 66, 730–737. [Google Scholar] [CrossRef]
- Veasna, S.; Wu, W.-Y.; Huang, C.-H. The impact of destination source credibility on destination satisfaction: The mediating effects of destination attachment and destination image. Tour. Manag. 2013, 36, 511–526. [Google Scholar] [CrossRef]
- Assaker, G.; Vinzi, V.E.; O’Connor, P. Examining the effect of novelty seeking, satisfaction, and destination image on tourists’ return pattern: A two factor, non-linear latent growth model. Tour. Manag. 2011, 32, 890–901. [Google Scholar] [CrossRef]
- Buhalis, D.; López, E.P.; Martinez-Gonzalez, J.A. Influence of young consumers’ external and internal variables on their e-loyalty to tourism sites. J. Destin. Mark. Manag. 2020, 15, 100409. [Google Scholar] [CrossRef]
- San Martín, H.; Herrero, A.; García de los Salmones, M.d.M. An integrative model of destination brand equity and tourist satisfaction. Curr. Issues Tour. 2019, 22, 1992–2013. [Google Scholar] [CrossRef]
- Loureiro, S.M.C.; González, F.J.M. Calidad, satisfacción y fidelidad en el turismo rural: Un análisis hispano-portugués. Pap. Tur. 2012, 40, 49–65. [Google Scholar]
- Agyeiwaah, E.; Otoo, F.E.; Suntikul, W.; Huang, W.-J. Understanding culinary tourist motivation, experience, satisfaction, and loyalty using a structural approach. J. Travel Tour. Mark. 2019, 36, 295–313. [Google Scholar] [CrossRef]
- Thi, K.; Huy, T.; Van, C.; Tuan, P. The effects of service quality on international tourist satisfaction and loyalty: Insight from Vietnam. Int. J. Data Netw. Sci. 2020, 4, 179–186. [Google Scholar] [CrossRef]
- Mohseni, S.; Jayashree, S.; Rezaei, S.; Kasim, A.; Okumus, F. Attracting tourists to travel companies’ websites: The structural relationship between website brand, personal value, shopping experience, perceived risk and purchase intention. Curr. Issues Tour. 2018, 21, 616–645. [Google Scholar] [CrossRef]
- Nilson, T.H. Value-Added Marketing: Marketing Management for Superior Results; McGraw-Hill Book Company: New York, NY, USA, 1992. [Google Scholar]
- Kim, W.G.; Park, S.A. Social media review rating versus traditional customer satisfaction. Int. J. Contemp. Hosp. Manag. 2017, 29, 784–802. [Google Scholar]
- Pandža Bajs, I. Tourist perceived value, relationship to satisfaction, and behavioral intentions: The example of the Croatian tourist destination Dubrovnik. J. Travel Res. 2015, 54, 122–134. [Google Scholar] [CrossRef]
- Hu, L.-T.; Bentler, P.M. Evaluating Model Fit; Sage Pubication: New York, NY, USA, 1995. [Google Scholar]
- Sarstedt, M.; Hair Jr, J.F.; Cheah, J.-H.; Becker, J.-M.; Ringle, C.M. How to specify, estimate, and validate higher-order constructs in PLS-SEM. Australas. Mark. J. (AMJ) 2019, 27, 197–211. [Google Scholar] [CrossRef]
- Henseler, J.; Chin, W.W. A comparison of approaches for the analysis of interaction effects between latent variables using partial least squares path modeling. Struct. Equ. Modeling 2010, 17, 82–109. [Google Scholar] [CrossRef]
- Carmines, E.G.; Zeller, R.A. Reliability and Validity Assessment; Sage Publications: New York, NY, USA, 1979; Volume 17. [Google Scholar]
- Barclay, D.; Higgins, C.; Thompson, R. The Partial Least Squares (PLS) Approach to Causal Modelling: Personal Computer Adoption and Use as an Illustration. Technol. Stud. Spec. Issue Res. Methodol. 1995, 2, 285–309. [Google Scholar]
- Hair, J.F.; Ringle, C.M.; Sarstedt, M. Partial least squares: The better approach to structural equation modeling? Long Range Plan. 2012, 45, 312–319. [Google Scholar] [CrossRef]
- Fornell, C.; Larcker, D.F. Structural Equation Models with Unobservable Variables and Measurement Error: Algebra and Statistics; SAGE Publications Sage CA: Los Angeles, CA, USA, 1981. [Google Scholar]
- Nunnally, J.C.; Bernstein, I.H. Psychometric Theory; McGraw-Hill: New York, NY, USA, 1978. [Google Scholar]
- Su, L.; Hsu, M.K.; Swanson, S. The effect of tourist relationship perception on destination loyalty at a world heritage site in China: The mediating role of overall destination satisfaction and trust. J. Hosp. Tour. Res. 2017, 41, 180–210. [Google Scholar] [CrossRef] [Green Version]
- Santa-Cruz, F.G.; López-Guzmán, T. Culture, tourism and world heritage sites. Tour. Manag. Perspect. 2017, 24, 111–116. [Google Scholar] [CrossRef]
- Chi, C.G.-Q.; Qu, H. Examining the structural relationships of destination image, tourist satisfaction and destination loyalty: An integrated approach. Tour. Manag. 2008, 29, 624–636. [Google Scholar] [CrossRef]
- Jin, N.; Line, N.D.; Merkebu, J. The impact of brand prestige on trust, perceived risk, satisfaction, and loyalty in upscale restaurants. J. Hosp. Mark. Manag. 2016, 25, 523–546. [Google Scholar] [CrossRef]
- Kim, S.H.; Holland, S.; Han, H.S. A structural model for examining how destination image, perceived value, and service quality affect destination loyalty: A case study of Orlando. Int. J. Tour. Res. 2013, 15, 313–328. [Google Scholar] [CrossRef]
- Yi, X.; Fu, X.; Yu, L.; Jiang, L. Authenticity and loyalty at heritage sites: The moderation effect of postmodern authenticity. Tour. Manag. 2018, 67, 411–424. [Google Scholar] [CrossRef]
- Susilowati, C.; Sugandini, D. Perceived value, eWord-of-mouth, traditional word-of-mouth, and perceived quality to destination image of vacation tourists. Rev. Integr. Bus. Econ. Res. 2018, 7, 312–321. [Google Scholar]
- Prebensen, N.K.; Woo, E.; Chen, J.S.; Uysal, M. Motivation and involvement as antecedents of the perceived value of the destination experience. J. Travel Res. 2013, 52, 253–264. [Google Scholar] [CrossRef]
- Kim, J.-H. The impact of memorable tourism experiences on loyalty behaviors: The mediating effects of destination image and satisfaction. J. Travel Res. 2018, 57, 856–870. [Google Scholar] [CrossRef]
- Antón, C.; Camarero, C.; Laguna-García, M. Towards a new approach of destination loyalty drivers: Satisfaction, visit intensity and tourist motivations. Curr. Issues Tour. 2017, 20, 238–260. [Google Scholar] [CrossRef]
- Wu, H.-C.; Cheng, C.-C.; Ai, C.-H. A study of experiential quality, equity, happiness, rural image, experiential satisfaction, and behavioral intentions for the rural tourism industry in China. Int. J. Hosp. Tour. Adm. 2017, 18, 393–428. [Google Scholar] [CrossRef]
- Wang, T.-L.; Tran, P.T.K.; Tran, V.T. Destination perceived quality, tourist satisfaction and word-of-mouth. Tour. Rev. 2017, 72, 392–410. [Google Scholar] [CrossRef]
- Chen, Y.-S.; Lin, C.-Y.; Weng, C.-S. The influence of environmental friendliness on green trust: The mediation effects of green satisfaction and green perceived quality. Sustainability 2015, 7, 10135–10152. [Google Scholar] [CrossRef] [Green Version]
- See, G.-T.; Goh, Y.-N. Tourists’ intention to visit heritage hotels at George Town World Heritage Site. J. Herit. Tour. 2019, 14, 33–48. [Google Scholar] [CrossRef]
- Meleddu, M.; Melis, G.; Pulina, M.; Zapata-Aguirre, S. Expectations and service quality: Perceived performance at low-season events. Int. J. Event Festiv. Manag. 2019, 10, 110–137. [Google Scholar] [CrossRef]
- Parasuraman, A.; Grewal, D. The impact of technology on the quality-value-loyalty chain: A research agenda. J. Acad. Mark. Sci. 2000, 28, 168–174. [Google Scholar] [CrossRef]
- Petrick, J.F. The roles of quality, value, and satisfaction in predicting cruise passengers’ behavioral intentions. J. Travel Res. 2004, 42, 397–407. [Google Scholar] [CrossRef]
- Bodet, G. Loyalty in sport participation services: An examination of the mediating role of psychological commitment. J. Sport Manag. 2012, 26, 30–42. [Google Scholar] [CrossRef]
- Shonk, D.J.; Chelladurai, P. Service quality, satisfaction, and intent to return in event sport tourism. J. Sport Manag. 2008, 22, 587–602. [Google Scholar] [CrossRef]
- Özdemir, B.; Seyitoğlu, F. A conceptual study of gastronomical quests of tourists: Authenticity or safety and comfort? Tour. Manag. Perspect. 2017, 23, 1–7. [Google Scholar] [CrossRef]
- Verma, A.; Rajendran, G. The effect of historical nostalgia on tourists’ destination loyalty intention: An empirical study of the world cultural heritage site–Mahabalipuram, India. Asia Pac. J. Tour. Res. 2017, 22, 977–990. [Google Scholar] [CrossRef]
- Weaver, D. Advanced Introduction to Sustainable Tourism; Edward Elgar Pliblising: Northampton, MA, USA, 2020. [Google Scholar]
- Remoaldo, P.C.; Ribeiro, J.C.; Vareiro, L.; Santos, J.F. Tourists’ perceptions of world heritage destinations: The case of Guimarães (Portugal). Tour. Hosp. Res. 2014, 14, 206–218. [Google Scholar] [CrossRef]
- Orbaşli, A. Is tourism governing conservation in historic towns? J. Archit. Conserv. 2000, 6, 7–19. [Google Scholar] [CrossRef]

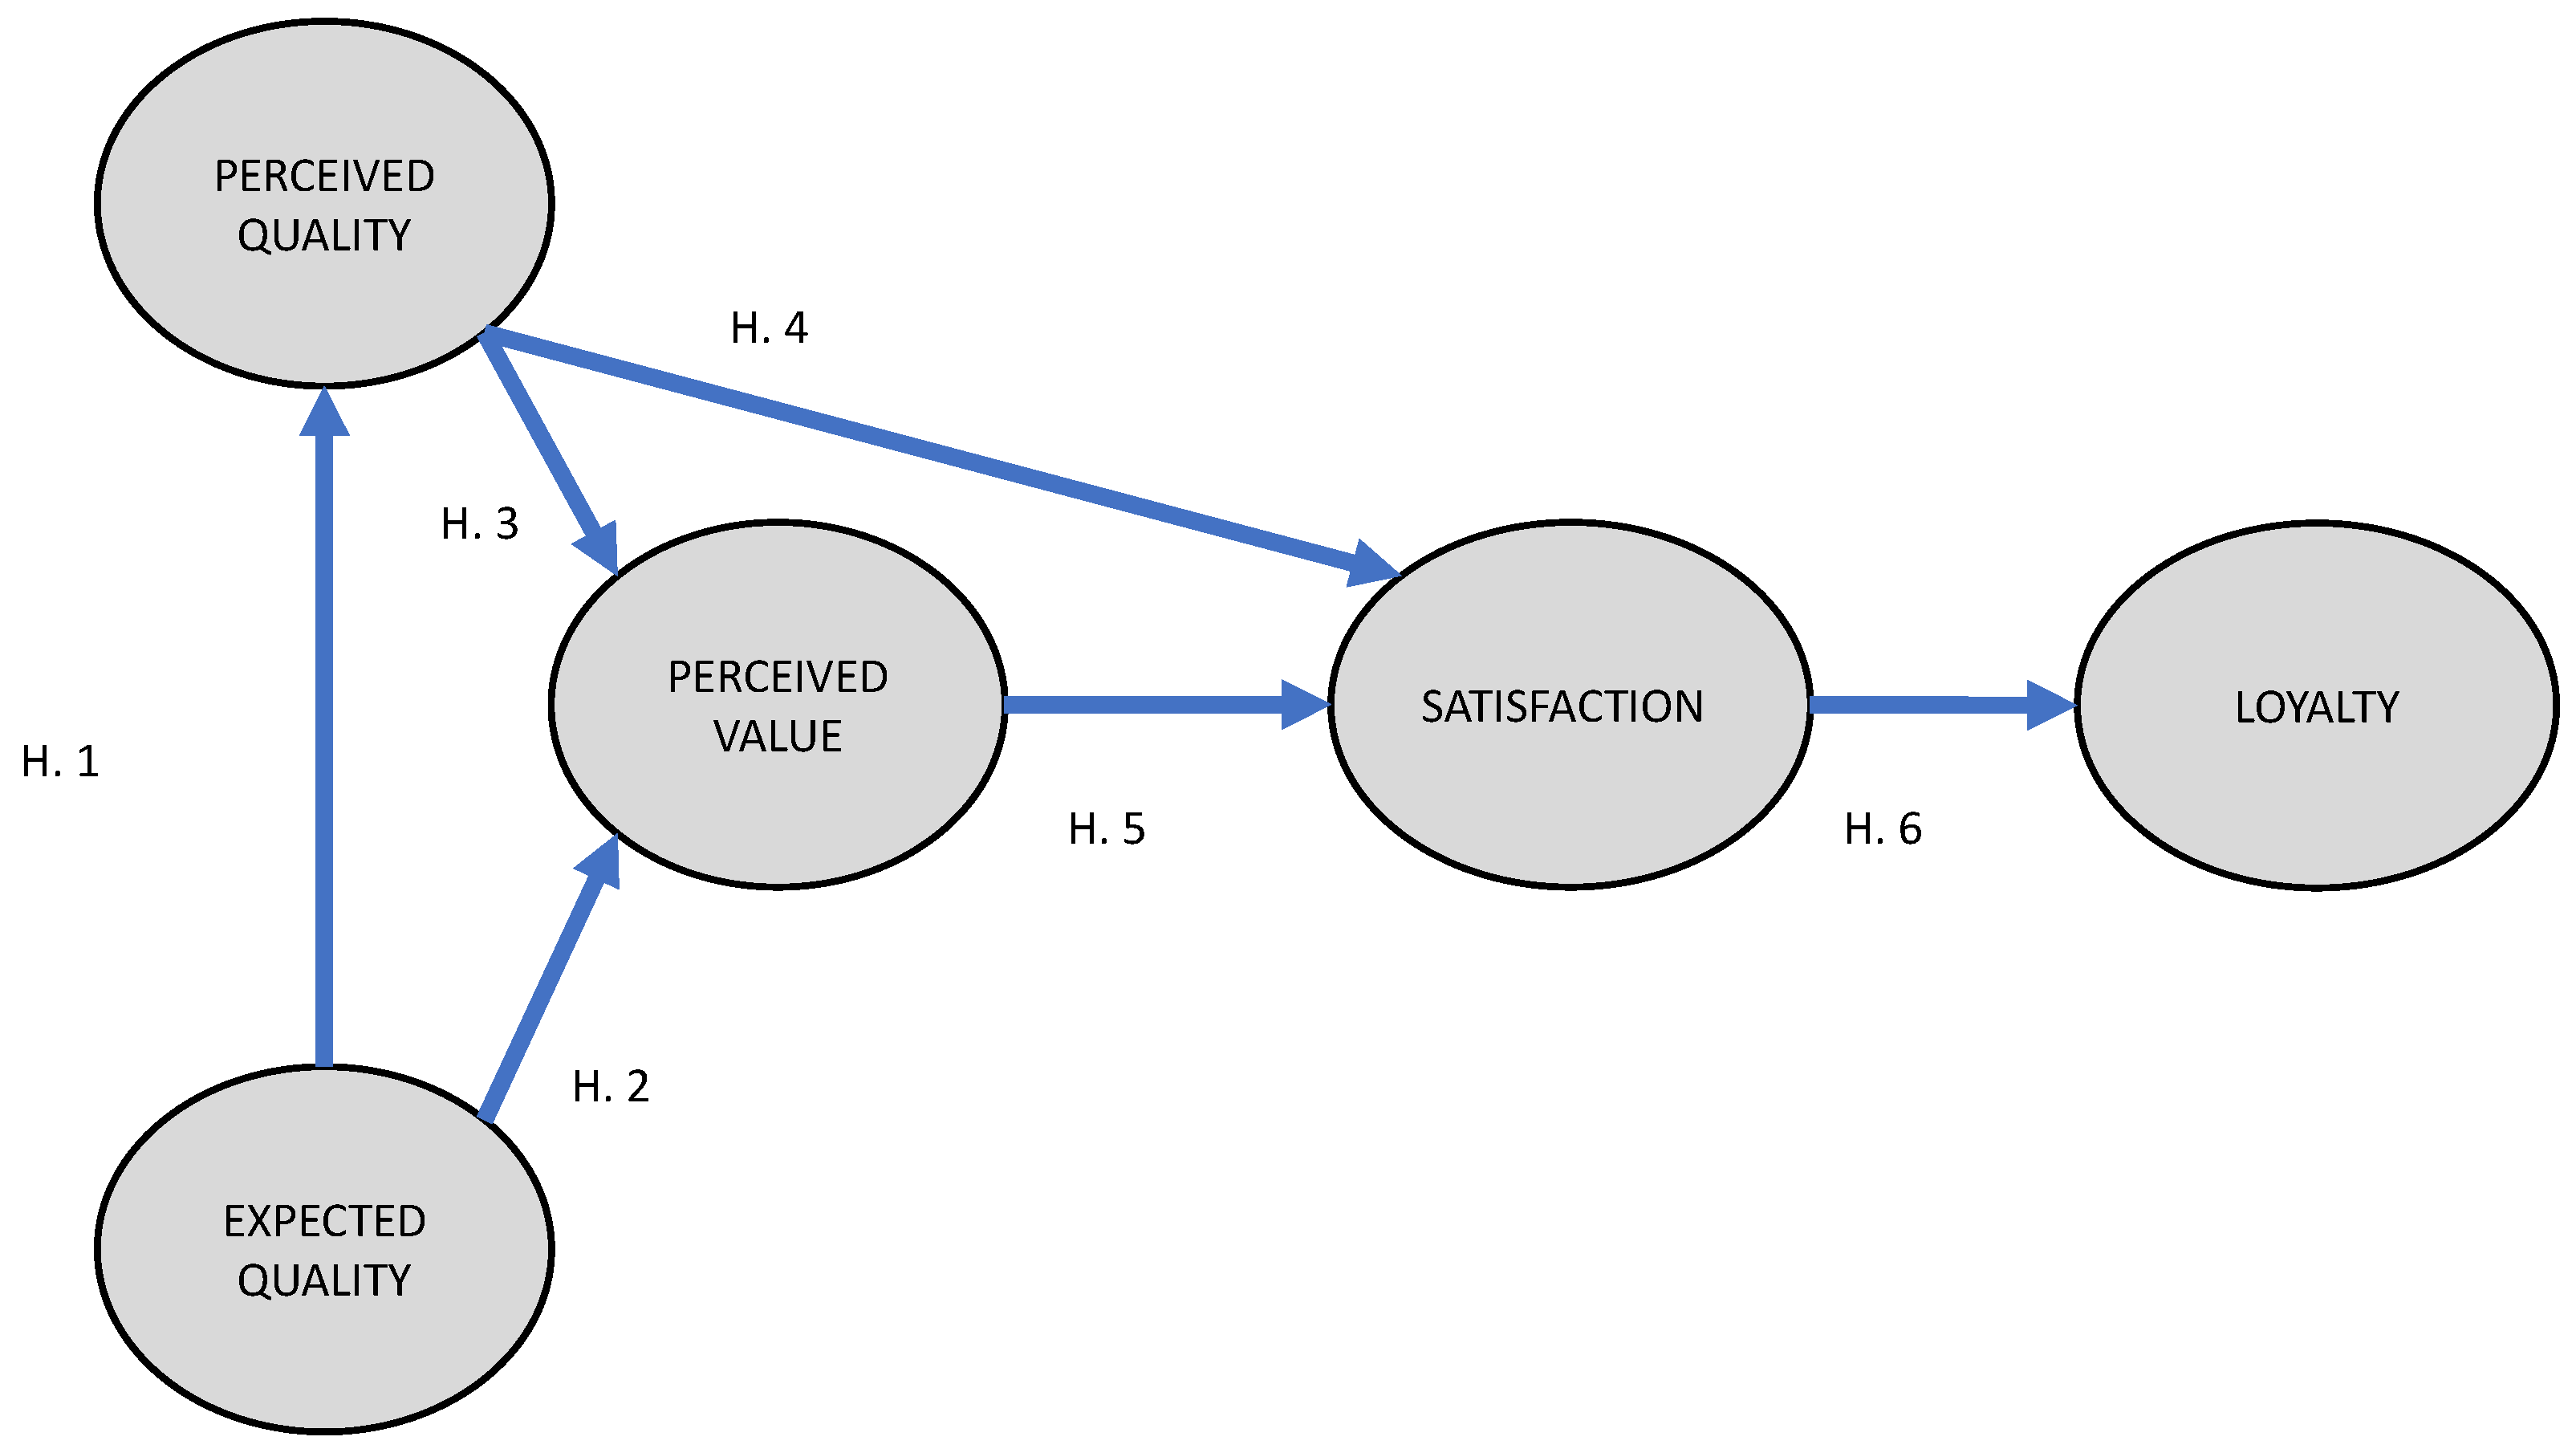
| Reference | Dimension | Indicators |
|---|---|---|
| (EQC1) City prestige expectations, (EQC2) City cultural wealth expectations, (EQC3) City leisure offer expectations, (EQC4) Hospitality/treatment expectations, (EQC5) City cultural activities and entertainment expectations, (EQC6) City overcrowding expectations, (EQC7) Expectations for commercial supply, (EQC8) Expectations for waiting time for monuments, (EQSUC1) Expectations for information and signage, (EQSUC2) Expectations for safety in general, (EQSUC3) Expectations for urban cleaning, (EQSUC4) Expectations for urban environment conservation, (EQTHR1) Expectations of catering on offer, (EQTHR2) Expectations of gastronomic richness, (EQTHR3) Expectations of quality of the restaurant service, (EQTHR4) Expectations of accommodation on offer, (EQTHR5) Expectations of quality of service of accommodation, (EQTHR6) Expectations of communications to reach the city, (EQTHR7) Expectations of communications in the city | ||
| [78,79,80,81] | Expectative quality (EQ) | |
| [25,31,82,83,84,85] | Satisfaction (S) | (S1) Satisfaction of stay in the city, (S2) Satisfaction meets expectations, (S3) Satisfaction of professional hospitality and catering treatment, (S4) Satisfaction of cultural heritage, (S5) Satisfaction of gastronomy offer, (S6) Satisfaction of professional hotel treatment, (S7) Satisfaction with cultural experience, (S8) Satisfaction with gastronomic experience, (S9) General satisfaction with city visit |
| [86,87,88,89] | Loyalty (L) | (L1) Loyalty would recommend friends, (L2) Loyalty would recommend family, (L3) Loyalty information about the city, (L4) Loyalty would return on the next vacation, (L5) Loyalty would return in the short term, (L6) Loyalty would return in the long term. |
| [90,91,92] | (PQC1) Perception of city prestige, (PQC2) Perception of city cultural richness, (PQC3) Perception of city leisure offer, (PQC4) Perception of hospitality/treatment, (PQC5) Perception of cultural activities and city shows, (PQC6) Perception of city overcrowding, (PQC7) Perception of commercial outlets on offer, (PQC8) Perception of waiting time for monuments, (PQSUC1) Perception of information and signage, (PQSUC2) Perception of security in general, (PQSUC3) Perception of urban cleanliness, (PQSUC4) Perception of conservation of urban environment, (PQTHR1) Perception of the catering on offer, (PQTHR2) Perception of gastronomic wealth, (PQTHR3) Perception of the quality of the restaurant service, (PQTHR4) Perception of the accommodation on offer, (PQTHR5) Perception of the quality of the service of accommodation, (PQTHR6) Perception of communications reaching the city, (PQTHR7) Perception of communications in the city. | |
| Perceived quality (PQ) | ||
| [93,94,95,96] | Perceived value (PV) | (PV1) Perceived value of the leisure on offer, (PV2) Perceived value of cultural activities, (PV3) Perceived value of the commercial outlets on offer, (PV4) Perceived value of conservation of monuments, (PV5) Perceived value of the restoration, (PV6) Perceived value of the accommodation on offer, (PV7) Perceived value of communications to get to the city, (PV8) Perceived value of communications in the city |
| Variable | Category | Absolute Frequency | Percentage |
|---|---|---|---|
| Sex (n = 428) | Male | 166 | 38.8 |
| Female | 262 | 61.2 | |
| Age (n = 428) | [less than 30] | 228 | 53.3 |
| [30,31,32,33,34,35,36,37,38,39] | 62 | 14.5 | |
| [40,41,42,43,44,45,46,47,48,49] | 68 | 15.9 | |
| [50,51,52,53,54,55,56,57,58,59] | 56 | 13.1 | |
| 60 or more | 14 | 3.3 | |
| Studies (n = 428) | No studies | 5 | 1.2 |
| Junior school | 35 | 8.2 | |
| Secondary school | 124 | 38.3 | |
| University | 264 | 61.7 |
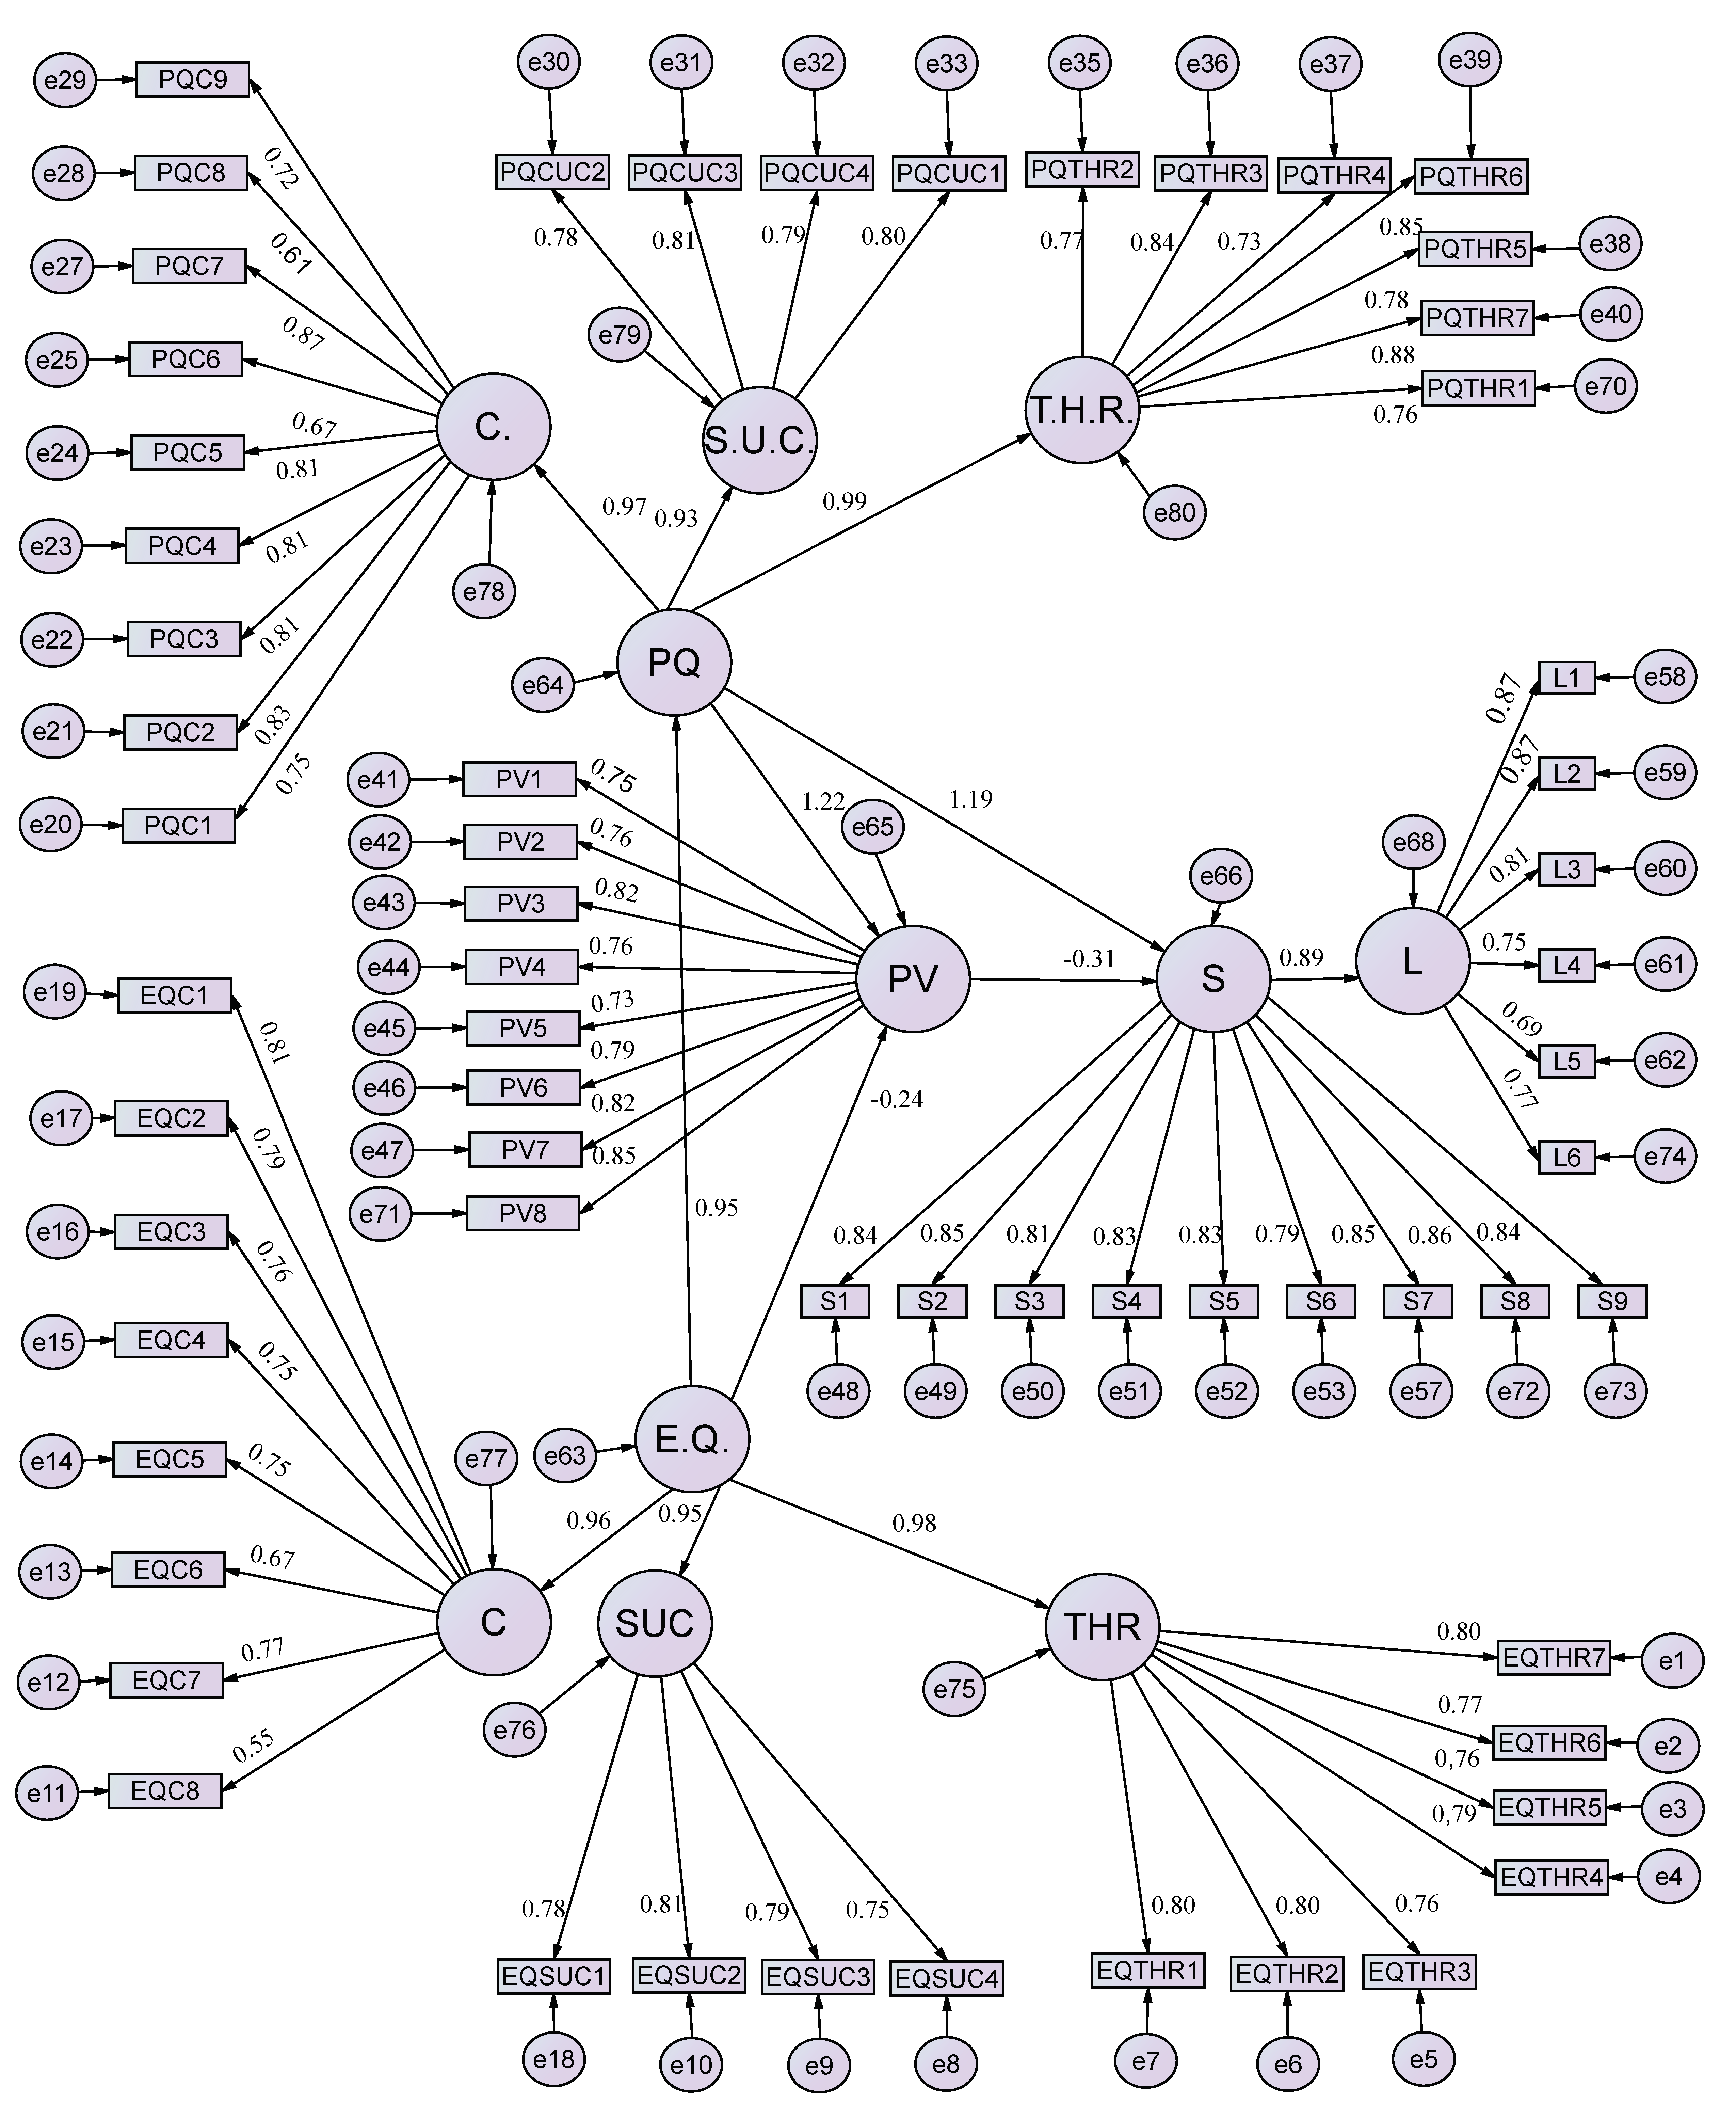
| Latent Variable | Observed Variable | Standardized Coefficient | p-Value |
|---|---|---|---|
| EXPECTATIVE QUALITY | (EQC1) Prestige expectations of the city | 0.806 | *** |
| (EQC2) Expectations of cultural wealth of the city | 0.786 | *** | |
| (EQC3) City leisure offer expectations | 0.760 | *** | |
| (EQC4) Expectations hospitality/treatment | 0.746 | *** | |
| (EQC5) Expectations for cultural activities and city shows | 0.750 | *** | |
| (EQC6) Expectations of degree of overcrowding in city | 0.675 | *** | |
| (EQC7) Expectations of commercial outlets on offer | 0.767 | *** | |
| (EQC8) Expectations of waiting time for monuments | 0.552 | *** | |
| (EQSUC1) Information and signaling expectations | 0.782 | *** | |
| (EQSUC2) General safety expectations | 0.815 | *** | |
| (EQSUC3) Expectations of urban cleaning | 0.794 | *** | |
| (EQSUC4) Expectations of conservation urban environment | 0.754 | *** | |
| (EQTHR1) Expectations for catering on offer | 0.804 | *** | |
| (EQTHR2) Expectations for gastronomic richness | 0.797 | *** | |
| (EQTHR3) Expectations of quality of service restoration | 0.758 | *** | |
| (EQTHR4) Expectations of accommodation on offer | 0.787 | *** | |
| (EQTHR5) Expectations of quality service accommodation on offer | 0.761 | *** | |
| (EQTHR6) Expectations of communications to reach the city | 0.770 | *** | |
| (EQTHR7) Communications expectations in the city | 0.797 | *** | |
| LOYALTY | (L1) Loyalty I would recommend to friends | 0.868 | *** |
| (L2) Loyalty I would recommend to family | 0.872 | *** | |
| (L3) Loyalty city information | 0.814 | *** | |
| (L4) Loyalty would return on the next vacation | 0.745 | *** | |
| (L5) Loyalty would return in the short term | 0.689 | *** | |
| (L6) Loyalty would return in the long run. | 0.766 | *** | |
| PERCEVED QUALITY | (PQC1) Prestige perception of the city | 0.832 | *** |
| (PQC2) Perception of cultural wealth of the city | 0.748 | *** | |
| (PQC3) Perception of city leisure offer | 0.810 | *** | |
| (PQC4) Hospitality/treatment perception | 0.811 | *** | |
| (PQC5) Perception of cultural activities and city shows | 0.808 | *** | |
| (PQC6) City overcrowding degree perception | 0.681 | *** | |
| (PQC7) Perception of commercial outlets on offer | 0.823 | *** | |
| (PQC8) Perception of waiting time for monuments | 0.611 | *** | |
| (PQC9) Perception of conservation of monuments | 0.780 | *** | |
| (PQSUC1) Information perception and signaling | 0.810 | *** | |
| (PQSUC2) Perception of safety in general | 0.793 | *** | |
| (PQSUC3) Perception of urban cleaning | 0.765 | *** | |
| (PQSUC4) Perception of urban environment conservation | 0.843 | *** | |
| (PQTHR1) Perception of catering on offer | 0.725 | *** | |
| (PQTHR2) Perception of gastronomic wealth | 0.776 | *** | |
| (PQTHR3) Perception of quality of restaurant service | 0.848 | *** | |
| (PQTHR4) Perception of accommodation on offer | 0.879 | *** | |
| (PQTHR5) Perception of quality of service of accommodation on offer | 0.759 | *** | |
| (PQTHR6) Perception of communications to reach the city | 0.716 | *** | |
| (PQTHR7) Perception of communications in the city | 0.804 | *** | |
| PERCEVED VALUE | (PV1) Perceived value leisure on offer | 0.758 | *** |
| (PV2) Perceived value cultural activities | 0.751 | *** | |
| (PV3) Perceived value commercial outlets on offer | 0.823 | *** | |
| (PV4) Perceived value conservation of monuments | 0.756 | *** | |
| (PV5) Perceived value restaurants on offer | 0.734 | *** | |
| (PV6) Perceived value accommodation on offer | 0.790 | *** | |
| (PV7) Perceived value of communications to get to the city | 0.824 | *** | |
| (PV8) Perceived value of communications in the city | 0.854 | *** | |
| SATISFACTION | (S1) Satisfaction of stay in the city | 0.835 | *** |
| (S2) Satisfaction meets expectations | 0.852 | *** | |
| (S3) Satisfaction of professional hospitality and restaurant treatment | 0.811 | *** | |
| (S4) Satisfaction of cultural heritage | 0.826 | *** | |
| (S5) Satisfaction of gastronomy on offer | 0.827 | *** | |
| (S6) Satisfaction of professional hotel treatment | 0.794 | *** | |
| (S7) Satisfaction of cultural experience | 0.855 | *** | |
| (S8) Satisfaction of gastronomic experience | 0.858 | *** | |
| (S9) General satisfaction of visit to the city | 0.835 | *** |
| Observed Variable | Weighting |
|---|---|
| L1 | 0.813 |
| L2 | 0.846 |
| L3 | 0.765 |
| L4 | 0.819 |
| L5 | 0.860 |
| L6 | 0.687 |
| Variable | Weighting |
|---|---|
| S1 | 0.689 |
| S2 | 0.678 |
| S3 | 0.624 |
| S4 | 0.682 |
| S5 | 0.684 |
| S6 | 0.582 |
| S7 | 0.739 |
| S8 | 0.700 |
| S9 | 0.687 |
| EQC1 | 0.605 |
| EQC2 | 0.575 |
| EQC3 | 0.671 |
| EQC4 | 0.462 |
| EQC5 | 0.610 |
| EQC6 | 0.679 |
| EQC7 | 0.562 |
| EQC8 | 0.502 |
| EQSUC1 | 0.583 |
| EQSUC2 | 0.581 |
| EQSUC3 | 0.540 |
| EQSUC4 | 0.657 |
| EQTHR1 | 0.622 |
| EQTHR2 | 0.613 |
| EQTHR3 | 0.567 |
| EQTHR4 | 0.577 |
| EQTHR5 | 0.503 |
| EQTHR6 | 0.507 |
| EQTHR7 | 0.511 |
| EQTHR8 | 0.548 |
| PV1 | 0.568 |
| PV2 | 0.535 |
| PV3 | 0.558 |
| PV4 | 0.480 |
| PV5 | 0.456 |
| PV6 | 0.488 |
| PV7 | 0.568 |
| PV8 | 0.523 |
| PQC1 | 0.585 |
| PQC2 | 0.683 |
| PQC3 | 0.626 |
| PQC4 | 0.587 |
| PQC5 | 0.632 |
| PQC6 | 0.530 |
| PQC7 | 0.580 |
| PQC8 | 0.327 |
| PQC9 | 0.433 |
| PQCUC1 | 0.515 |
| PQCUC2 | 0.464 |
| PQCUC3 | 0.583 |
| PQCUC4 | 0.615 |
| PQTHR1 | 0.499 |
| PQTHR2 | 0.685 |
| PQTHR3 | 0.642 |
| PQTHR4 | 0.482 |
| PQTHR5 | 0.507 |
| PQTHR6 | 0.513 |
| PQTHR7 | 0.491 |
| Construct | Composite Reliability | Cronbach’s Alpha | |
|---|---|---|---|
| L | Loyalty | n/a | 0.859 |
| S | Satisfaction | 0.705 | 0.939 |
| EQ | Expected quality | 0.703 | 0.936 |
| PV | Perceived value | 0.716 | 0.869 |
| PQ | Perceived quality | 0.701 | 0.930 |
| Construct | Average Variance Extracted (AVE) | |
|---|---|---|
| L | Loyalty | n/a |
| S | Satisfaction | 0.586 |
| EQ | Expectative quality | 0.643 |
| PV | Perceved value | 0.620 |
| PQ | Perceved quality | 0.693 |
| Goodness-of-Fit Measurement | Value |
|---|---|
| Absolute Fit | |
| Chi-squared/DF | 1.852 |
| GFI | 0.745 |
| RMSEA | 0.045 |
| RMR | 0.132 |
| Incremental Fit | |
| AGFI | 0.727 |
| Parsimony Fit | |
| PNFI | 0.119 |
| PCFI | 0.200 |
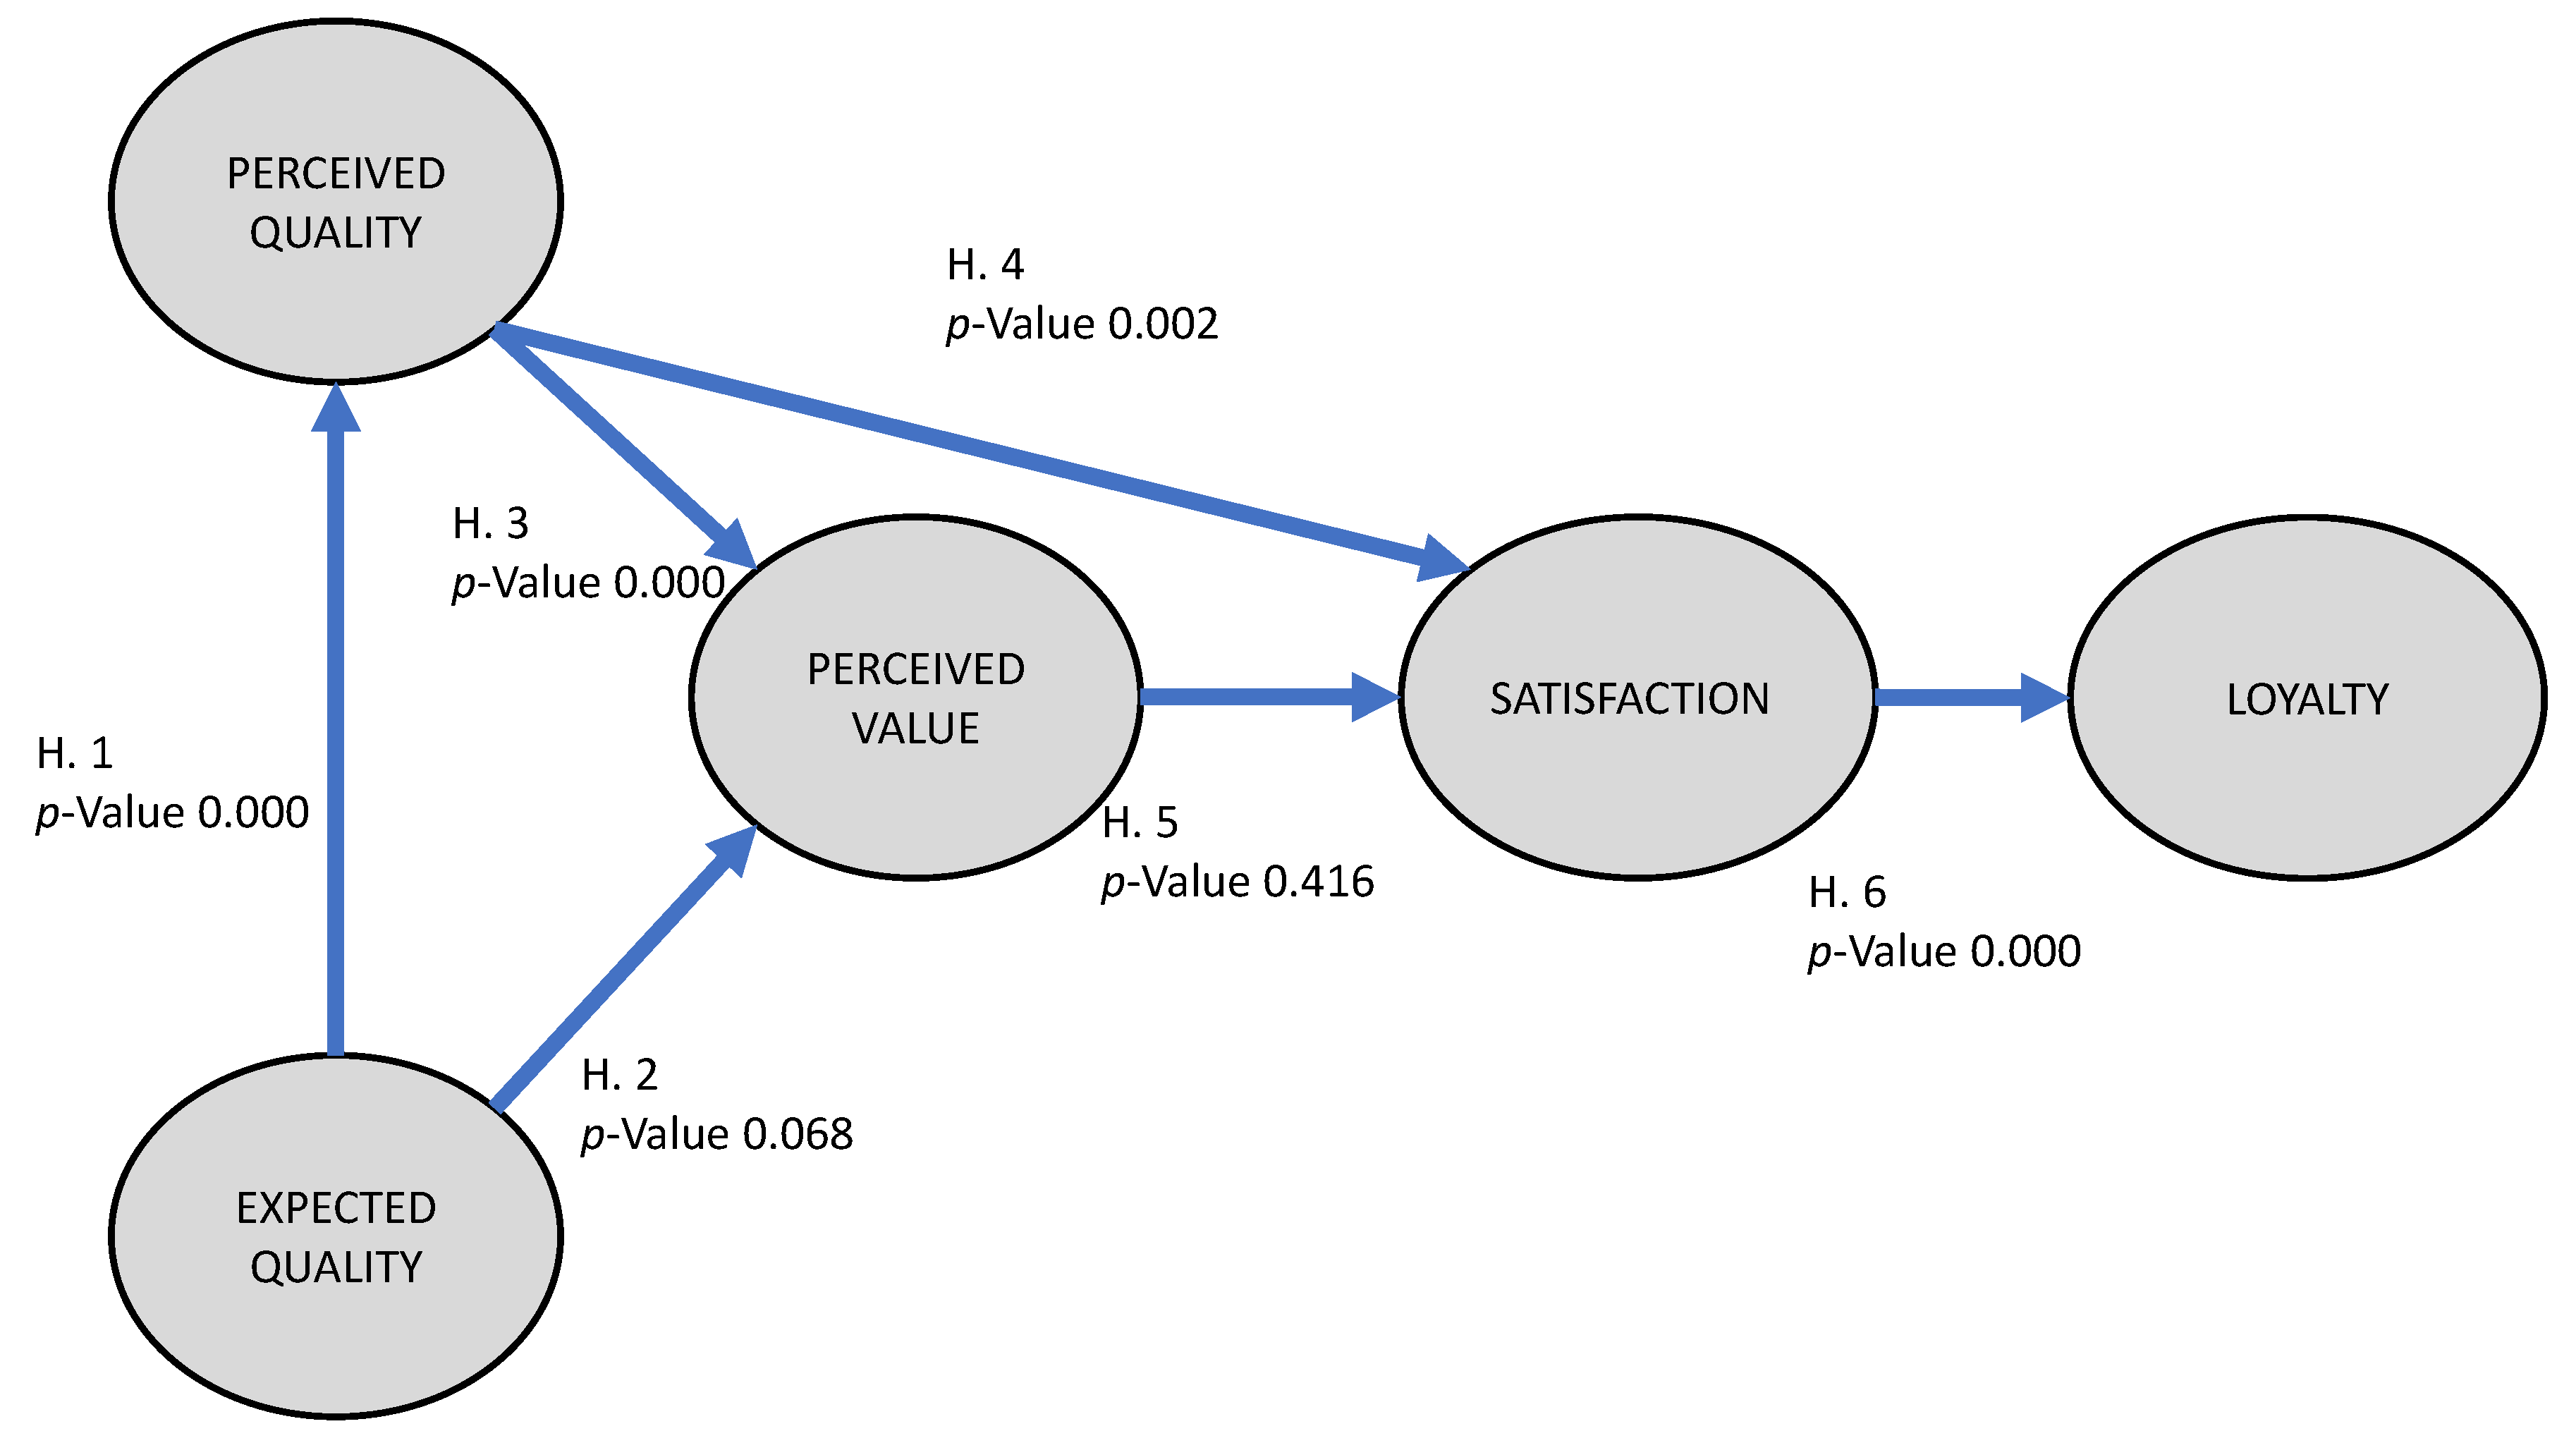
| Hypothesis | Effect | Path Coefficient | p-Value | Supported? |
|---|---|---|---|---|
| H1: Expected quality–perceived quality | + | 0.868 | 0.000 *** | YES |
| H2: Expected quality–perceived value | − | 0.253 | 0.068 * | YES |
| H3: Perceived quality–perceived value | + | 1.387 | 0.000 *** | YES |
| H4: Perceived quality–satisfaction | + | 1.377 | 0.002 ** | YES |
| H5: Perceived value–satisfaction | − | −0.315 | 0.416 | NO |
| H6: Satisfaction–loyalty | + | 0.896 | 0.000 *** | YES |
Publisher’s Note: MDPI stays neutral with regard to jurisdictional claims in published maps and institutional affiliations. |
© 2020 by the authors. Licensee MDPI, Basel, Switzerland. This article is an open access article distributed under the terms and conditions of the Creative Commons Attribution (CC BY) license (http://creativecommons.org/licenses/by/4.0/).
Share and Cite
Jimber del Río, J.A.; Hernández-Rojas, R.D.; Vergara-Romero, A.; Dancausa Millán, M.G.D. Loyalty in Heritage Tourism: The Case of Córdoba and Its Four World Heritage Sites. Int. J. Environ. Res. Public Health 2020, 17, 8950. https://doi.org/10.3390/ijerph17238950
Jimber del Río JA, Hernández-Rojas RD, Vergara-Romero A, Dancausa Millán MGD. Loyalty in Heritage Tourism: The Case of Córdoba and Its Four World Heritage Sites. International Journal of Environmental Research and Public Health. 2020; 17(23):8950. https://doi.org/10.3390/ijerph17238950
Chicago/Turabian StyleJimber del Río, Juan Antonio, Ricardo D. Hernández-Rojas, Arnaldo Vergara-Romero, and Mª Genoveva Dancausa Dancausa Millán. 2020. "Loyalty in Heritage Tourism: The Case of Córdoba and Its Four World Heritage Sites" International Journal of Environmental Research and Public Health 17, no. 23: 8950. https://doi.org/10.3390/ijerph17238950