Causation Analysis of Hazardous Material Road Transportation Accidents Based on the Ordered Logit Regression Model
Abstract
:1. Introduction
2. Literature Review
2.1. Accident Data Analysis and Modeling
2.2. Risk Assessment Related the Transport of Hazardous Materials
2.3. Safety Measures Related to Reducing Accident Risk
3. Data Sources and Accident Distribution Characteristics
3.1. Data Source
3.2. Analysis of Statistical Distribution Characteristics of Road Traffic Accidents of Hazardous Materials
3.2.1. Types Distribution of Transport Accidents
3.2.2. Month Distribution of Transportation Accidents
3.2.3. Time Distribution of Transportation Accidents
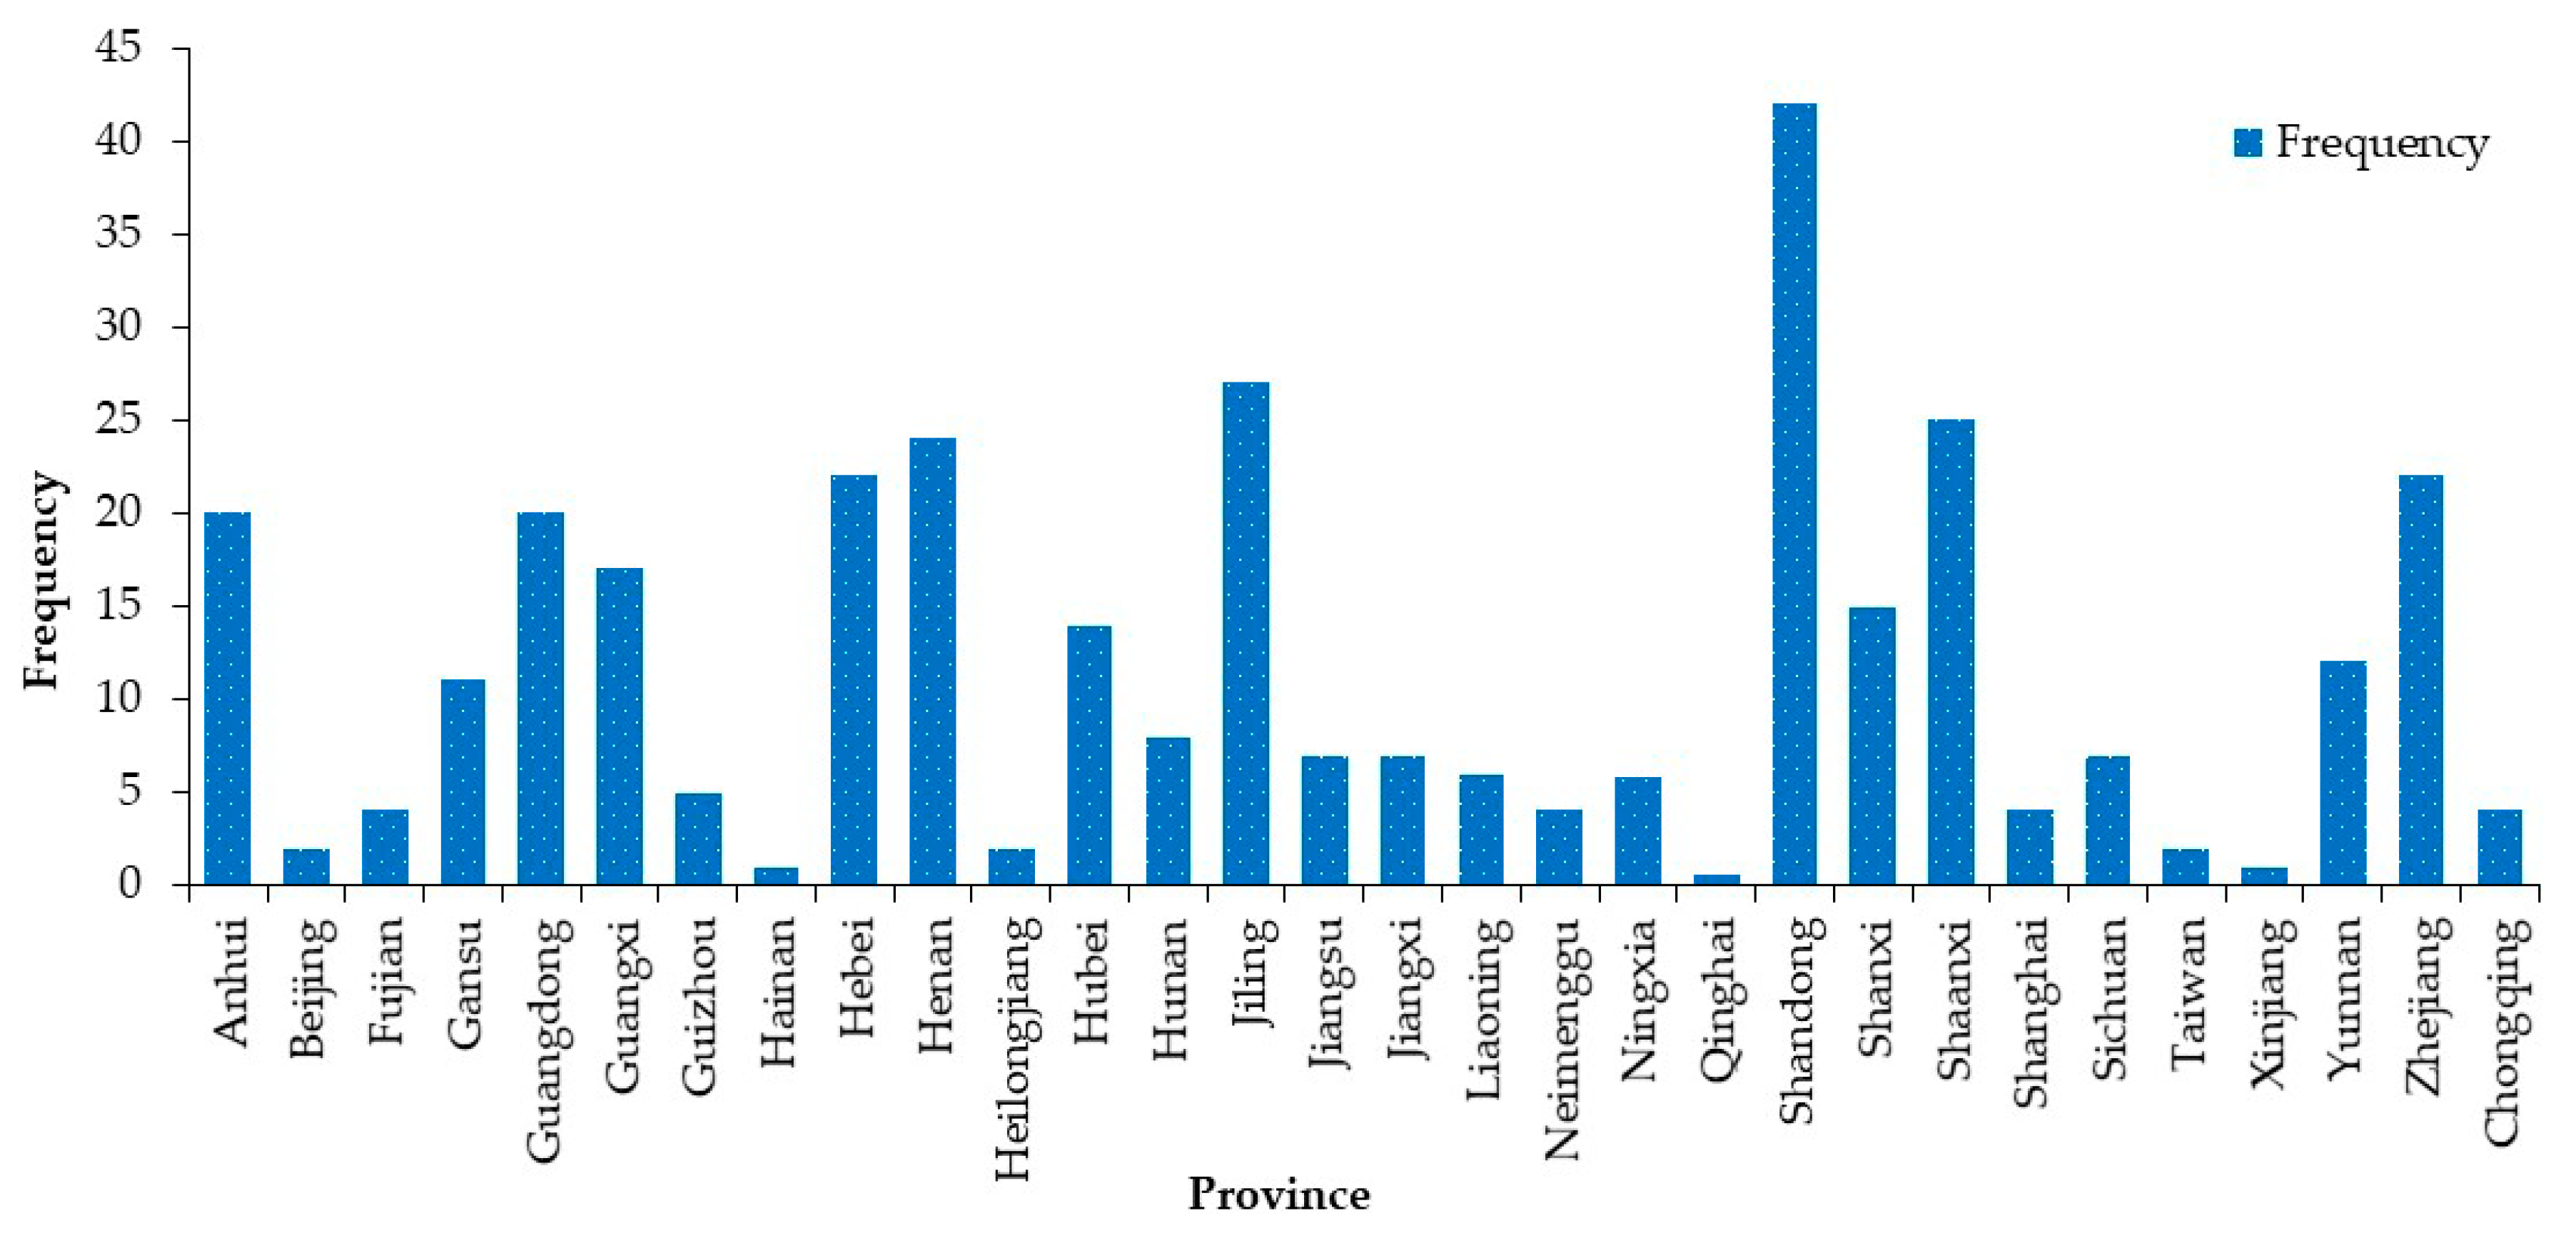
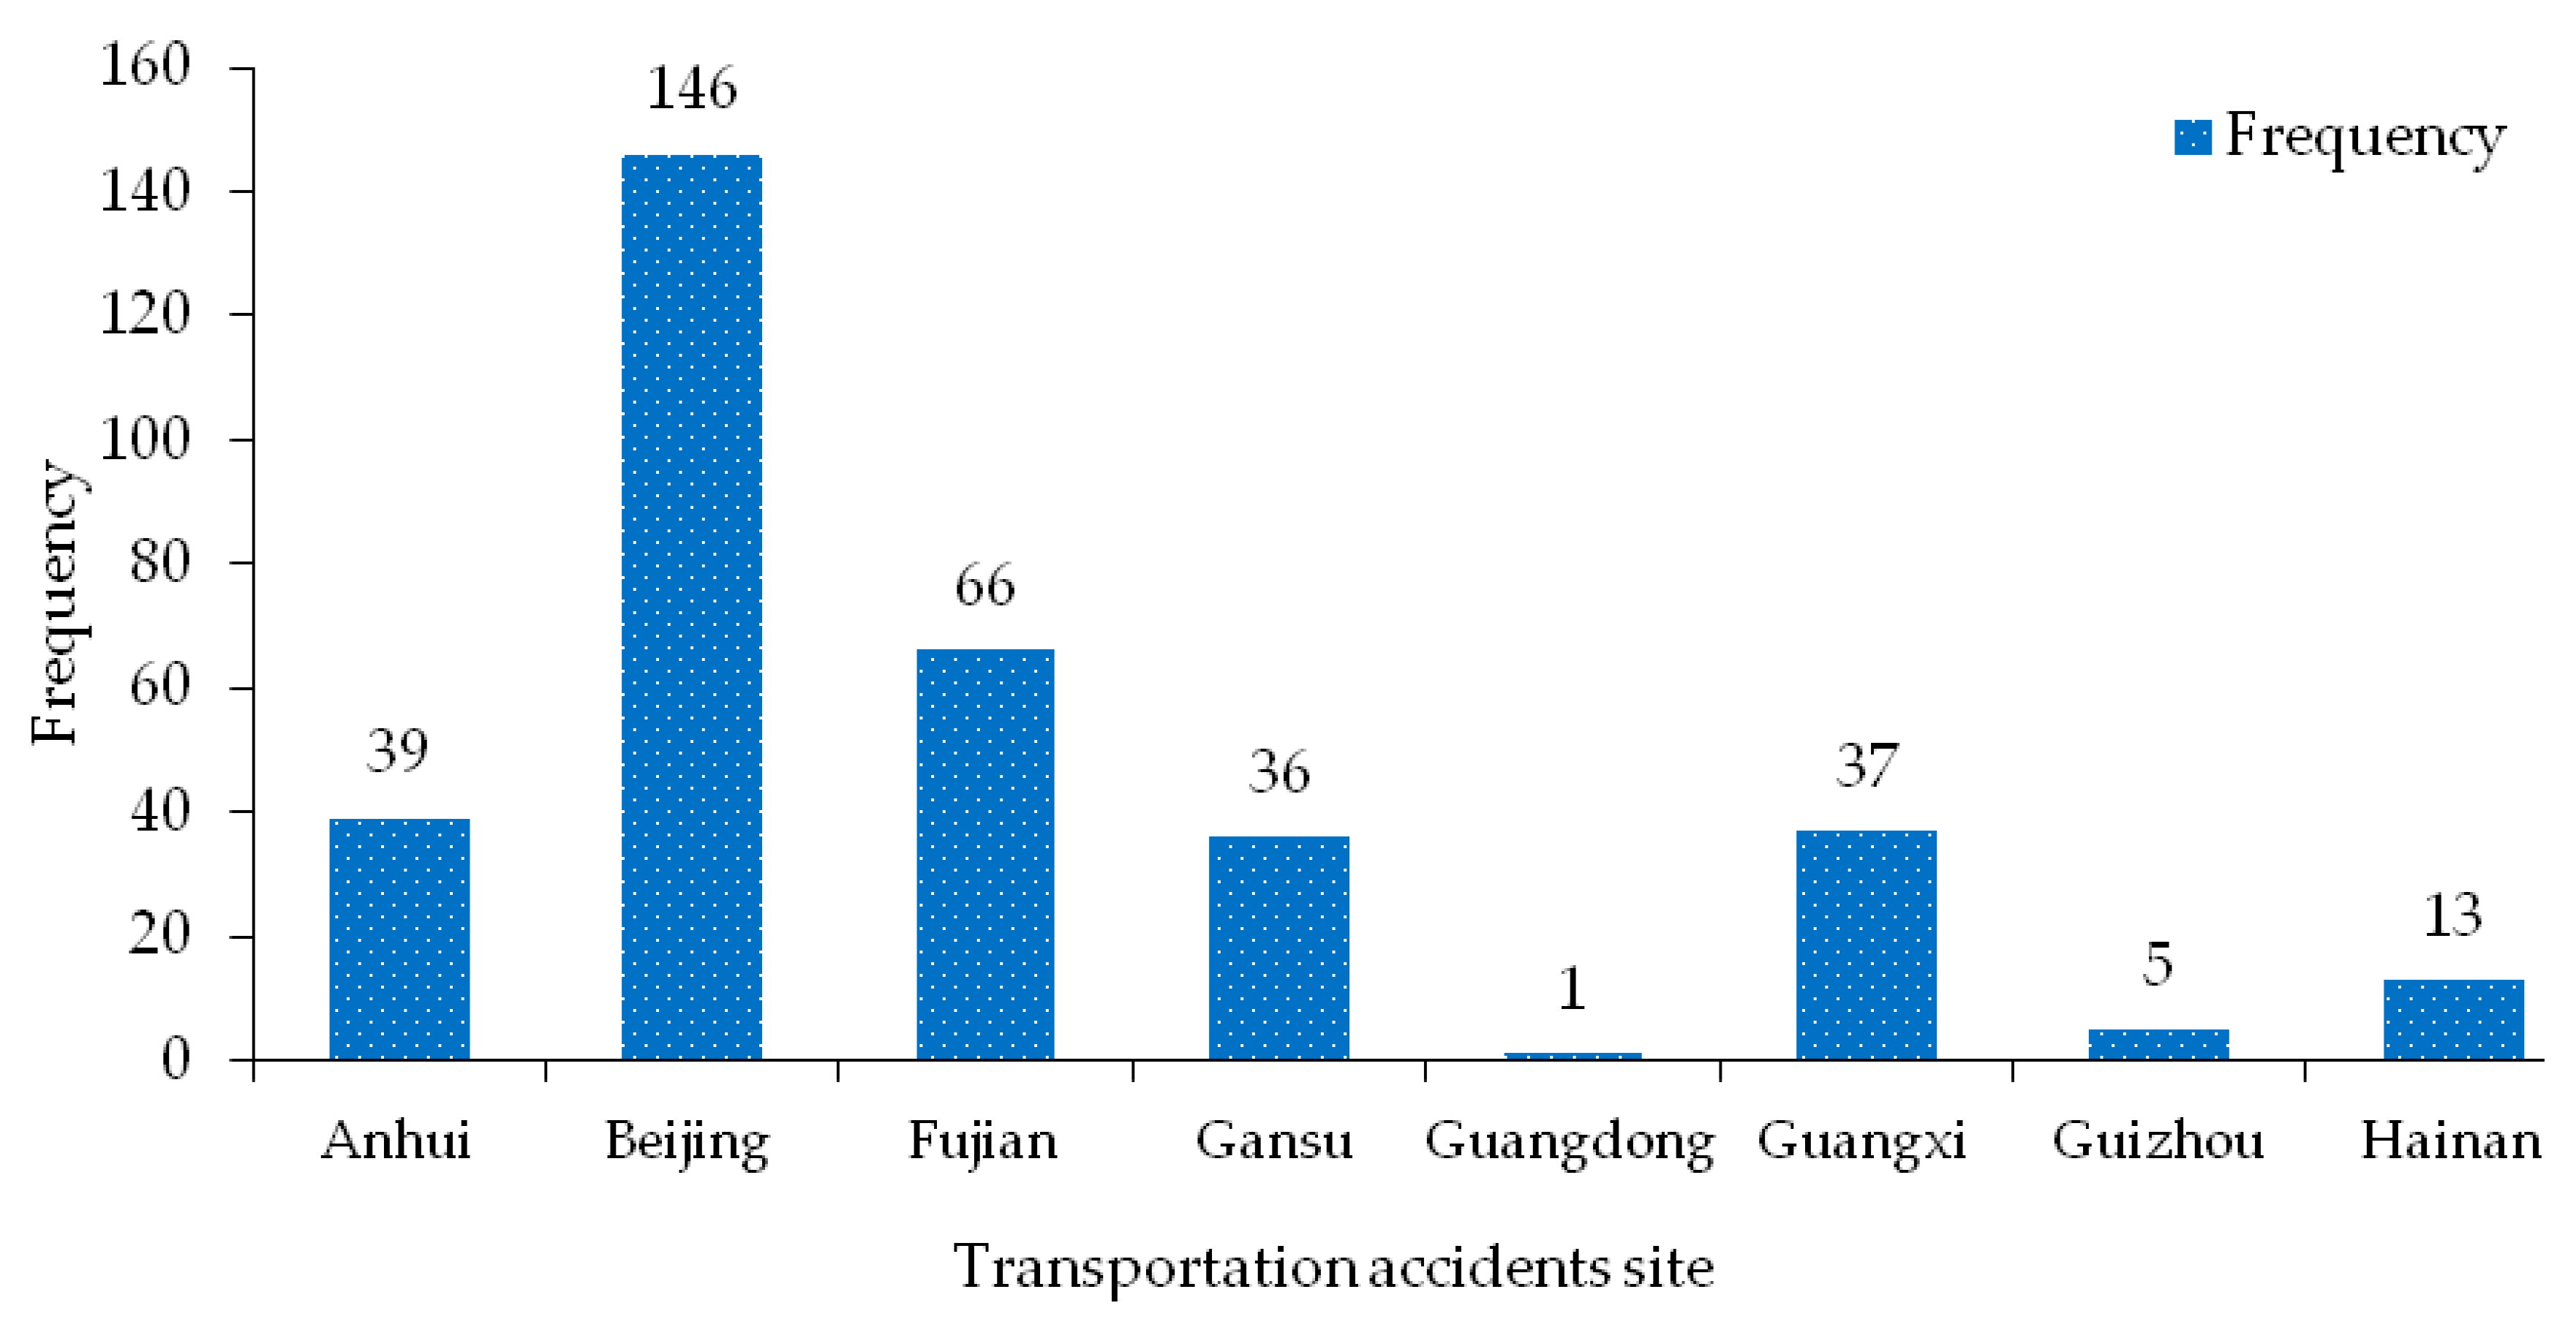
3.2.4. Regional Distribution of Transportation Accidents
3.2.5. Vehicle Category Distribution of Transportation Accidents
3.2.6. Road Distribution of Transportation Accidents
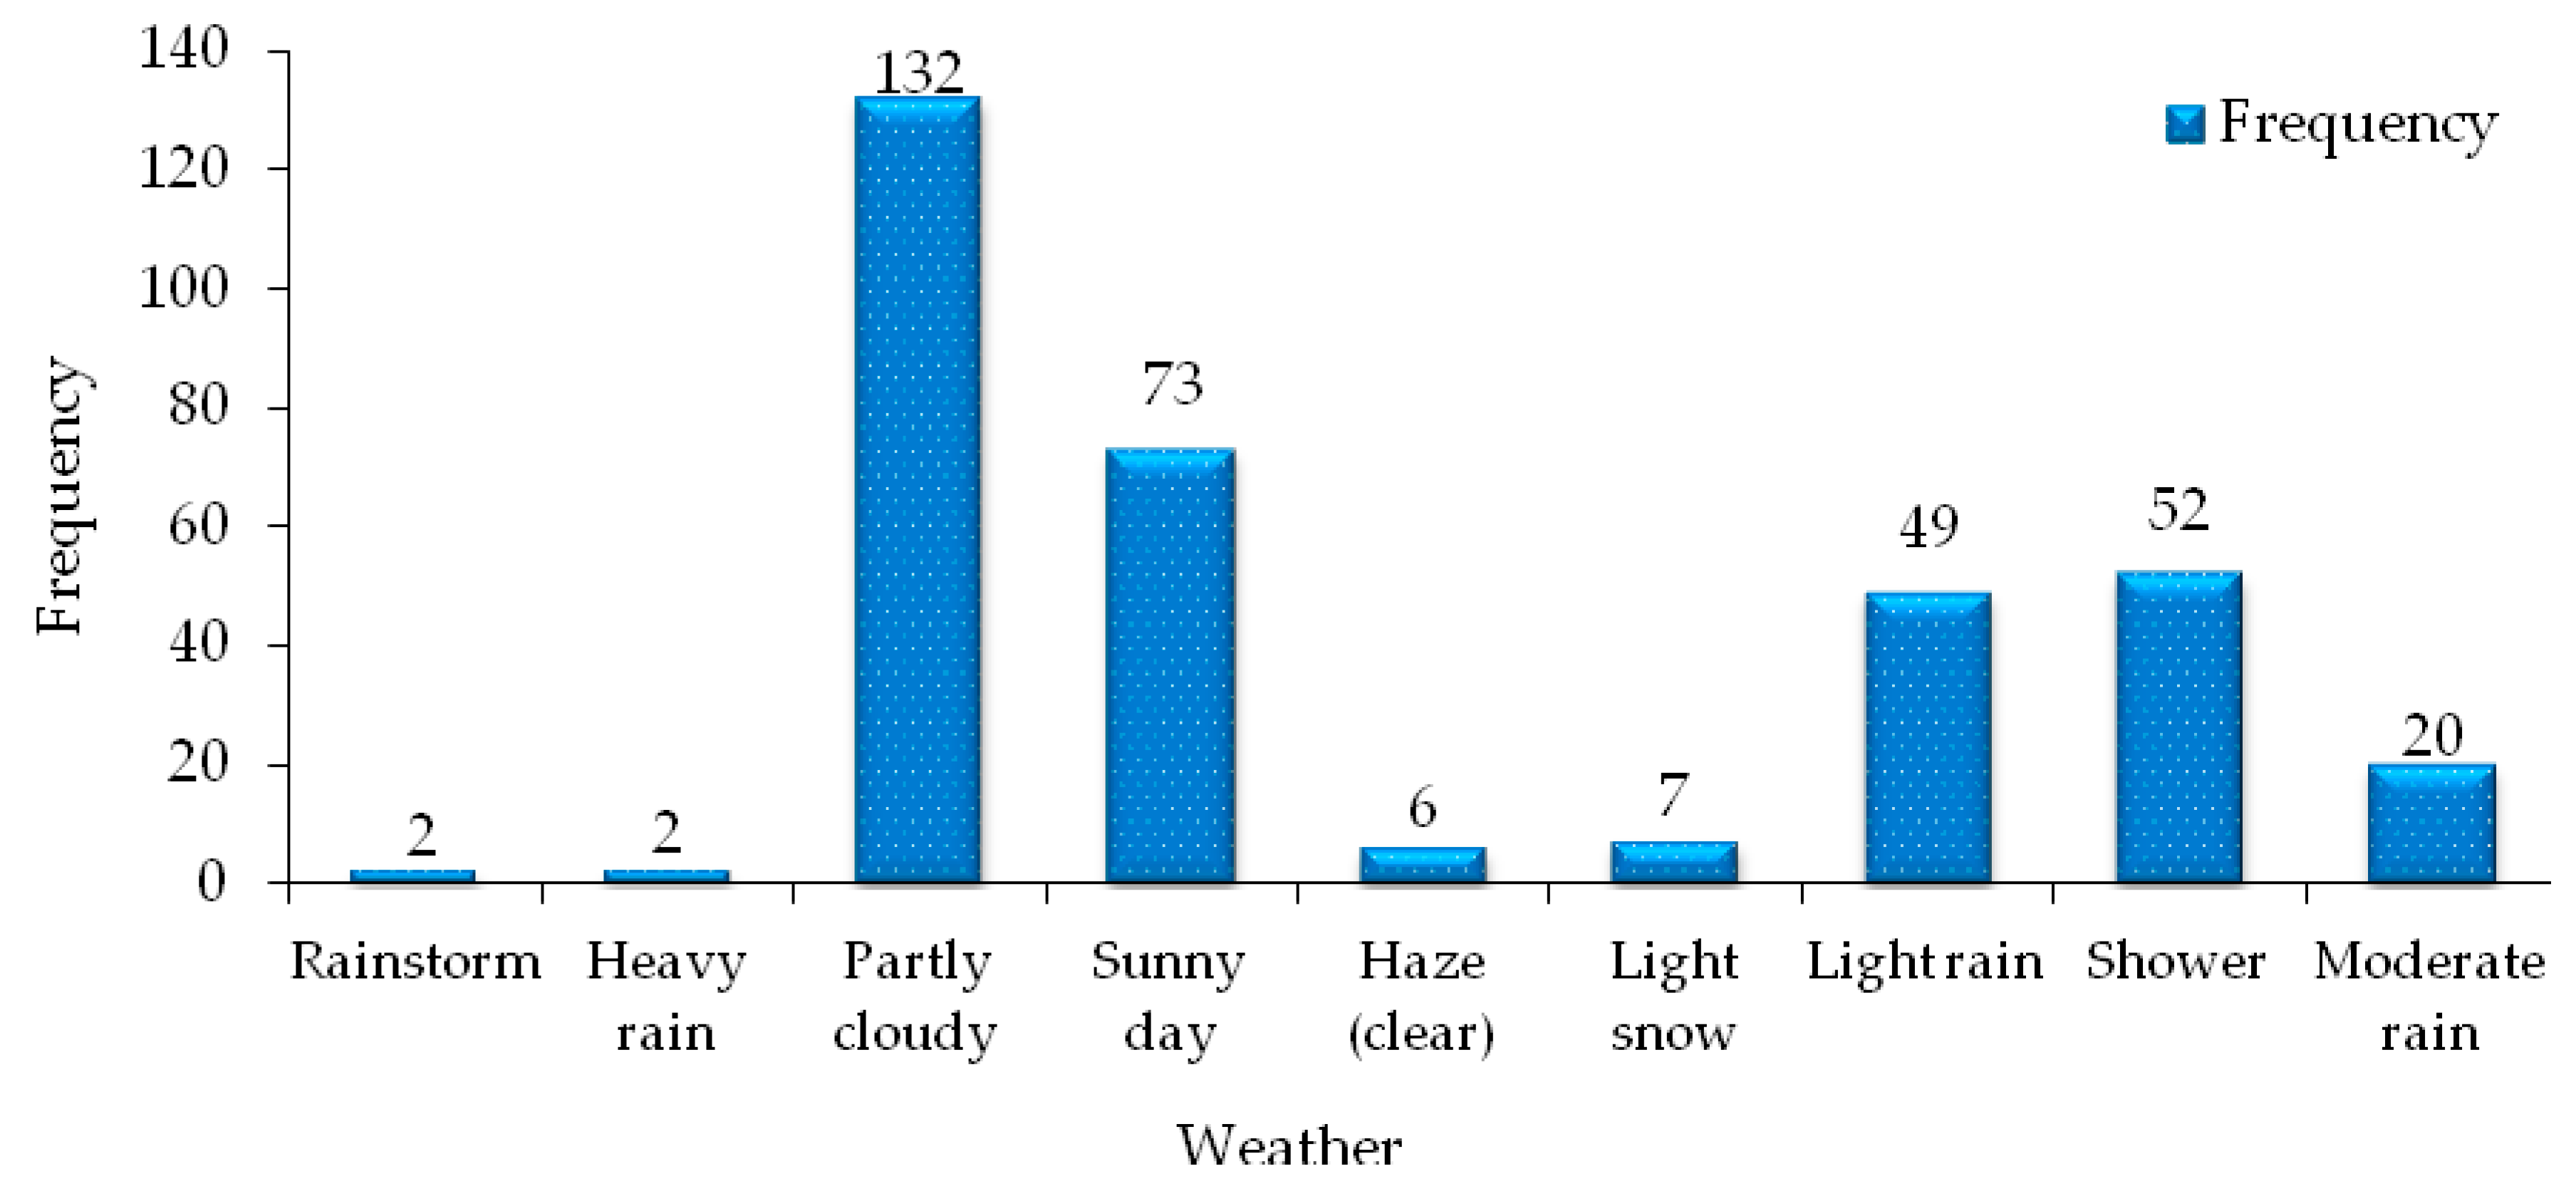
3.2.7. Weather Distribution of Transportation Accidents
4. Analysis of Factors Influencing the Severity of Road Hazardous Materials Transportation Accidents
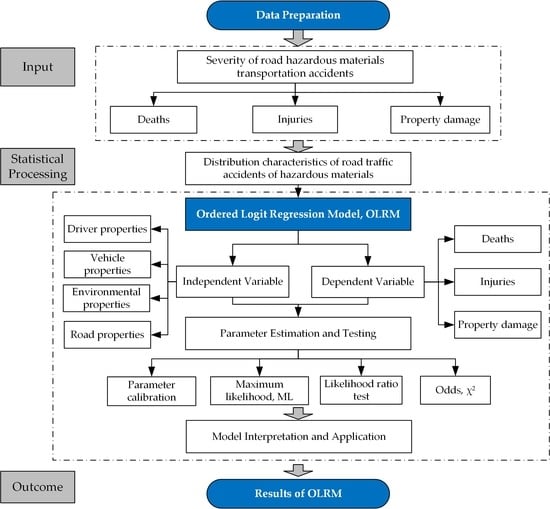
4.1. Data Preparation
4.2. Analysis of Influencing Factors
4.3. Univariate Analysis of the Influence on the Severity of the Accident
4.4. Parameter Calibration and Elastic Analysis
5. Analysis of Factors Affecting Accident Severity
5.1. Behavior Attributes Analysis of Hazardous Materials Driver
5.2. Vehicle Attributes Analysis of Hazardous Materials Transportation Accident
5.3. Environmental Attributes Analysis of Hazardous Materials Transportation Accidents
5.4. Road Attributes Analysis of Hazardous Materials Transportation Accidents
6. Conclusions and Suggestions
6.1. Conclusions
6.2. Suggestions
6.3. Future Study
Author Contributions
Funding
Conflicts of Interest
References
- Ma, C.; Hao, W.; Pan, F.; Xiang, W. Road screening and distribution route multi-objective robust optimization for hazardous materials based on neural network and genetic algorithm. PLoS ONE 2018, 13, e0198931. [Google Scholar] [CrossRef]
- Yang, X.; Ma, C.; Zhu, C.; Qi, B.; Pan, F.; Zhu, C. Design of hazardous materials transportation safety management system under the vehicle-infrastructure connected environment. J. Intell. Connect. Veh. 2019, 2, 14–24. [Google Scholar] [CrossRef]
- Ma, C. Network optimization design of hazmat based on multi-objective genetic algorithm under the uncertain environment. Int. J. Bio Inspired Comput. 2018, 12, 236–244. [Google Scholar] [CrossRef]
- Erkut, E.; Verter, V. Modeling of transport risk for hazardous materials. Oper. Res. 1998, 46, 625–642. [Google Scholar] [CrossRef] [Green Version]
- Kara, B.; Verter, V. Designing a road network for hazardous materials transportation. Transp. Sci. 2004, 38, 188–196. [Google Scholar] [CrossRef]
- Zografos, K.; Androutsopoulos, K. A heuristic algorithm for solving hazardous materials distribution problems. Eur. J. Oper. Res. 2004, 152, 507–519. [Google Scholar] [CrossRef]
- Ma, C.; Li, Y.; He, R.; Wu, F.; Qi, B.; Ye, Q. Route optimization models and algorithms for hazardous materials transportation under different environments. Int. J. Bio Inspired Comput. 2013, 5, 252–265. [Google Scholar] [CrossRef]
- Ma, C.; Hao, W.; He, R.; Moghimi, B. A multiobjective route robust optimization model and algorithm for hazmat transportation. Discret. Dyn. Nat. Soc. 2018, 2018, 2916391. [Google Scholar] [CrossRef]
- Lozano, A.; Muñoz, Á.; Antún, J.P.; Granados, F.; Guarneros, L. Analysis of hazmat transportation accidents in congested urban areas, based on actual accidents in Mexico. Procedia Soc. Behav. Sci. 2010, 2, 6053–6064. [Google Scholar] [CrossRef] [Green Version]
- Barua, S.; El-Basyouny, K.; Islam, M. A full Bayesian multivariate count data model of collision severity with spatial correlation. Anal. Methods Accid. Res. 2014, 3, 28–43. [Google Scholar] [CrossRef]
- Mannering, F.; Shankar, V.; Bhat, C. Unobserved heterogeneity and the statistical analysis of highway accident data. Anal. Methods Accid. Res. 2016, 11, 1–16. [Google Scholar] [CrossRef]
- List, G.; Mirchandani, P.; Turnquist, M.; Zografos, K. Modeling and analysis for hazardous materials transportation: Risk analysis, routing/scheduling and facility location. Transp. Sci. 1991, 25, 100–114. [Google Scholar] [CrossRef]
- Van Raemdonck, K.; Macharis, C.; Mairesse, O. Risk analysis system for the transport of hazardous materials. J. Saf. Res. 2013, 45, 55–63. [Google Scholar] [CrossRef]
- Borowsky, A.; Shinar, D.; Oron-Gilad, T. Age, skill, and hazard perception in driving. Accid. Anal. Prev. 2010, 42, 1240–1249. [Google Scholar] [CrossRef] [Green Version]
- Ohtani, H.; Kobayashi, M. Statistical analysis of dangerous goods accidents in Japan. Saf. Sci. 2005, 43, 287–297. [Google Scholar] [CrossRef] [Green Version]
- Guo, Y.; Li, Z.; Liu, P.; Wu, Y. Modeling correlation and heterogeneity in crash rates by collision types using full Bayesian random parameters multivariate Tobit model. Accid. Anal. Prev. 2019, 128, 164–174. [Google Scholar] [CrossRef]
- Guo, Y.; Sayed, T.; Zaki, M. Evaluating the safety impacts of powered two wheelers on a shared roadway in China using automated video analysis. J. Transp. Saf. Secur. 2019, 11, 414–429. [Google Scholar] [CrossRef]
- Aguero-Valverde, J. Multivariate spatial models of excess crash frequency at area level: Case of Costa Rica. Accid. Anal. Prev. 2013, 59, 365–373. [Google Scholar] [CrossRef]
- Dulebenets, M.; Pasha, J.; Kavoosi, M.; Abioye, O.; Ozguven, E.; Moses, R.; Sando, T. Multiobjective Optimization Model for Emergency Evacuation Planning in Geographical Locations with Vulnerable Population Groups. J. Manag. Eng. 2020, 36, 04019043. [Google Scholar] [CrossRef]
- Shen, X.; Yan, Y.; Li, X.; Xie, C.; Wang, L. Analysis on tank truck accidents involved in road hazardous materials transportation in China. Traffic Inj. Prev. 2014, 15, 762–768. [Google Scholar] [CrossRef]
- Dulebenets, M.; Pasha, J.; Abioye, O.; Kavoosi, M.; Ozguven, E.; Moses, R.; Sando, T. Exact and heuristic solution algorithms for efficient emergency evacuation in areas with vulnerable populations. Int. J. Disaster Risk Reduct. 2019, 39, 101114. [Google Scholar] [CrossRef]
- Behnood, A.; Mannering, F. The temporal stability of factors affecting driver-injury severities in single-vehicle crashes: Some empirical evidence. Anal. Methods Accid. Res. 2015, 8, 7–32. [Google Scholar] [CrossRef]
- Chen, F.; Chen, S.; Ma, X. Analysis of hourly crash likelihood using unbalanced panel data mixed logit model and real-time driving environmental big data. J. Saf. Res. 2018, 65, 153–159. [Google Scholar] [CrossRef]
- Zhang, H.D.; Zheng, X.P. Characteristics of hazardous chemical accidents in China: A statistical investigation. J. Loss Prev. Process Ind. 2012, 25, 686–693. [Google Scholar] [CrossRef]
- Yang, J.; Li, F.; Zhou, J.; Zhang, L.; Huang, L.; Bi, J. A survey on hazardous materials accidents during road transport in China from 2000 to 2008. J. Hazard. Mater. 2010, 184, 647–653. [Google Scholar] [CrossRef]
- Ma, C.; He, R.; Zhang, W. Path optimization of taxi carpooling. PLoS ONE 2018, 13, e0203221. [Google Scholar] [CrossRef]
- Zhou, J.; Mao, X.; Wang, Y.; Zhang, M.; Dong, S. Risk Assessment in urban large-scale public spaces using Dempster-Shafer theory: An empirical study in Ningbo, China. Int. J. Environ. Res. Public Health 2019, 16, 2942. [Google Scholar] [CrossRef] [Green Version]
- Chen, F.; Chen, S. Injury severities of truck drivers in single-and multi-vehicle accidents on rural highways. Accid. Anal. Prev. 2011, 43, 1677–1688. [Google Scholar] [CrossRef]
- Lv, Y.; Yan, X.D.; Sun, W.; Gao, Z. A risk-based method for planning of bus–subway corridor evacuation under hybrid uncertainties. Reliab. Eng. Syst. Saf. 2015, 139, 188–199. [Google Scholar] [CrossRef]
- Yu, Q.; Jiang, J.; Yu, H. Research on the emergency response system of major dangerous chemical accident on highway based on the GIS. Procedia Eng. 2012, 45, 716–721. [Google Scholar] [CrossRef] [Green Version]
- Tixier, J.; Dusserre, G.; Rault-Doumax, S.; Ollivier, J.; Bourely, C. OSIRIS: Software for the consequence evaluation of transportation of dangerous goods accidents. Environ. Model. Softw. 2002, 17, 627–637. [Google Scholar] [CrossRef]
- Brzozowska, L. Computer simulation of impacts of a chlorine tanker truck accident. Transp. Res. Part D Transp. Environ. 2016, 43, 107–122. [Google Scholar] [CrossRef]
- Ghaleh, S.; Omidvari, M.; Nassiri, P.; Momeni, M.; Lavasani, S. Pattern of safety risk assessment in road fleet transportation of hazardous materials (oil materials). Saf. Sci. 2019, 116, 1–12. [Google Scholar] [CrossRef]
- Chen, J.R.; Zhang, M.G.; Yu, S.J.; Wang, J. A bayesian network for the transportation accidents of hazardous materials handling time assessment. Procedia Eng. 2018, 211, 63–69. [Google Scholar] [CrossRef]
- Chen, F.; Song, M.; Ma, X. Investigation on the injury severity of drivers in rear-end collisions between cars using a random parameters bivariate ordered probit model. Int. J. Environ. Res. Public Health 2019, 16, 2632. [Google Scholar] [CrossRef] [Green Version]
- Liu, X.; Saat, M.; Barkan, C. Probability analysis of multiple-tank-car release incidents in railway hazardous materials transportation. J. Hazard. Mater. 2014, 276, 442–451. [Google Scholar] [CrossRef]
- Duan, W.; Chen, G.; Ye, Q.; Chen, Q. The situation of hazardous chemical accidents in China between 2000 and 2006. J. Hazard. Mater. 2011, 186, 1489–1494. [Google Scholar] [CrossRef]
- Ma, C.; Hao, W.; Xiang, W.; Yan, W. The impact of aggressive driving behavior on driver-injury severity at highway-rail grade crossings accidents. J. Adv. Transp. 2018, 2018, 1–12. [Google Scholar] [CrossRef] [Green Version]
- Forigua, J.; Lyons, L. Safety analysis of transportation chain for dangerous goods: A case study in Colombia. Transp. Res. Procedia 2016, 12, 842–850. [Google Scholar] [CrossRef] [Green Version]
- Ma, C.; Yang, D.; Zhou, J.; Feng, Z.; Yuan, Q. Risk riding behaviors of urban e-bikes: A literature review. Int. J. Environ. Res. Public Health 2019, 16, 2308–2320. [Google Scholar] [CrossRef] [Green Version]
- Guo, Y.; Essa, M.; Sayed, T.; Haque, M.; Washington, S. A comparison between simulated and field-measured conflicts for safety assessment of signalized intersections in Australia. Transp. Res. Part C Emerg. Technol. 2019, 101, 96–110. [Google Scholar] [CrossRef]
- Martín, L.; Baena, L.; Garach, L.; López, G.; de Oña, J. Using data mining techniques to road safety improvement in Spanish roads. Procedia Soc. Behav. Sci. 2014, 160, 607–614. [Google Scholar] [CrossRef] [Green Version]
- Noureddine, M.; Ristic, M. Route planning for hazardous materials transportation: Multicriteria decision making approach. Decis. Mak. Appl. Manag. Eng. 2019, 2, 66–85. [Google Scholar] [CrossRef]
- Li, Y.; Yang, Q.; Chin, K. A decision support model for risk management of hazardous materials road transportation based on quality function deployment. Transp. Res. Part D Transp. Environ. 2019, 74, 154–173. [Google Scholar] [CrossRef]
- Di Bona, G.; Silvestri, A.; De Felice, F.; Forcina, A.; Petrillo, A. An analytical model to measure the effectiveness of safety management systems: Global safety improve risk assessment (G-SIRA) method. J. Fail. Anal. Prev. 2016, 16, 1024–1037. [Google Scholar] [CrossRef]
- Landucci, G.; Antonioni, G.; Tugnoli, A.; Bonvicini, S.; Molag, M.; Cozzani, V. HazMat transportation risk assessment: A revisitation in the perspective of the Viareggio LPG accident. J. Loss Prev. Process Ind. 2017, 49, 36–46. [Google Scholar] [CrossRef]
- Dong, B.; Ma, X.; Chen, F.; Chen, S. Investigating the differences of single-vehicle and multivehicle accident probability using mixed logit model. J. Adv. Transp. 2018, 2018, 1–12. [Google Scholar] [CrossRef]
- Guo, Y.; Liu, P.; Wu, Y.; Chen, J. Evaluating how right-turn treatments affect right-turn-on-red conflicts at signalized intersections. J. Transp. Saf. Secur. 2018, 2018, 1–22. [Google Scholar] [CrossRef]
- Ma, C.; Hao, W.; Wang, A.; Zhao, H. Developing a coordinated signal control system for urban ring road under the vehicle-infrastructure connected environment. IEEE Access 2018, 6, 52471–52478. [Google Scholar] [CrossRef]
- Jusufranic, I.; Neskovic, S.; Ketin, S.; Biocanin, R. Management of transport of hazardous materials. Fresenius Environ. Bull. 2018, 27, 4325–4331. [Google Scholar]


| Variable Category | Variable Name | Variable Description |
|---|---|---|
| Driver properties | Violation | 1: illegal carriage, 2: overload, 3: fatigue driving |
| Unsafe driving behavior | 1: Failure to maintain a safe distance; 2. Improper operation; 3. Excessive speed | |
| Accident liability | 1:hazardous materials vehicles, 2:other vehicles | |
| Vehicle properties | Packaging problem | 1: valve failure; 2: broken tank; 3: tank fire |
| Vehicle problem | 1:flat tire, 2:vehicle control, 3: brake failure, 4:engine fire, 5:other causes, 6: other vehicle causes | |
| Model category | 1: tank truck, 2:oil tank truck, 3: illegally modified vehicle, 4: truck | |
| Environmental properties | weather | 1: sunny, 2: cloudy, 3: rainy, 4: haze |
| Lighting (time) | 1: daytime, 2: night lighting, 3: night without lighting | |
| Month distribution | 1: first quarter, 2: second quarter, 3: third quarter, 4: fourth quarter | |
| Road properties | Road grade | 1: expressway, 2: national highway, 3: provincial highway, 4: county road and below, 5: urban road(intersection) |
| Regional distribution | 1: North China, 2: East China, 3: South China, 4: Central China, 5: Northwest China, 6: Southwest China, 7: Northeast China |
| Variable | Deaths | Injuries | Property Damage | Z Value | p Value |
|---|---|---|---|---|---|
| Illegal Behavior | −1.328 | <0.001 | |||
| 1. Illegal carriage | 3(15.00%) | 6(30.00%) | 11(55.00%) | ||
| 2. The overload | 5(31.25%) | 4(25.00%) | 7(43.75%) | ||
| 3. Fatigue driving | 7(17.95%) | 11(28.21%) | 21(53.85%) | ||
| Unsafe Driving Behavior | −0.218 | <0.001 | |||
| 1. Failure to maintain a safe distance | 10(10.42%) | 21(21.88%) | 65(67.71%) | ||
| 2. Improper operation | 3(4.29%) | 18(25.71%) | 49(70.00%) | ||
| 3. Excessive speed | 13(15.66%) | 23(27.71%) | 47(56.63%) | ||
| Accident Liability | −1.528 | <0.001 | |||
| 1. Hazardous materials vehicle | 36(8.76%) | 91(22.14%) | 284(69.10%) | ||
| 2. Other vehicles | 9(9.47%) | 24(25.26%) | 62(65.26%) | ||
| Packing Problem | −0.443 | <0.001 | |||
| 1. Valve failure | 1(4.76%) | 2(9.52%) | 18(85.71%) | ||
| 2. Broken tank | 0(0.00%) | 1(3.85%) | 25(96.15%) | ||
| 3. Tank fire | 2(16.67%) | 3(25.00%) | 7(58.33%) | ||
| Vehicle Problem | −0.225 | <0.001 | |||
| 1. Flat tire | 0(0.00%) | 1(5.56%) | 17(94.44%) | ||
| 2. Loss control | 3(20.00%) | 5(33.33%) | 7(46.67%) | ||
| 3. Brake failed | 0(0.00%) | 1(16.67%) | 5(83.33%) | ||
| 4. Engine fire | 0(0.00%) | 0(0.00%) | 2(100.00%) | ||
| 5. Other | 0(0.00%) | 2(33.33%) | 4(66.67%) | ||
| 6. Other vehicle problem | 0(0.00%) | 1(14.29%) | 6(85.71%) | ||
| Vehicle Category | −1.091 | <0.001 | |||
| 1. Tank truck | 15(6.38%) | 53(22.55%) | 167(71.06%) | ||
| 2. Oil tank truck | 18(10.29%) | 40(22.86%) | 117(66.86%) | ||
| 3. Illegally modified vehicle | 0(0.00%) | 0(0.00%) | 5(100.00%) | ||
| 4. Truck | 9(13.64%) | 18(27.27%) | 39(59.09%) | ||
| Weather | −1.964 | <0.001 | |||
| 1. Sunny | 16(14.04%) | 25(21.93%) | 73(64.04%) | ||
| 2. Cloudy | 8(4.52%) | 37(20.90%) | 132(74.58%) | ||
| 3. Rainy | 19(9.45%) | 50(24.88%) | 132(65.67%) | ||
| 4. Haze | 2(18.18%) | 3(27.27%) | 6(54.55%) | ||
| Lighting | −0.655 | <0.001 | |||
| 1. Daytime | 24(7.57%) | 70(22.08%) | 223(70.35%) | ||
| 2. Night lighting | 2(6.90%) | 4(13.79%) | 23(79.31%) | ||
| 3. Night without lighting | 18(12.95%) | 35(25.18%) | 86(61.87%) | ||
| Month Distribution | −0.655 | <0.001 | |||
| 1. First quarter | 8(8.51%) | 21(22.34%) | 65(69.15%) | ||
| 2. Second quarter | 16(10.39%) | 35(22.73%) | 103(66.88%) | ||
| 3. Third quarter | 13(9.03%) | 32(22.22%) | 99(68.75%) | ||
| 4. Fourth quarter | 11(9.09%) | 31(25.62%) | 79(65.29%) | ||
| Road Grade | −1.091 | <0.001 | |||
| 1. Expressway | 23(10.45%) | 56(25.45%) | 141(64.09%) | ||
| 2. National highway | 8(8.51%) | 21(22.34%) | 65(69.15%) | ||
| 3. Provincial highway | 8(13.33%) | 15(25.00%) | 37(61.67%) | ||
| 4. County road and below | 1(3.70%) | 9(33.33%) | 17(62.96%) | ||
| 5. Urban road(intersection) | 5(5.68%) | 14(15.91%) | 69(78.41%) | ||
| Regional Distribution | |||||
| 1. North China | 7(12.28%) | 12(21.05%) | 38(66.67%) | ||
| 2. East China | 18(9.73%) | 43(23.24%) | 124(67.03%) | ||
| 3. South China | 3(5.66%) | 13(24.53%) | 37(69.81%) | ||
| 4. Central China | 3(4.92%) | 15(24.59%) | 43(70.49%) | ||
| 5. Northwest China | 7(10.29%) | 14(20.59%) | 47(69.12%) | ||
| 6. Southwest China | 4(9.52%) | 12(28.57%) | 26(61.90%) | ||
| 7. Northeast China | 0(0.00%) | 3(16.67%) | 15(83.33%) |
| Influencing Factors | B | S.E. | Wald χ2 | OR | OR Value of 95% of CI | p Value |
|---|---|---|---|---|---|---|
| Constant term | ||||||
| Deaths | −1.461 | 0.539 | 9.624 | 0.23 | 0.09–0.63 | 0.000 |
| Injuries | 1.790 | 0.524 | 7.501 | 0.94 | 0.58–1.41 | 0.001 |
| Property loss (control) | — — | — | — — | — | — — — — | — — |
| Illegal behavior | ||||||
| Overload | −1.384 | 0.513 | 0.648 | 1.41 | 0.57–1.54 | 0.039 |
| Fatigue driving | −1.934 | 0.736 | 1.370 | 1.20 | 0.78–1.95 | 0.018 |
| Illegal carriage (control) | — — | — | — — | — | — — — — | — — |
| Unsafe driving behavior | ||||||
| Failure to maintain a safe distance | −1.435 | 0.166 | 4.740 | 1.647 | 1.19–2.38 | 0.036 |
| Expressive speed | −1.236 | 0.387 | 1.324 | 1.539 | 0.94–2.42 | 0.025 |
| Improper operation (control) | — — | — | — — | — | — — — — | — — |
| Accident liability | ||||||
| Hazardous materials vehicles | −2.429 | 0.307 | 12.814 | 2.363 | 1.51–2.97 | 0.019 |
| Other vehicles (control) | — — | — — | — — | — — | — — — — | — — |
| Packing problem | ||||||
| Valve failure | −0.597 | 0.073 | 1.524 | 0.302 | 0.08–0.62 | 0.374 |
| Broken tank | −0.798 | 0.175 | 0.493 | 0.450 | 0.11–0.89 | 0.558 |
| Tank fire (control) | — — | — — | — — | — — | — — — — | — — |
| Vehicle Problem | ||||||
| Flat tire | −1.202 | 0.339 | 1.393 | 1.095 | 0.52–1.78 | 0.443 |
| Loss control | −1.096 | 0.128 | 2.470 | 1.201 | 0.63–1.92 | 0.007 |
| Brake failed | −0.277 | 0.076 | 0.467 | 0.478 | 0.13–0.96 | 0.231 |
| Engine fire | −0.176 | 0.277 | 0.394 | 0.166 | 0.02–0.41 | 0.209 |
| Other | −0.576 | 0.292 | 0.612 | 0.892 | 0.34–1.57 | 0.345 |
| Other vehicle problem (control) | — — | — — | — — | — — | — — — — | — — |
| Vehicle category | ||||||
| Tank truck | −1611 | 0.148 | 8.166 | 4.942 | 2.22–7.30 | 0.000 |
| Oil tank truck | −1.590 | 0.204 | 7.791 | 3.507 | 1.94–6.79 | 0.000 |
| truck | 3.888 | 0.314 | 5.468 | 1.848 | 0.636–3.50 | 0.027 |
| Illegally modified vehicle (control) | — — | — — | — — | — — | — — — — | — — |
| Weather | ||||||
| Sunny | 1.370 | 0.351 | 4.302 | 0.733 | 0.23–1.59 | 0.778 |
| Cloudy | 1.813 | 0.342 | 6.099 | 1.393 | 0.64–2.11 | 0.046 |
| Rainy | −2.346 | 0.445 | 9.787 | 2.622 | 1.28–4.09 | 0.003 |
| Haze (control) | — — | — | — — | — | — — — — | — — |
| Lighting | ||||||
| Night lighting | −0.751 | 0.212 | 0.452 | 1.707 | 0.92–3.12 | 0.304 |
| Night without lighting | −1.008 | 0.588 | 4.357 | 1.111 | 0.44–1.89 | 0.032 |
| Daytime (control) | — — | — — | — — | — — | — — — — | — — |
| Month Distribution | ||||||
| First quarter | −0.871 | 0.177 | 0.366 | 1.174 | 0.47–1.64 | 0.328 |
| Second quarter | −0.563 | 0.242 | 2.259 | 2.399 | 1.51–3.35 | 0.027 |
| Third quarter | −0.572 | 0.357 | 1.829 | 1.978 | 1.26–2.77 | 0.079 |
| Fourth quarter (control) | — — | — — | — — | — — | — — — — | — — |
| Road Grade | ||||||
| Expressway | −0.451 | 0.441 | 8.759 | 2.619 | 1.55–3.78 | 0.049 |
| National highway | −0.871 | 0.328 | 4.588 | 1.538 | 0.76–2.31 | 0.036 |
| Provincial highway | −1.741 | 0.256 | 4.389 | 1.174 | 0.69–1.84 | 0.022 |
| Urban road(intersection) | −0.696 | 0.339 | 2.373 | 1.068 | 0.48–1.78 | 0.008 |
| County road and below (control) | — — | — — | — — | — — | — — — — | — — |
| Regional Distribution | ||||||
| North China | −1.473 | 0.502 | 2.619 | 1.52 | 0.88–2.24 | 0.002 |
| East China | −0.473 | 0.354 | 8.594 | 2.21 | 1.53–2.89 | 0.041 |
| South China | −0.798 | 0.305 | 1.679 | 1.14 | 0.56–1.75 | 0.626 |
| Central China | −1.368 | 0.399 | 1.829 | 1.28 | 0.61–1.92 | 0.791 |
| Northwest China | −1.161 | 0.287 | 2.581 | 1.60 | 0.88–2.32 | 0.039 |
| Southwest China | −1.368 | 0.292 | 1.466 | 1.09 | 0.45–1.71 | 0.550 |
| Northeast China (control) | — — | — — | — — | — — | — — — — | — — |
| Variable | Pseudo-Elasticity | ||
|---|---|---|---|
| Deaths | Injuries | Property Loss | |
| Overload | 44% | 2.3% | −21.2% |
| Fatigue driving | 113.8% | −10.5% | −50.8% |
| Failure to maintain a safe distance | 256.8% | −36.7% | −83.1% |
| Expressive speed | 269.3% | −35.7% | −81.4% |
| Hazardous materials vehicles | 323.4% | 45.7% | 87.3% |
| Loss control | 32.4% | −0.5% | −24.6% |
| Tank truck | 213.4% | −23.5% | −71.1% |
| Oil tank truck | 287.6% | −26.2% | −84.3% |
| Truck | 23.3% | −1.9% | −16.0% |
| Cloudy | 31.7% | −0.6% | −23.7% |
| Rainy | 155.2% | −23.0% | −77.2% |
| Night without lighting | 134.6% | −27.1% | −73.2% |
| Second quarter | 39.5% | −0.7% | −26.4% |
| Expressway | 81.1% | −17.4% | −34.2% |
| National highway | 42.6% | −2.1% | −33.3% |
| Provincial highway | 31.6% | −0.3% | −21.7% |
| Urban road(intersection) | 13.2% | −0.5% | −9.7% |
| North China | 21.9% | −3.3% | −14.1% |
| East China | 114.3% | −28.5% | −52.9% |
| Northwest China | 26.6% | −3.1% | −12.2% |
| Weather | Death | Injury | Property Loss |
|---|---|---|---|
| Sunny | 35.56% | 21.74% | 21.28% |
| Cloudy | 17.78% | 32.17% | 38.48% |
| Rainy and Snowy | 42.22% | 43.48% | 38.48% |
| Haze | 4.44% | 2.61% | 1.75% |
© 2020 by the authors. Licensee MDPI, Basel, Switzerland. This article is an open access article distributed under the terms and conditions of the Creative Commons Attribution (CC BY) license (http://creativecommons.org/licenses/by/4.0/).
Share and Cite
Ma, C.; Zhou, J.; Yang, D. Causation Analysis of Hazardous Material Road Transportation Accidents Based on the Ordered Logit Regression Model. Int. J. Environ. Res. Public Health 2020, 17, 1259. https://doi.org/10.3390/ijerph17041259
Ma C, Zhou J, Yang D. Causation Analysis of Hazardous Material Road Transportation Accidents Based on the Ordered Logit Regression Model. International Journal of Environmental Research and Public Health. 2020; 17(4):1259. https://doi.org/10.3390/ijerph17041259
Chicago/Turabian StyleMa, Changxi, Jibiao Zhou, and Dong Yang. 2020. "Causation Analysis of Hazardous Material Road Transportation Accidents Based on the Ordered Logit Regression Model" International Journal of Environmental Research and Public Health 17, no. 4: 1259. https://doi.org/10.3390/ijerph17041259
APA StyleMa, C., Zhou, J., & Yang, D. (2020). Causation Analysis of Hazardous Material Road Transportation Accidents Based on the Ordered Logit Regression Model. International Journal of Environmental Research and Public Health, 17(4), 1259. https://doi.org/10.3390/ijerph17041259


