The Profile and Development of the Lower Limb in Setswana-Speaking Children between the Ages of 2 and 9 Years


Abstract
:1. Introduction
2. Materials and Methods
2.1. Participants
2.2. Procedure
2.3. Statistical Analysis
3. Results
3.1. Tibiofemoral Angle (TFA) and Intermalleolar Distance (IMD)
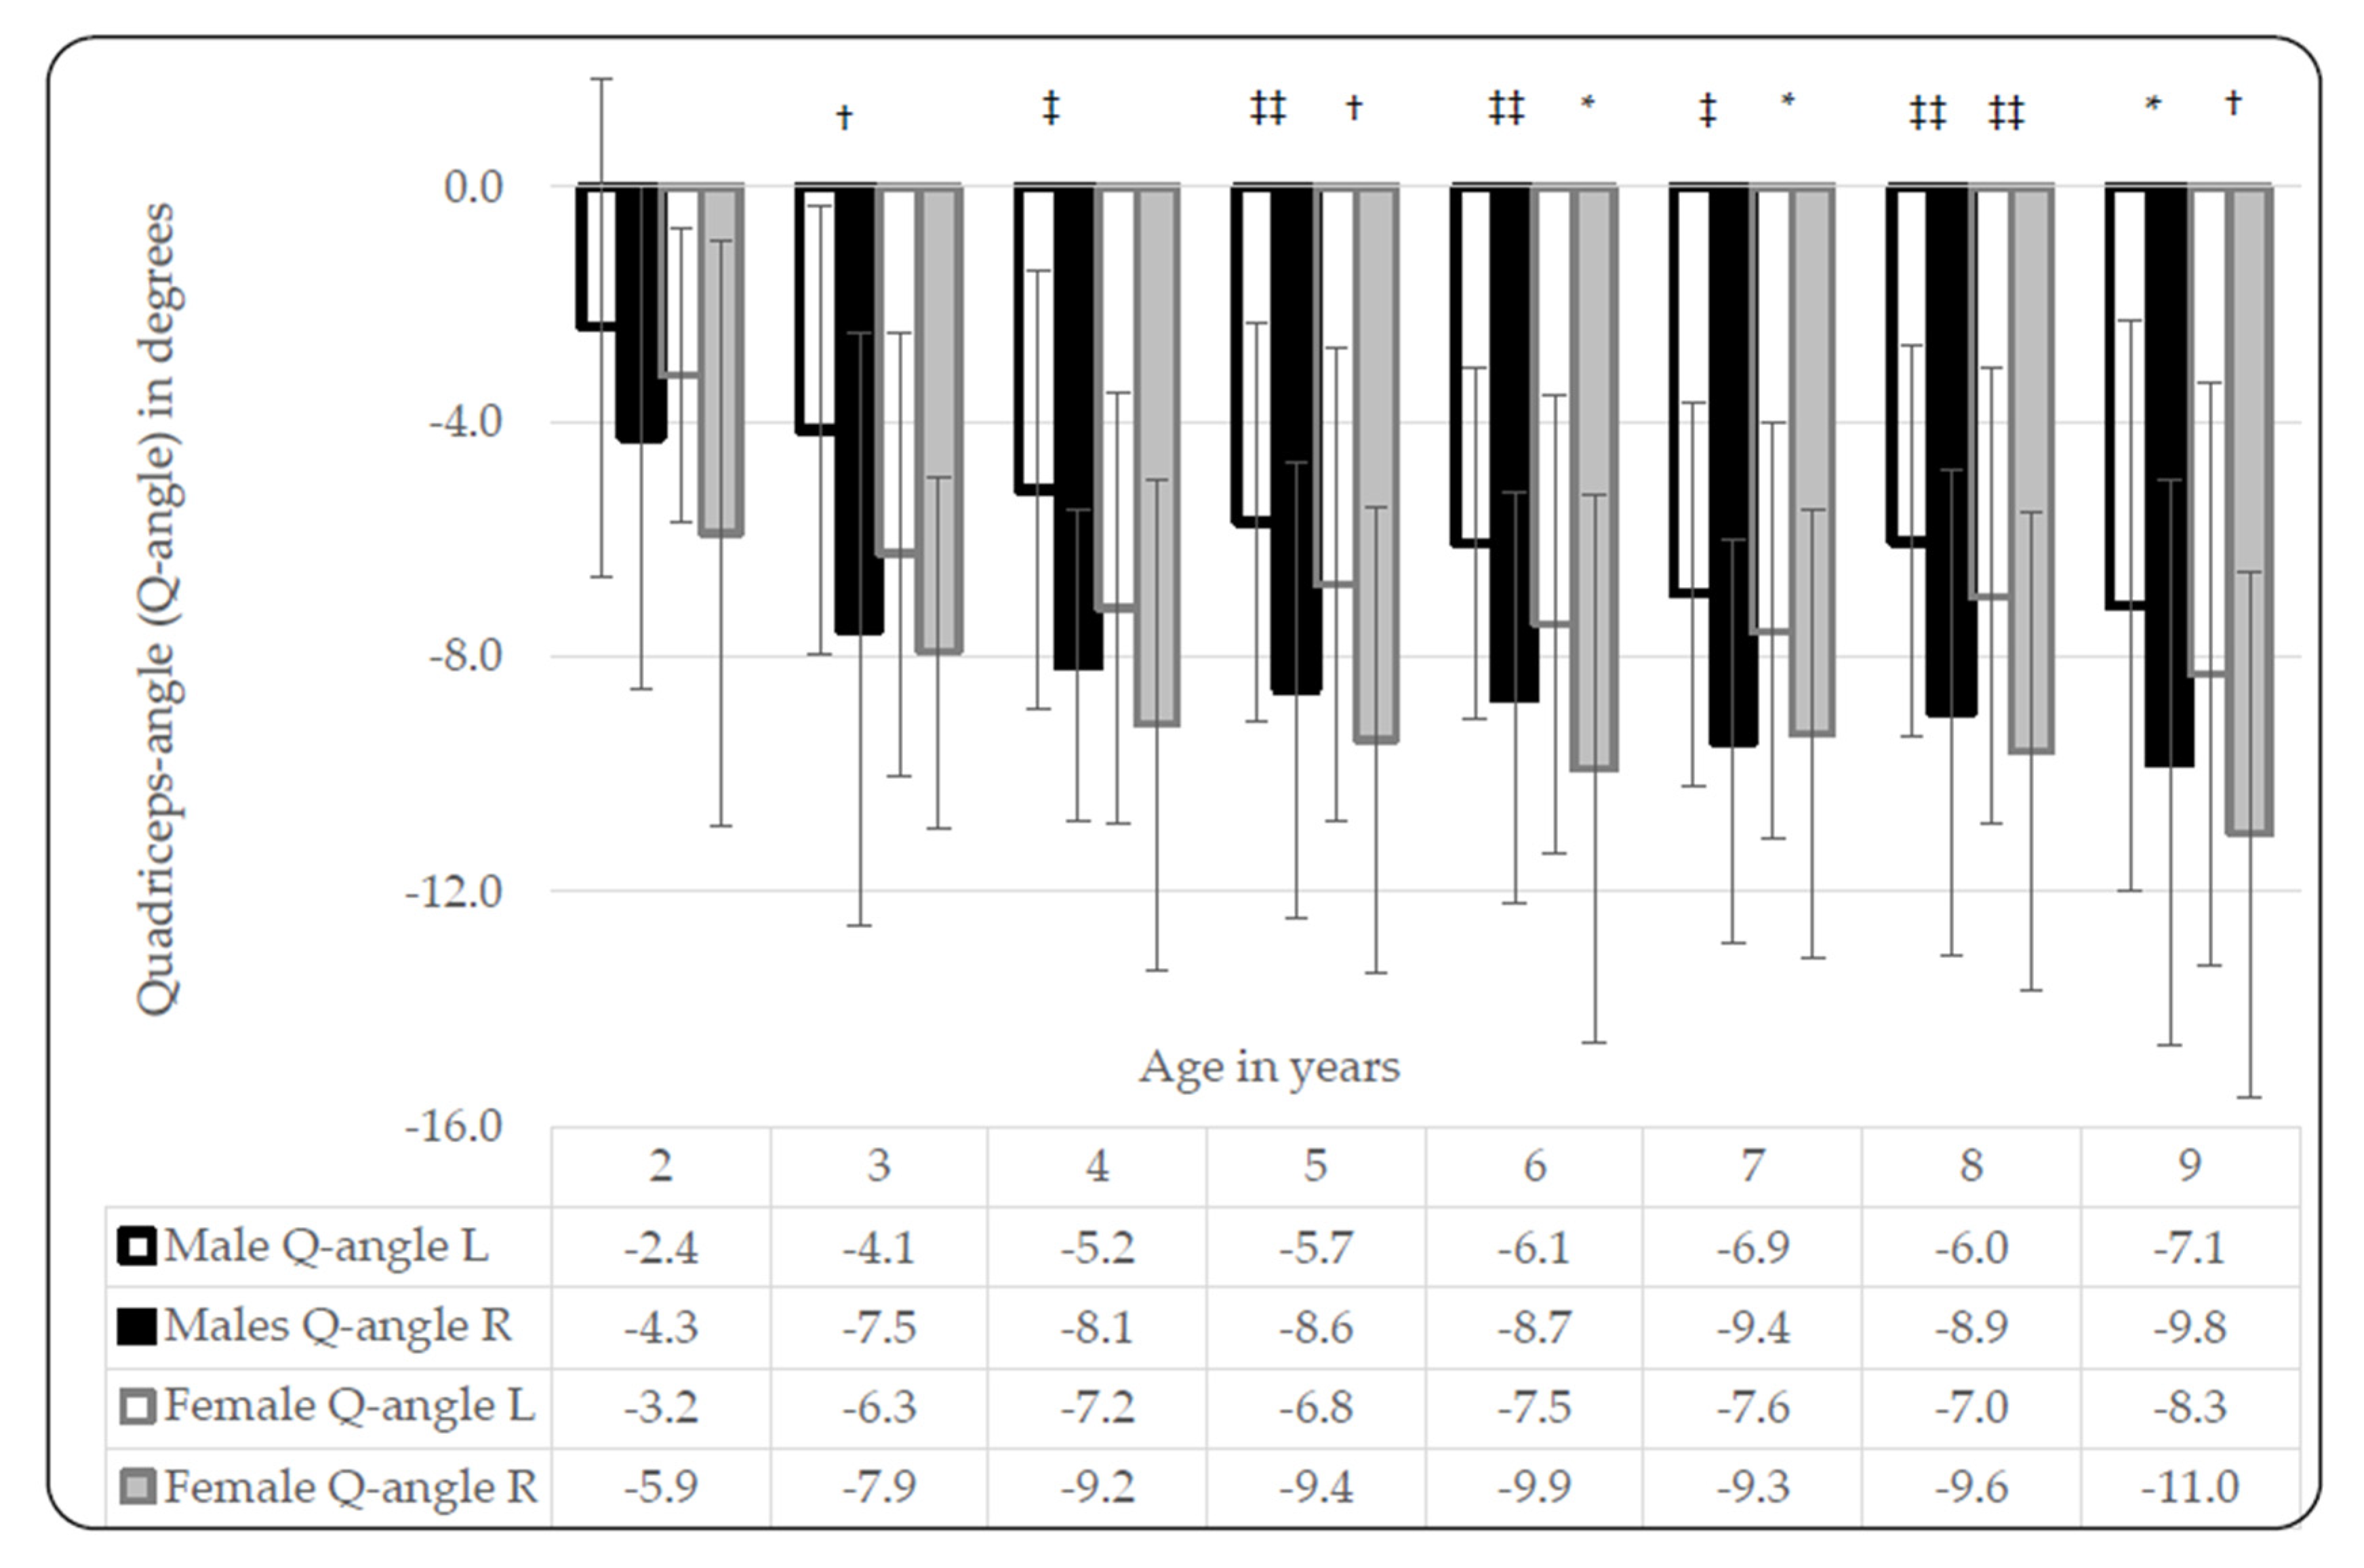
3.2. Quadricep-Angles (Q-Angles)
3.3. Hip Anteversion Angles (AVAs)
3.4. Tibial Torsion Angles (TTAs)
4. Discussion
5. Conclusions
Author Contributions
Funding
Acknowledgments
Conflicts of Interest
References
- Cheng, J.C.; Chan, P.; Chiang, S.; Hui, P. Angular and rotational profile of the lower limb in 2630 Chinese children. J. Pediatric Orthop. 1991, 11, 154–161. [Google Scholar] [CrossRef] [PubMed]
- Farr, S.; Kranzl, A.; Pablik, E.; Kaipel, M.; Ganger, R. Functional and radiographic consideration of lower limb malalignment in children and adolescents with idiopathic genu valgum. J. Orthop. Res. 2014, 32, 1362–1370. [Google Scholar] [CrossRef] [PubMed] [Green Version]
- Saini, U.C.; Bali, K.; Sheth, B.; Gahlot, N.; Gahlot, A. Normal development of the knee angle in healthy Indian children: A clinical study of 215 children. J. Child. Orthop. 2010, 4, 579–586. [Google Scholar] [CrossRef] [PubMed] [Green Version]
- Heath, C.; Staheli, L. Normal limits of knee angle in white children--genu varum and genu valgum. J. Pediatric Orthop. 1993, 13, 259–262. [Google Scholar]
- Oyewole, O.O.; Akinpelu, A.O.; Odole, A.C. Development of the tibiofemoral angle in a cohort of Nigerian children during the first 3 years of life. J. Child. Orthop. 2013, 7, 167–173. [Google Scholar] [CrossRef] [Green Version]
- Omololu, B.; Tella, A.; Ogunlade, S.; Adeyemo, A.; Adebisi, A.; Alonge, T.; Salawu, S.; Akinpelu, A. Normal values of knee angle, intercondylar and intermalleolar distances in Nigerian children. West Afr. J. Med. 2003, 22, 301–304. [Google Scholar] [CrossRef] [Green Version]
- Cahuzac, J.; Vardon, D.; de Gauzy, J.S. Development of the clinical tibiofemoral angle in normal adolescents. A study of 427 normal subjects from 10 to 16 years of age. Bone Jt. J. 1995, 77, 729–732. [Google Scholar] [CrossRef] [Green Version]
- Kaspiris, A.; Zaphiropoulou, C.; Vasiliadis, E. Range of variation of genu valgum and association with anthropometric characteristics and physical activity: Comparison between children aged 3–9 years. J. Pediatric Orthop. B 2013, 22, 296–305. [Google Scholar] [CrossRef]
- Arazi, M.; Ögün, T.C.; Memik, R. Normal development of the tibiofemoral angle in children: A clinical study of 590 normal subjects from 3 to 17 years of age. J. Pediatric Orthop. 2001, 21, 264–267. [Google Scholar] [CrossRef]
- Bafor, A.; Omota, B.; Ogbemudia, A.O. Correlation between clinical tibiofemoral angle and body mass index in normal Nigerian children. Int. Orthop. 2012, 36, 1247–1253. [Google Scholar] [CrossRef] [Green Version]
- Mathew, S.; Madhuri, V. Clinical tibiofemoral angle in South Indian children. Bone Jt. Res. 2013, 2, 155–161. [Google Scholar] [CrossRef] [PubMed]
- Yoo, J.H.; Choi, I.H.; Cho, T.-J.; Chung, C.Y.; Yoo, W.J. Development of tibiofemoral angle in Korean children. J. Korean Med. Sci. 2008, 23, 714–717. [Google Scholar] [CrossRef] [PubMed] [Green Version]
- Kumar, D.; Gopichand, P.V.; Puri, N. Study of knee angle in tribal children of Andhra Pradesh. Asian J. Med. Sci. 2016, 7, 75–81. [Google Scholar] [CrossRef] [Green Version]
- Ginesin, E.; Norman, D.; Peskin, B. Knee Alignment and Its Significance: Is It Really Different in Various Population Groups? Isr. Med. Assoc. J. 2018, 20, 109. [Google Scholar] [PubMed]
- Salenius, P.; Vankka, E. The development of the tibiofemoral angle in children. J. Bone Jt. Surg. Am. Vol. 1975, 57, 259–261. [Google Scholar] [CrossRef]
- Prajapati, A. Measurement of tibiofemoral angle in Nepalese children: A clinical study in normal subjects between ages of 1-8 years. J. Chitwan Med. Coll. 2018, 8, 22–26. [Google Scholar] [CrossRef] [Green Version]
- Kaspiris, A.; Grivas, T.; Vasiliadis, E. Physiological alignment of the lower limbs changes during childhood: A clinical study in south-west Greece. Adv. Biomed. Res. 2010, 1, 249–251. [Google Scholar]
- Riegger-Krugh, C.; Keysor, J.J. Skeletal malalignments of the lower quarter: Correlated and compensatory motions and postures. J. Orthop. Sports Phys. Ther. 1996, 23, 164–170. [Google Scholar] [CrossRef]
- Magee, D.J. Orthopedic Physical Assessment, 2006, 4th ed.; Saunders Elsevier: Philadelphia, PA, USA, 2006. [Google Scholar]
- France, L.; Nester, C. Effect of errors in the identification of anatomical landmarks on the accuracy of Q angle values. Clin. Biomech. 2001, 16, 710–713. [Google Scholar] [CrossRef]
- WHO. World Health Organization. Available online: http://apps.who.int/nutrition/landscape/report.aspx?iso=zaf (accessed on 25 March 2019).
- Eberhard, D.M.; Simons, G.F.; Fennig, C.D. Ethnologue: Languages of the World. Available online: https://www.ethnologue.com/language/tsn (accessed on 7 August 2019).
- Peterson-Kendall, F.; Kendall-McCreary, E.; Geise-Provance, P.; McIntyre-Rodgers, M.; Romani, W. Muscles Testing and Function with Posture and Pain, 5th ed.; Lippincott Williams & Wilkins: Baltimore, MD, USA, 2005. [Google Scholar]
- Espandar, R.; Mortazavi, S.M.-J.; Baghdadi, T. Angular deformities of the lower limb in children. Asian J. Sports Med. 2010, 1, 46–53. [Google Scholar] [CrossRef] [Green Version]
- Mohd-Karim, M.; Sulaiman, A.; Munajat, I.; Syurahbil, A. Clinical measurement of the tibio-femoral angle in Malay children. Malays. Orthop. J. 2015, 9, 9. [Google Scholar] [CrossRef] [PubMed]
- Baruah, R.; Kumar, S.; Harikrishnan, S. Developmental pattern of tibiofemoral angle in healthy north-east Indian children. J. Child. Orthop. 2017, 11, 339–347. [Google Scholar] [CrossRef] [PubMed]
- Hahn, T.; Foldspang, A. The Q angle and sport. Scand. J. Med. Sci. Sports 1997, 7, 43–48. [Google Scholar] [CrossRef] [PubMed]
- Raveendranath, V.; Nachiket, S.; Sujatha, N.; Priya, R.; Rema, D. Bilateral variability of the quadriceps angle (Q angle) in an adult Indian population. Iran. J. Basic Med. Sci. 2011, 14, 465. [Google Scholar]
- Bhalara, A.; Talsaniya, D.; Nikita, G.N. Q angle in children population aged between 7 to 12 years. Int. J. Health Sci. Res. 2013, 3, 57–64. [Google Scholar]
- Bayraktar, B.; Yucesir, I.; Ozturk, A.; Cakmak, A.K.; Taskara, N.; Kale, A.; Demiryurek, D.; Bayramoglu, A.; Camlica, H. Change of quadriceps angle values with age and activity. Saudi Med. J. 2004, 25, 756–760. [Google Scholar]
- Mooney, J.F. Lower extremity rotational and angular issues in children. Pediatric Clin. 2014, 61, 1175–1183. [Google Scholar] [CrossRef]
- Lincoln, T.L.; Suen, P.W. Common rotational variations in children. Jaaos-J. Am. Acad. Orthop. Surg. 2003, 11, 312–320. [Google Scholar] [CrossRef] [Green Version]
- Svenningsen, S.; Apalset, K.; Terjesen, T.; Anda, S. Regression of femoral anteversion: A prospective study of intoeing children. Acta Orthopædica Scand. 1989, 60, 170–173. [Google Scholar] [CrossRef] [Green Version]
- Reikerås, O. Patellofemoral characteristics in patients with increased femoral anteversion. Skelet. Radiol. 1992, 21, 311–313. [Google Scholar] [CrossRef]
- Jacquemier, M.; Glard, Y.; Pomero, V.; Viehweger, E.; Jouve, J.-L.; Bollini, G. Rotational profile of the lower limb in 1319 healthy children. Gait Posture 2008, 28, 187–193. [Google Scholar] [CrossRef] [PubMed]
- Fabry, G.; Cheng, L.X.; Molenaers, G. Normal and abnormal torsional development in children. Clin. Orthop. Relat. Res. 1994, 302, 22–26. [Google Scholar] [CrossRef]
- Kozic, S.; Gulan, G.; Matovinovic, D.; Nemec, B.; Sestan, B.; Ravlic-Gulan, J. Femoral anteversion related to side differences in hip rotation: Passive rotation in 1140 children aged 8–9 years. Acta Orthop. Scand. 1997, 68, 533–536. [Google Scholar] [CrossRef] [PubMed]
- Shultz, S.J.; Nguyen, A.-D.; Schmitz, R.J. Differences in lower extremity anatomical and postural characteristics in males and females between maturation groups. J. Orthop. Sports Phys. Ther. 2008, 38, 137–149. [Google Scholar] [CrossRef] [PubMed]
- Gruskay, J.A.; Fragomen, A.T.; Rozbruch, S.R. Idiopathic rotational abnormalities of the lower extremities in children and adults. J. Bone Jt. Surg. Rev. 2019, 7, e3. [Google Scholar] [CrossRef] [Green Version]
- Souza, R.B.; Powers, C.M. Concurrent criterion-related validity and reliability of a clinical test to measure femoral anteversion. J. Orthop. Sports Phys. Ther. 2009, 39, 586–592. [Google Scholar] [CrossRef]


| Total | Males | Females | |||||||||||||
|---|---|---|---|---|---|---|---|---|---|---|---|---|---|---|---|
| Age Group | Participants n | Mean Age (yr) ± SD | Mean Height (cm) ± SD | Mean Body Mass (kg) ± SD | Mean BMI (kg·m−2) ± SD | Participants n | Mean Age (yr) ±SD | Mean Height (cm) ±SD | Mean Body Mass (kg) ±SD | Mean BMI ±SD | Participants n | Mean Age (yr) ±SD | Mean Height (cm) ±SD | Mean Body Mass (kg) ±SD | Mean BMI (kg·m−2) ±SD |
| 2 | 38 | 2.10 ± 0.28 | 85.19 ± 7.51 | 12.41 ± 1.99 | 17.13 ± 1.92 | 23 | 2.06 ± 0.27 | 84.62 ± 6.13 | 12.23 ± 1.51 | 17.11 ± 1.65 | 15 | 2.17 ± 0.30 | 8.14 ± 9.54 | 12.70 ± 2.63 | 17.15 ± 2.36 |
| 3 | 52 | 3.00 ± 0.26 | 91.36 ± 6.19 | 14.08 ± 2.34 | 16.77 ± 1.95 | 28 | 2.96 ± 0.26 | 91.20 ± 4.94 | 14.41 ± 1.78 | 16.93 ± 2.54 | 24 | 3.05 ± 0.26 | 91.57 ± 7.61 | 13.65 ± 2.89 | 16.21 ± 2.17 |
| 4 | 54 | 4.06 ± 0.23 | 101.81 ± 5.60 | 16.19 ± 2.61 | 15.53 ± 1.34 | 25 | 4.13 ± 0.21 | 103.15 ± 6.44 | 17.09 ± 3.12 | 15.94 ± 1.43 | 29 | 4.00 ± 0.24 | 100.65 ± 4.57 | 15.40 ± 1.79 | 15.19 ± 1.18 |
| 5 | 112 | 5.08 ± 0.27 | 107.46 ± 5.46 | 18.14 ± 3.32 | 15.61 ± 1.75 | 58 | 5.10 ± 0.27 | 108.67 ± 5.74 | 18.75 ± 3.12 | 15.79 ± 1.56 | 54 | 5.05 ± 0.27 | 106.17 ± 4.87 | 17.50 ± 3.43 | 15.42 ± 1.92 |
| 6 | 113 | 6.06 ± 0.28 | 113.16 ± 5.21 | 20.05 ± 4.08 | 15.57 ± 2.34 | 63 | 6.06 ± 0.28 | 113.23 ± 4.79 | 19.80 ± 2.86 | 15.39 ± 1.55 | 50 | 6.06 ± 0.28 | 113.06 ± 5.76 | 20.38 ± 5.25 | 15.79 ± 3.08 |
| 7 | 98 | 7.01 ± 0.27 | 118.52 ± 6.13 | 21.93 ± 4.56 | 15.49 ± 2.01 | 47 | 6.97 ± 0.28 | 118.98 ± 6.44 | 21.85 ± 4.39 | 15.34 ± 2.01 | 51 | 7.04 ± 0.26 | 118.11 ± 5.87 | 22.01 ± 4.75 | 15.63 ± 2.03 |
| 8 | 127 | 8.07 ± 0.27 | 125.12 ± 6.11 | 26.32 ± 7.37 | 16.66 ± 3.59 | 50 | 8.06 ± 0.27 | 125.25 ± 5.78 | 25.61 ± 5.23 | 16.25 ± 2.68 | 77 | 8.07 ± 0.27 | 125.03 ± 6.34 | 26.79 ± 8.47 | 16.93 ± 4.06 |
| 9 | 97 | 8.92 ± 0.24 | 129.77 ± 6.59 | 27.33 ± 5.93 | 16.11 ± 2.61 | 41 | 8.91 ± 0.23 | 129.93 ± 6.76 | 27.45 ± 5.32 | 16.17 ± 2.30 | 56 | 8.93 ± 0.25 | 129.65 ± 6.52 | 27.24 ± 6.39 | 16.07 ± 2.84 |
| Total | 691 | 6.20 ± 2.03 | 113.56 ± 14.07 | 21.05 ± 6.73 | 16.11 ± 2.49 | 335 | 5.99 ± 2.03 | 112.57 ± 14.24 | 20.55 ± 5.81 | 15.96 ± 2.06 | 356 | 6.40 ± 2.00 | 114.55 ± 13.85 | 21.53 ± 7.48 | 16.03 ± 2.87 |
| Age | Total | Females | Males | Significance | ||||||||||||||
|---|---|---|---|---|---|---|---|---|---|---|---|---|---|---|---|---|---|---|
| n | Mean | Q1 | Q2 | Q3 | n | Mean | Q1 | Q2 | Q3 | n | Mean | Q1 | Q2 | Q3 | p-Value | Cohen’s D | Bonferroni-Corrected p | |
| ±SD | (Median) | ±SD | (Median) | ±SD | (Median) | |||||||||||||
| 2 | 38 | −3.39 | −5.44 | −4.00 | −1.81 | 15 | −4.00 | −6.75 | −4.25 | −3.13 | 23 | −2.99 | −5.13 | −3.75 | −1.38 | 0.38 | −0.29 | 1.00 |
| ±3.43 | ±3.46 | ±3.43 | ||||||||||||||||
| 3 | 52 | −5.63 | −7.00 | −5.50 | −4.25 | 24 | −5.70 | −7.06 | −5.38 | −4.44 | 28 | −4.86 | −7.00 | −5.63 | −3.81 | 0.84 | −0.06 | 1.00 |
| ±2.26 | ±1.83 | ±1.72 | ||||||||||||||||
| 4 | 54 | −4.97 | −6.25 | −5.13 | −3.75 | 29 | −5.01 | −6.50 | −5.00 | −3.75 | 25 | −4.86 | −6.25 | −5.25 | −4.25 | 0.87 | −0.05 | 1.00 |
| ±1.90 | ±2.08 | ±1.72 | ||||||||||||||||
| 5 | 112 | −4.71 | −5.75 | −4.50 | −3.50 | 54 | −5.13 | −6.00 | −5.13 | −4.00 | 58 | −4.36 | −5.50 | −4.25 | −2.75 | 0.04 | −0.40 | 0.22 |
| ±2.02 | ±2.01 | ±2.00 | ||||||||||||||||
| 6 | 113 | −4.29 | −5.25 | −4.00 | −3.25 | 50 | −4.43 | −5.94 | −4.00 | −3.25 | 63 | −4.20 | −5.00 | −3.75 | −3.25 | 0.44 | −0.15 | 2.62 |
| ±1.61 | ±1.78 | ±1.46 | ||||||||||||||||
| 7 | 98 | −4.40 | −5.50 | −4.44 | −3.25 | 51 | −4.67 | −5.75 | −4.75 | −3.63 | 47 | −4.01 | −5.19 | −4.00 | −3.00 | 0.08 | −0.36 | 0.49 |
| ±1.60 | ±1.56 | ±1.61 | ||||||||||||||||
| 8 | 127 | −4.25 | −5.38 | −4.25 | −3.00 | 77 | −4.53 | −5.75 | −4.50 | −3.25 | 50 | −3.80 | −5.00 | −3.38 | −2.56 | 0.02 | −0.41 | 0.14 |
| ±1.77 | ±1.71 | ±1.73 | ||||||||||||||||
| 9 | 97 | −4.58 | −6.25 | −4.50 | −3.25 | 56 | −4.95 | −6.75 | −4.63 | −3.50 | 41 | −4.14 | −5.25 | −4.00 | −2.25 | 0.04 | −0.43 | 0.23 |
| ±2.09 | ±1.99 | ±2.17 | ||||||||||||||||
| Total | 691 | −4.51 | −5.75 | −4.50 | −3.25 | 356 | −4.79 | −6.00 | −4.75 | −3.50 | 335 | −4.22 | −5.50 | −4.25 | −3.00 | 0.00 | −0.28 | 0.00 |
| ±2.03 | ±1.95 | ±2.07 | ||||||||||||||||
| Age | Total | Females | Males | Significance | ||||||||||||||
|---|---|---|---|---|---|---|---|---|---|---|---|---|---|---|---|---|---|---|
| n | Mean | Q1 | Q2 | Q3 | n | Mean | Q1 | Q2 | Q3 | n | Mean | Q1 | Q2 | Q3 | p-Value | Cohen’s D | Bonferroni-Corrected p | |
| ±SD | (Median) | ±SD | (Median) | ±SD | (Median) | |||||||||||||
| 2 | 38 | −3.81 | −6.69 | −4.88 | −1.81 | 15 | −4.55 | −7.38 | −5.50 | −2.25 | 23 | −3.33 | −6.38 | −4.00 | −1.38 | 0.33 | −0.33 | 1.00 |
| ±3.77 | ±3.32 | ±4.03 | ||||||||||||||||
| 3 | 52 | −6.41 | −7.50 | −6.25 | −4.75 | 24 | −7.08 | −8.13 | −6.50 | −5.19 | 28 | −5.84 | −7.06 | −5.75 | −4.19 | 0.15 | −0.40 | 0.90 |
| ±3.09 | ±2.71 | ±3.31 | ||||||||||||||||
| 4 | 54 | −7.46 | −9.38 | −7.25 | −4.81 | 29 | −8.16 | −10.00 | −8.50 | −6.50 | 25 | −6.65 | −8.25 | −6.25 | −4.75 | 0.06 | −0.54 | 0.34 |
| ±2.92 | ±3.11 | ±2.49 | ||||||||||||||||
| 5 | 112 | −7.59 | −9.31 | −7.25 | −5.00 | 54 | −8.09 | −10.19 | −8.13 | −5.31 | 58 | −7.13 | −9.00 | −6.75 | −4.56 | 0.13 | −0.29 | 0.81 |
| ±3.40 | ±3.65 | ±3.10 | ||||||||||||||||
| 6 | 113 | −7.96 | −10.50 | −7.50 | −5.50 | 50 | −8.68 | −11.38 | −8.25 | −6.06 | 63 | −7.39 | −9.75 | −6.88 | −5.13 | 0.04* | −0.40 | 0.22 |
| ±3.29 | ±3.56 | ±2.96 | ||||||||||||||||
| 7 | 98 | −8.32 | −10.25 | −8.25 | −6.31 | 51 | −8.44 | −10.38 | −8.50 | −6.50 | 47 | −8.18 | −10.25 | −8.00 | −6.13 | 0.66 | −0.09 | 3.96 |
| ±2.91 | ±2.94 | ±2.91 | ||||||||||||||||
| 8 | 127 | −7.98 | −10.25 | −7.25 | −5.75 | 77 | −8.29 | −10.50 | −8.25 | −6.00 | 50 | −7.49 | −9.50 | −6.88 | −5.56 | 0.18 | −0.24 | 1.00 |
| ±3.30 | ±3.31 | ±3.25 | ||||||||||||||||
| 9 | 97 | −9.16 | −12.25 | −9.50 | −5.75 | 56 | −9.66 | −12.31 | −9.88 | −6.00 | 41 | −8.47 | −11.00 | −7.75 | −5.25 | 0.19 | −0.27 | 1.11 |
| ±4.36 | ±4.27 | ±4.45 | ||||||||||||||||
| Total | 691 | −7.74 | −10.00 | −7.50 | −5.25 | 356 | −8.30 | −10.50 | −8.25 | −6.00 | 335 | −7.14 | −9.25 | −6.75 | −4.88 | 0.00 | −0.33 | 0.00 |
| ±3.59 | ±3.58 | ±3.51 | ||||||||||||||||
© 2020 by the authors. Licensee MDPI, Basel, Switzerland. This article is an open access article distributed under the terms and conditions of the Creative Commons Attribution (CC BY) license (http://creativecommons.org/licenses/by/4.0/).
Share and Cite
van Aswegen, M.; Czyż, S.H.; Moss, S.J. The Profile and Development of the Lower Limb in Setswana-Speaking Children between the Ages of 2 and 9 Years. Int. J. Environ. Res. Public Health 2020, 17, 3245. https://doi.org/10.3390/ijerph17093245
van Aswegen M, Czyż SH, Moss SJ. The Profile and Development of the Lower Limb in Setswana-Speaking Children between the Ages of 2 and 9 Years. International Journal of Environmental Research and Public Health. 2020; 17(9):3245. https://doi.org/10.3390/ijerph17093245
Chicago/Turabian Stylevan Aswegen, Mariaan, Stanisław H. Czyż, and Sarah J. Moss. 2020. "The Profile and Development of the Lower Limb in Setswana-Speaking Children between the Ages of 2 and 9 Years" International Journal of Environmental Research and Public Health 17, no. 9: 3245. https://doi.org/10.3390/ijerph17093245