
Multi-Criteria Evaluation and Sensitivity Analysis for the Optimal Location of Constructed Wetlands (METland) at Oceanic and Mediterranean Areas


Abstract
:1. Introduction
1.1. Bioelectrochemical-Assisted Constructed Wetlands (METland)
1.2. Multi-Criteria Evaluation for Finding the Optimal Location
1.3. Sensibility Analysis Associated with Spatially Explicit MCE Techniques
2. Materials and Methods
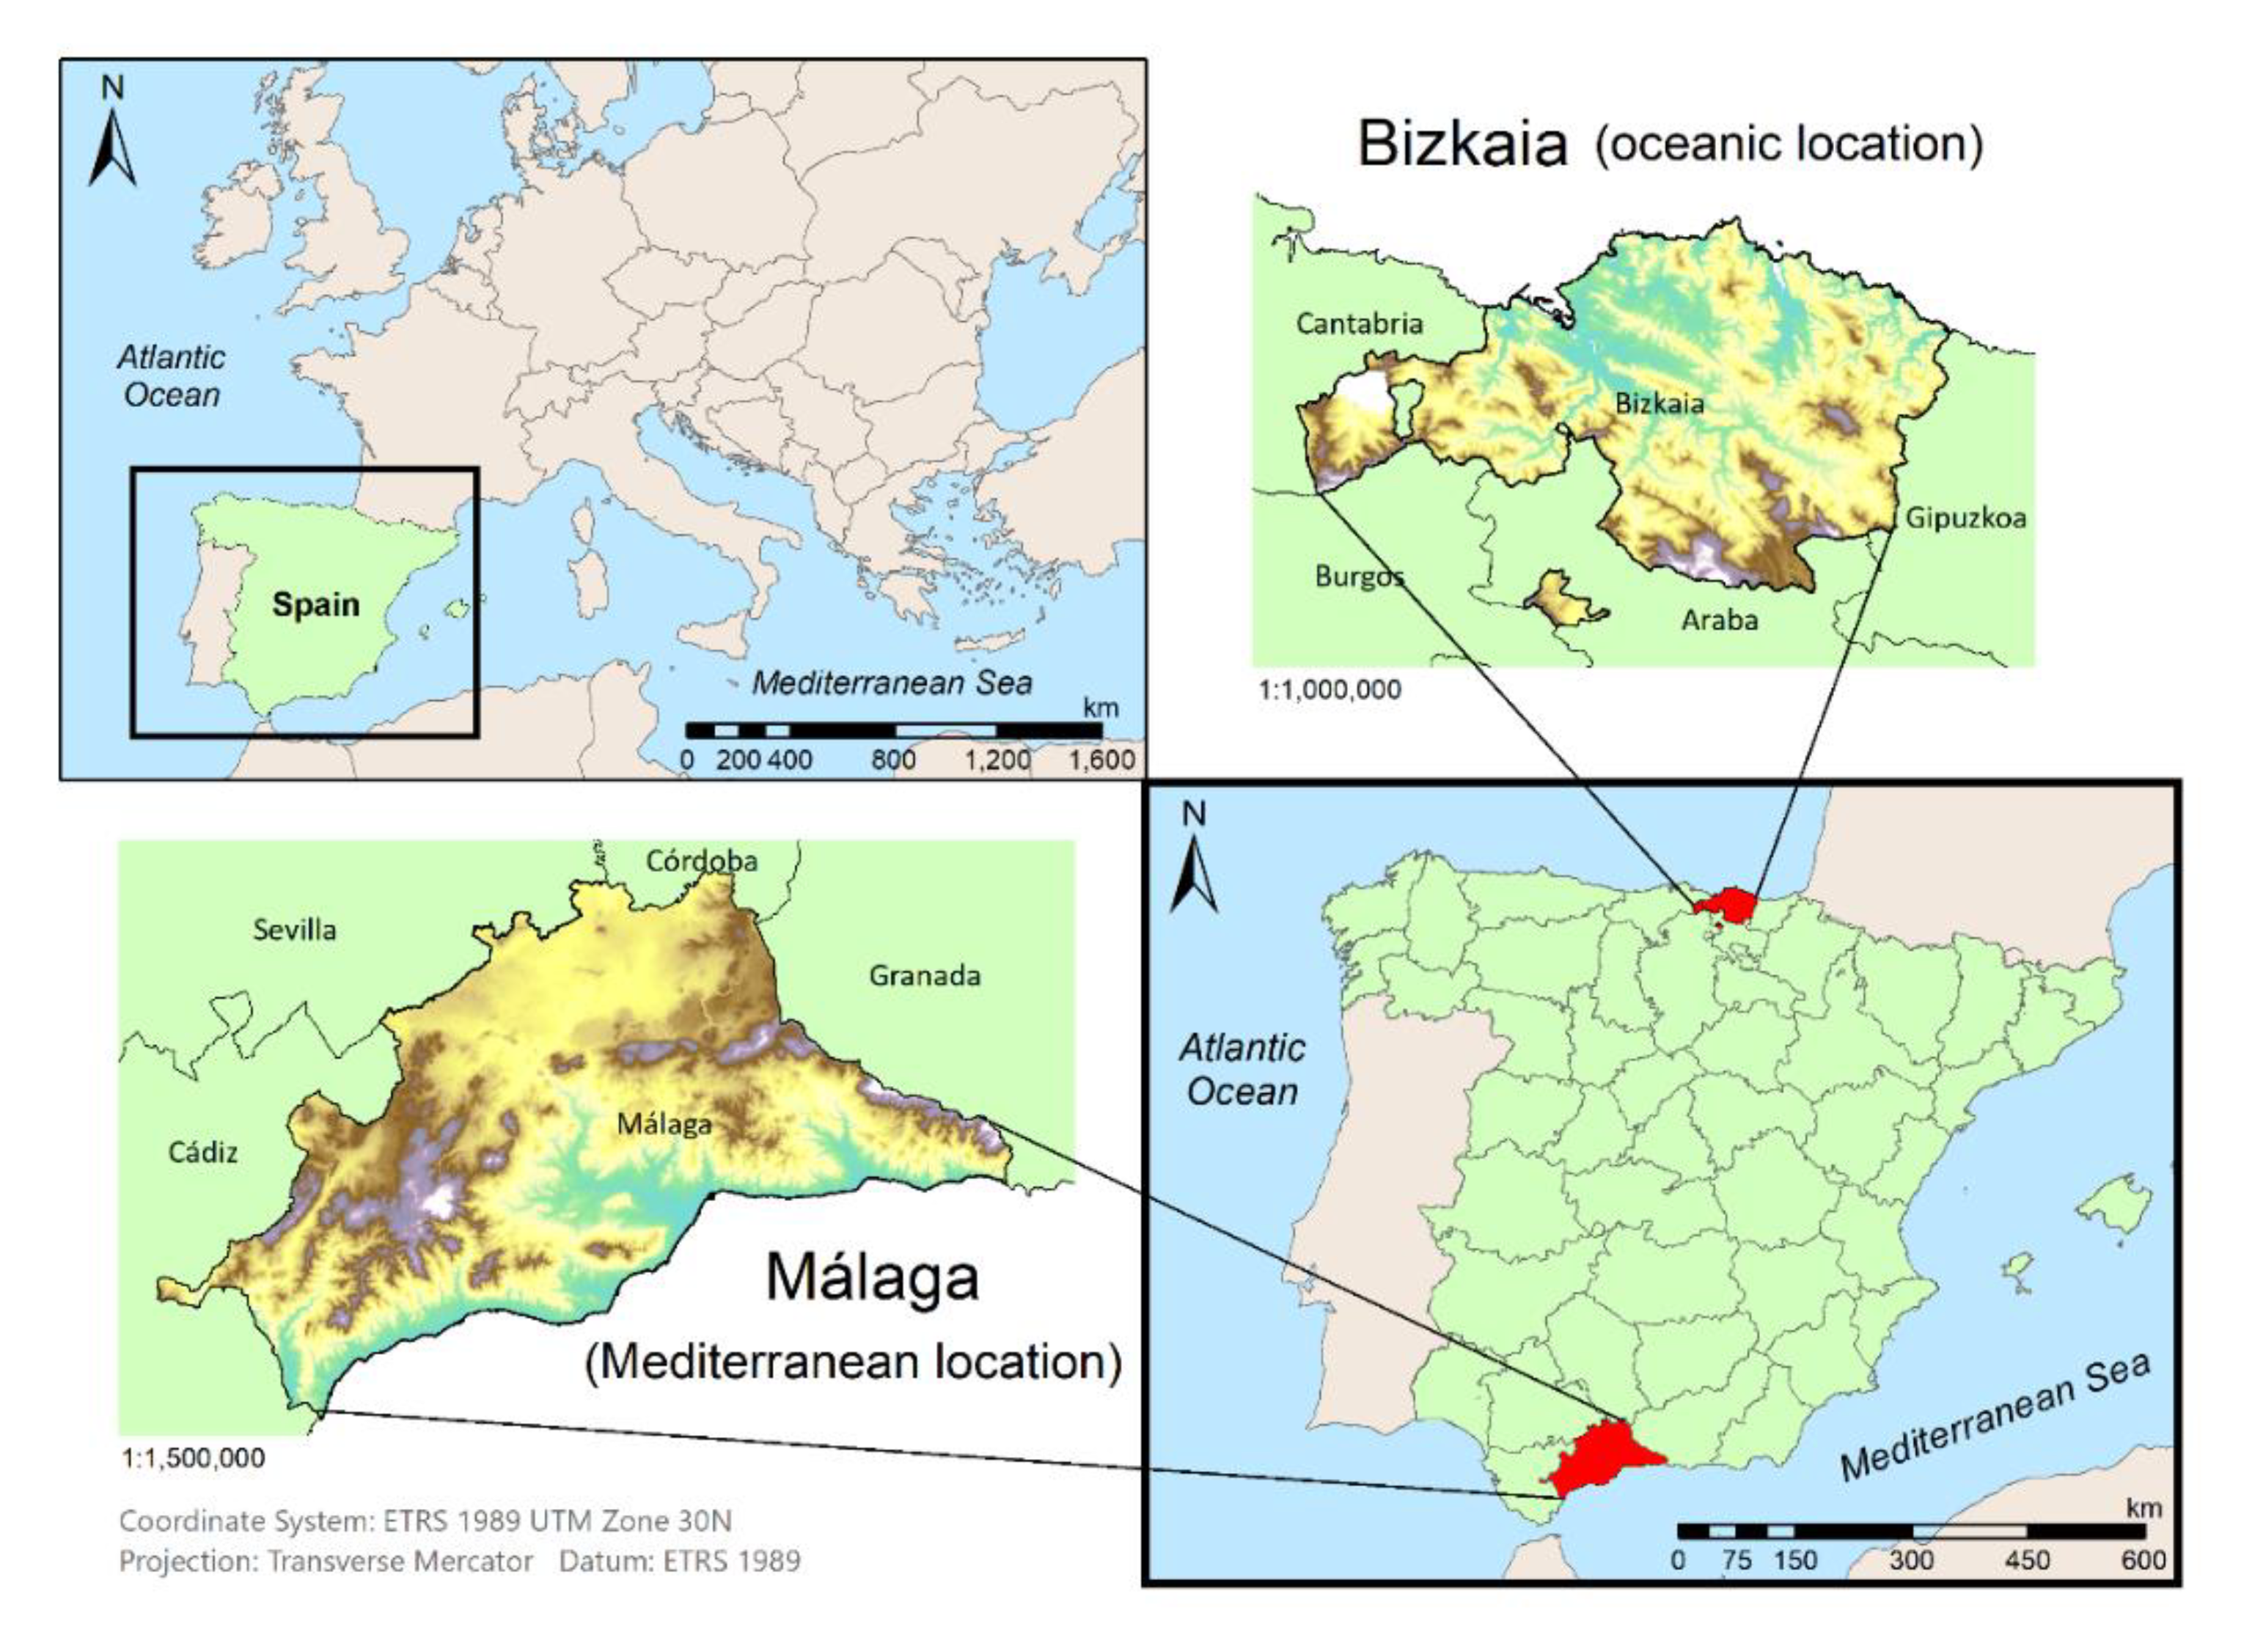
2.1. The Study Area
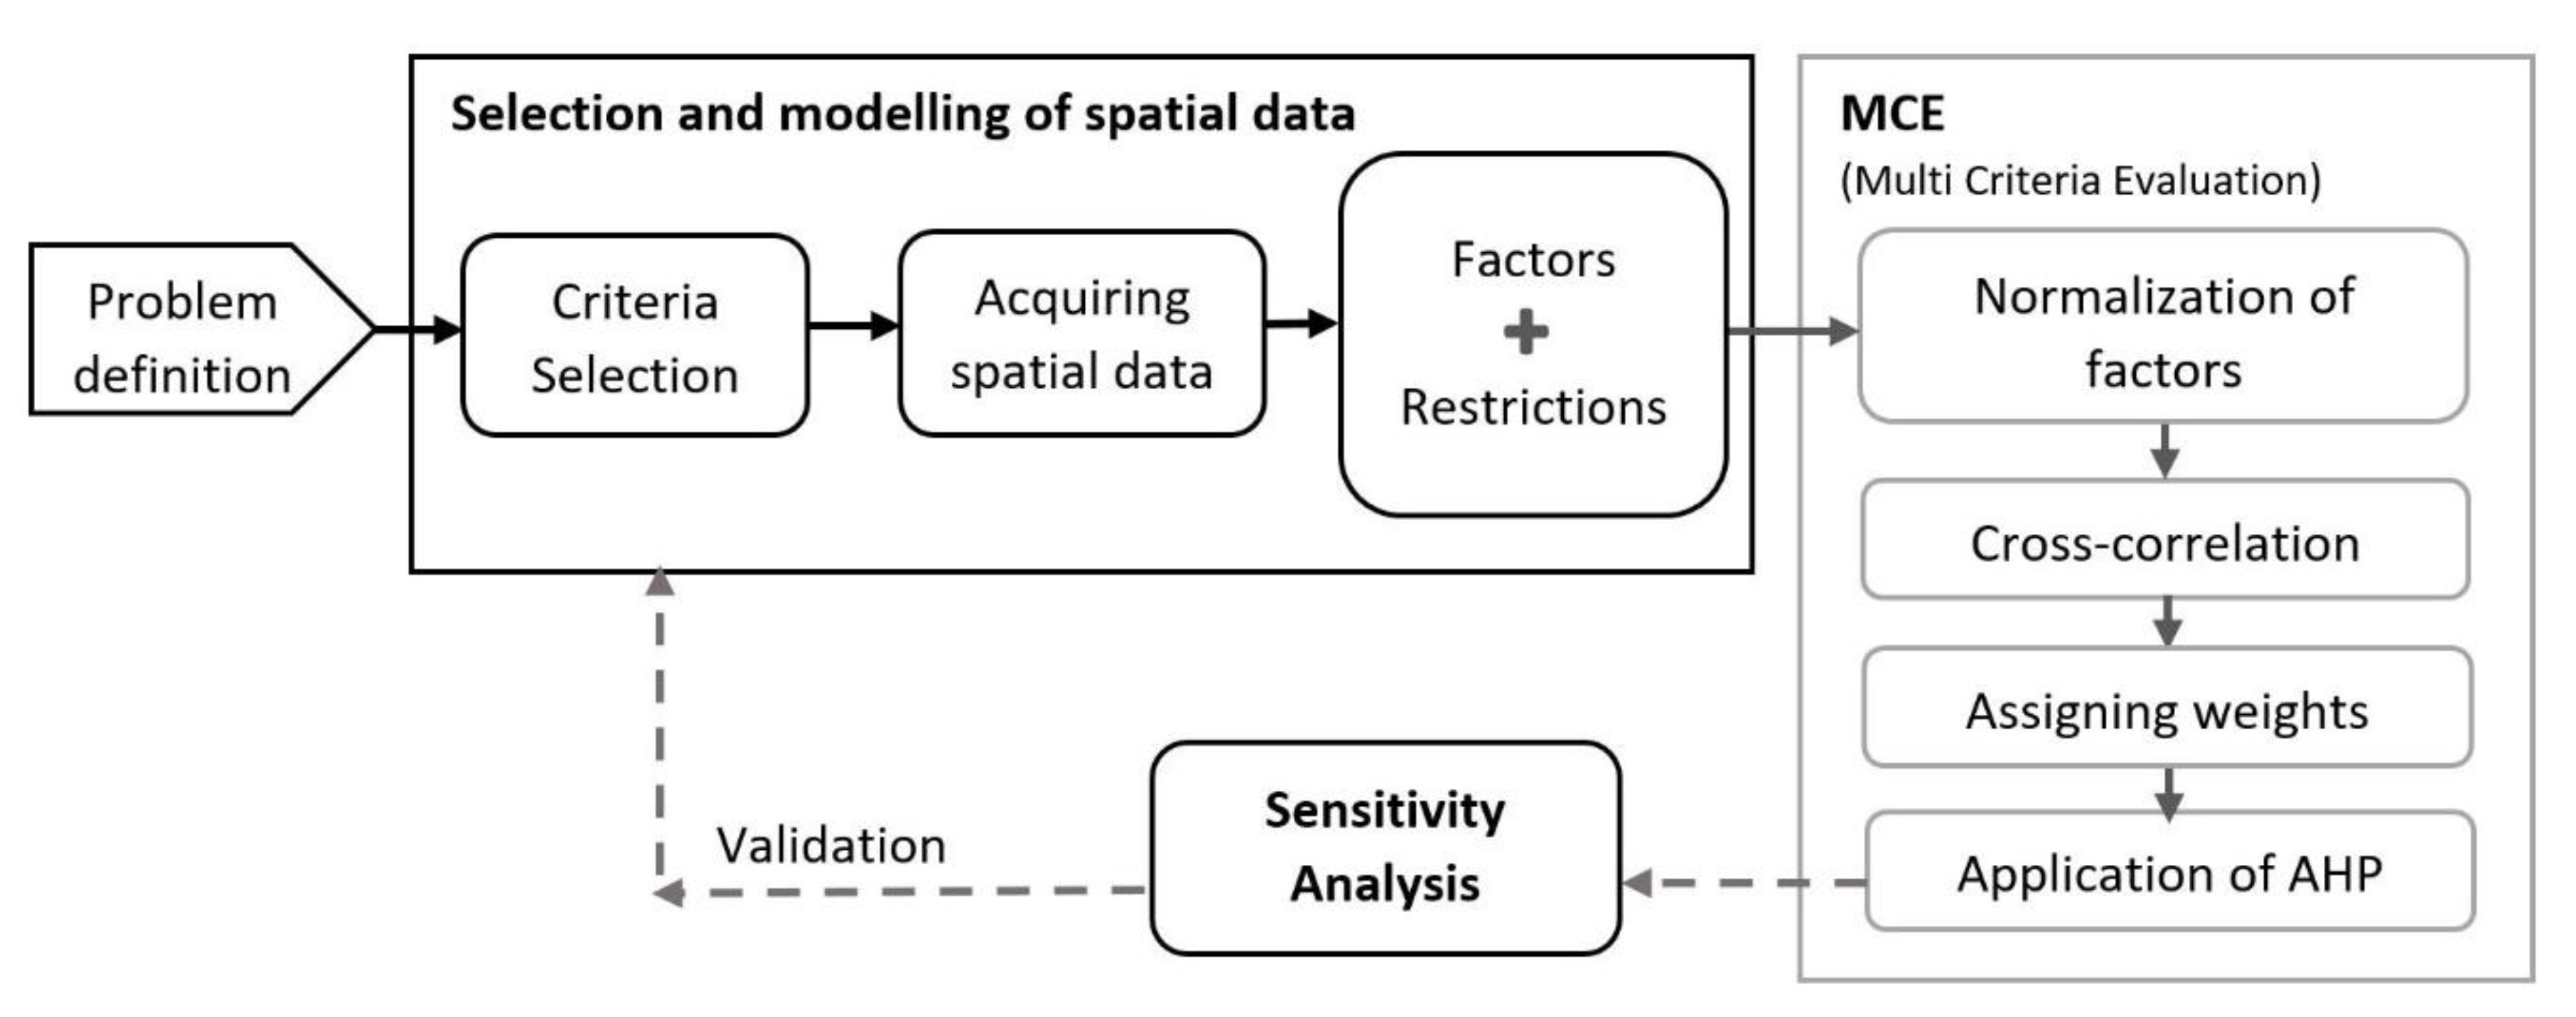
2.2. Methodology
2.2.1. Multi-Criteria Evaluation Procedure
Environmental Factors
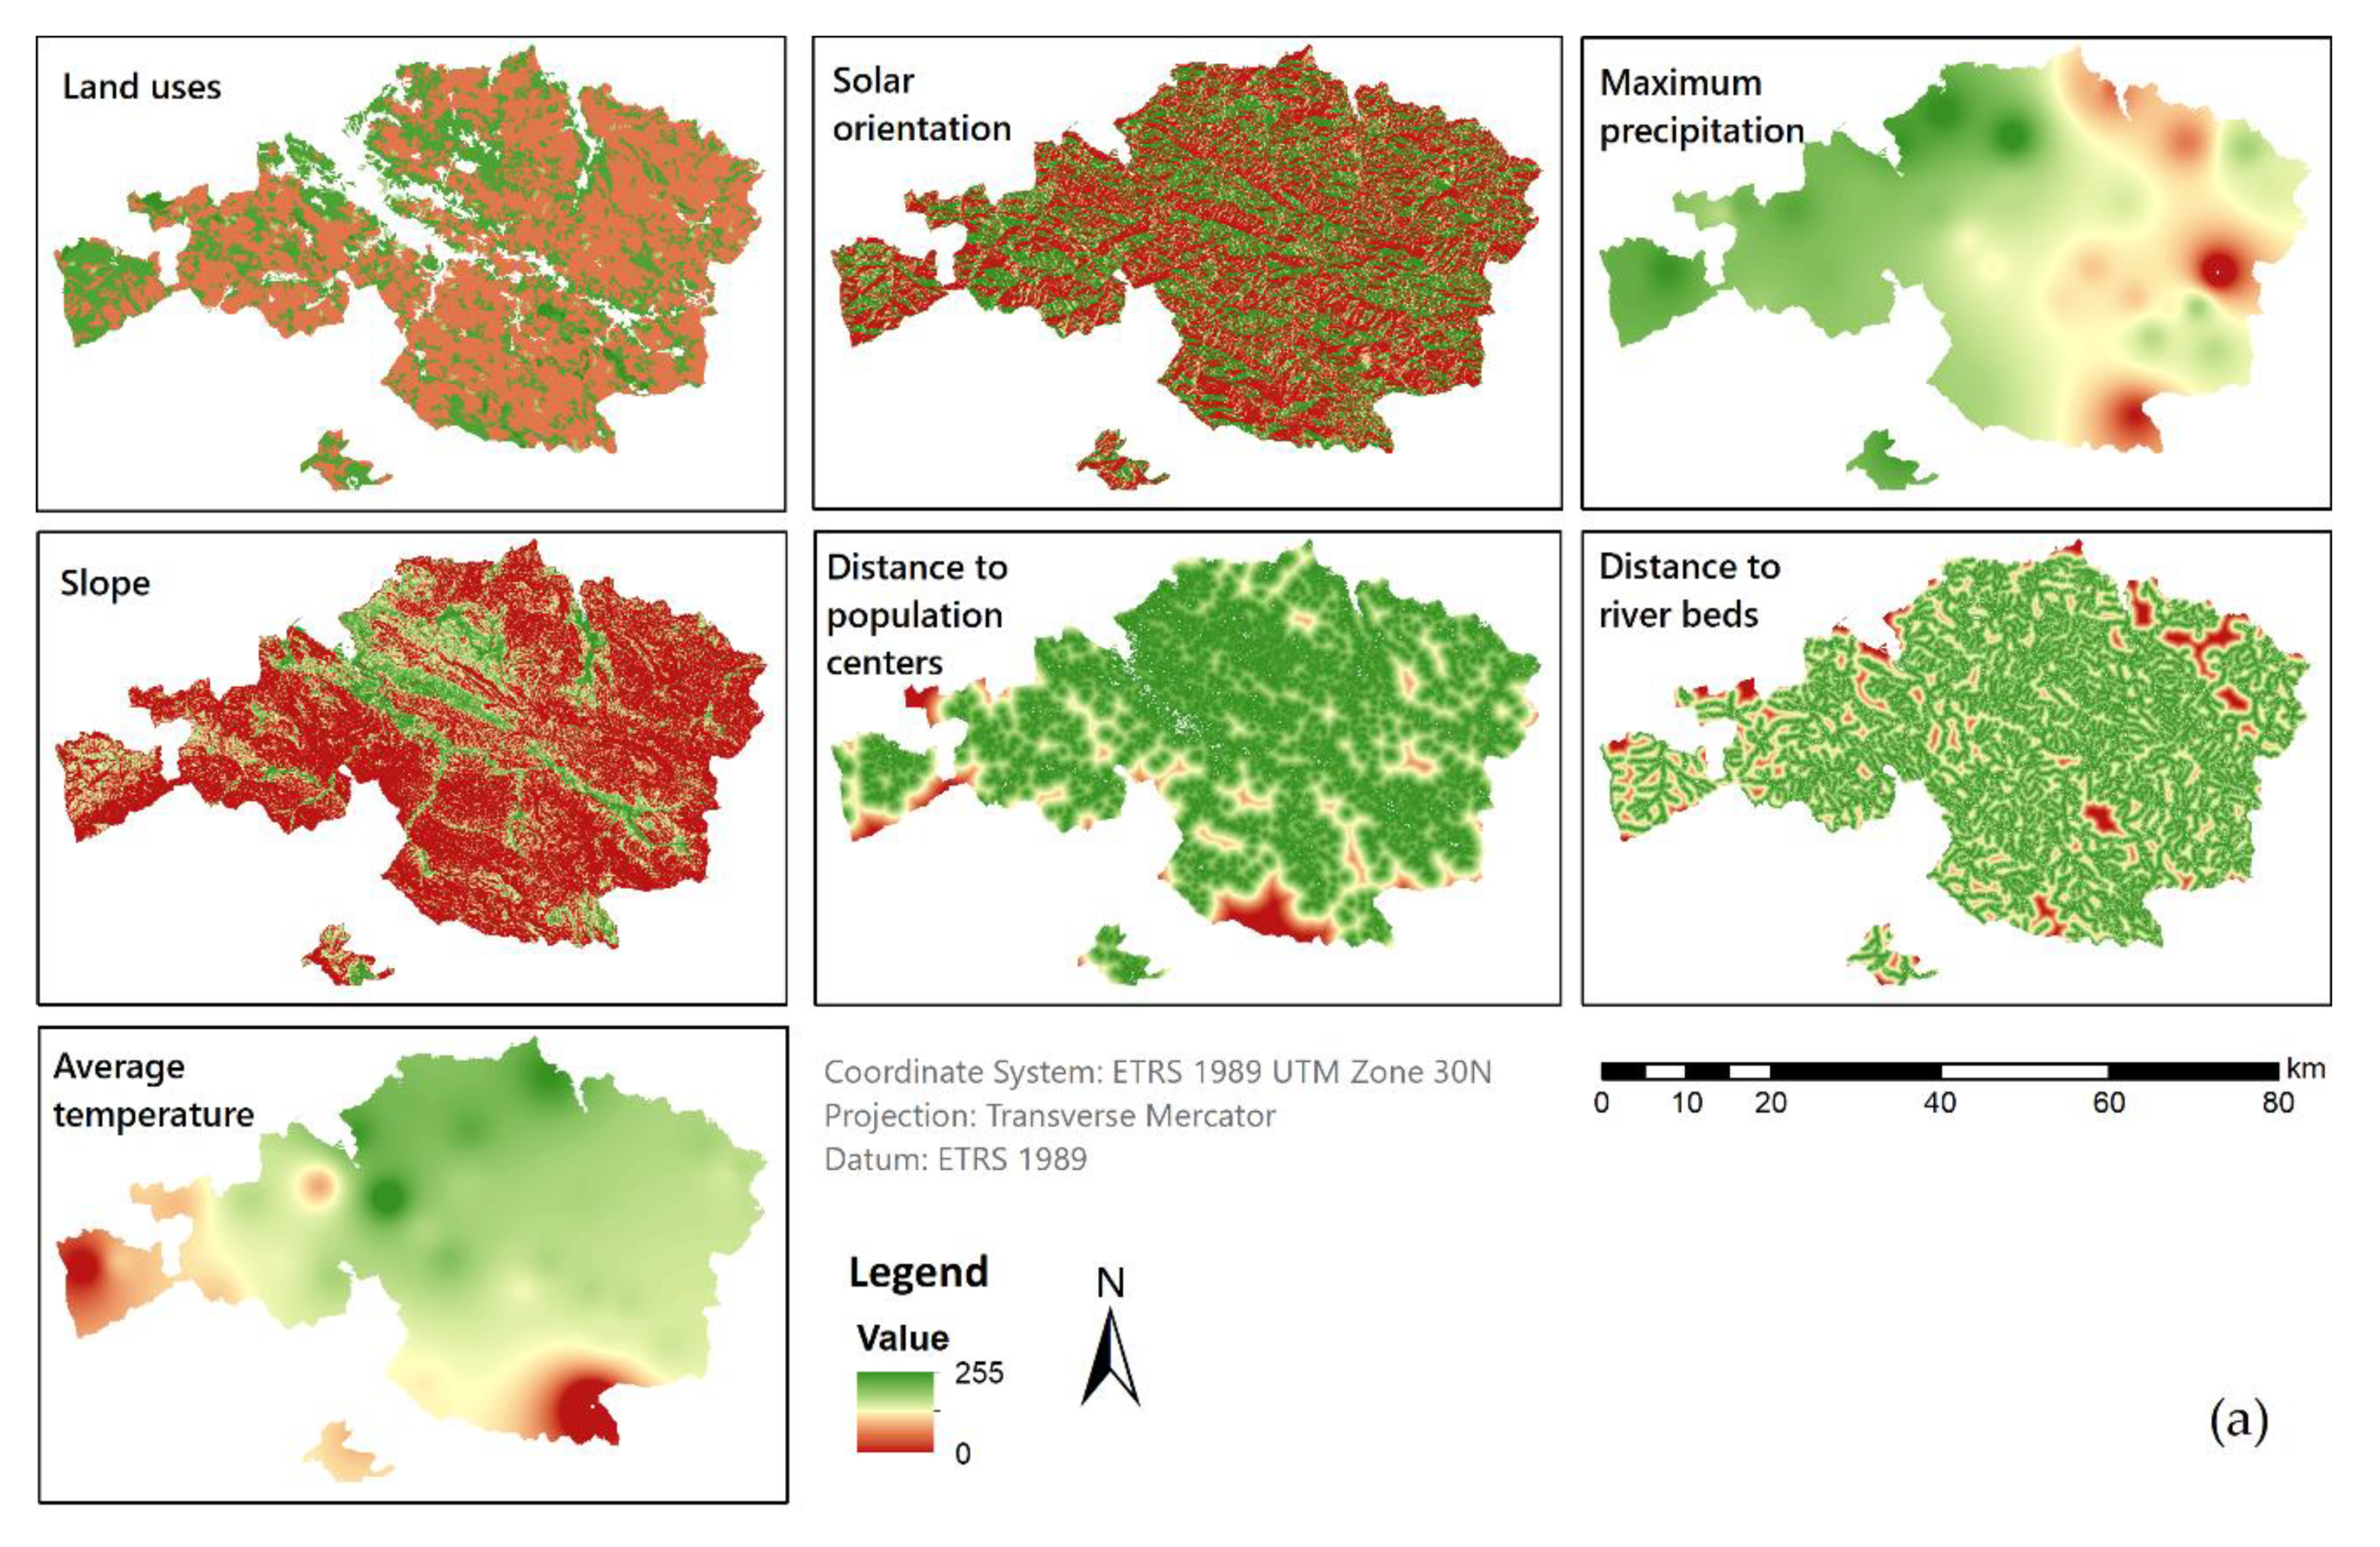
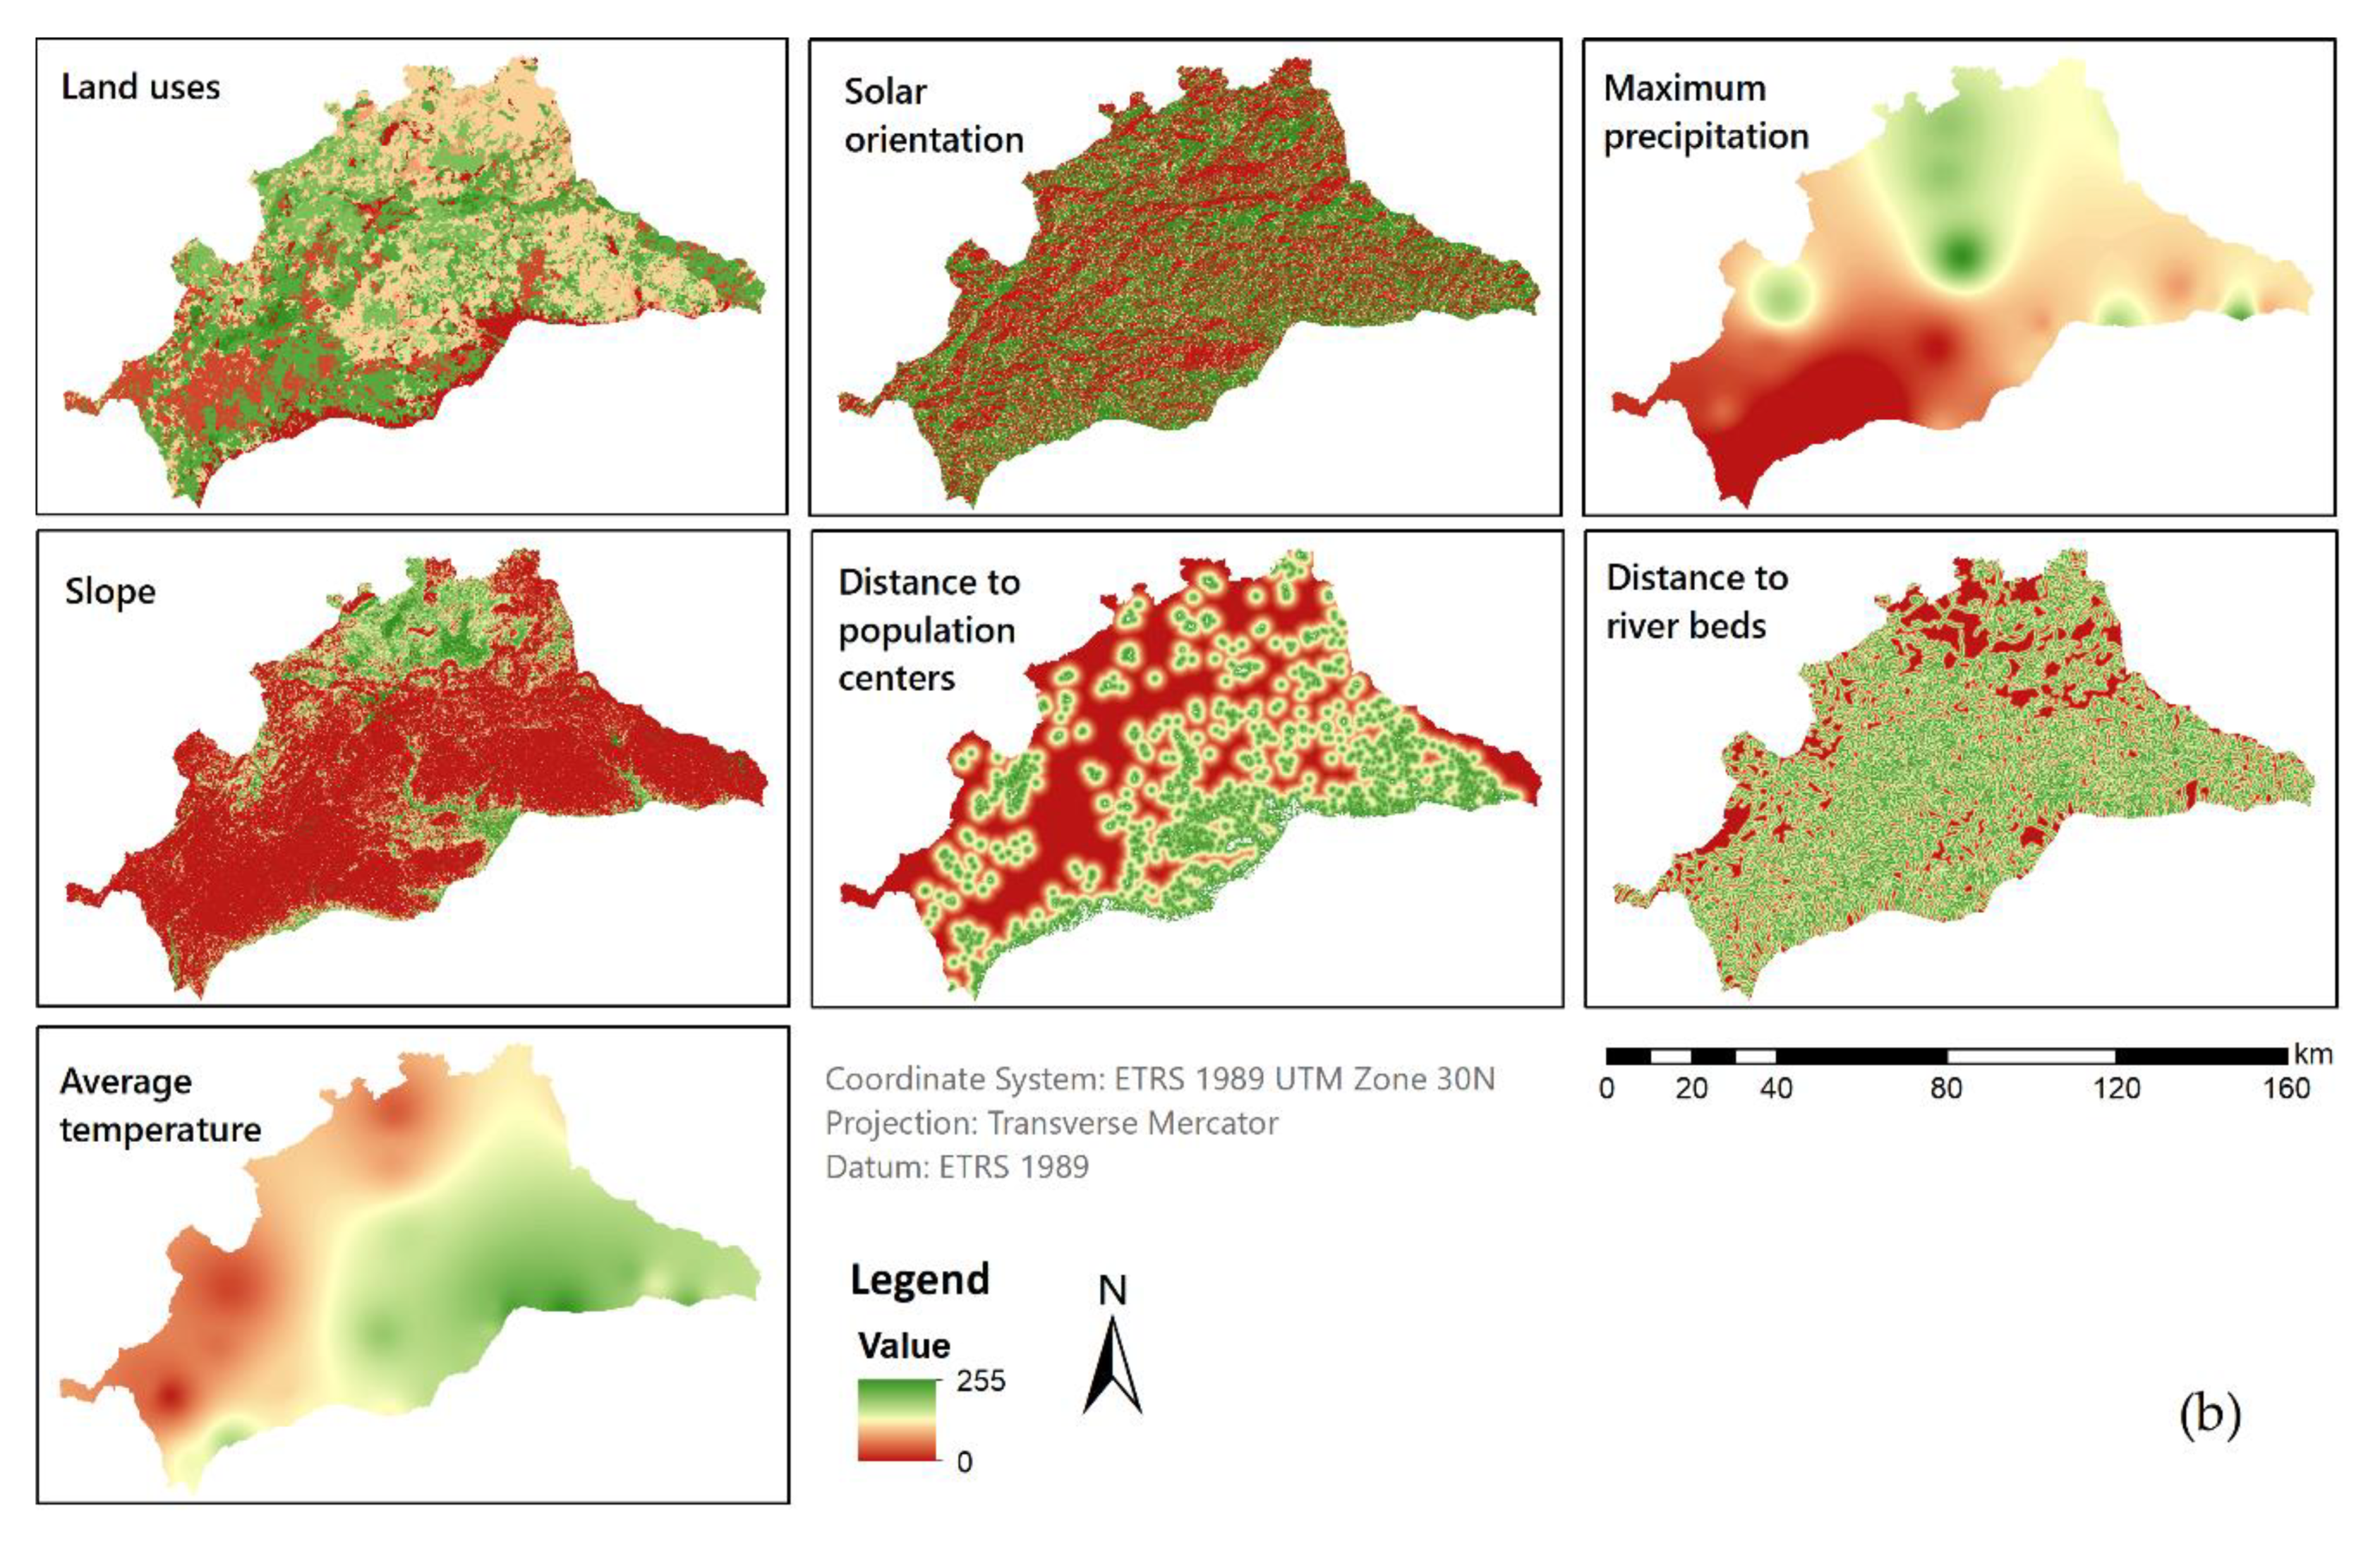
- Temperature. Concerning the temperature, the average was representative of the condition at which the METland will perform over time, especially influencing the growth of vegetation and the operational capabilities [44,63]. For macrophytes (the most common wetland plants) the optimum development temperature was 20 °C and the growth range from 16 to 27 °C. Temperatures above 30 °C and below 10 °C produce vegetative detention [64].
- Precipitation. The maximum precipitation notably influences the system for two reasons: the increase in the inlet water flow due to runoff and the influence of rain on the plants. Therefore, the existence of torrential rains produces a negative effect associated with a higher volume of water to be treated [65], decreasing the hydraulic retention time and forcing it to enlarge the system area [1].
- Solar orientation. The sunlight affects the development of vegetation, or more precisely the photosynthesis process. The most suitable orientation in the study area for vegetation was when the slope faces south due to its warmth and luminosity [66].
Socioeconomic Factors
- Land use. The adequacy for particular land use to build a CW design like METland was taken into account; for example, forests or crops were less suitable than open spaces with little or no vegetation. Furthermore, the economic cost, environmental impact and social appreciation were considered in the classification. The reclassification of land uses to a quantitative suitability scale of 0 to 10 was performed for each category with a value from 1 (no appropriate) to 10 (very appropriate), summarized in Table 1.
- Distance to river beds. The distance to the river is a factor that would influence the cost of construction, taking into account that the effluent water of the system would discharge into a river, fulfilling the limits of the current quality regulations [67]. In certain cases, the effluent water could be infiltrated on the ground or evaporated with specific systems such as the willow system.
- Distance to population centers. The distribution of the population in the study areas was analyzed in order to define the distance to the verified inhabited areas. This variable could be decisive in the location of the CW for several reasons. Firstly, the number of people determines the volume of WW produced. Secondly, the distance from the houses to the CW imposes the length of the conduction which transports the WW. Thirdly, the location of CW close to the population centers could help to change the idea of the sewage treatment plant to an environmentally sustainable garden. For the population layer, census data and cartography were used. The distribution of the census information to spatial units was performed within the dasymetric techniques [68,69,70,71]. Specifically, the Areal Weighting was used, proportionally transferring the information to the area. In this study, the method Filtered Areal Weighting was implemented, in which auxiliary information such as land use or coverage was needed to exclude uninhabited areas from the analysis [72]. It should be mentioned that in this case only the real residential area was considered. Firstly, the spatial location of the buildings of each province was intersected with the Spanish Land Cover Information System (SIOSE, Sistema de Información sobre Ocupación del Suelo en España) [73]. Therefore, all the areas with real homes or constructed areas dedicated to residential use were obtained. Secondly, the census sections with the number of people for each section were downloaded from the last available census (2011) [53]. Based on this data, spatial analysis was performed to determine the number of inhabitants per building based on the population density in each area. Thus, following this procedure, the area of each residential building with the number of inhabitants was obtained for each province. Once demography maps were finalized, it could be observed that the results match what was described in Section 2.1, concluding with a different distribution in each province.
- Slopes. CW should be constructed on low slope surfaces (from 0 to 15%) to get a gradual flow of WW from the inlet to the outlet and avoid overland flow during rainy seasons. In addition, the cost of earthworks and transport of soil is directly related to the slope [40].
2.2.2. Global Sensitivity Analysis
2.2.3. Optimization of Resources
3. Results and Discussion
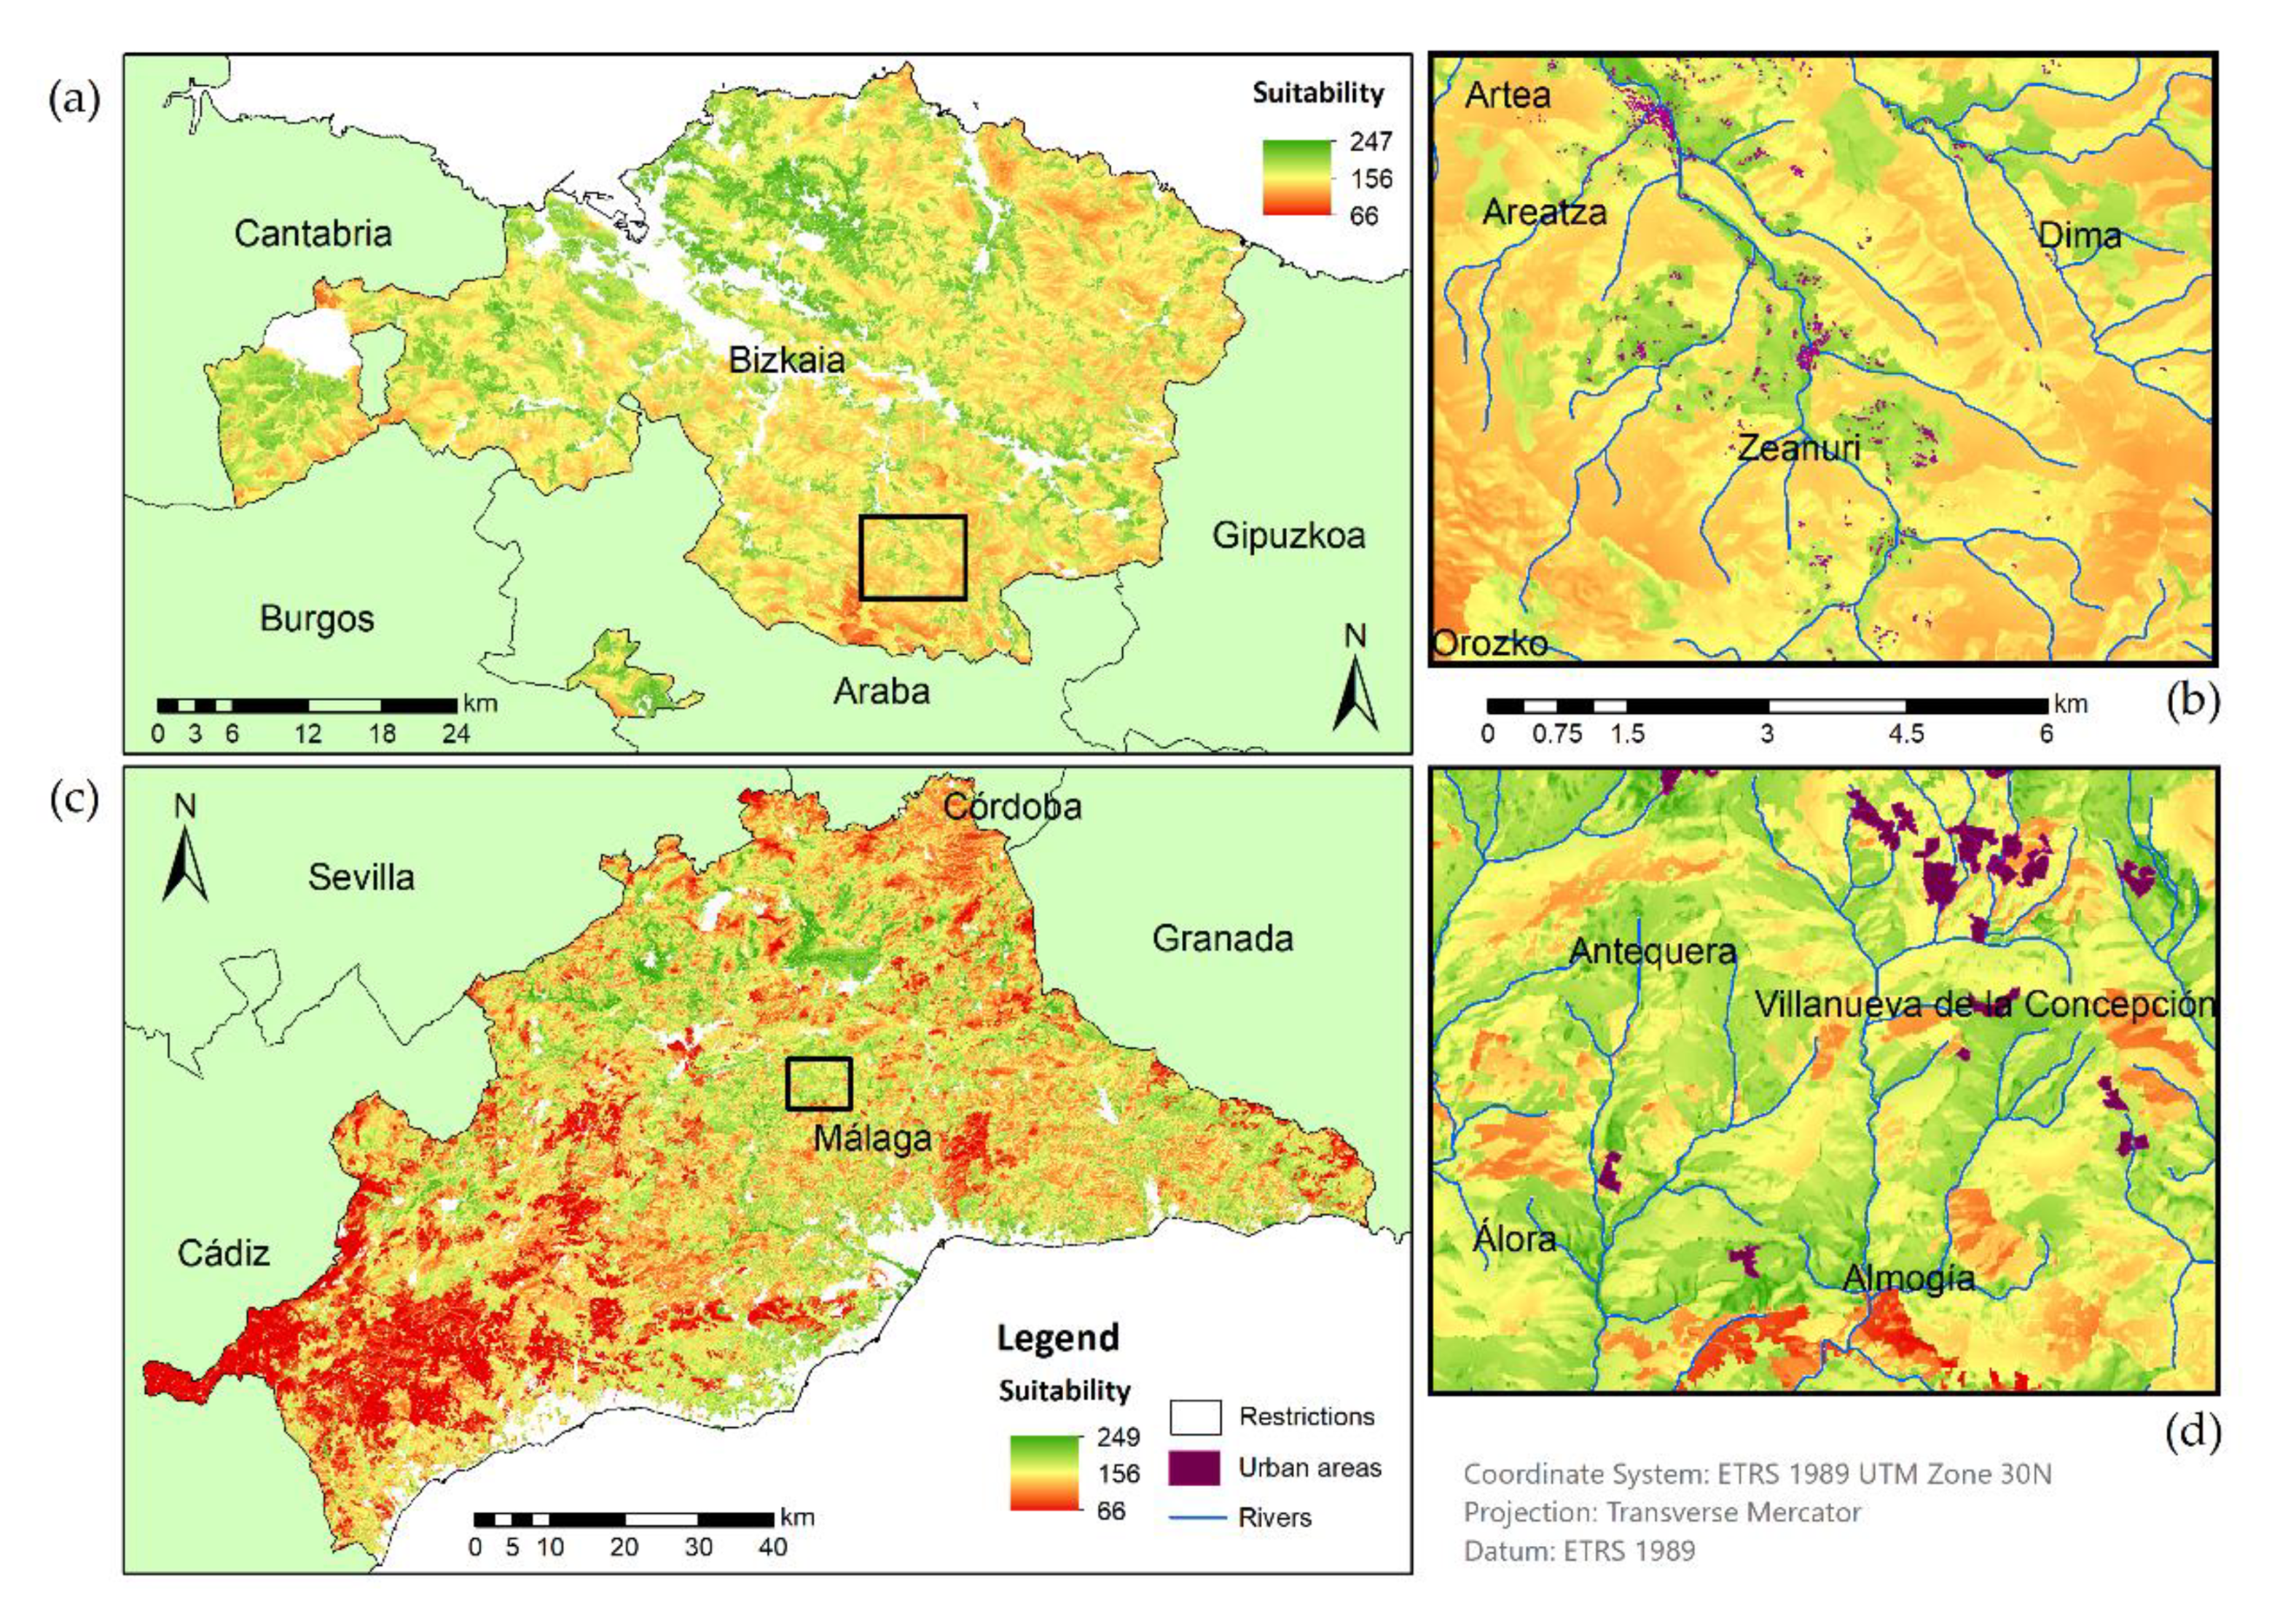
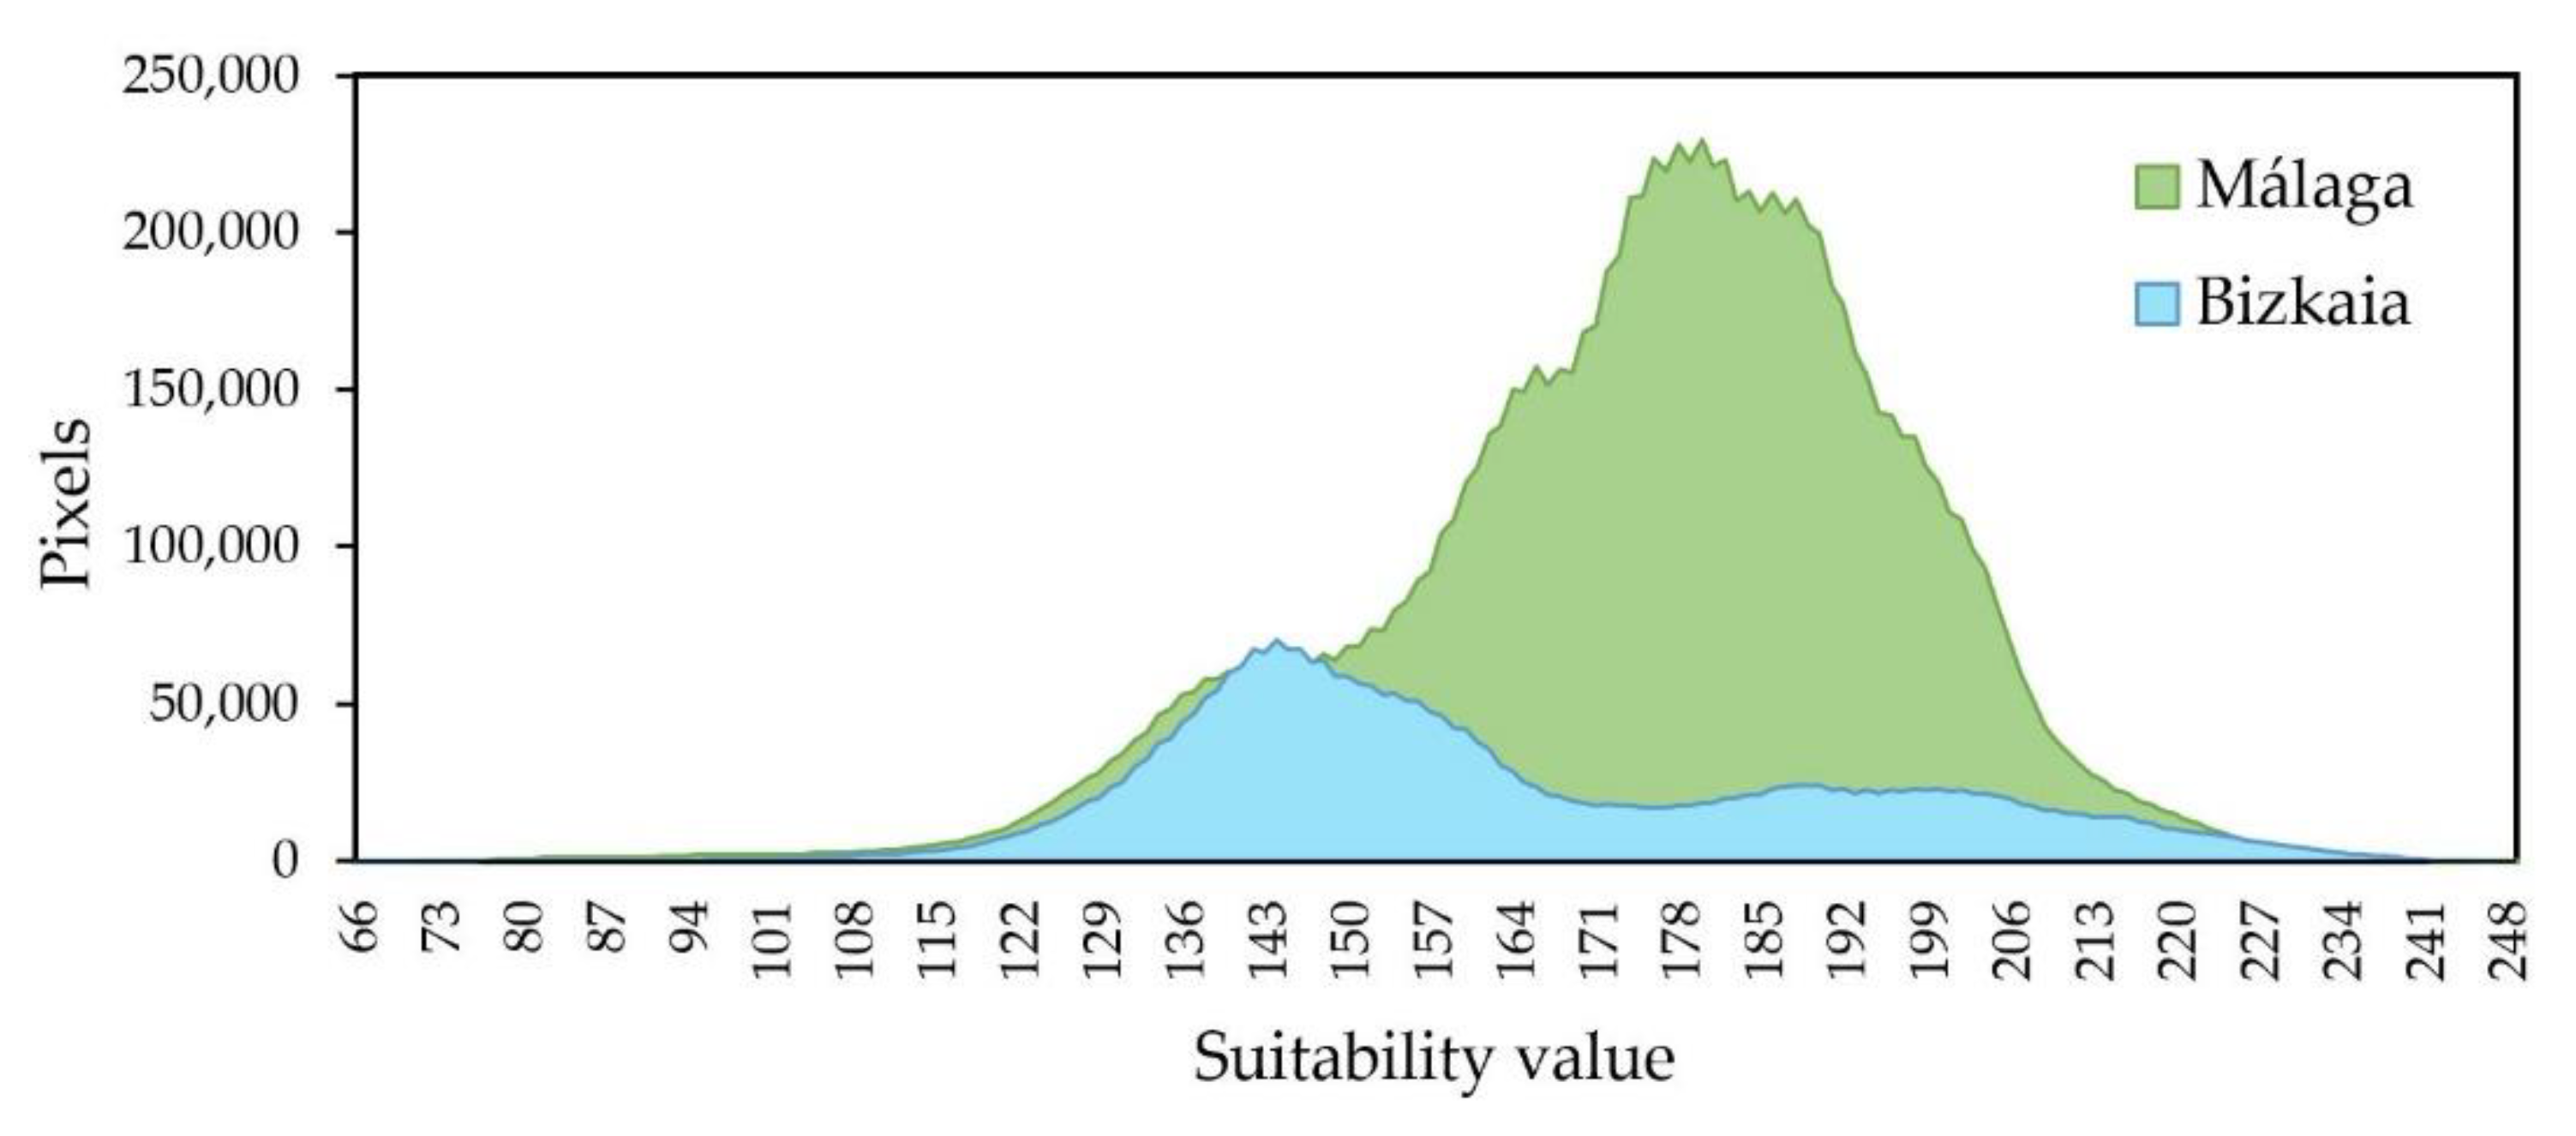
3.1. Multi-Criteria Evaluation of Two Independent Areas
3.2. Results of the GSA
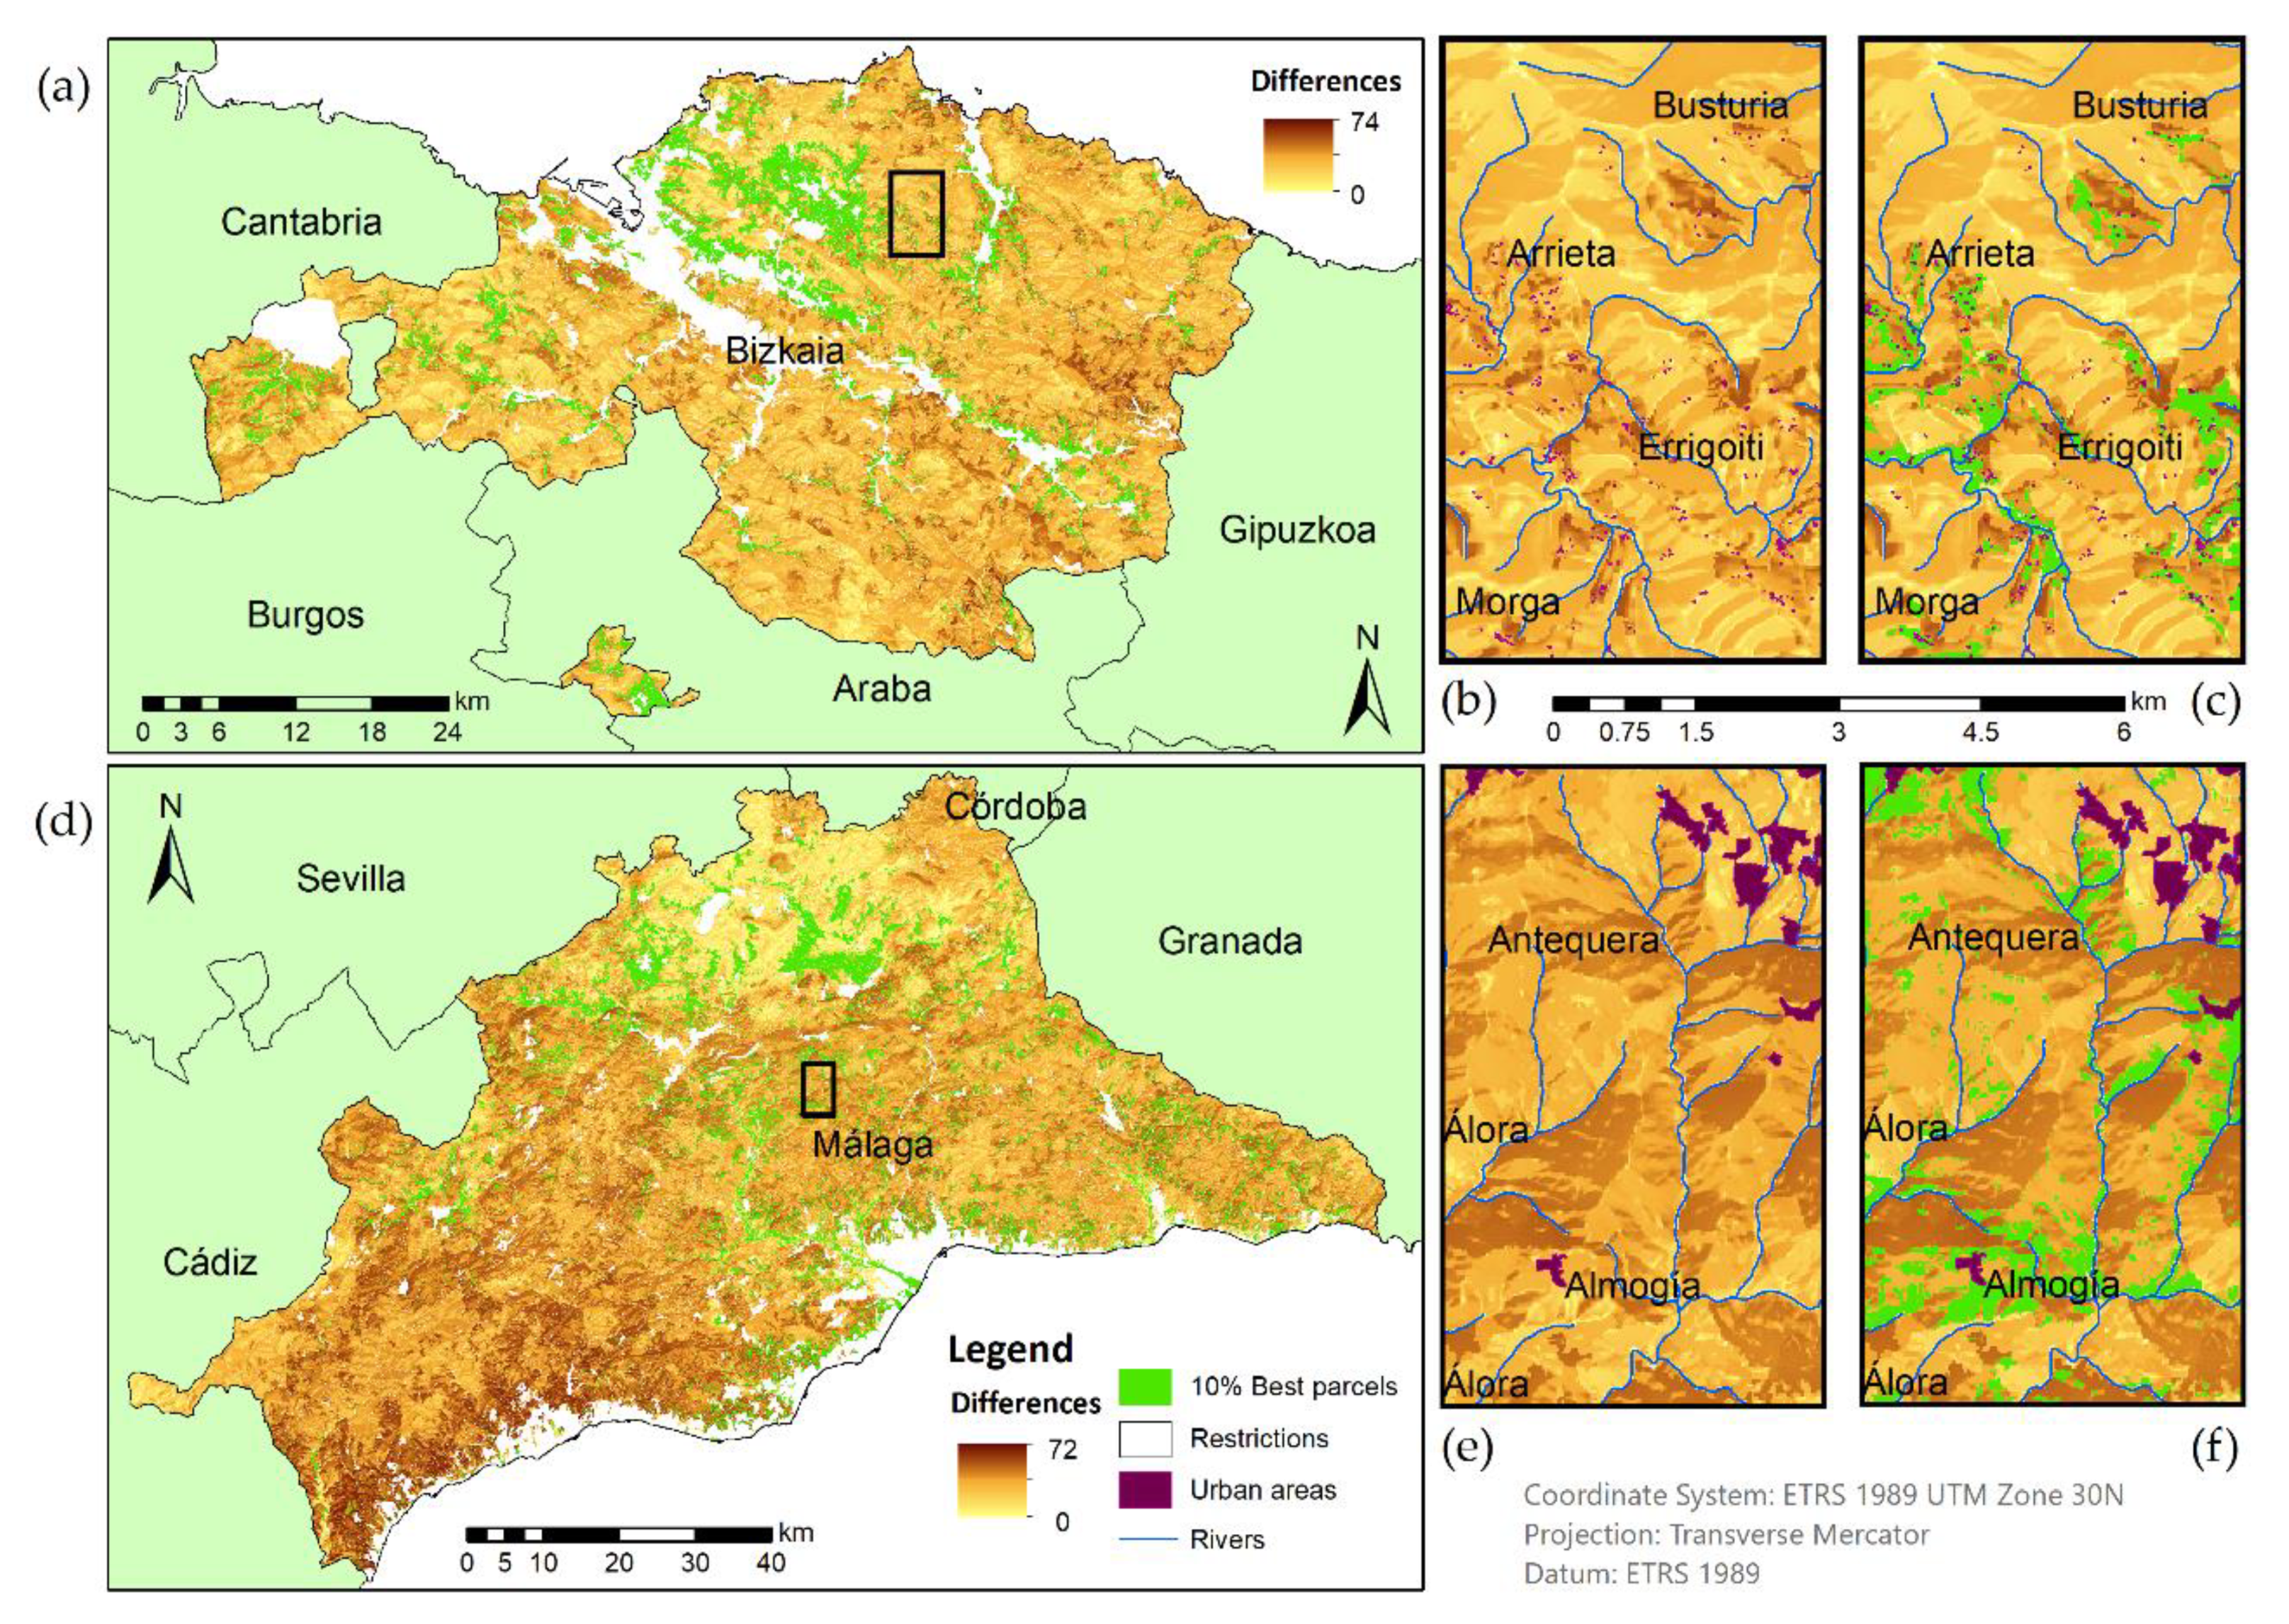
3.3. Optimization of Resources Based on the GSA
4. Conclusions
Author Contributions
Funding
Institutional Review Board Statement
Informed Consent Statement
Data Availability Statement
Conflicts of Interest
Nomenclature
| Abbreviation | Definition |
| AEMET | Spanish Agency of Meteorology |
| AHP | Analytical Hierarchy Process |
| CNIG | National Center of Geographical Information |
| CW | Constructed Wetland |
| DEM | Digital Elevation Model |
| GIS | Geographical Information Systems |
| GSA | Global Sensitivity Analysis |
| IGN | National Geographic Institute |
| INE | National Statistics Institute |
| MCE | Multi-Criteria Evaluation |
| MITECO | Ministry of Ecological Transition |
| MET | Microbial Electrochemical Technologies |
| OAT | One-At-a-Time approach |
| REDIAM | Environmental Information Network of Andalucía |
| SA | Sensibility Analysis |
| SIOSE | Spanish Land Cover Information System |
| WW | Wastewater |
| WWTs | Wastewater Treatments |
References
- Kadlec, R.H.; Wallace, S.D. Treatment Wetlands, 2nd ed.; CRC Press: New York, NY, USA, 2008; ISBN 1566705266. [Google Scholar]
- Vymazal, J. Constructed Wetlands for Wastewater Treatment. Water 2010, 2, 530–549. [Google Scholar] [CrossRef] [Green Version]
- Kadlec, R.H.; Knight, R.; Vymazal, J.; Brix, H.; Cooper, P.; Haberl, R. Constructed Wetlands for Pollution Control Processes, Performance, Design and Operation; IWA Publishing: London, UK, 2000; Volume 8, ISBN 1900222051. [Google Scholar]
- Rahman, M.E.; Halmi, M.I.E.; Bin; Samad, M.Y.B.A.; Uddin, M.K.; Mahmud, K.; Shukor, M.Y.A.; Abdullah, S.R.S.; Shamsuzzaman, S.M. Design, operation and optimization of constructed wetland for removal of pollutant. Int. J. Environ. Res. Public Health 2020, 17, 8339. [Google Scholar] [CrossRef]
- Brix, H.; Koottatep, T.; Fryd, O.; Laugesen, C.H. The flower and the butterfly constructed wetland system at Koh Phi Phi-System design and lessons learned during implementation and operation. Ecol. Eng. 2011, 37, 729–735. [Google Scholar] [CrossRef] [Green Version]
- Vymazal, J. Constructed wetlands for treatment of industrial wastewaters: A review. Ecol. Eng. 2014, 73, 724–751. [Google Scholar] [CrossRef]
- Ramírez-Vargas, C.A.; Prado, A.; Arias, C.A.; Carvalho, P.N.; Esteve-Núñez, A.; Brix, H. Microbial Electrochemical Technologies for Wastewater Treatment: Principles and Evolution from Microbial Fuel Cells to Bioelectrochemical-Based Constructed Wetlands. Water 2018, 10, 1128. [Google Scholar] [CrossRef] [Green Version]
- Wang, X.; Aulenta, F.; Puig, S.; Esteve-Núñez, A.; He, Y.; Mu, Y.; Rabaey, K. Microbial electrochemistry for bioremediation. Environ. Sci. Ecotechnol. 2020, 1, 100013. [Google Scholar] [CrossRef]
- Aguirre-Sierra, A.; Bacchetti-De Gregoris, T.; Berná, A.; Salas, J.J.; Aragón, C.; Esteve-Núñez, A. Microbial electrochemical systems outperform fixed-bed biofilters in cleaning up urban wastewater. Environ. Sci. Water Res. Technol. 2016, 2, 984–993. [Google Scholar] [CrossRef]
- Esteve-Núñez, A.; Busalmen, J.P.; Berná, A.; Gutiérrez-Garrán, C.; Feliu, J.M. Opportunities behind the unusual ability of geobacter sulfurreducens for exocellular respiration and electricity production. Energy Environ. Sci. 2011, 4, 2066–2069. [Google Scholar] [CrossRef]
- Chen, S.; Rotaru, A.-E.E.; Shrestha, P.M.; Malvankar, N.S.; Liu, F.; Fan, W.; Nevin, K.P.; Lovley, D.R. Promoting Interspecies Electron Transfer with Biochar. Sci. Rep. 2014, 4, 1–7. [Google Scholar] [CrossRef] [PubMed] [Green Version]
- Pun, Á.; Boltes, K.; Letón, P.; Esteve-Nuñez, A. Detoxification of wastewater containing pharmaceuticals using horizontal flow bioelectrochemical filter. Bioresour. Technol. Rep. 2019, 7, 100296. [Google Scholar] [CrossRef]
- Ramírez-Vargas, C.A.; Arias, C.A.; Carvalho, P.; Zhang, L.; Esteve-Núñez, A.; Brix, H. Electroactive biofilm-based constructed wetland (EABB-CW): A mesocosm-scale test of an innovative setup for wastewater treatment. Sci. Total Environ. 2019, 659, 796–806. [Google Scholar] [CrossRef]
- Prado, A.; Ramírez-Vargas, C.A.; Arias, C.A.; Esteve-Núñez, A. Novel bioelectrochemical strategies for domesticating the electron flow in constructed wetlands. Sci. Total Environ. 2020, 735, 139522. [Google Scholar] [CrossRef] [PubMed]
- Aguirre-Sierra, A.; Bacchetti-De Gregoris, T.; Salas, J.J.; de Deus, A.; Esteve-Núñez, A. A new concept in constructed wetlands: Assessment of aerobic electroconductive biofilters. Environ. Sci. Water Res. Technol. 2020, 6, 1312–1323. [Google Scholar] [CrossRef]
- Peñacoba-Antona, L.; Senán-Salinas, J.; Aguirre-Sierra, A.; Letón, P.; Salas, J.J.; García-Calvo, E.; Esteve-Núñez, A. Assessing METland® design and performance through LCA: Techno-environmental study with multifunctional unit perspective. Front. Microbiol. 2021. [Google Scholar] [CrossRef]
- Aguirre-Sierra, M.A.; Esteve-Núñez, A.; Salas-Rodriguez, J.J. Integrating Microbial Electrochemical Systems in Constructed Wetlands, a New Paradigm for Treating Wastewater in Small Communities. Ph.D. Thesis, University of Alcalá, Madrid, Spain, 2017. [Google Scholar]
- Prado, A.; Berenguer, R.; Esteve-Núñez, A. Electroactive biochar outperforms highly conductive carbon materials for biodegrading pollutants by enhancing microbial extracellular electron transfer. Carbon 2019, 146, 597–609. [Google Scholar] [CrossRef] [Green Version]
- Schievano, A.; Berenguer, R.; Goglio, A.; Bocchi, S.; Marzorati, S.; Rago, L.; Louro, R.O.; Paquete, C.M.; Esteve-Núñez, A. Electroactive Biochar for Large-Scale Environmental Applications of Microbial Electrochemistry. ACS Sustain. Chem. Eng. 2019, 7, 18198–18212. [Google Scholar] [CrossRef]
- Carver, S.J. Integrating multi-criteria evaluation with geographical information systems. Int. J. Geogr. Inf. Syst. 1991, 5, 321–339. [Google Scholar] [CrossRef] [Green Version]
- Assefa, T.; Jha, M.; Reyes, M.; Srinivasan, R.; Worqlul, A. Assessment of Suitable Areas for Home Gardens for Irrigation Potential, Water Availability, and Water-Lifting Technologies. Water 2018, 10, 495. [Google Scholar] [CrossRef] [Green Version]
- Chandio, I.A.; Matori, A.N.B.; WanYusof, K.B.; Talpur, M.A.H.; Balogun, A.-L.; Lawal, D.U. GIS-based analytic hierarchy process as a multicriteria decision analysis instrument: A review. Arab. J. Geosci. 2012, 6, 3059–3066. [Google Scholar] [CrossRef]
- Malczewski, J. GIS-based multicriteria decision analysis: A survey of the literature. Int. J. Geogr. Inf. Sci. 2006, 20, 703–726. [Google Scholar] [CrossRef]
- Mardani, A.; Jusoh, A.; Nor, K.M.D.; Khalifah, Z.; Zakwan, N.; Valipour, A. Multiple criteria decision-making techniques and their applications—A review of the literature from 2000 to 2014. Econ. Res. Istraz. 2015, 28, 516–571. [Google Scholar] [CrossRef]
- Saaty, T.L. Decision making with the analytic hierarchy process. Int. J. Serv. Sci. 2008, 1, 83–98. [Google Scholar] [CrossRef] [Green Version]
- Song, M.; Chen, D. An improved knowledge-informed NSGA-II for multi-objective land allocation (MOLA). Geo-Spat. Inf. Sci. 2018, 1–15. [Google Scholar] [CrossRef] [Green Version]
- Saaty, T.L. A scaling method for priorities in hierarchical structures. J. Math. Psychol. 1977, 15, 234–281. [Google Scholar] [CrossRef]
- Nekhay, O.; Arriaza, M.; Boerboom, L. Evaluation of soil erosion risk using Analytic Network Process and GIS: A case study from Spanish mountain olive plantations. J. Environ. Manag. 2009, 90, 3091–3104. [Google Scholar] [CrossRef]
- Malczewski, J.; Rinner, C. Multicriteria Decision Analysis in Geographic Information Science; Springer: New York, NY, USA, 2015; p. 331. [Google Scholar]
- Zhang, H.; Zhang, J.; Zhang, S.; Yu, C.; Sun, R.; Wang, D.; Zhu, C.; Zhang, J. Identification of Priority Areas for Soil and Water Conservation Planning Based on Multi-Criteria Decision Analysis Using Choquet Integral. Int. J. Environ. Res. Public Health 2020, 17, 1331. [Google Scholar] [CrossRef] [PubMed] [Green Version]
- Paul, M.; Negahban-Azar, M.; Shirmohammadi, A.; Montas, H. Assessment of agricultural land suitability for irrigation with reclaimed water using geospatial multi-criteria decision analysis. Agric. Water Manag. 2020, 231, 105987. [Google Scholar] [CrossRef]
- Perpiña, C.; Martínez-Llario, J.C.; Pérez-Navarro, Á. Multicriteria assessment in GIS environments for siting biomass plants. Land Use Policy 2013, 31, 326–335. [Google Scholar] [CrossRef]
- Ristić, V.; Maksin, M.; Nenković-Riznić, M.; Basarić, J. Land-use evaluation for sustainable construction in a protected area: A case of Sara mountain national park. J. Environ. Manag. 2018, 206, 430–445. [Google Scholar] [CrossRef]
- Vavatsikos, A.P.; Arvanitidou, A.; Petsas, D. Wind farm investments portfolio formation using GIS-based suitability analysis and simulation procedures. J. Environ. Manag. 2019, 252, 109670. [Google Scholar] [CrossRef]
- Chang, N.-B.; Parvathinathan, G.; Breeden, J.B. Combining GIS with fuzzy multicriteria decision-making for landfill siting in a fast-growing urban region. J. Environ. Manag. 2008, 87, 139–153. [Google Scholar] [CrossRef]
- Manos, B.; Papathanasiou, J.; Bournaris, T.; Voudouris, K. A multicriteria model for planning agricultural regions within a context of groundwater rational management. J. Environ. Manag. 2010, 91, 1593–1600. [Google Scholar] [CrossRef] [PubMed]
- Rodríguez-Espinosa, V.M.; Aguilera-Benavente, F.; Gómez-Delgado, M. Green infrastructure design using GIS and spatial analysis: A proposal for the Henares Corridor (Madrid-Guadalajara, Spain). Landsc. Res. 2020, 45, 26–43. [Google Scholar] [CrossRef]
- Inamdar, P.M.; Sharma, A.K.; Cook, S.; Perera, B.J.C. Evaluation of stormwater harvesting sites using multi criteria decision methodology. J. Hydrol. 2018, 562, 181–192. [Google Scholar] [CrossRef]
- Zhao, Y.W.; Qin, Y.; Chen, B.; Zhao, X.; Li, Y.; Yin, X.A.; Chen, G.Q. GIS-based optimization for the locations of sewage treatment plants and sewage outfalls—A case study of Nansha District in Guangzhou City, China. Commun. Nonlinear Sci. Numer. Simul. 2009, 14, 1746–1757. [Google Scholar] [CrossRef]
- Deepa, K.; Krishnaveni, M. Suitable Site Selection of Decentralised Treatment Plants Using Multicriteria Approach in GIS. J. Geogr. Inf. Syst. 2012, 4, 254–260. [Google Scholar] [CrossRef] [Green Version]
- Anagnostopoulos, K.P.; Vavatsikos, A.P. Using GIS and fuzzy logic for wastewater treatment processes site selection: The case of Rodopi prefecture. AIP Conf. Proc. 2007, 963, 851–855. [Google Scholar] [CrossRef]
- Anagnostopoulos, K.; Vavatsikos, A. Site Suitability Analysis for Natural Systems for Wastewater Treatment with Spatial Fuzzy Analytic Hierarchy Process. J. Water Resour. Plan. Manag. 2012, 138, 125–134. [Google Scholar] [CrossRef]
- Demesouka, O.E.; Vavatsikos, A.P.; Anagnostopoulos, K.P. Spatial UTA (S-UTA)—A new approach for raster-based GIS multicriteria suitability analysis and its use in implementing natural systems for wastewater treatment. J. Environ. Manag. 2013, 125, 41–54. [Google Scholar] [CrossRef]
- Gemitzi, A.; Tsihrintzis, V.A.; Christou, O.; Petalas, C. Use of GIS in siting stabilization pond facilities for domestic wastewater treatment. J. Environ. Manag. 2007, 82, 155–166. [Google Scholar] [CrossRef]
- Vavatsikos, A.P.; Demesouka, O.E.; Anagnostopoulos, K.P. GIS-based suitability analysis using fuzzy PROMETHEE. J. Environ. Plan. Manag. 2020, 63, 604–628. [Google Scholar] [CrossRef]
- White, D.; Fennessy, S. Modeling the suitability of wetland restoration potential at the watershed scale. Ecol. Eng. 2005, 24, 359–377. [Google Scholar] [CrossRef]
- Dai, C.; Guo, H.C.; Tan, Q.; Ren, W. Development of a constructed wetland network for mitigating nonpoint source pollution through a GIS-based watershed-scale inexact optimization approach. Ecol. Eng. 2016, 96, 94–108. [Google Scholar] [CrossRef]
- Uuemaa, E.; Hughes, A.; Tanner, C. Identifying Feasible Locations for Wetland Creation or Restoration in Catchments by Suitability Modelling Using Light Detection and Ranging (LiDAR) Digital Elevation Model (DEM). Water 2018, 10, 464. [Google Scholar] [CrossRef] [Green Version]
- Moreno-Mateos, D.; Mander, Ü.; Pedrocchi, C. Optimal Location of Created and Restored Wetlands in Mediterranean Agricultural Catchments. Water Resour. Manag. 2010, 24, 2485–2499. [Google Scholar] [CrossRef] [Green Version]
- Lilburne, L.; Tarantola, S. Sensitivity analysis of spatial models. Int. J. Geogr. Inf. Sci. 2009, 23, 151–168. [Google Scholar] [CrossRef] [Green Version]
- Plata-Rocha, W.; Gómez-Delgado, M.; Bosque-Sendra, J. Proposal for the Introduction of the Spatial Perspective in the Application of Global Sensitivity Analysis. J. Geogr. Inf. Syst. 2012, 4, 503–513. [Google Scholar] [CrossRef] [Green Version]
- Gómez-Delgado, M.; Tarantola, S. Global sensitivity analysis, GIS and multi-criteria evaluation for a sustainable planning of a hazardous waste disposal site in Spain. Int. J. Geogr. Inf. Sci. 2006, 20, 449–466. [Google Scholar] [CrossRef]
- INE National Statistics Institute (Spain), Census Download Center. Available online: https://www.ine.es/dyngs/INEbase/en/categoria.htm?c=Estadistica_P&cid=1254735572981 (accessed on 2 February 2020).
- AEMET State Meteorological Agency—AEMET—Spanish Government. Available online: http://www.aemet.es/en/lineas_de_interes/centro_de_documentacion (accessed on 28 January 2020).
- QGIS Geographic Information System. Open Source Geospatial Foundation Project, 2.18.21. Available online: https://www.qgis.org/en/site/ (accessed on 12 September 2018).
- TerrSet. TerrSet Software Features, IDRISI; Clark Labs, Clark University: Worcester, MA, USA, 2018. [Google Scholar]
- ESRI. ArcGIS 10.4; Environmental Systems Research Institute: Redlands, CA, USA, 2016. [Google Scholar]
- Daly, C.; Helmer, E.H.; Quiñones, M. Mapping the climate of Puerto Rico, Vieques and Culebra. Int. J. Climatol. 2003, 23, 1359–1381. [Google Scholar] [CrossRef]
- Huang, Y. Triangular irregular network generation and topographical modeling. Comput. Ind. 1989, 12, 203–213. [Google Scholar] [CrossRef]
- Oliver, M.A.; Webester, R. Kriging: A method of interpolation for geographical information systems. Int. J. Geogr. Inf. Syst. 1990, 4, 313–332. [Google Scholar] [CrossRef]
- Lam, N.S. Spatial Interpolation. Int. Encycl. Hum. Geogr. 2009, 369–376. [Google Scholar] [CrossRef]
- REDIAM Red de Información Ambiental de Andalucía. Available online: http://descargasrediam.cica.es/repo/s/RUR (accessed on 9 September 2018).
- Akratos, C.S.; Tsihrintzis, V.A. Effect of temperature, HRT, vegetation and porous media on removal efficiency of pilot-scale horizontal subsurface flow constructed wetlands. Ecol. Eng. 2007, 29, 173–191. [Google Scholar] [CrossRef]
- Fernández-González, J.; De Miguel-Beascoechea, E.; de Miguel-Muñoz, J.; Curt-Fernández de la Mora, M.D. Fitodepuración. Filtros de Macrofitas en Flotación, 1st ed.; EDITA: Madrid, Spain, 2014. [Google Scholar]
- Ulrich, B.A.; Loehnert, M.; Higgins, C.P. Improved contaminant removal in vegetated stormwater biofilters amended with biochar. Environ. Sci. Water Res. Technol. 2017, 3, 726–734. [Google Scholar] [CrossRef]
- Fu, P.; Rich, P.M. A geometric solar radiation model with applications in agriculture and forestry. Comput. Electron. Agric. 2003, 37, 25–35. [Google Scholar] [CrossRef]
- EEC. Council Directive 91/271/EEC of 21 May 1991 Concerning Urban Waste-Water Treatment; EEC: Brussels, Belgium, 1991. [Google Scholar]
- Cocero-Matesanz, D.; García Lazaro, F.J.; Santos Preciado, J.M. Propuesta Metodológica para la Desagregacion Espacial De Variables Sociodemográficas Con Sistemas De Información Geográfica Y Teledetección. Cuad. Geográficos 2006, 39, 7–22. [Google Scholar]
- Barreira González, P.; Aguilera-Benavente, F.; Gómez-Delgado, M. Partial validation of cellular automata based model simulations of urban growth: An approach to assessing factor influence using spatial methods. Environ. Model. Softw. 2015, 69, 77–89. [Google Scholar] [CrossRef]
- Santos Preciado, J.M. La cartografía catastral y su utilización en la desagregación de la población. Aplicación al análisis de la distribución espacial de la población en el municipio de Leganés (Madrid). Estud. Geográficos 2015, 76, 309–333. [Google Scholar] [CrossRef] [Green Version]
- Fernández-Noguerol, S. Desarrollo de herramientas para el tratamiento de la información y el análisis con SIG de los usos del suelo utilizando el SIOSE. Una aproximación al caso de Asturias. GeoFocus Rev. Int. Cienc. Tecnol. Inf. Geográfica 2017, 20, 233–251. [Google Scholar] [CrossRef] [Green Version]
- Mora-García, R.T.; Marti-Ciriquian, P. Desagregación poblacional a partir de datos catastrales. In Análisis Espacial y Representación Geográfica: Innovación y Aplicación; Universidad de Zaragoza-AGE: Saragossa, Spain, 2015; pp. 305–314. [Google Scholar]
- IGN National Geographic Institute (Spain), Download Center CNIG. Available online: http://centrodedescargas.cnig.es/CentroDescargas/locale?request_locale=en# (accessed on 9 September 2018).
- MITECO Hydrographic Network. Available online: https://www.miteco.gob.es/en/cartografia-y-sig/ide/descargas/agua/red-hidrografica.aspx (accessed on 9 September 2020).
- Gómez-Delgado, M.; Barredo-Cano, J.I. Sistemas de Información Geográfica y Evaluación Multicriterio En La Ordenación Del Territorio; RA-MA S.A.: Madrid, Spain, 2005. [Google Scholar]
- Baroni, G.; Tarantola, S. A General Probabilistic Framework for uncertainty and global sensitivity analysis of deterministic models: A hydrological case study. Environ. Model. Softw. 2014, 51, 26–34. [Google Scholar] [CrossRef]
- Şalap-Ayça, S.; Jankowski, P. Integrating local multi-criteria evaluation with spatially explicit uncertainty-sensitivity analysis. Spat. Cogn. Comput. 2016, 16, 106–132. [Google Scholar] [CrossRef]
- Ligmann-Zielinska, A.; Jankowski, P. Spatially-explicit integrated uncertainty and sensitivity analysis of criteria weights in multicriteria land suitability evaluation. Environ. Model. Softw. 2014, 57, 235–247. [Google Scholar] [CrossRef]
- Saltelli, A.; Annoni, P.; Azzini, I.; Campolongo, F.; Ratto, M.; Tarantola, S. Variance based sensitivity analysis of model output. Design and estimator for the total sensitivity index. Comput. Phys. Commun. 2010, 181, 259–270. [Google Scholar] [CrossRef]
- Chen, Y.; Yu, J.; Khan, S. The spatial framework for weight sensitivity analysis in AHP-based multi-criteria decision making. Environ. Model. Softw. 2013, 48, 129–140. [Google Scholar] [CrossRef]
- Saltelli, A.; Tarantola, S.; Chan, K. A role for sensitivity analysis in presenting the results from MCDA studies to decision makers. J. Multi-Criteria Decis. Anal. 1999, 8, 139–145. [Google Scholar] [CrossRef]
- Ligmann-Zielinska, A. Spatially-explicit sensitivity analysis of an agent-based model of land use change. Int. J. Geogr. Inf. Sci. 2013, 27, 1764–1781. [Google Scholar] [CrossRef]
- Nossent, J.; Elsen, P.; Bauwens, W. Sobol’ sensitivity analysis of a complex environmental model. Environ. Model. Softw. 2011, 26, 1515–1525. [Google Scholar] [CrossRef]
- SIMLAB Software for Uncertainty and Sensitivity Analysisis; Version 2.2; JRC: Ispra, Italy, 2008.
- Sobol, I.M. Sensitivity estimates for nonlinear mathematical models. Math. Model. Comput. Exp. 1993, 1, 407–414. [Google Scholar]
- Sun, Z.; Lorscheid, I.; Millington, J.D.; Lauf, S.; Magliocca, N.R.; Groeneveld, J.; Balbi, S.; Nolzen, H.; Müller, B.; Schulze, J.; et al. Simple or complicated agent-based models? A complicated issue. Environ. Model. Softw. 2016, 86, 56–67. [Google Scholar] [CrossRef] [Green Version]
- Palmeri, L.; Trepel, M. A GIS-Based Score System for Siting and Sizing of Created or Restored Wetlands: Two Case Studies. Water Resour. Manag. 2002, 16, 307–328. [Google Scholar] [CrossRef]


| Land Use * | Value |
|---|---|
| Forests | 1 |
| Permanently irrigated land | 3 |
| Rice fields | 3 |
| Permanent crops | 4 |
| Agro-forestry areas | 4 |
| Land principally occupied by agriculture, with significant areas of vegetation | 6 |
| Complex cultivation patterns | 7 |
| Annual crops associated with permanent crops | 7 |
| Non-irrigated arable land | 8 |
| Pastures | 9 |
| Scrub and/or herbaceous vegetation associations | 9 |
| Sparsely vegetated areas | 10 |
| Burnt areas | 10 |
| Factor | Scale | Origin | Description | Reclassification | Normalization Function |
|---|---|---|---|---|---|
| Average temperature | 1:25,000 | AEMET, REDIAM and Provincial Council of Bizkaia | Average temperature interpolated based on the meteorological stations. | Growth range from 16 °C to 27 °C. | Linear monotonically increasing function (a = min., b = max.) |
| Maximum precipitation | 1:25,000 | AEMET, REDIAM and Provincial Council of Bizkaia | Maximum precipitation interpolated based on the meteorological stations. | The suitability decrease as higher maximum precipitation value. | Linear monotonically increasing function (a = min., b = max.) |
| Solar orientation | 1:25,000 | CNIG Download Center [73] | Land classification regarding the solar orientation based on the DEM. | The suitability increase in the south-oriented zones. | Symmetrical sigmoidal function (a = 45, b = 135, c = 225, d = 270) |
| Land use | 1:100,000 | CORINE Land Cover Project of IGN 2012 | Reclassification of the land use database, according to high, medium o low level of suitability. | Land uses with special environmental or economic value are less suitable for the system. | Linear monotonically increasing function (a = 0, b = 10) |
| Distance to river beds | 1:25,000 | Water network database [74] | Distance to each river of the national water network in Spain. | Highest suitability values for places closer to the river systems. | Linear monotonically decreasing function (c = 25, d = max.) |
| Distance to population centers | 1:25,000 | INE, IGN, SIOSE [73] | Distance to inhabited areas considering from one household to cities. Avoiding non-residential buildings. | Areas closer to inhabited buildings are more suitable for construction. | Linear monotonically decreasing function (c = 25, d = max.) |
| Slope | 1:25,000 | CNIG Download Center [73] | Reclassification based on the percentage of slope suitable for the system. | Slopes between 0 and 15% have a linear suitability decrement. | Linear monotonically decreasing function (c = 0, d = 15) |
| Criteria | Sub-Criteria | Weight |
|---|---|---|
| Environmental (w = 0.2) | Average temperature (w = 0.2) | 0.04 |
| Maximum precipitation (w = 0.5) | 0.1 | |
| Solar orientation (w = 0.3) | 0.06 | |
| Socio-economic (w = 0.8) | Land use (w = 0.25) | 0.2 |
| Distance to river beds (w = 0.3) | 0.24 | |
| Distance to population centers (w = 0.3) | 0.24 | |
| Slopes (w = 0.15) | 0.12 |
| Oceanic Location | Mediterranean Location | ||||
|---|---|---|---|---|---|
| Criteria | Distribution | μ | σ | μ | σ |
| 1. Land use | Discrete | 89.17 | 96.89 | 139.72 | 81.89 |
| 2. Solar orientation | Discrete | 106.85 | 113.17 | 120.92 | 114.73 |
| 3. Maximum precipitation | Beta | 164.96 | 38.50 | 172.23 | 41.09 |
| 4. Slope | Discrete | 48.99 | 73.50 | 48.97 | 79.31 |
| 5. Distance to population centers | Triangular | 227.68 | 36.45 | 223.25 | 39.73 |
| 6. Distance to river beds | Triangular | 224.01 | 43.37 | 226.97 | 45.32 |
| 7. Average temperature | Beta | 174.15 | 31.71 | 125.72 | 48.68 |
| Oceanic Location | Mediterranean Location | |||
|---|---|---|---|---|
| Factors | 1° Order (Si) | Total (STi) | 1° Order (Si) | Total (STi) |
| 1. Land use | 0.385049 | 0.394324 | 0.319312 | 0.321843 |
| 2. Orientations | 0.055688 | 0.059115 | 0.071519 | 0.073032 |
| 3. Maximum precipitation | 0.011405 | 0.011606 | 0.004406 | 0.004590 |
| 4. Slopes | 0.089219 | 0.089736 | 0.101453 | 0.101764 |
| 5. Distance to population centers | 0.201431 | 0.212660 | 0.222358 | 0.234555 |
| 6. Distance to riverbeds | 0.200586 | 0.201577 | 0.233218 | 0.238349 |
| 7. Average temperature | 0.002476 | 0.002083 | 0.003301 | 0.002738 |
| w1 | 0.008062 | 0.017337 | 0.018631 | 0.021162 |
| w2 | −0.00126 | 0.002169 | 0.000649 | 0.002162 |
| w3 | 0.005028 | 0.005229 | 0.007073 | 0.007256 |
| w4 | 0.004267 | 0.004783 | 0.004141 | 0.004453 |
| w5 | 0.029389 | 0.040617 | 0.034407 | 0.046604 |
| w6 | 0.035728 | 0.036719 | 0.037700 | 0.042830 |
| w7 | −0.000625 | −0.00102 | 0.0000458 | −0.000517 |
Publisher’s Note: MDPI stays neutral with regard to jurisdictional claims in published maps and institutional affiliations. |
© 2021 by the authors. Licensee MDPI, Basel, Switzerland. This article is an open access article distributed under the terms and conditions of the Creative Commons Attribution (CC BY) license (https://creativecommons.org/licenses/by/4.0/).
Share and Cite
Peñacoba-Antona, L.; Gómez-Delgado, M.; Esteve-Núñez, A. Multi-Criteria Evaluation and Sensitivity Analysis for the Optimal Location of Constructed Wetlands (METland) at Oceanic and Mediterranean Areas. Int. J. Environ. Res. Public Health 2021, 18, 5415. https://doi.org/10.3390/ijerph18105415
Peñacoba-Antona L, Gómez-Delgado M, Esteve-Núñez A. Multi-Criteria Evaluation and Sensitivity Analysis for the Optimal Location of Constructed Wetlands (METland) at Oceanic and Mediterranean Areas. International Journal of Environmental Research and Public Health. 2021; 18(10):5415. https://doi.org/10.3390/ijerph18105415
Chicago/Turabian StylePeñacoba-Antona, Lorena, Montserrat Gómez-Delgado, and Abraham Esteve-Núñez. 2021. "Multi-Criteria Evaluation and Sensitivity Analysis for the Optimal Location of Constructed Wetlands (METland) at Oceanic and Mediterranean Areas" International Journal of Environmental Research and Public Health 18, no. 10: 5415. https://doi.org/10.3390/ijerph18105415
APA StylePeñacoba-Antona, L., Gómez-Delgado, M., & Esteve-Núñez, A. (2021). Multi-Criteria Evaluation and Sensitivity Analysis for the Optimal Location of Constructed Wetlands (METland) at Oceanic and Mediterranean Areas. International Journal of Environmental Research and Public Health, 18(10), 5415. https://doi.org/10.3390/ijerph18105415