
Evolution of Cardiovascular Risk Factors in a Worker Cohort: A Cluster Analysis

 , ,
, ,  , , , , and
Abstract
:1. Introduction
2. Materials and Methods
2.1. Study Design and Participants
2.2. Variables and Data Collection
2.3. Analysis
2.4. Ethical Issues
3. Results
4. Discussion
5. Conclusions
Author Contributions
Funding
Institutional Review Board Statement
Informed Consent Statement
Data Availability Statement
Acknowledgments
Conflicts of Interest
Appendix A

| BODY MASS INDEX | |||||||||||||
|---|---|---|---|---|---|---|---|---|---|---|---|---|---|
| Time Point 1 | Time Point 2 | ||||||||||||
| Q. 1 | Q. 2 | Q. 3 | Q. 4 | p | Q. 1 | Q. 2 | Q. 3 | Q. 4 | p | ||||
| N (%) | N (%) | N (%) | N (%) | N (%) | N (%) | N (%) | N (%) | ||||||
| Time point 2 | Q. 1 | 814 (79.0%) | 143 (13.8%) | 15 (1.4%) | 2 (0.2%) | <0.001 | Time point 3 | Q. 1 | 819 (84.1%) | 156 (14.8%) | 11 (1.07%) | 1 (0.1%) | <0.001 |
| Q. 2 | 203 (19.7%) | 660 (63.9%) | 182 (17.3%) | 10 (1.0%) | Q. 2 | 140 (14.4%) | 679 (64.4%) | 155 (15.1%) | 9 (0.8%) | ||||
| Q. 3 | 14 (1.4%) | 221 (21.4%) | 658 (62.7%) | 134 (13.0%) | Q. 3 | 13 (1.3%) | 214 (20.3%) | 678 (66.0%) | 109 (10.0%) | ||||
| Q. 4 | 0 (0.0%) | 9 (0.9%) | 194 (18.5%) | 888 (85.9%) | Q. 4 | 2 (0.2%) | 6 (0.6%) | 183 (17.8%) | 972 (89.1%) | ||||
| BLOOD GLUCOSE | |||||||||||||
| Time point 1 | Time point 2 | ||||||||||||
| Q. 1 | Q. 2 | Q. 3 | Q. 4 | p | Q. 1 | Q. 2 | Q. 3 | Q. 4 | p | ||||
| N (%) | N (%) | N (%) | N (%) | N (%) | N (%) | N (%) | N (%) | ||||||
| Time point 2 | Q. 1 | 713 (64.0%) | 356 (35.2%) | 180 (16.8%) | 49 (5.2%) | <0.001 | Time point 3 | Q. 1 | 1103 (85.0%) | 790 (74.0%) | 458 (45.8%) | 107 (13.7%) | <0.001 |
| Q. 2 | 260 (23.3%) | 351 (34.8%) | 359 (33.5%) | 98 (10.3%) | Q. 2 | 140 (10.8%) | 181 (16.9%) | 279 (27.9%) | 113 (14.5%) | ||||
| Q. 3 | 106 (9.5%) | 239 (23.7%) | 372 (34.7%) | 282 (29.7%) | Q. 3 | 40 (3.1%) | 72 (6.7%) | 169 (16.9%) | 158 (20.2%) | ||||
| Q. 4 | 35 (3.1%) | 64 (6.3%) | 161 (15.0%) | 522 (54.9%) | Q. 4 | 15 (1.2%) | 25 (2.3%) | 93 (9.3%) | 404 (51.7%) | ||||
| CARDIOVASCULAR DISEASE RISK SCORE | |||||||||||||
| Time point 1 | Time point 2 | ||||||||||||
| Q. 1 | Q. 2 | Q. 3 | Q. 4 | p | Q. 1 | Q. 2 | Q. 3 | Q. 4 | p | ||||
| N(%) | N(%) | N(%) | N(%) | N(%) | N(%) | N(%) | N(%) | ||||||
| Time point 2 | Q. 1 | 722 (69.6%) | 15 (1.5%) | 0 (0.0%) | 0 (0.0%) | <0.001 | Time point 3 | Q. 1 | 618 (83.9%) | 28 (4.0%) | 6 (0.5%) | 10 (0.6%) | <0.001 |
| Q. 2 | 272 (26.2%) | 360 (34.8%) | 65 (6.3%) | 9 (0.9%) | Q. 2 | 115 (15.6%) | 353 (50.0%) | 85 (7.5%) | 18 (1.2%) | ||||
| Q. 3 | 38 (3.7%) | 544 (52.6%) | 453 (43.8%) | 108 (10.4%) | Q. 3 | 3 (0.4%) | 296 (41.9%) | 636 (55.6%) | 154 (9.9%) | ||||
| Q. 4 | 6 (0.6%) | 116 (11.2%) | 517 (50.0%) | 922 (88.7%) | Q. 4 | 1 (0.1%) | 29 (4.1%) | 416 (36.4%) | 1379 (88.3%) | ||||
| BODY MASS INDEX | |||||||||||||
|---|---|---|---|---|---|---|---|---|---|---|---|---|---|
| Time Point 1 | Time Point 2 | ||||||||||||
| Q. 1 N (%) | Q. 2 N (%) | Q. 3 N (%) | Q. 4 N (%) | p | Q. 1 N (%) | Q. 2 N (%) | Q. 3 N (%) | Q. 4 N (%) | p | ||||
| Cluster 1 | <0.001 | Time point 3 | Cluster 1 | <0.001 | |||||||||
| Time point 2 | Q. 1 | 789 (80.4%) | 125 (17.2%) | 10 (3.0%) | 1 (1.7%) | Q. 1 | 786 (85.0%) | 126 (16.3%) | 3 (0.8%) | 0 (0.0%) | |||
| Q. 2 | 179 (18.2%) | 481 (66.1%) | 106 (31.9%) | 5 (8.6%) | Q. 2 | 127 (13.7%) | 515 (66.8%) | 76 (22.1%) | 4 (6.8%) | ||||
| Q. 3 | 13 (1.3%) | 119 (16.3%) | 187 (56.3%) | 25 (43.1%) | Q. 3 | 11 (1.2%) | 126 (16.3%) | 220 (64.0%) | 18 (30.5%) | ||||
| Q. 4 | 0 (0.0%) | 3 (0.4%) | 29 (8.7%) | 27 (46.6%) | Q. 4 | 1 (0.1%) | 4 (0.5%) | 45 (13.1%) | 37 (62.7%) | ||||
| Time point 2 | Cluster 2 | <0.001 | Time point 3 | Cluster 2 | <0.001 | ||||||||
| Q. 1 | 25 (50.0%) | 18 (5.9%) | 5 (0.7%) | 1 (0.1%) | Q. 1 | 33 (67.3%) | 30 (10.6%) | 8 (1.2%) | 1 (0.1%) | ||||
| Q. 2 | 24 (48.0%) | 179 (58.7%) | 76 (10.6%) | 5 (0.5%) | Q. 2 | 13 (26.5%) | 164 (57.7%) | 79 (11.6%) | 5 (0.5%) | ||||
| Q. 3 | 1 (2.0%) | 102 (33.4%) | 471 (65.7%) | 109 (11.2%) | Q. 3 | 2 (4.1%) | 88 (31.0%) | 458 (67.1%) | 91 (8.8%) | ||||
| Q. 4 | 0 (0.0%) | 6 (2.0%) | 165 (23.0%) | 861 (88.2%) | Q. 4 | 1 (2.0%) | 2 (0.7%) | 138 (20.2%) | 935 (90.6%) | ||||
| BLOOD GLUCOSE | |||||||||||||
| Time point 1 | Time point 2 | ||||||||||||
| Q. 1 N (%) | Q. 2 N (%) | Q. 3 N (%) | Q. 4 N (%) | p | Q. 1 N (%) | Q. 2 N (%) | Q. 3 N (%) | Q. 4 N (%) | p | ||||
| Time point 2 | Cluster 1 | <0.001 | Time point 3 | Cluster 1 | <0.001 | ||||||||
| Q. 1 | 487 (67.5%) | 249 (39.6%) | 96 (19.5%) | 27 (10.5%) | Q. 1 | 765 (89.1%) | 520 (81.4%) | 257 (58.4%) | 40 (24.8%) | ||||
| Q. 2 | 172 (23.9%) | 234 (37.2%) | 193 (39.2%) | 40 (15.6%) | Q. 2 | 67 (7.8%) | 92 (14.4%) | 108 (24.5%) | 37 (23.0%) | ||||
| Q. 3 | 52 (7.2%) | 133 (21.1%) | 162 (32.9%) | 93 (36.2%) | Q. 3 | 19 (2.2%) | 23 (3.6%) | 56 (12.7%) | 35 (21.7%) | ||||
| Q. 4 | 10 (1.4%) | 13 (2.1%) | 41 (8.3%) | 97 (37.7%) | Q. 4 | 8 (0.9%) | 4 (0.6%) | 19 (4.3%) | 49 (30.4%) | ||||
| Time point 2 | Cluster 2 | <0.001 | Time point 3 | Cluster 2 | <0.001 | ||||||||
| Q. 1 | 226 (57.5%) | 107 (28.1%) | 84 (14.5%) | 22 (3.2%) | Q. 1 | 338 (77.0%) | 270 (62.9%) | 201 (36.0%) | 67 (10.8%) | ||||
| Q. 2 | 88 (22.4%) | 117 (30.7%) | 166 (28.6%) | 58 (8.4%) | Q. 2 | 73 (16.6%) | 89 (20.7%) | 171 (30.6%) | 76 (12.2%) | ||||
| Q. 3 | 54 (13.7%) | 106 (27.8%) | 210 (36.2%) | 189 (27.2%) | Q. 3 | 21 (4.8%) | 49 (11.4%) | 113 (20.2%) | 123 (19.8%) | ||||
| Q. 4 | 25 (6.4%) | 51 (13.4%) | 120 (20.7%) | 425 (61.2%) | Q. 4 | 7 (1.6%) | 21 (4.9%) | 74 (13.2%) | 355 (57.2%) | ||||
| CARDIOVASCULAR DISEASE RISK SCORE | |||||||||||||
| Time point 1 | Time point 2 | ||||||||||||
| Q. 1 N (%) | Q. 2 N (%) | Q. 3 N (%) | Q. 4 N (%) | p | Q. 1 N (%) | Q. 2 N (%) | Q. 3 N (%) | Q. 4 N (%) | p | ||||
| Time point 2 | Cluster 1 | <0.001 | Time point 3 | Cluster 1 | <0.001 | ||||||||
| Q. 1 | 657 (74.7%) | 10 (1.7%) | 0 (0.0%) | 0 (0.0%) | Q. 1 | 578 (86.7%) | 19 (4.2%) | 1 (0.2%) | 2 (0.5%) | ||||
| Q. 2 | 200 (22.7%) | 215 (38.0%) | 31 (7.8%) | 4 (1.6%) | Q. 2 | 86 (12.9%) | 241 (53.6%) | 52 (9.4%) | 3 (0.7%) | ||||
| Q. 3 | 23 (2.6%) | 298 (52.7%) | 192 (48.2%) | 40 (15.7%) | Q. 3 | 2 (0.3%) | 177 (39.3%) | 322 (58.2%) | 54 (12.6%) | ||||
| Q. 4 | 0 (0.0%) | 43 (7.6%) | 175 (44.0%) | 211 (82.7%) | Q. 4 | 1 (0.2%) | 13 (2.9%) | 178 (32.2%) | 370 (86.2%) | ||||
| Time point 2 | Cluster 2 | <0.001 | Time point 3 | Cluster 2 | <0.001 | ||||||||
| Q. 1 | 65 (41.1%) | 5 (1.1%) | 0 (0.0%) | 0 (0.0%) | Q. 1 | 40 (57.1%) | 9 (3.5%) | 5 (0.9%) | 8 (0.7%) | ||||
| Q. 2 | 72 (45.6%) | 145 (30.9%) | 34 (5.3%) | 5 (0.6%) | Q. 2 | 29 (41.4%) | 112 (43.8%) | 33 (5.6%) | 15 (1.3%) | ||||
| Q. 3 | 15 (9.5%) | 246 (52.5%) | 261 (41.0%) | 68 (8.7%) | Q. 3 | 1 (1.4%) | 119 (46.5%) | 314 (53.2%) | 100 (8.8%) | ||||
| Q. 4 | 6 (3.8%) | 73 (15.6%) | 342 (53.7%) | 711 (90.7%) | Q. 4 | 0 (0.0%) | 16 (6.3%) | 238 (40.3%) | 1009 (89.1%) | ||||
References
- WHO. Enfermedades Cardiovasculares (cvds). Available online: https://www.who.int/es/news-room/fact-sheets/detail/cardiovascular-diseases- (accessed on 10 December 2020).
- Roth, G.A.; Mensah, G.A.; Johnson, C.O.; Addolorato, G.; Ammirati, E.; Baddour, L.M.; Barengo, N.C.; Benjamin, E.J.; Benziger, C.P.; Bonny, A.; et al. Global burden of cardiovascular diseases and risk factors, 1990–2019: Update from the GBD 2019 study. In JACC; 2020; Volume 76, pp. 2982–3021. [Google Scholar] [CrossRef] [PubMed]
- Townsend, N.; Wilson, L.; Bhatnagar, P.; Wickramasinghe, K.; Rayner, M.; Nichols, M. Cardiovascular Disease in Europe: Epidemiological Update 2016. Eur. Heart J. 2016, 37, 3232–3245. [Google Scholar] [CrossRef] [PubMed]
- Balakumar, P.; Maung-U, K.; Jagadeesh, G. Prevalence and Prevention of Cardiovascular Disease and Diabetes Mellitus. Pharmacol. Res. 2016, 113, 600–609. [Google Scholar] [CrossRef] [PubMed]
- Shirasawa, T.; Ochiai, H.; Yoshimoto, T.; Nagahama, S.; Kobayashi, M.; Ohtsu, I.; Sunaga, Y.; Kokaze, A. Associations between Normal Weight Central Obesity and Cardiovascular Disease Risk Factors in Japanese Middle-Aged Adults: A Cross-Sectional Study. J. Health Popul. Nutr. 2019, 38, 1–7. [Google Scholar] [CrossRef] [PubMed] [Green Version]
- Yusuf, S.; Joseph, P.; Rangarajan, S.; Islam, S.; Mente, A.; Hystad, P.; Brauer, M.; Kutty, V.R.; Gupta, R.; Wielgosz, A.; et al. Modifiable risk factors, cardiovascular disease, and mortality in 155 722 individuals from 21 high-income, middle-income, and low-income countries (PURE): A prospective cohort study. Lancet 2020, 395, 795–808. [Google Scholar] [CrossRef] [Green Version]
- San Sebastián, M.; Mosquera, P.A.; Gustafsson, P.E. Do Cardiovascular Disease Prevention Programs in Northern Sweden Impact on Population Health? An Interrupted Time Series Analysis. BMC Public Health. 2019, 19, 1–10. [Google Scholar] [CrossRef] [PubMed]
- Pennant, M.; Davenport, C.; Bayliss, S.; Greenheld, W.; Marshall, T.; Hyde, C. Community Programs for the Prevention of Cardiovascular Disease: A Systematic Review. Am. J. Epidemiol. 2010, 172, 501–516. [Google Scholar] [CrossRef] [PubMed] [Green Version]
- Peña, D. Análisis de Datos Multivariantes; McGraw-Hill: Madrid, Spain, 2002. [Google Scholar]
- Genolini, C.; Alacoque, X.; Sentenac, M.; Arnaud, C. Kml and Kml3d: R Packages to Cluster Longitudinal Data. J. Stat. Softw. 2015, 65, 1–34. [Google Scholar] [CrossRef] [Green Version]
- Casasnovas, J.A.; Alcaide, V.; Civeira, F.; Guallar, E.; Ibañez, B.; Borreguero, J.J.; Laclaustra, M.; León, M.; Peñalvo, J.L.; Ordovás, J.M.; et al. Aragon Workers’ Health Study-Design and Cohort Description. BMC Cardiovasc. Disord. 2012, 12, 1–11. [Google Scholar] [CrossRef] [PubMed] [Green Version]
- Conroy, R.M.; Pyörälä, K.; Fitzgerald, A.P.; Sans, S.; Menotti, A.; De Backer, G.; De Bacquer, D.; Ducimetière, P.; Jousilahti, P.; Keil, U.; et al. Estimation of Ten-Year Risk of Fatal Cardiovascular Disease in Europe: The SCORE Project. Eur. Heart J. 2003, 24, 987–1003. [Google Scholar] [CrossRef]
- Everitt, B.; Landau, L.; Leese, M. Cluster Analysis, 4th ed.; Hodder Edwar Arnold: London, UK, 2001. [Google Scholar]
- R Core Team. R: A Language and Environment for Statistical Computing; R Foundation for Statistical Computing: Vienna, Austria, 2020. [Google Scholar]
- Genolini, C.; Falissard, B.; Genolini, C.; Falissard, B.; Falissard, B. KmL: K-Means for Longitudinal Data. Comput. Stat. 2010, 25, 317–328. [Google Scholar] [CrossRef]
- Genolini, C.; Falissard, B.; Fang, D.; Tierney, L. Package LongitudinalData: Longitudinal Data; R Package Version 2.4.1; 2016. Available online: https://CRAN.R-project.org/package=longitudinalData (accessed on 10 December 2020).
- Redon, J. Global Cardiovascular Risk Assessment: Strengths and Limitations. High Blood Press. Cardiovasc. Prev. 2016, 23, 87–90. [Google Scholar] [CrossRef] [PubMed]
- Lin, H.; Cui, M.; Spatz, E.S.; Wang, Y.; Lu, J.; Li, J.; Li, S.; Huang, C.; Liu, X.; Jiang, L.; et al. Heterogeneity in Trajectories of Systolic Blood Pressure among Young Adults in Qingdao Port Cardiovascular Health Study. Glob. Heart. 2020, 15, 9–11. [Google Scholar] [CrossRef] [PubMed] [Green Version]
- Tielemans, S.M.A.J.; Geleijnse, J.M.; Laughlin, G.A.; Boshuizen, H.C.; Barrett-Connor, E.; Kromhout, D. Blood Pressure Trajectories in Relation to Cardiovascular Mortality: The Rancho Bernardo Study. J. Hum. Hypertens. 2017, 31, 515–519. [Google Scholar] [CrossRef] [PubMed]
- Allen, N.B.; Siddique, J.; Wilkins, J.T.; Shay, C.; Lewis, C.E.; Goff, D.C.; Jacobs, D.R.; Liu, K.; Lloyd-Jones, D. Blood Pressure Trajectories in Early Adulthood and Subclinical Atherosclerosis in Middle Age. JAMA J. Am. Med. Assoc. 2014, 311, 490–497. [Google Scholar] [CrossRef] [PubMed]
- Smitson, C.C.; Scherzer, R.; Shlipak, M.G.; Psaty, B.M.; Newman, A.B.; Sarnak, M.J.; Odden, M.C.; Peralta, C.A. Association of Blood Pressure Trajectory with Mortality, Incident Cardiovascular Disease, and Heart Failure in the Cardiovascular Health Study. Am. J. Hypertens. 2017, 30, 587–593. [Google Scholar] [CrossRef] [PubMed] [Green Version]
- Norby, F.L.; Soliman, E.Z.; Chen, L.Y.; Bengtson, L.G.S.; Loehr, L.R.; Agarwal, S.K.; Alonso, A. Trajectories of Cardiovascular Risk Factors and Incidence of Atrial Fibrillation over a 25-Year Follow-Up. Circulation 2016, 134, 599–610. [Google Scholar] [CrossRef] [PubMed] [Green Version]
- Pebesma, J.; Martinez-Millana, A.; Sacchi, L.; Fernandez-Llatas, C.; De Cata, P.; Chiovato, L.; Bellazzi, R.; Traver, V. Clustering Cardiovascular Risk Trajectories of Patients with Type 2 Diabetes Using Process Mining. Proc. Annu. Int. Conf. IEEE Eng. Med. Biol. Soc. EMBS. 2019, 341–344. [Google Scholar] [CrossRef]
- Rospleszcz, S.; Lorbeer, R.; Storz, C.; Schlett, C.L.; Meisinger, C.; Thorand, B.; Rathmann, W.; Bamberg, F.; Lieb, W.; Peters, A. Association of Longitudinal Risk Profile Trajectory Clusters with Adipose Tissue Depots Measured by Magnetic Resonance Imaging. Sci. Rep. 2019, 9, 1–12. [Google Scholar] [CrossRef] [PubMed]


| Variables | Time Point 1 | Time Point 2 | Time Point 3 | |||
|---|---|---|---|---|---|---|
| Data | Imputed | Real | Imputed | Real | Imputed | Real |
| BMI (kg/m2) | 27.6 (3.5) | 27.6 (3.5) | 27.8 (3.7) | 27.8 (3.7) | 27.9 (3.8) | 27.8 (3.8) |
| Wc- Cholesterol (cm) | 96.8 (9.7) | 96.8 (9.6) | 97.4 (10.0) | 97.3 (10.0) | 98.1 (10.8) | 97.7 (10.5) |
| HDL (mg/dL) | 52.4 (10.9) | 52.4 (11.0) | 53.8 (11.3) | 54.1 (11.3) | 51.5 (12.9) | 51.0 (12.4) |
| Glucose (mg/dL) | 97.7 (18.7) | 97.7 (18.7) | 98.4 (19.5) | 96.5 (19.5) | 89.9 (21.5) | 88.1 (18.6) |
| SCORE | 1.6 (1.4) | 1.6 (1.4) | 2.1 (1.7) | 2.1 (1.7) | 2.4 (2.2) | 2.1 (1.7) |
| Quantitative Variables | Time Point 1 Mean (SD) | Time Point 2 Mean (SD) | Time Point 3 Mean (SD) | |
|---|---|---|---|---|
| Age (years) | 48.00 (8.42) | 51.49 (8.27) | 53.00 (8.25) | |
| Systolic blood pressure (mmHg) | 126.00 (14.14) | 124.00 (14.25) | 128.89 (15.00) | |
| Diastolic blood pressure (mmHg) | 83.44 (9.82) | 79.80 (9.39) | 81.36 (9.68) | |
| Weight (kg) | 81.64 (11.47) | 82.10 (11.92) | 82.66 (12.38) | |
| Waist circumference (cm) | 96.81 (9.61) | 97.30 (10.00) | 97.73 (10.53) | |
| Body mass index (kg/m2) | 27.61 (3.54) | 27.77 (3.67) | 27.84 (3.80) | |
| HDL cholesterol (mg/dL) | 52.45 (11.00) | 54.07 (11.30) | 51.00 (12.40) | |
| Total cholesterol (mg/dL) | 212.18 (37.62) | 205.93 (34.75) | 187.96 (32.85) | |
| Glucose (mg/dL) | 97.70 (18.75) | 96.51 (19.46) | 88.06 (18.60) | |
| SCORE | 1.56 (1.40) | 2.05 (1.73) | 2.09 (1.74) | |
| Categorical Variables | Time Point 1 N (%) | Time Point 2 N (%) | Time Point 3 N (%) | |
| Smoking status | Smoker | 1488 (36.82) | 1235 (32.19) | 1156 (32.65) |
| Non-smoker | 1087 (26.90) | 925 (24.11) | 853 (24.09) | |
| Ex-smoker | 1466 (36.28) | 1677 (43.71) | 1532 (43.26) | |
| Body mass index groups | Normal weight | 938 (23.05) | 846 (22.01) | 762 (22.38) |
| Overweight | 2223 (54.63) | 2088 (54.33) | 1813 (54.25) | |
| Obesity | 908 (22.32) | 909 (23.65) | 830 (24.38) | |
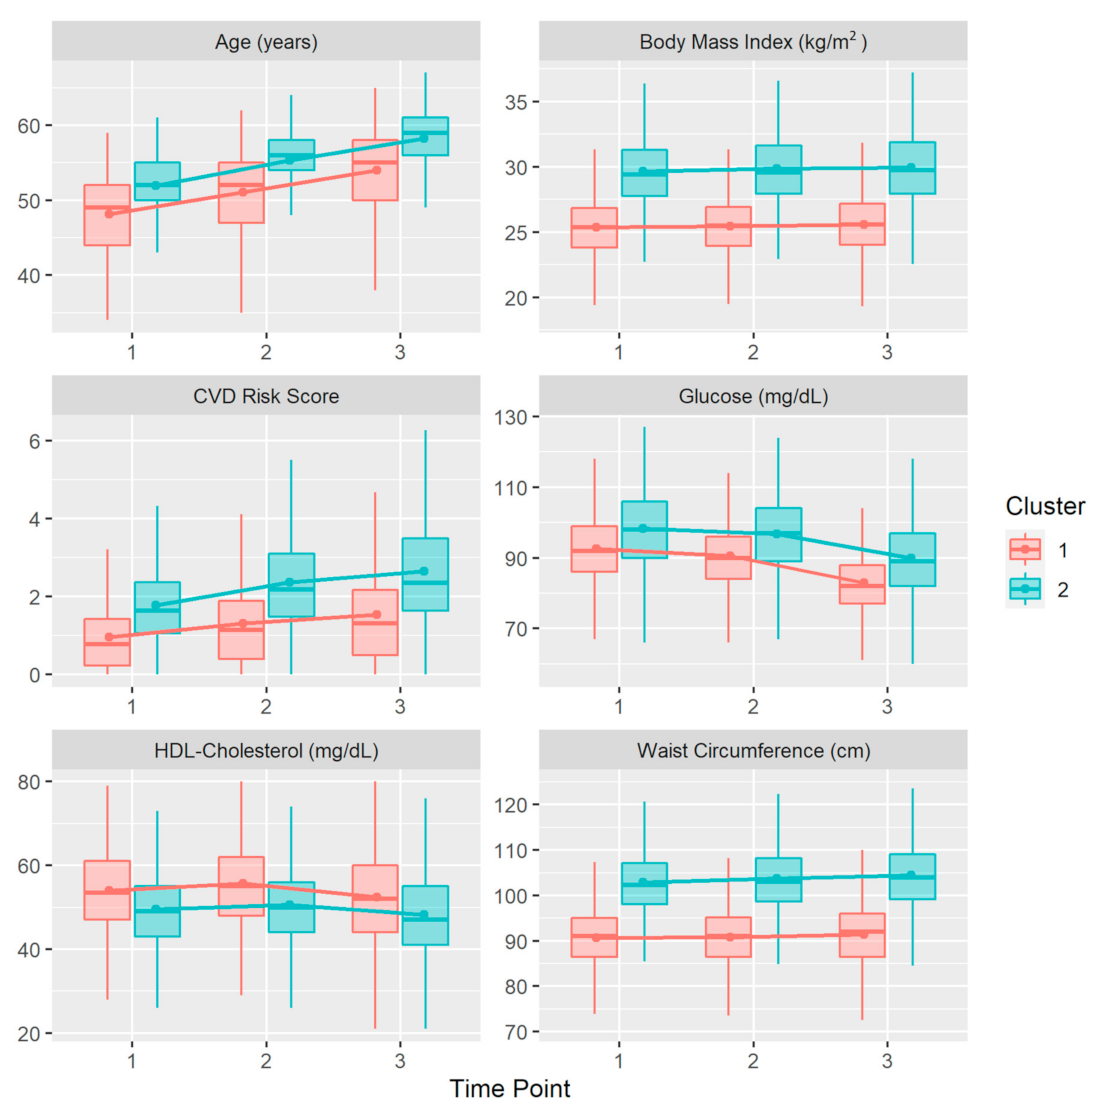
| Variables | Time Point | Cluster 1 N = 2099 | Cluster 2 N = 2048 | p |
|---|---|---|---|---|
| Mean (SD) | Mean (SD) | |||
| Age | Time point 1 | 44.2 (9.58) | 51.7 (4.59) | <0.001 |
| Time point 2 | 47.6 (9.58) | 55.2 (4.63) | <0.001 | |
| Time point 3 | 50.6 (9.55) | 58.1 (4.58) | <0.001 | |
| WC | Time point 1 | 90.5 (6.80) | 103 (7.72) | <0.001 |
| Time point 2 | 90.6 (6.61) | 104 (8.06) | <0.001 | |
| Time point 3 | 91.2 (7.31) | 105 (8.97) | <0.001 | |
| BMI | Time point 1 | 25.3 (2.30) | 30.0 (3.04) | <0.001 |
| Time point 2 | 25.4 (2.25) | 30.2 (3.22) | <0.001 | |
| Time point 3 | 25.6 (2.41) | 30.4 (3.49) | <0.001 | |
| Glucose | Time point 1 | 92.9 (11.7) | 103.0 (22.9) | <0.001 |
| Time point 2 | 91.0 (11.5) | 102.0 (24.1) | <0.001 | |
| Time point 3 | 83.4 (11.7) | 96.5 (26.7) | <0.001 | |
| HDL | Time point 1 | 55.0 (11.3) | 49.9 (9.94) | <0.001 |
| Time point 2 | 56.8 (11.8) | 50.9 (9.96) | <0.001 | |
| Time point 3 | 54.1 (13.4) | 48.9 (11.8) | <0.001 | |
| SCORE | Time point 1 | 1.02 (1.03) | 2.12 (1.55) | <0.001 |
| Time point 2 | 1.38 (1.27) | 2.74 (1.85) | <0.001 | |
| Time point 3 | 1.62 (1.49) | 3.27 (2.49) | <0.001 |
Publisher’s Note: MDPI stays neutral with regard to jurisdictional claims in published maps and institutional affiliations. |
© 2021 by the authors. Licensee MDPI, Basel, Switzerland. This article is an open access article distributed under the terms and conditions of the Creative Commons Attribution (CC BY) license (https://creativecommons.org/licenses/by/4.0/).
Share and Cite
Castel-Feced, S.; Maldonado, L.; Aguilar-Palacio, I.; Malo, S.; Moreno-Franco, B.; Mur-Vispe, E.; Alcalá-Nalvaiz, J.-T.; Rabanaque-Hernández, M.J. Evolution of Cardiovascular Risk Factors in a Worker Cohort: A Cluster Analysis. Int. J. Environ. Res. Public Health 2021, 18, 5610. https://doi.org/10.3390/ijerph18115610
Castel-Feced S, Maldonado L, Aguilar-Palacio I, Malo S, Moreno-Franco B, Mur-Vispe E, Alcalá-Nalvaiz J-T, Rabanaque-Hernández MJ. Evolution of Cardiovascular Risk Factors in a Worker Cohort: A Cluster Analysis. International Journal of Environmental Research and Public Health. 2021; 18(11):5610. https://doi.org/10.3390/ijerph18115610
Chicago/Turabian StyleCastel-Feced, Sara, Lina Maldonado, Isabel Aguilar-Palacio, Sara Malo, Belén Moreno-Franco, Eusebio Mur-Vispe, José-Tomás Alcalá-Nalvaiz, and María José Rabanaque-Hernández. 2021. "Evolution of Cardiovascular Risk Factors in a Worker Cohort: A Cluster Analysis" International Journal of Environmental Research and Public Health 18, no. 11: 5610. https://doi.org/10.3390/ijerph18115610