
Concentrations, Distribution, and Pollution Assessment of Metals in River Sediments in China

Abstract
:1. Introduction
2. Methods
2.1. Searching Method
2.2. Analytical Methods
2.2.1. Sediment Quality Guidelines
2.2.2. Geoaccumulation Index
2.2.3. Potential Ecological Risk Index
2.3. Statistical Analysis
3. Results and Discussion
3.1. Concentrations and Spatial Distribution of Metals
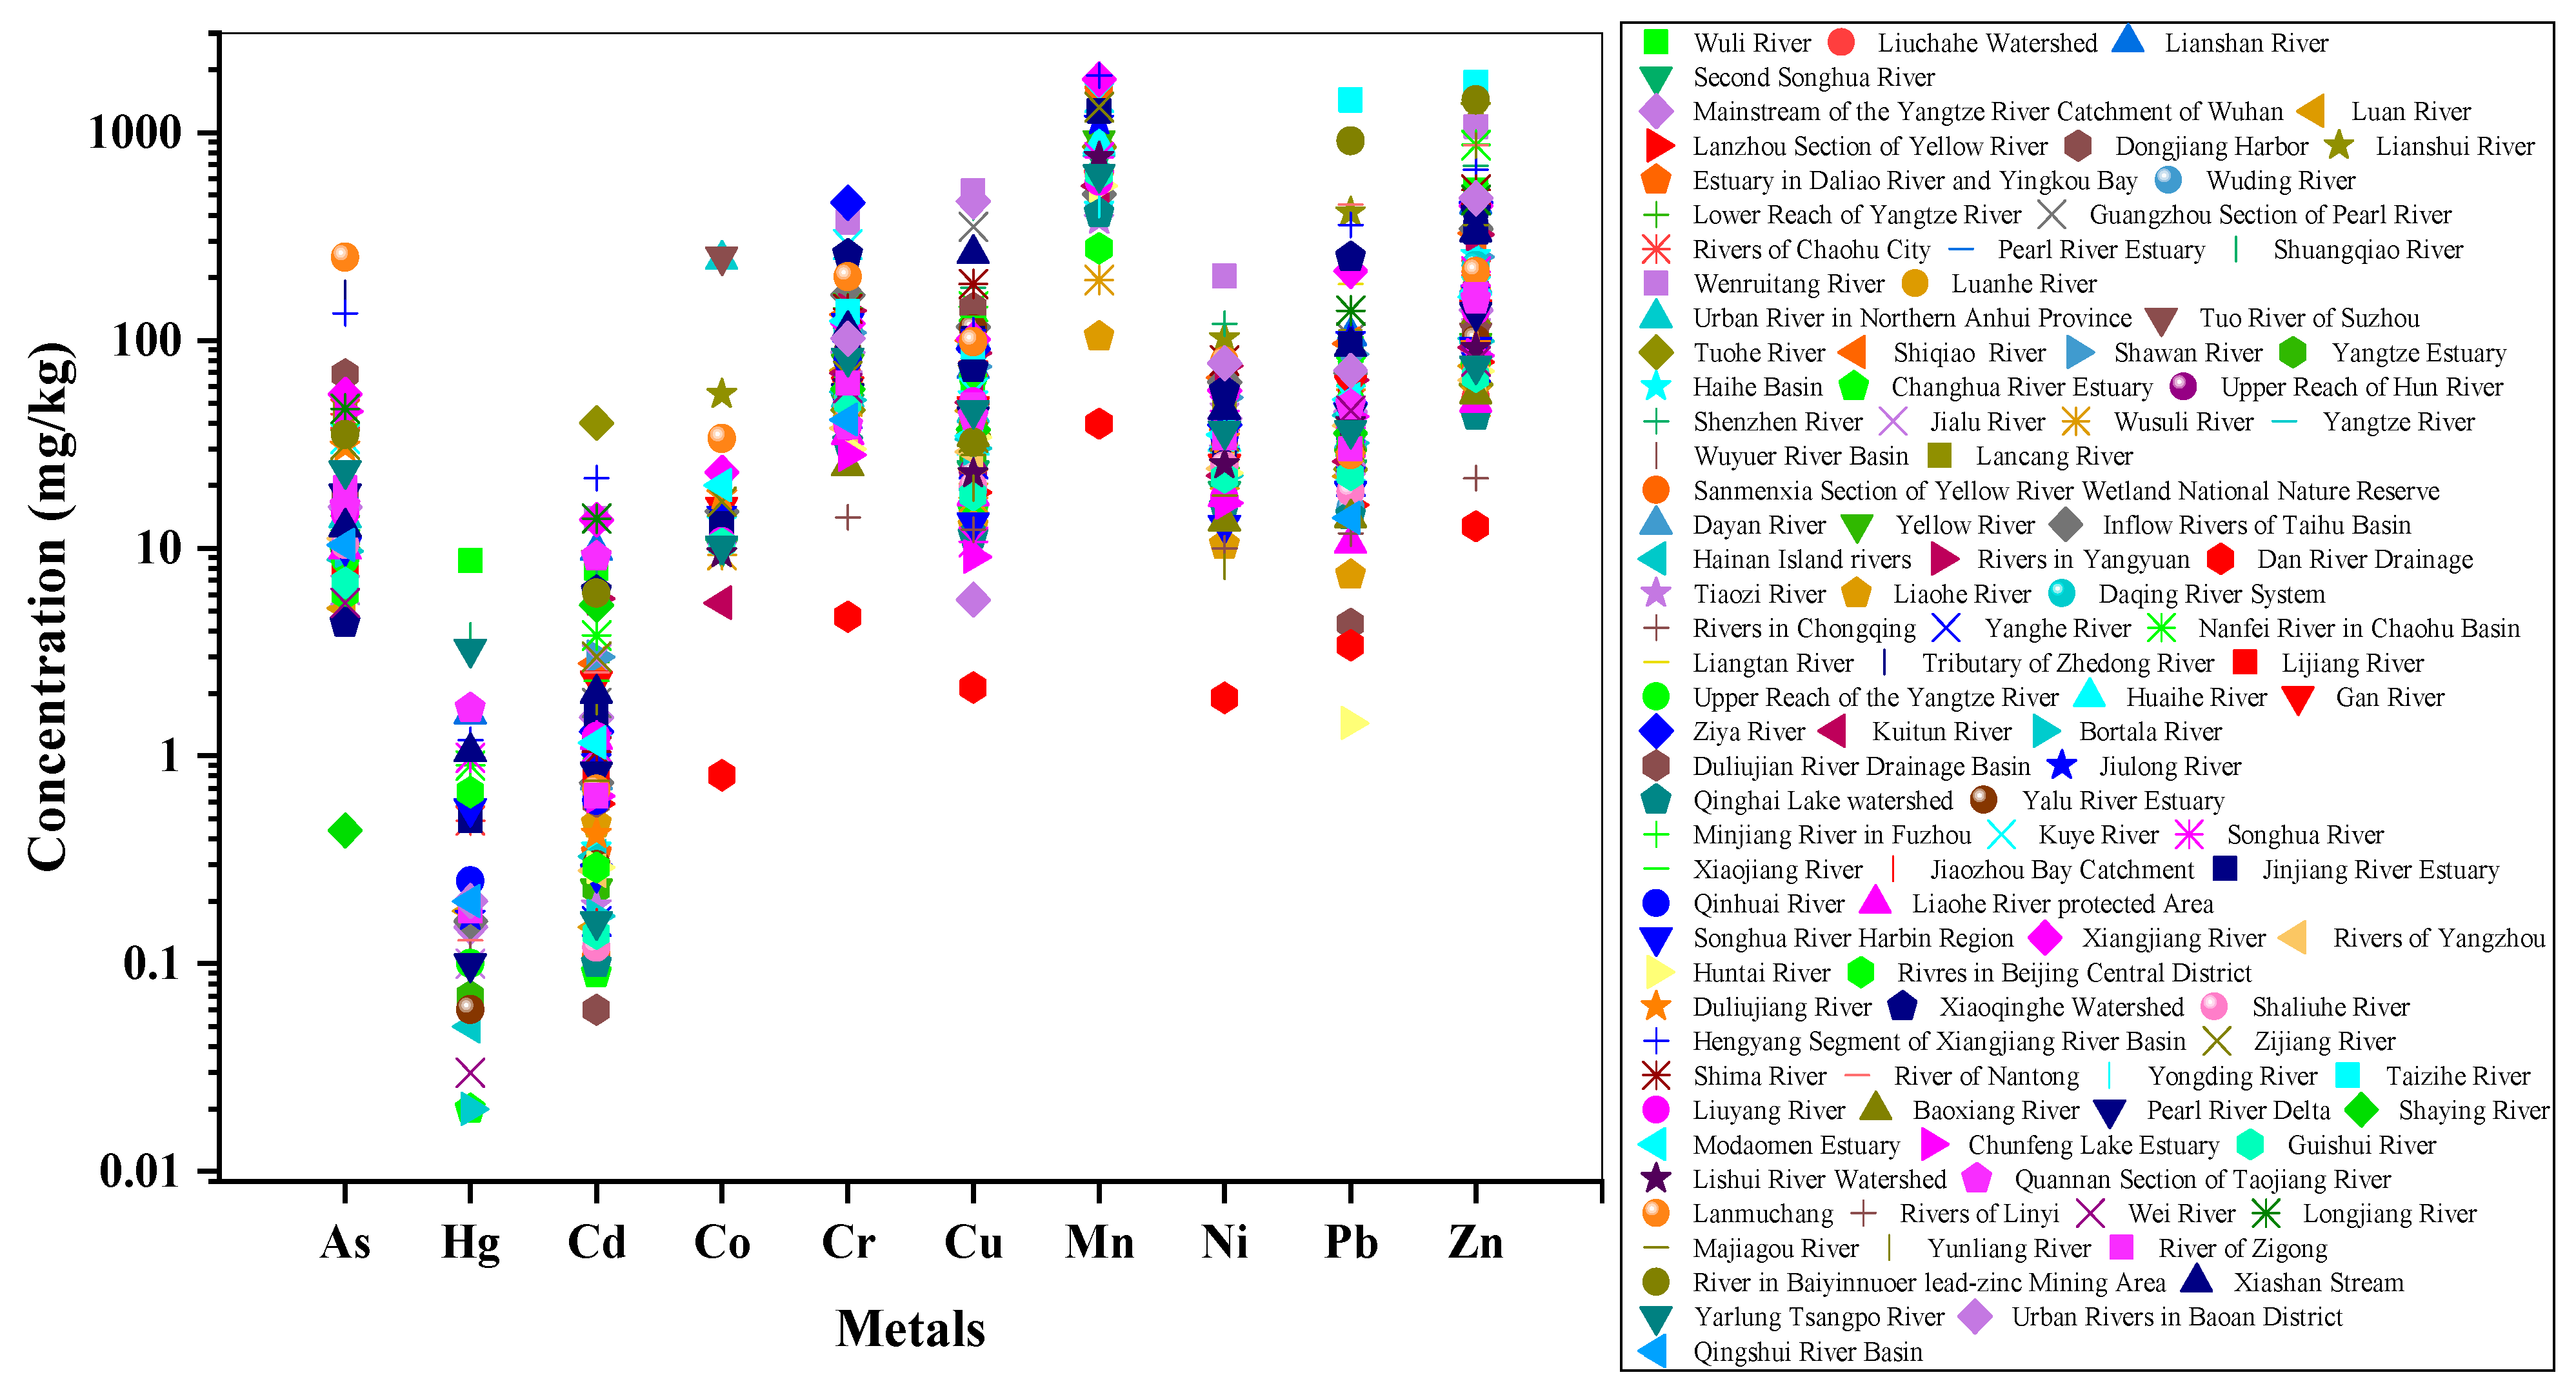
3.1.1. Heavy Metal Concentrations
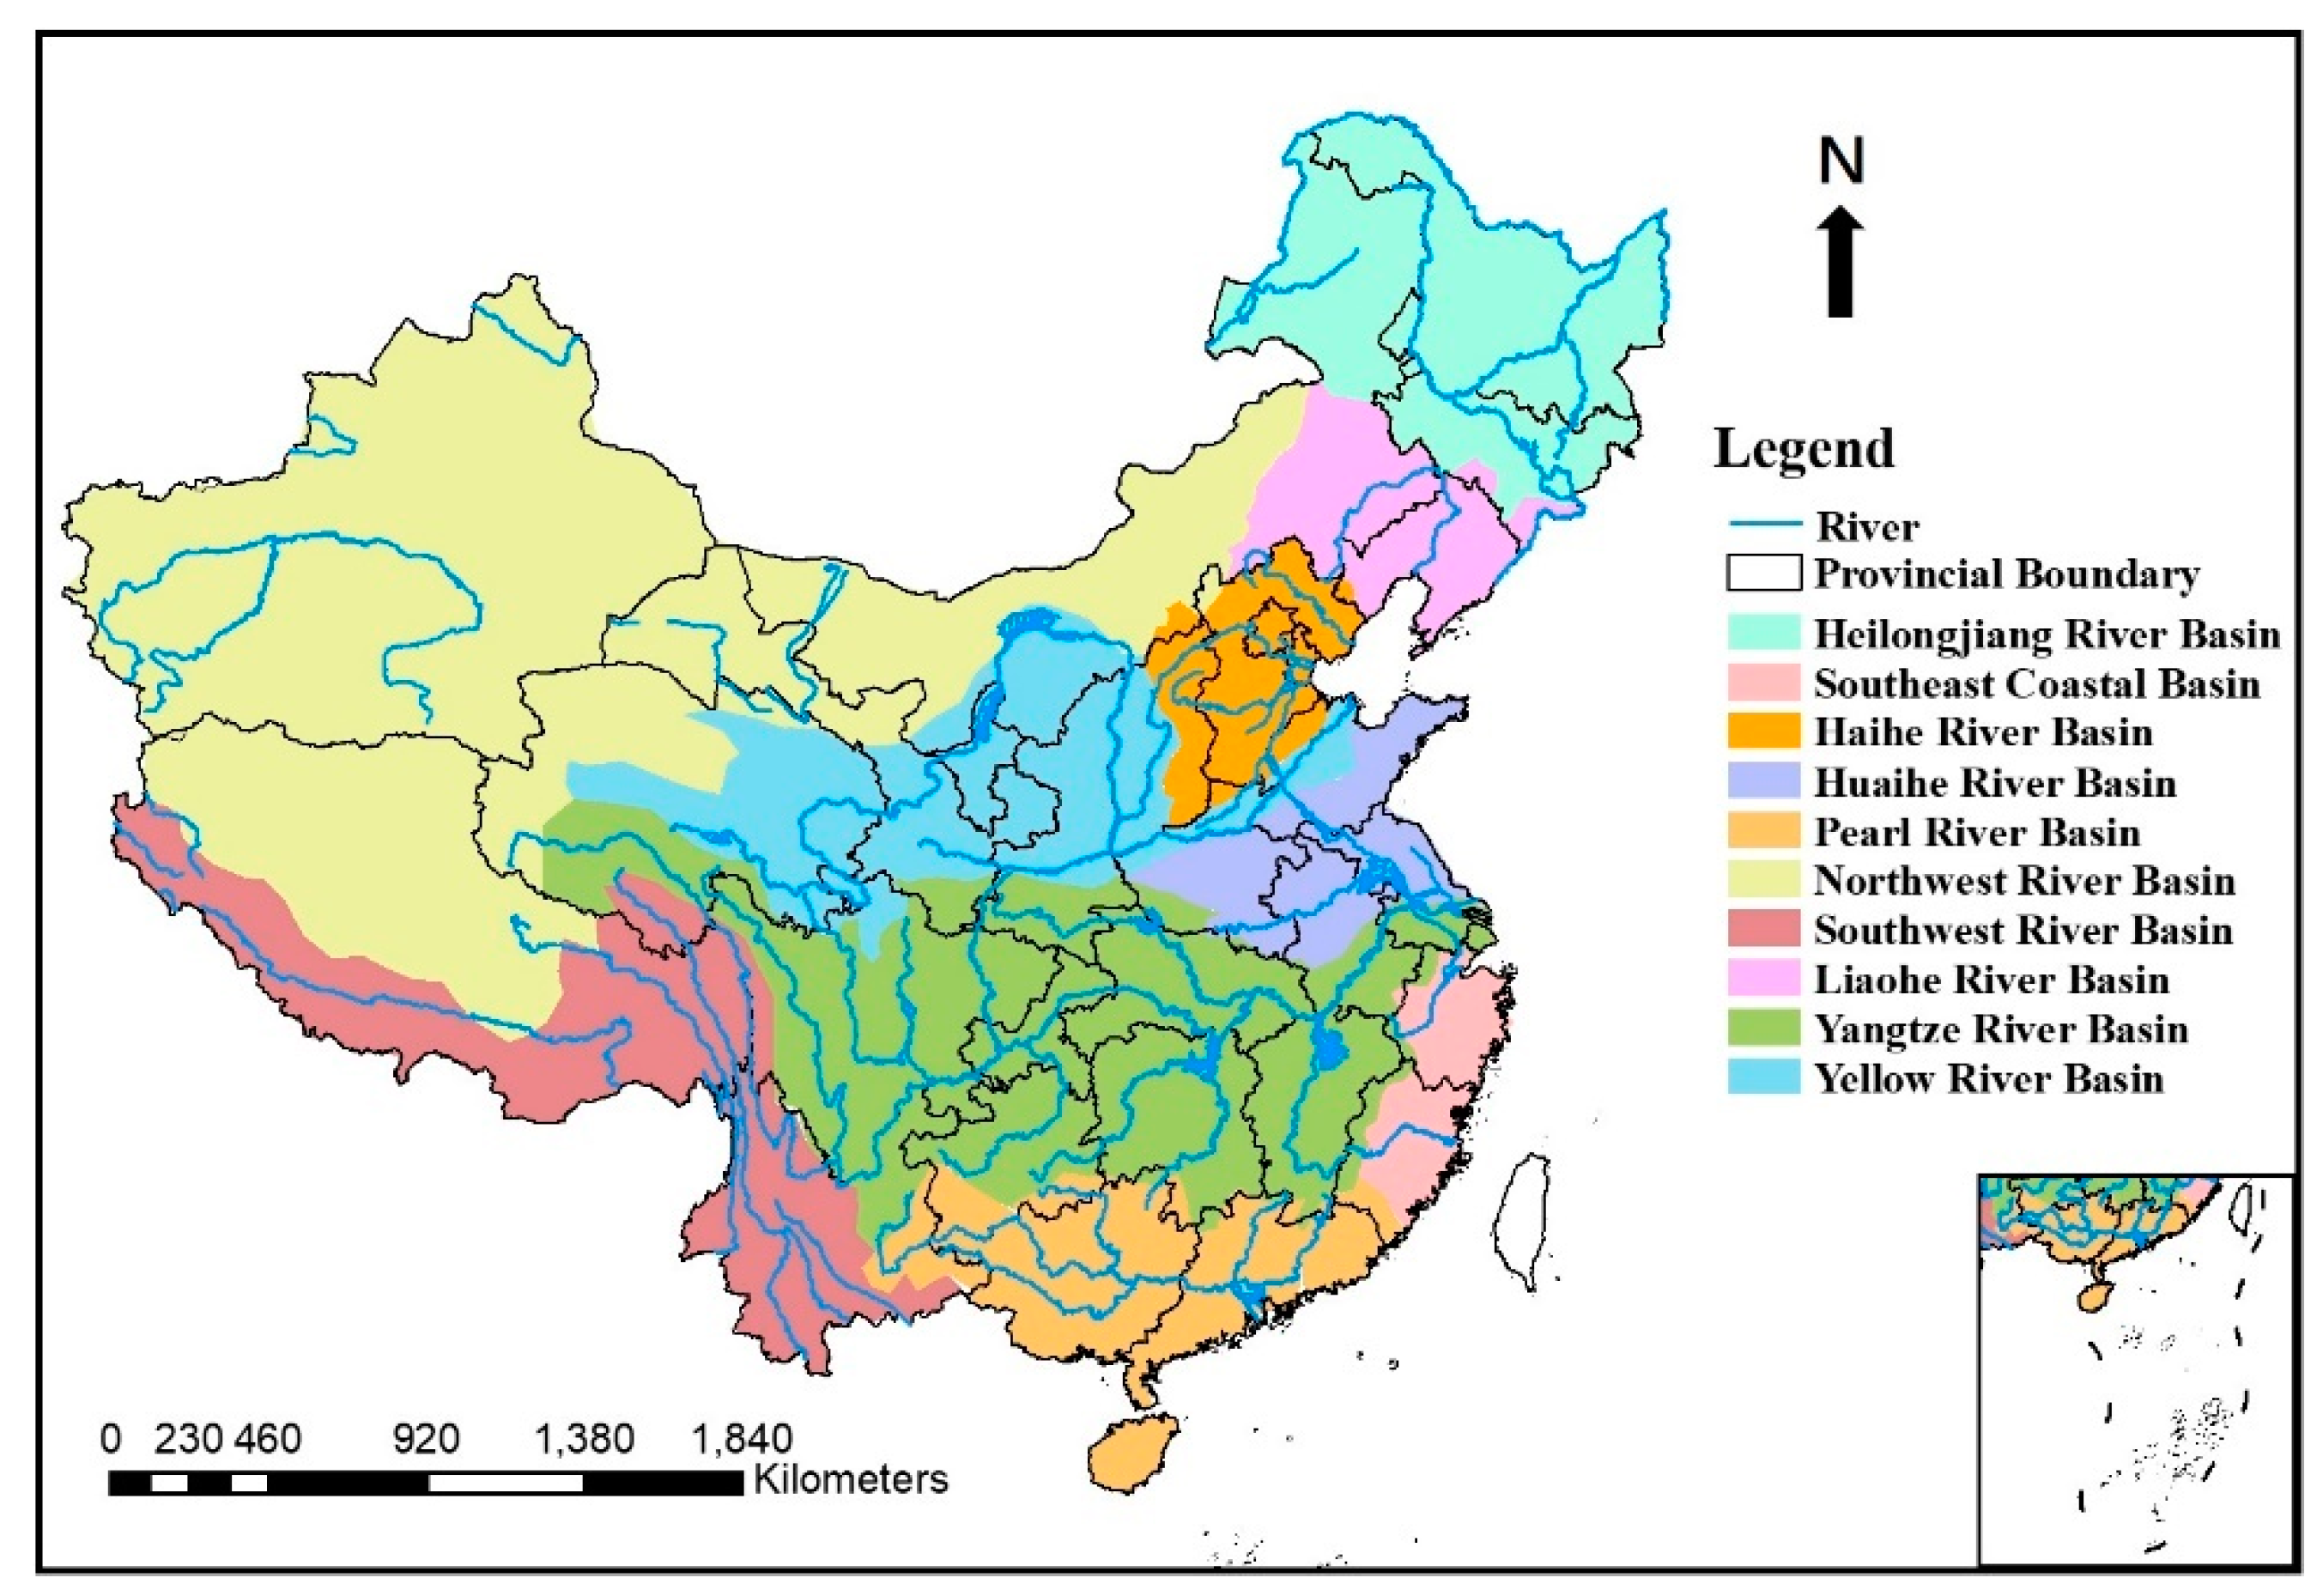
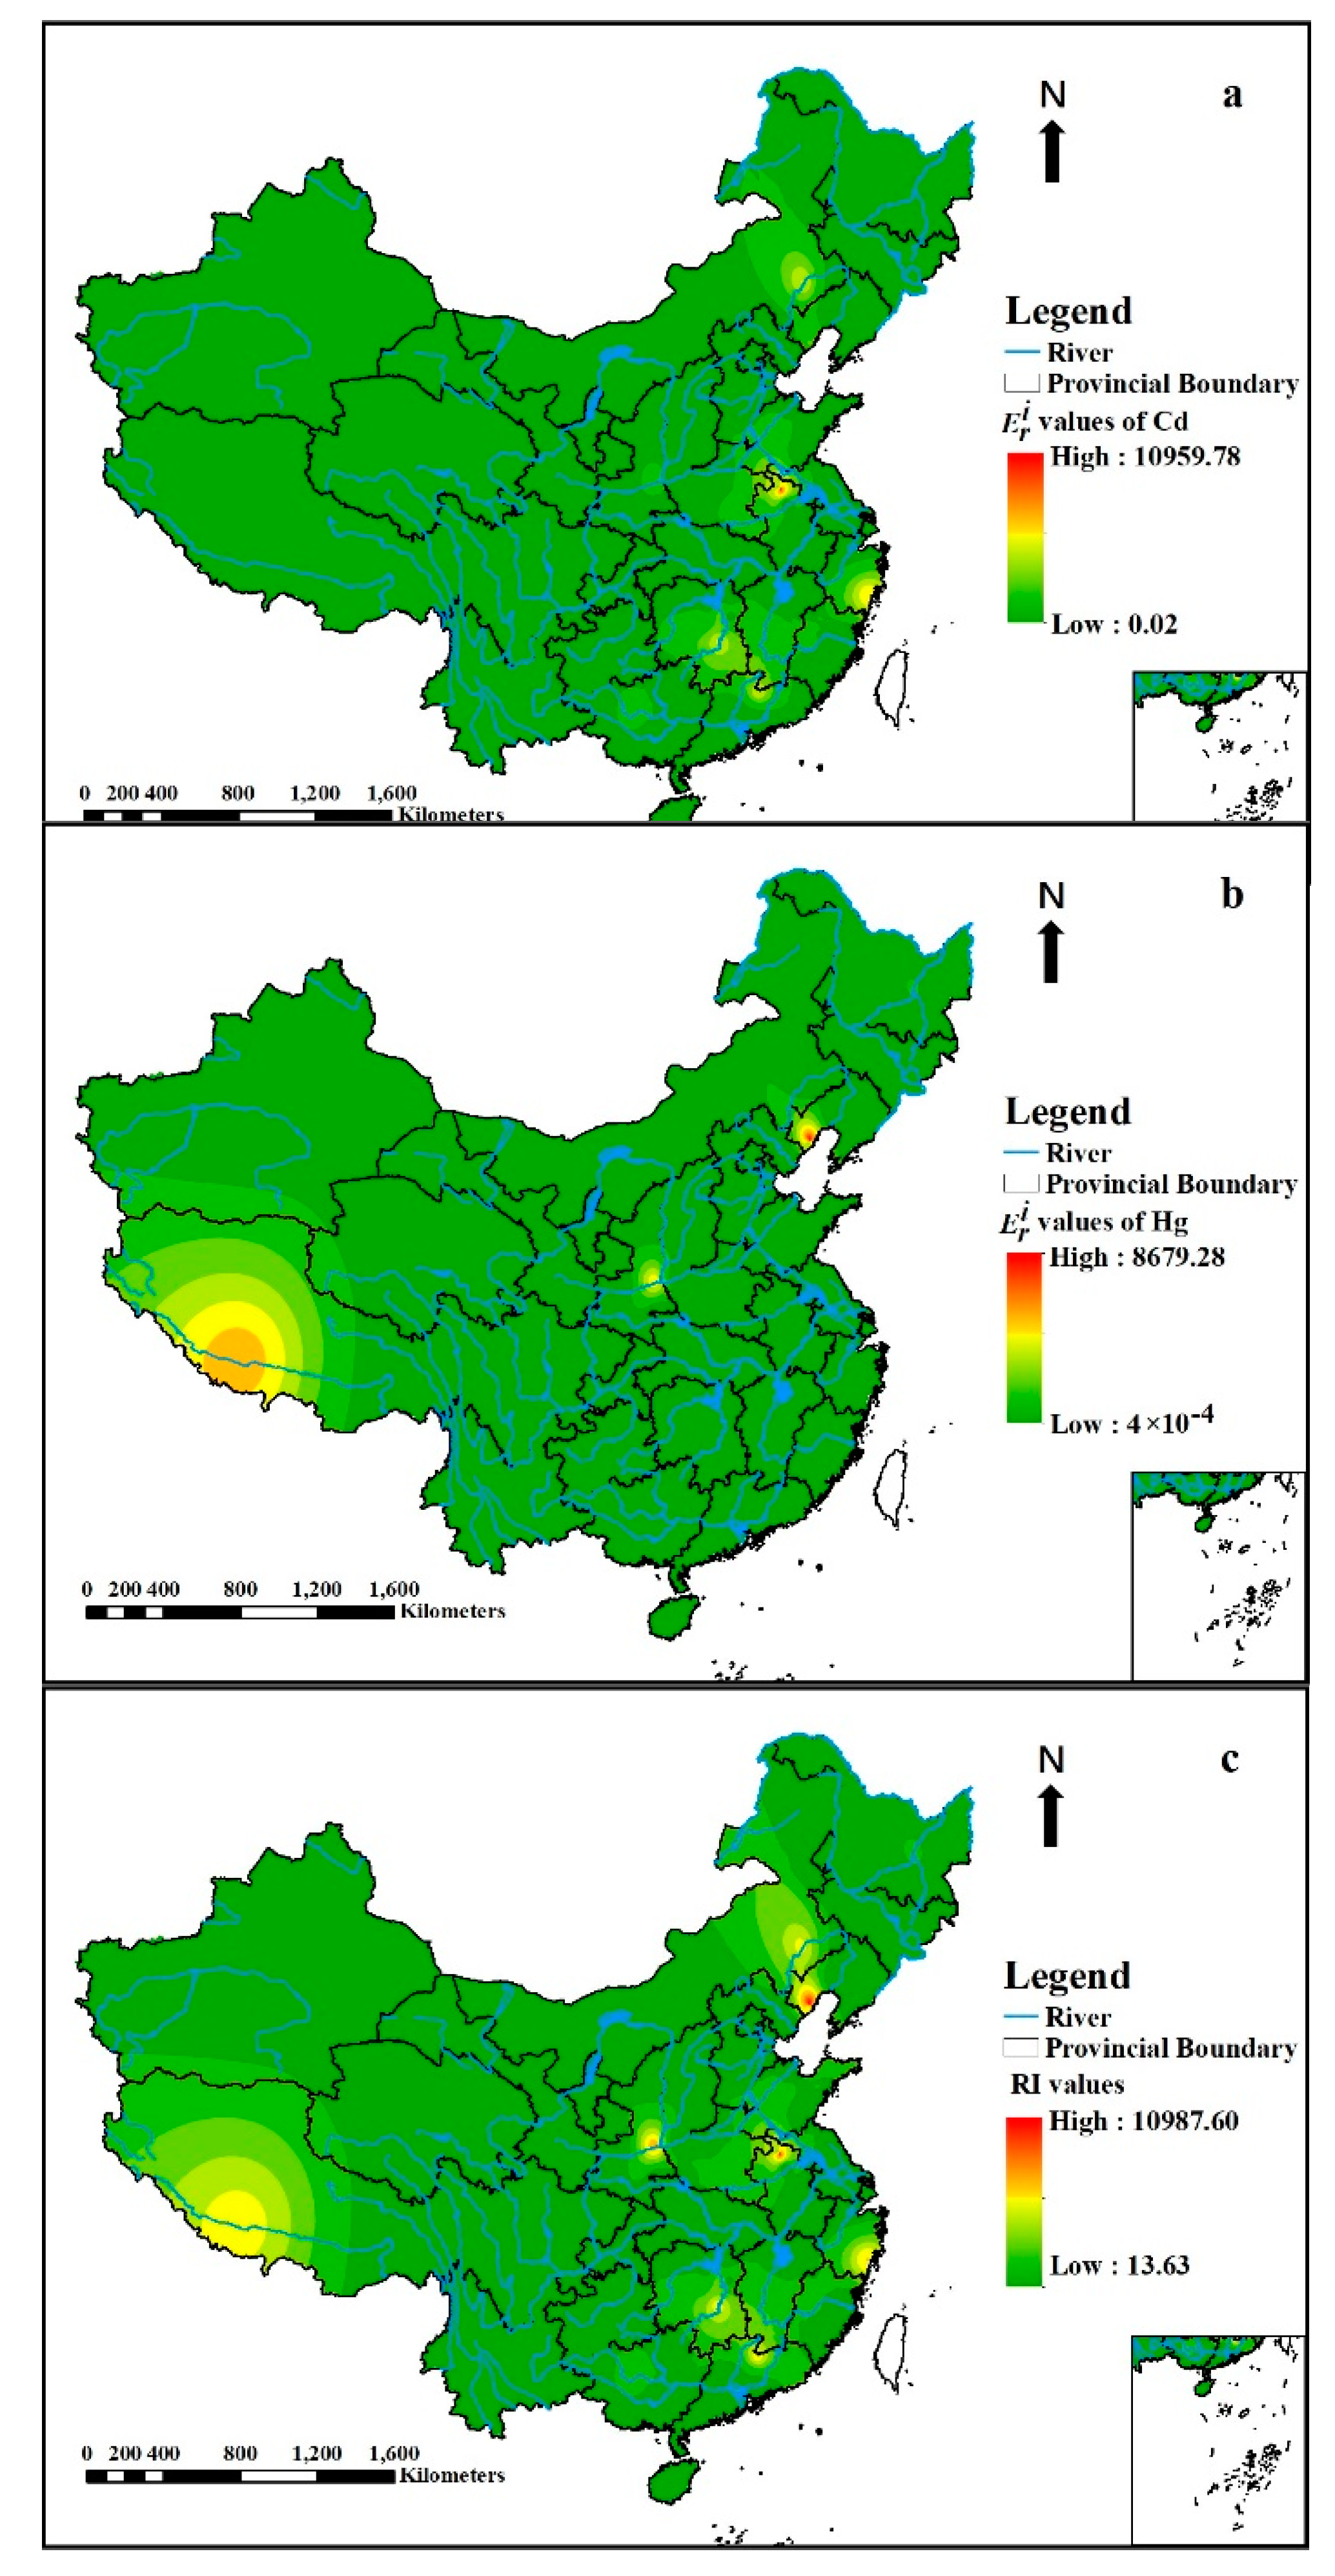
3.1.2. Spatial Distribution
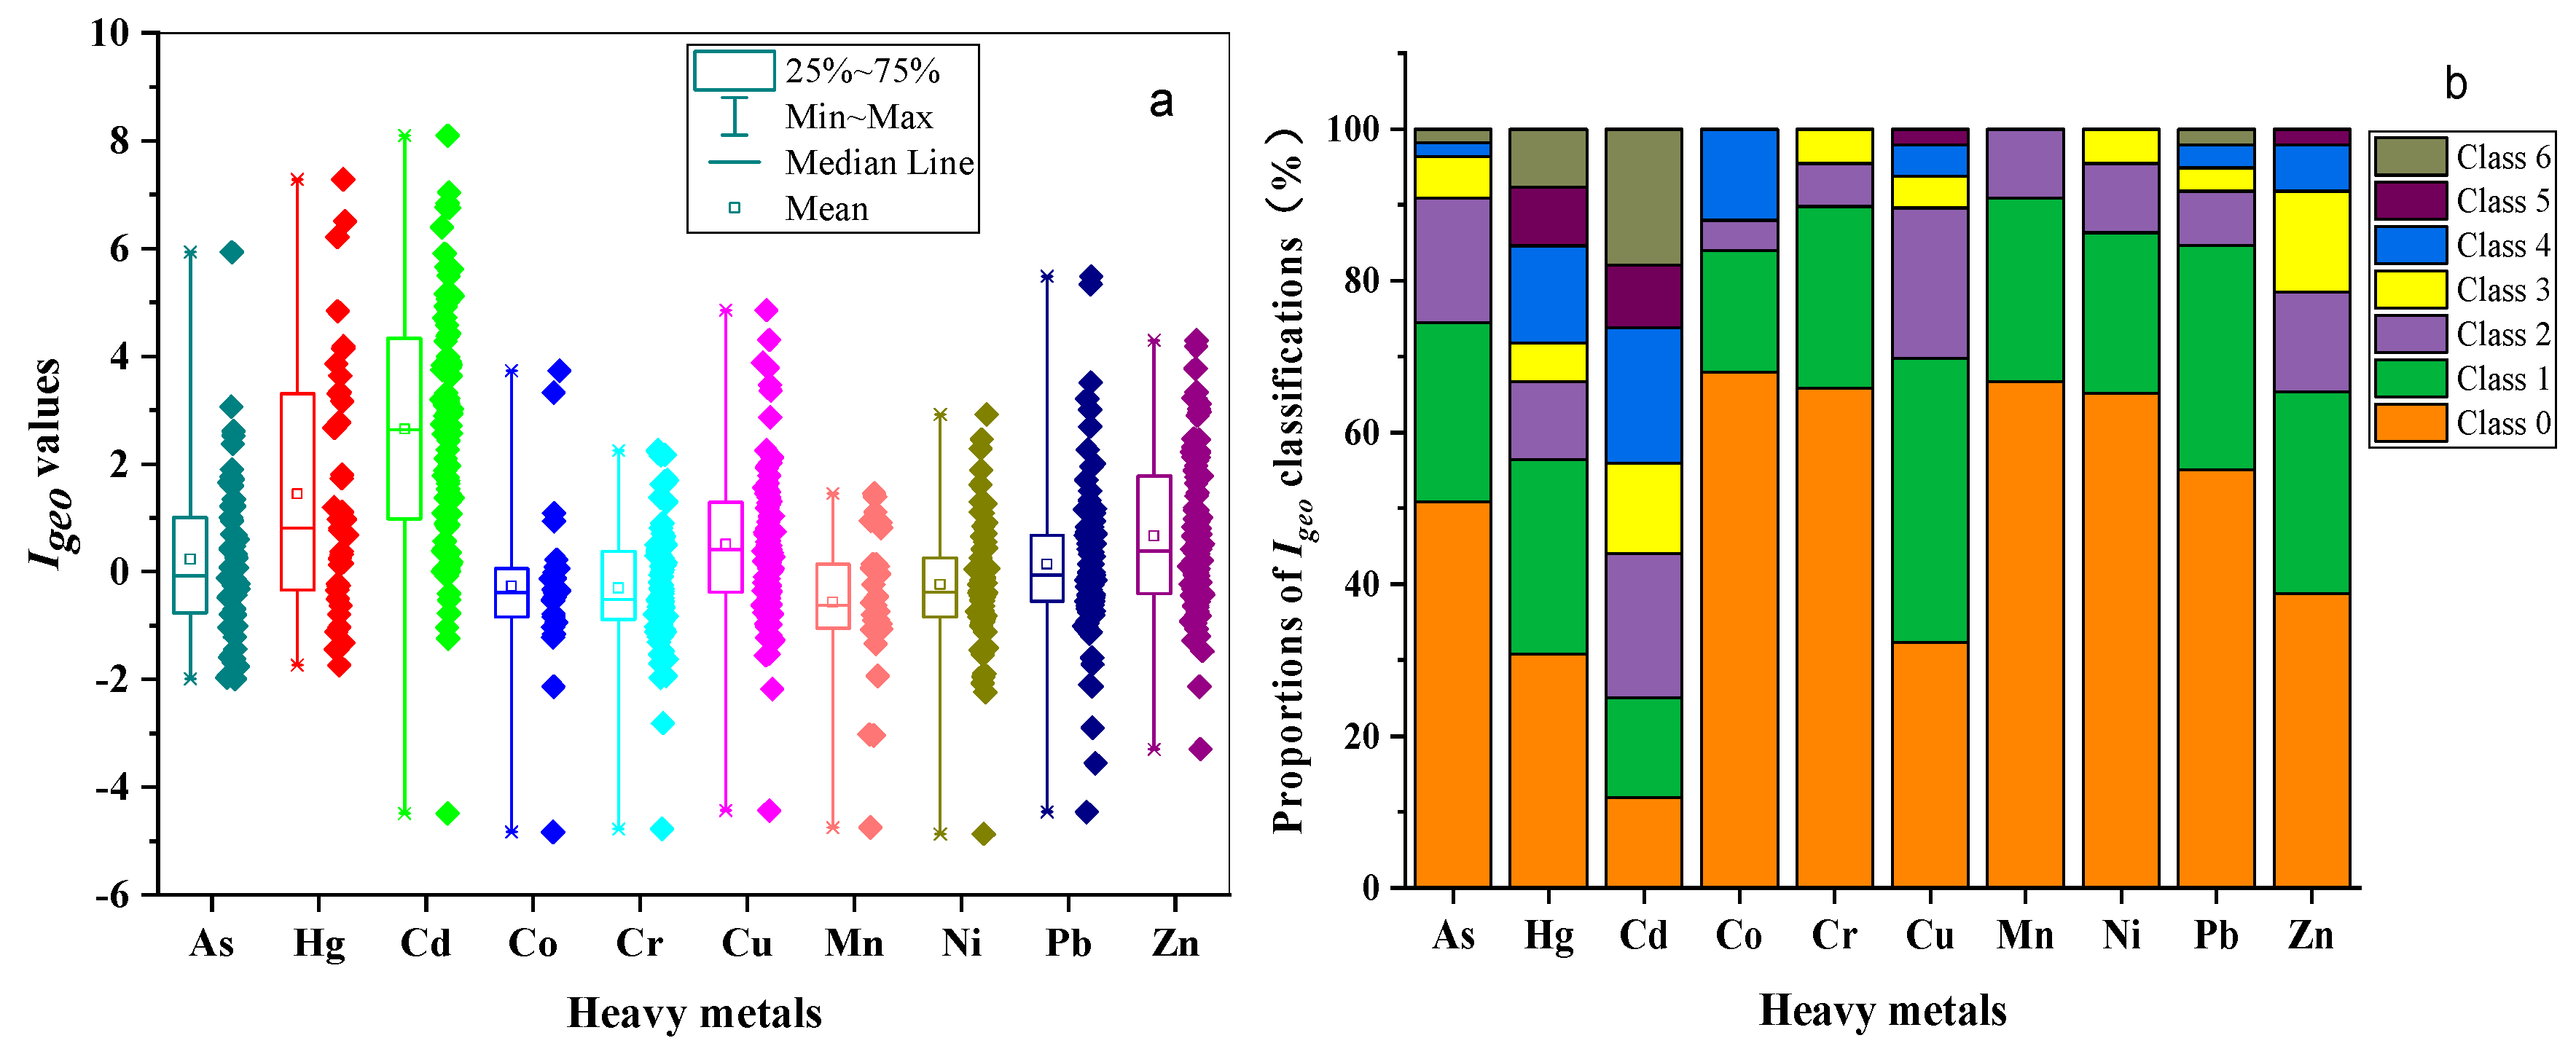
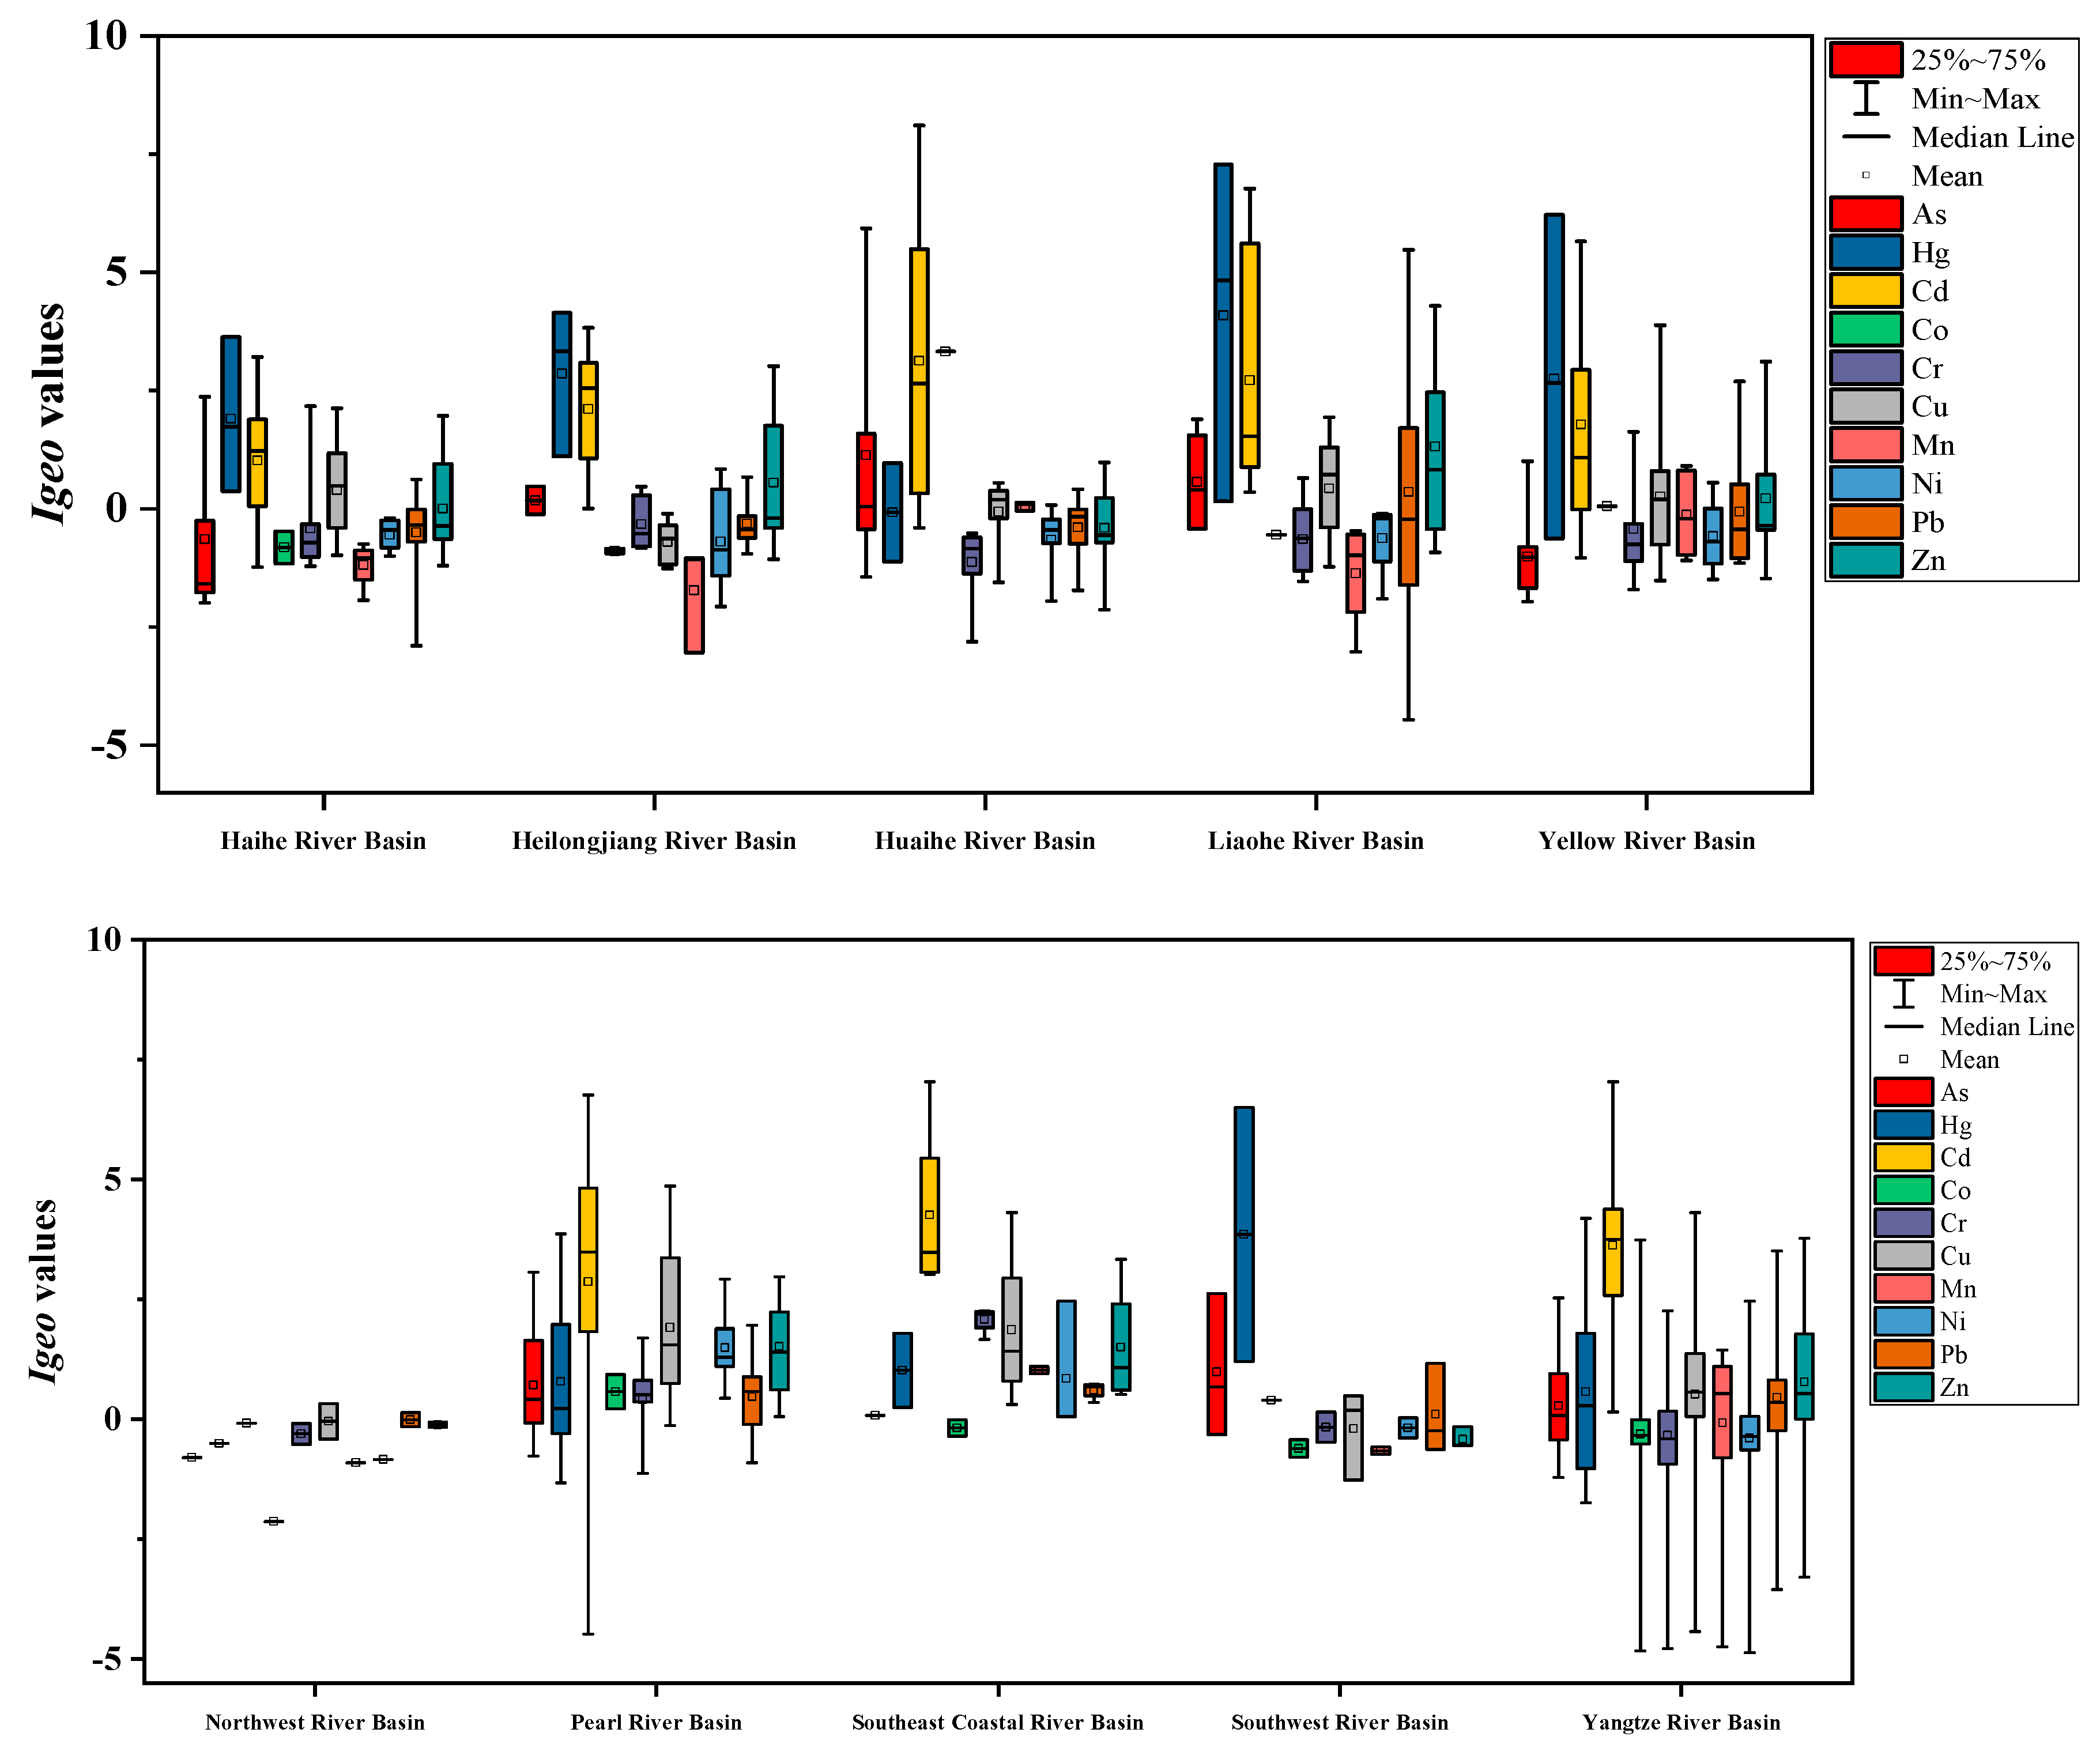
3.2. Contamination Assessment of Metals
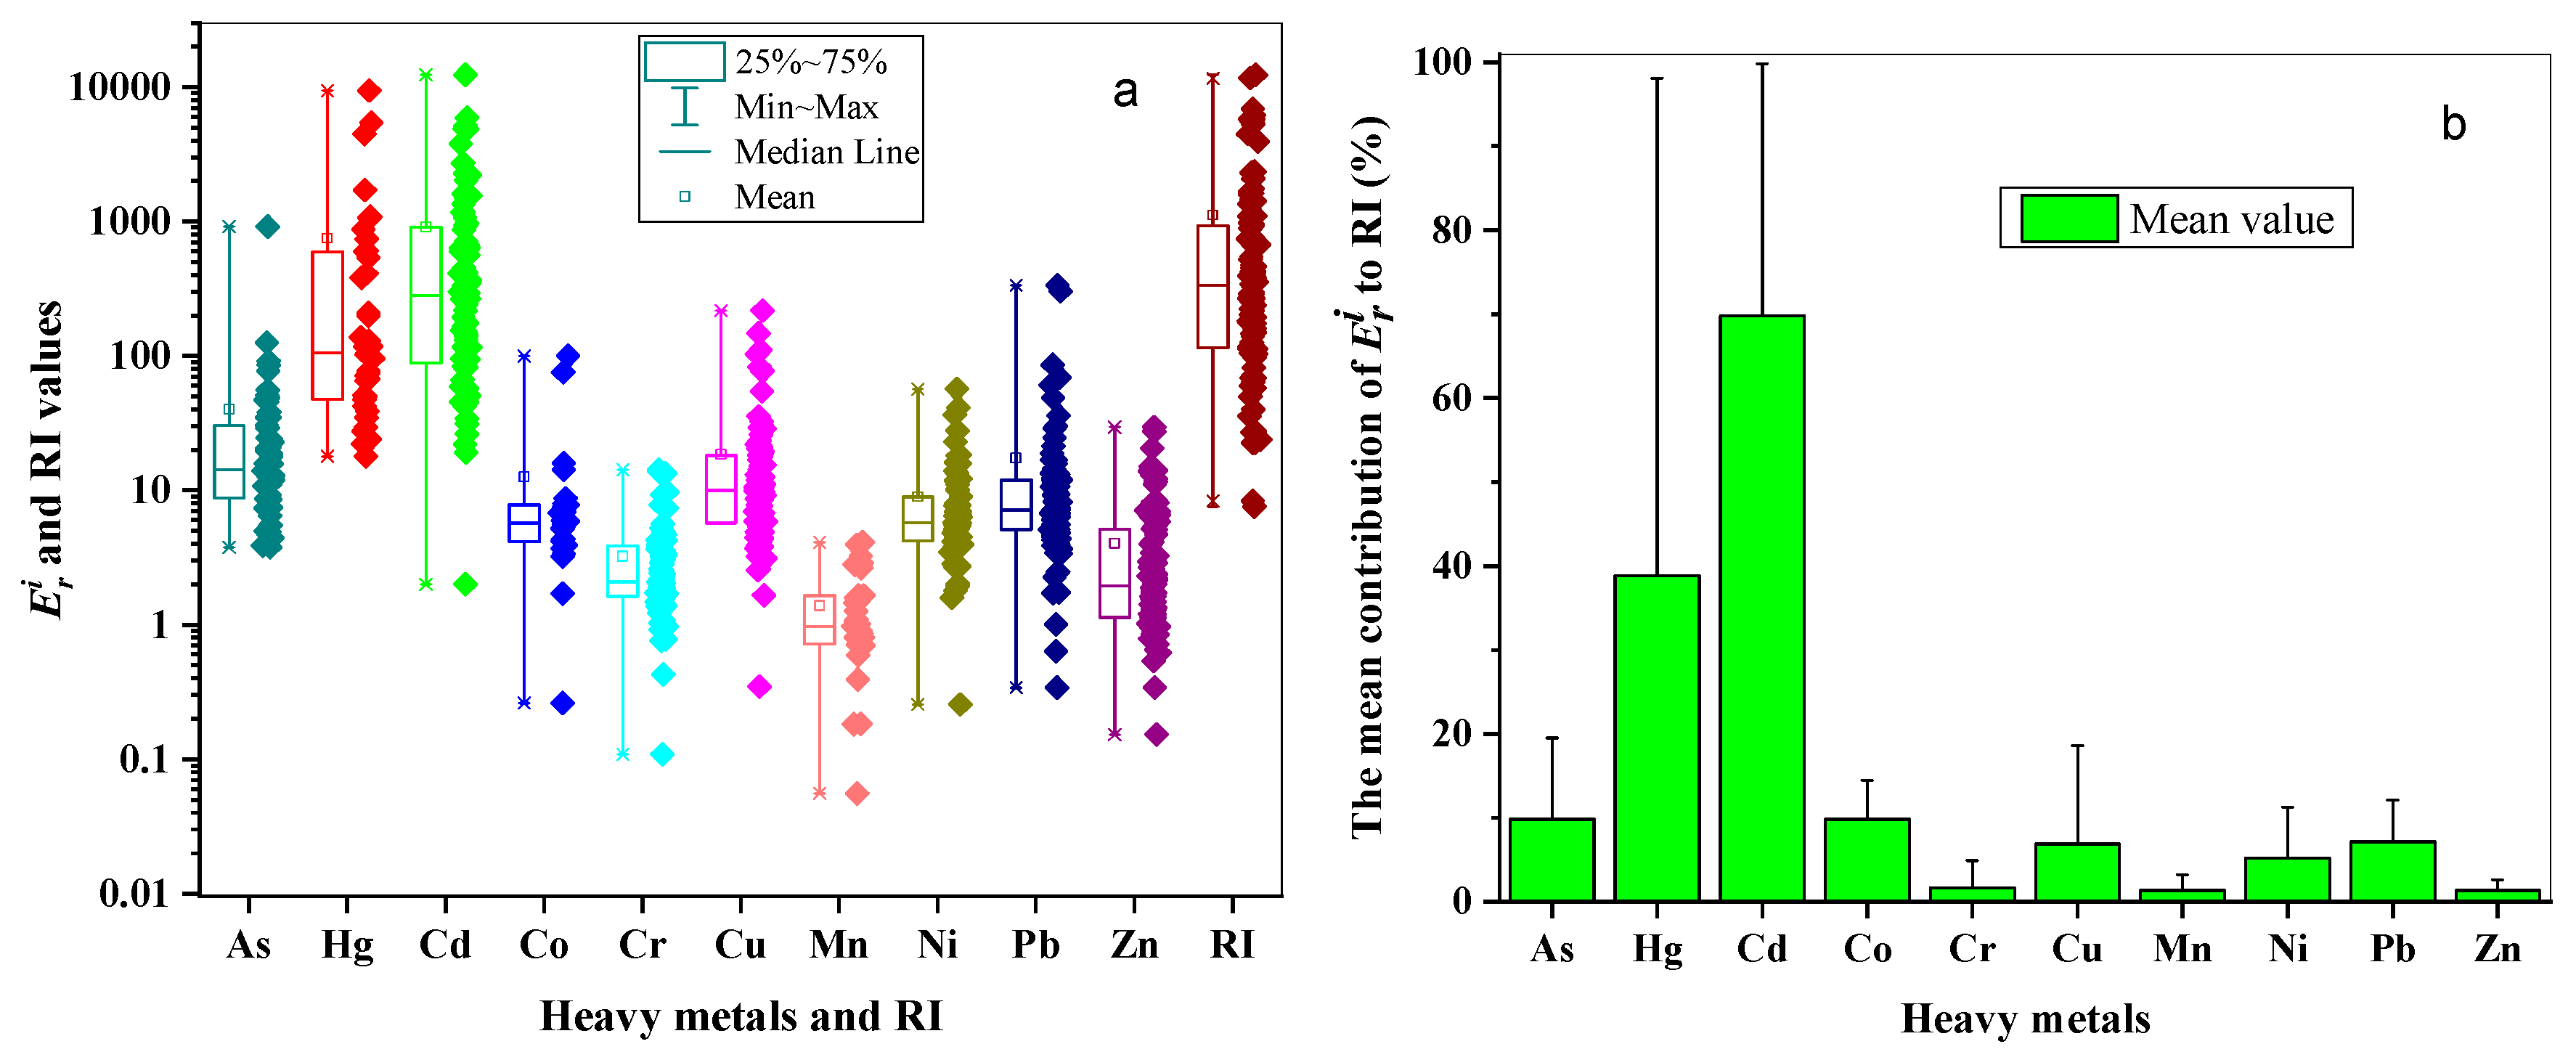
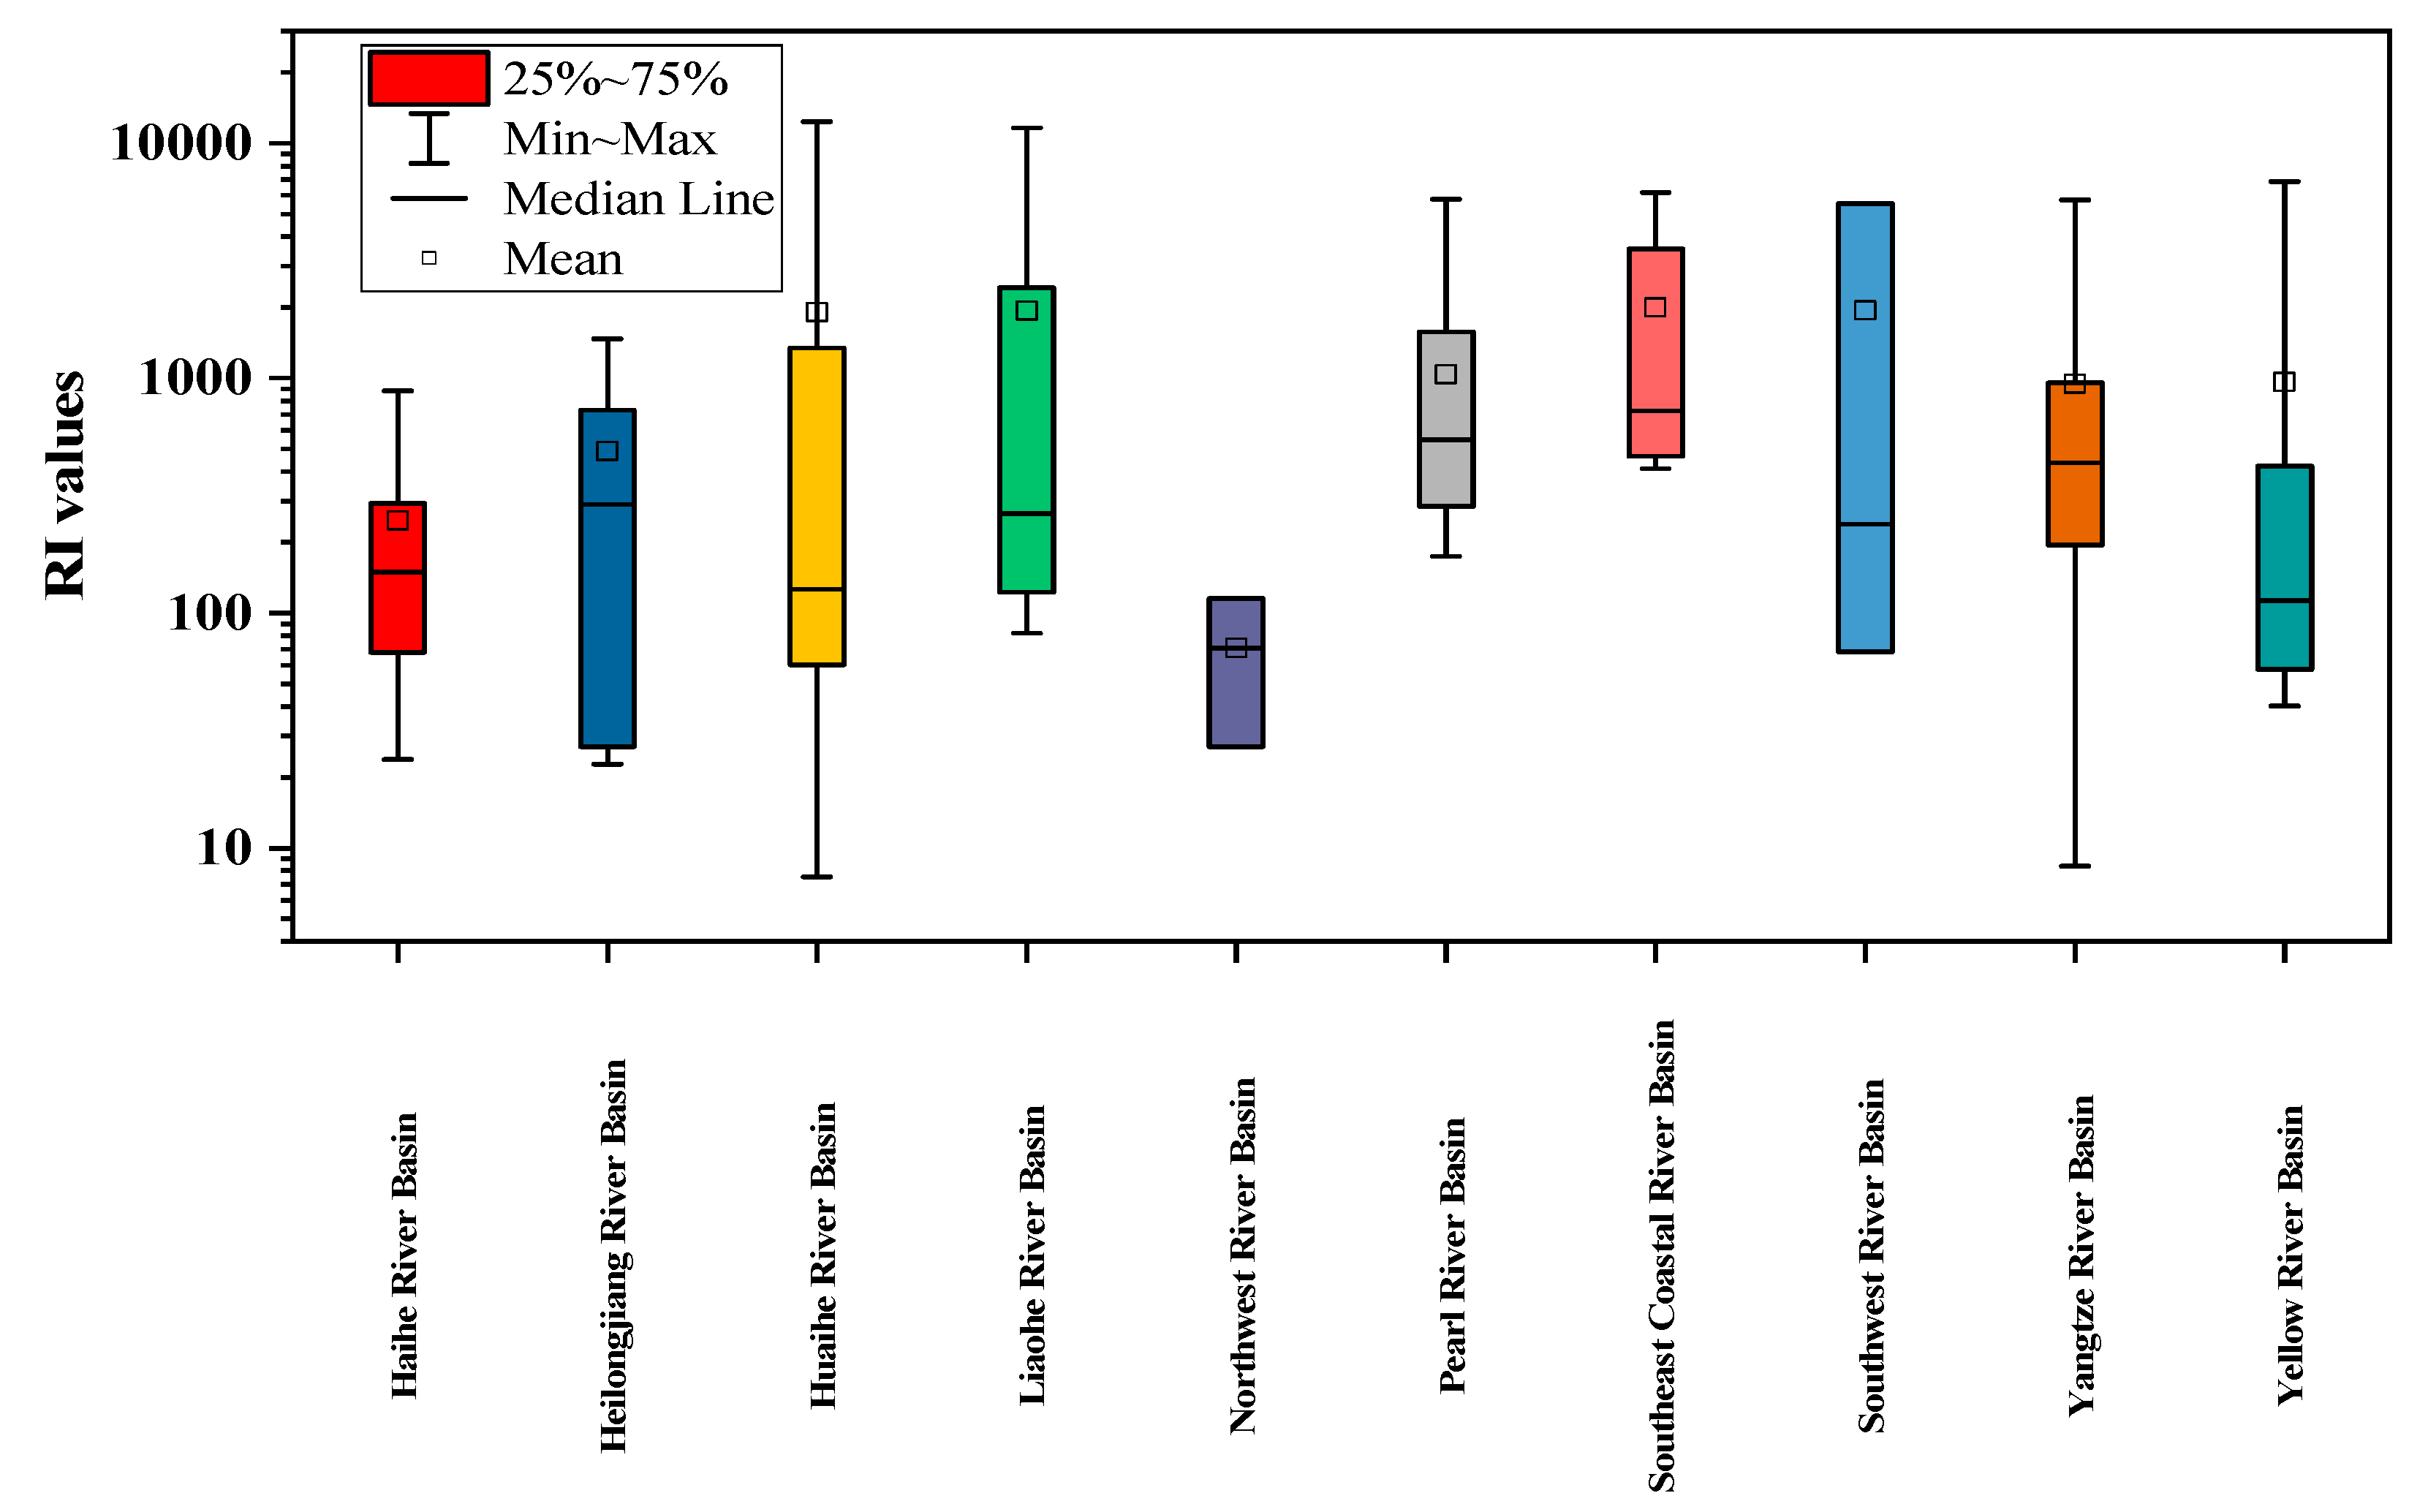
3.3. Pollution Assessment in Different River Basins
4. Conclusions
Author Contributions
Funding
Institutional Review Board Statement
Informed Consent Statement
Data Availability Statement
Conflicts of Interest
References
- Liu, W.; Liu, S.H.; Qin, W. The characteristics of heavy metals pollution in surface water at the intensive coal mining area in Guizhou. Environ. Chem. 2020, 39, 1788–1799. (In Chinese) [Google Scholar]
- Bi, S.P.; Yang, Y.; Xu, C.F.; Zhang, Y.; Zhang, X.B.; Zhang, X.R. Distribution of heavy metals and environmental assessment of surface sediment of typical estuaries in eastern China. Mar. Pollut. Bull. 2017, 121, 357–366. [Google Scholar] [CrossRef] [PubMed]
- Zhao, G.M.; Ye, S.Y.; Yuan, H.M. Surface sediment properties and heavy metal contamination assessment in river sediments of the Pearl River Delta, China. Mar. Pollut. Bull. 2018, 136, 300–308. [Google Scholar] [CrossRef] [PubMed]
- Ivanovic, J.; Janjic, J.; Baltic, M.; Milanov, R. Metal concentrations in water, sediment and three fish species from the Danube River, Serbia: A cause for environmental concern. Environ. Sci. Pollut. Res. Int. 2016, 23, 17105–17112. [Google Scholar] [CrossRef]
- Cheng, Q.L.; Wang, R.L.; Huang, W.H.; Wang, W.L.; Li, X.D. Assessment of heavy metal contamination in the sediments from the Yellow River Wetland National Nature Reserve (the Sanmenxia section), China. Environ. Sci. Pollut. Res. Int. 2015, 22, 8586–8593. [Google Scholar] [CrossRef]
- Lin, C.Y.; He, M.C.; Zhou, Y.X.; Guo, W.; Yang, Z.F. Distribution and contamination assessment of heavy metals in sediment of the Second Songhua River, China. Environ. Monit. Assess. 2008, 137, 329–342. [Google Scholar] [CrossRef]
- Xu, J.Y.; Xu, L.G.; Zheng, L.L.; Liu, B.G.; Liu, J.F.; Wang, X.L. Distribution, risk assessment, and source analysis of heavy metals in sediment of rivers located in the hilly area of southern China. J. Soils Sediments 2019, 19, 3608–3619. [Google Scholar] [CrossRef]
- Liu, Q.X.; Jia, Z.Z.; Li, S.Y.; Hu, J.T. Assessment of heavy metal pollution, distribution and quantitative source apportionment in surface sediments along a partially mixed estuary (Modaomen, China). Chemosphere 2019, 225, 829–838. [Google Scholar] [CrossRef] [PubMed]
- Li, W.J.; Lin, S.; Wang, W.C.; Huang, Z.W.; Zeng, H.L. Assessment of nutrient and heavy metal contamination in surface sediments of the Xiashan stream, eastern Guangdong Province, China. Environ. Sci. Pollut. Res. Int. 2020, 27, 25908–25924. [Google Scholar] [CrossRef] [PubMed]
- Xu, F.J.; Liu, Z.Q.; Cao, Y.C.; Qiu, L.W. Assessment of heavy metal contamination in urban river sediments in the Jiaozhou Bay catchment, Qingdao, China. Catena 2017, 150, 9–16. [Google Scholar] [CrossRef]
- Huang, S.S.; Tu, J.; Jin, Y.; Hua, M.; Wu, X.M. Contamination Assessment and Source Identification of Heavy Metals in River Sediments in Nantong, Eastern China. Int. J. Environ. Res. 2018, 12, 373–389. [Google Scholar] [CrossRef]
- Xiao, R.; Bai, J.H.; Huang, L.B.; Zhang, H.G. Distribution and pollution, toxicity and risk assessment of heavy metals in sediments from urban and rural rivers of the Pearl River delta in southern China. Ecotoxicology 2013, 22, 1564–1575. [Google Scholar] [CrossRef] [PubMed]
- Li, F.P.; Zhang, H.P.; Meng, X.Z.; Chen, L.; Yin, D.Q. Contamination by persistent toxic substances in surface sediment of urban rivers in Chaohu City, China. J. Environ. Sci. 2012, 24, 1934–1941. [Google Scholar] [CrossRef]
- Xu, D.Q.; Wang, Y.H.; Zhang, R.J.; Guo, J. Distribution, speciation, environmental risk, and source identification of heavy metals in surface sediments from the karst aquatic environment of the Lijiang River, Southwest China. Environ. Sci. Pollut. Res. 2016, 23, 9122–9133. [Google Scholar] [CrossRef]
- Chai, L.Y.; Li, H.; Yang, Z.H.; Min, X.B. Heavy metals and metalloids in the surface sediments of the Xiangjiang River, Hunan, China: Distribution, contamination, and ecological risk assessment. Environ. Sci. Pollut. Res. Int. 2017, 24, 874–885. [Google Scholar] [CrossRef] [PubMed]
- Yang, T.; Chen, J.; Li, X.P.; Wu, T. Ecological risk by heavy metal contents in sediments within the Wei River Basin, China. Environ. Earth Sci. 2019, 78, 101. [Google Scholar] [CrossRef]
- Huang, B.; Guo, Z.H.; Xiao, X.Y. Changes in chemical fractions and ecological risk prediction of heavy metals in estuarine sediments of Chunfeng Lake estuary, China. Mar. Pollut. Bull. 2019, 138, 575–583. [Google Scholar] [CrossRef]
- Zheng, N.; Wang, Q.C.; Liang, Z.Z.; Zheng, D.M. Characterization of heavy metal concentrations in the sediments of three freshwater rivers in Huludao City, Northeast China. Environ. Pollut. 2008, 154, 135–142. [Google Scholar] [CrossRef]
- Zhang, H.; Shan, B.Q. Historical records of heavy metal accumulation in sediments and the relationship with agricultural intensification in the Yangtze-Huaihe region, China. Sci. Total Environ. 2008, 399, 113–120. [Google Scholar] [CrossRef]
- Yang, Z.F.; Wang, Y.; Shen, Z.Y. Distribution and speciation of heavy metals in sediments from the mainstream, tributaries, and lakes of the Yangtze River catchment of Wuhan, China. J. Hazard. Mater. 2009, 166, 1186–1194. [Google Scholar] [CrossRef] [PubMed]
- Liu, J.L.; Li, Y.L.; Zhang, B. Ecological risk of heavy metals in sediments of the Luan River source water. Ecotoxicology 2009, 18, 748–758. [Google Scholar] [CrossRef] [PubMed]
- Wang, Y.M.; Chen, P.; Cui, R.N. Heavy metal concentrations in water, sediment, and tissues of two fish species (Triplohysa pappenheimi, Gobio hwanghensis) from the Lanzhou section of the Yellow River, China. Environ. Monit. Assess. 2010, 165, 97–102. [Google Scholar] [CrossRef] [PubMed]
- Guo, W.H.; Liu, X.B. Pollution and Potential Ecological Risk Evaluation of Heavy Metals in the Sediments around Dongjiang Harbor, Tianjin. Procedia Environ. Sci. 2010, 2, 729–736. [Google Scholar] [CrossRef] [Green Version]
- Zhang, C.X.; Qiao, Q.Q.; Piper, J.D.A. Assessment of heavy metal pollution from a Fe-smelting plant in urban river sediments using environmental magnetic and geochemical methods. Environ. Pollut. 2011, 159, 3057–3070. [Google Scholar] [CrossRef]
- Wu, Z.H.; He, M.C.; Lin, C.Y. Distribution and speciation of four heavy metals (Cd, Cr, Mn and Ni) in the surficial sediments from estuary in Daliao river and Yingkou Ba. Environ. Earth Sci. 2011, 63, 163–175. [Google Scholar] [CrossRef]
- Longjiang, M.; Qiang, F.; Duowen, M. Contamination assessment of heavy metal in surface sediments of the Wuding River, northern China. J. Radioanal. Nucl. Chem. 2011, 290, 409–414. [Google Scholar] [CrossRef]
- Song, Y.X.; Ji, J.F.; Yang, Z.F. Geochemical behavior assessment and apportionment of heavy metal contaminants in the bottom sediments of lower reach of Changjiang River. Catena 2011, 85, 73–81. [Google Scholar] [CrossRef]
- Wang, S.L.; Lin, C.; Cao, X. Heavy metals content and distribution in the surface sediments of the Guangzhou section of the Pearl River, Southern China. Environ. Earth Sci. 2011, 64, 1593–1605. [Google Scholar] [CrossRef]
- Ye, F.; Huang, X.P.; Zhang, D.W. Distribution of heavy metals in sediments of the Pearl River Estuary, Southern China: Implications for sources and historical changes. J. Environ. Sci. 2012, 24, 579–588. [Google Scholar] [CrossRef]
- Liu, R.P.; Xu, Y.N.; He, F.; Zhang, J.H. Environmental Impact by Heavy-Metal Dispersion from the Fine Sediments of the Shuangqiao River, Xiaoqinling Gold Area, China. Adv. Mater. Res. 2012, 518–523, 1929–1935. [Google Scholar] [CrossRef]
- Song, L.; Gu, D.G.; Huang, M.S. Spatial Distribution and Contamination Assessments of Heavy Metals in Sediments of Wenruitang River, Wenzhou, China. Adv. Mater. Res. 2012, 518–523, 2196–2203. [Google Scholar] [CrossRef]
- Hao, H.; Gao, B.; Wang, J.K. Distribution Characteristic and Potential Ecological Risk Assessment of Heavy Metals in Sediments of the Luanhe River. Rock Miner. Anal. 2012, 31, 1000–1005. (In Chinese) [Google Scholar]
- Chen, S.; Fu, X.H. Content and Background Concentrations of Heavy Metals in the Sediment of Urban River in Northern Anhui Province, China. Asian J. Chem. 2013, 25, 8755–8758. [Google Scholar] [CrossRef]
- Huang, S.L. Analysis and Assessment on Heavy Metal Contamination of Tuo River in Suzhou. Adv. Mater. Res. 2013, 712–715, 469–473. [Google Scholar] [CrossRef]
- Zhang, Y.; Fang, G. Assessment of Heavy Metals in Surface Sediments of Tuohe River, Anhui Province, China. Appl. Mech. Mater. 2013, 295–298, 794–797. [Google Scholar] [CrossRef]
- Li, X.; Wang, Y.; Li, B.H. Distribution and speciation of heavy metals in surface sediments from the Yangtze estuary and coastal areas. Environ. Earth Sci. 2012, 69, 1537–1547. [Google Scholar] [CrossRef]
- Tang, W.Z.; Zhao, Y.; Wang, C. Heavy metal contamination of overlying waters and bed sediments of Haihe Basin in China. Ecotoxicol. Environ. Saf. 2013, 98, 317–323. [Google Scholar] [CrossRef]
- Hu, B.Q.; Cui, R.Y.; Li, J. Occurrence and distribution of heavy metals in surface sediments of the Changhua River Estuary and adjacent shelf (Hainan Island). Mar. Pollut. Bull. 2013, 76, 400–405. [Google Scholar] [CrossRef]
- Guo, R.C.; He, X.Y. Spatial variations and ecological risk assessment of heavy metals in surface sediments on the upper reaches of Hun River, Northeast China. Environ. Earth Sci. 2013, 70, 1083–1090. [Google Scholar] [CrossRef]
- Deng, G.P.; Yang, W.Q.; Zhou, G.Y. Heavy metals and polycyclic aromatic hydrocarbons in sediments from the Shenzhen River, South China. Environ. Sci. Pollut. Res. Int. 2014, 21, 10594–10600. [Google Scholar] [CrossRef]
- Fu, J.; Zhao, C.P.; Luo, Y.P. Heavy metals in surface sediments of the Jialu River, China: Their relations to environmental factors. J. Hazard. Mater. 2014, 270, 102–109. [Google Scholar] [CrossRef]
- Gao, C.Y.; Lin, Q.X.; Bao, K.S. Historical variation and recent ecological risk of heavy metals in wetland sediments along Wusuli River, Northeast China. Environ. Earth Sci. 2014, 72, 4345–4355. [Google Scholar] [CrossRef]
- Wang, L.; Wang, Y.P.; Zhang, W.Z. Multivariate statistical techniques for evaluating and identifying the environmental significance of heavy metal contamination in sediments of the Yangtze River, China. Environ. Earth Sci. 2014, 71, 1183–1193. [Google Scholar] [CrossRef]
- Cui, J.; Zang, S.Y. Potential ecological risk of heavy metals and metalloid in the sediments of Wuyuer River basin, Heilongjiang Province, China. Ecotoxicology 2014, 23, 589–600. [Google Scholar] [CrossRef]
- Zhang, J.L.; Fu, K.D.; Wang, B. Assessment of heavy metal pollution of bed sediment in the Lancang River. Prog. Geogr. 2014, 33, 1136–1144. (In Chinese) [Google Scholar]
- Zheng, H.; Hu, G.C.; Xu, Z.C.; Li, H.S. Characterization and distribution of heavy metals, polybrominated diphenyl ethers and perfluoroalkyl substances in surface sediment from the Dayan River, South China. Bull. Environ. Contam. Toxicol. 2015, 94, 503–510. [Google Scholar] [CrossRef]
- Yao, Q.Z.; Wang, X.J.; Jian, H.M. Characterization of the Particle Size Fraction associated with Heavy Metals in Suspended Sediments of the Yellow River. Int. J. Environ. Res. Public Health 2015, 12, 6725–6744. [Google Scholar] [CrossRef]
- Cai, Y.; Zhang, W.G.; Zhou, M.C. Comprehensive Assessment of Heavy Metal Contamination in Surface Sediments from the Inflow Rivers of Taihu Basin. Clean Soil Air Water 2015, 43, 1582–1591. [Google Scholar] [CrossRef]
- Zhao, D.B.; Wan, S.M.; Yu, Z.J.; Huang, J. Distribution, enrichment and sources of heavy metals in surface sediments of Hainan Island rivers, China. Environ. Earth Sci. 2015, 74, 5097–5110. [Google Scholar] [CrossRef]
- Bo, L.J.; Wang, D.J.; Zhang, G.; Wang, C. Heavy Metal Speciation in Sediments and the Associated Ecological Risks in Rural Rivers in Southern Jiangsu Province, China. Soil Sediment Contam. Int. J. 2014, 24, 90–102. [Google Scholar] [CrossRef]
- Meng, Q.P.; Zhang, J.; Zhang, Z.Y.; Wu, T.R. Influence of ore deposits on river sediment compositions in Dan River drainage, China. J. Geochem. Explor. 2015, 159, 8–19. [Google Scholar] [CrossRef]
- Dong, D.M.; Liu, X.X.; Guo, Z.Y. Seasonal and Spatial Variations of Heavy Metal Pollution in Water and Sediments of China’s Tiaozi River. Pol. J. Environ. Stud. 2015, 24, 2371–2379. [Google Scholar] [CrossRef]
- He, Y.; Meng, W.; Xu, J.; Zhang, Y.; Liu, S.S.; Guo, C.S. Spatial distribution and toxicity assessment of heavy metals in sediments of Liaohe River, northeast China. Environ. Sci. Pollut. Res. Int. 2015, 22, 14960–14970. [Google Scholar] [CrossRef]
- Tang, W.Z.; Wang, L.S.; Shan, B.Q.; Zhan, Y. Heavy metal pollution of the surface sediments in Daqing River System, Haihe Basin. Acta Scientiae Circumstantiae 2015, 35, 3620. (In Chinese) [Google Scholar]
- Zhang, B.Z.; Lei, P. Pollution and ecological risk assessment of heavy metals in the surface sediments from the tributaries in the main urban district, Chongqing City. Acta Sci. Circumstantiae 2015, 35, 94–101. (In Chinese) [Google Scholar]
- Kuang, C.P.; Shan, Y.C.; Gu, J. Assessment of heavy metal contamination in water body and riverbed sediments of the Yanghe River in the Bohai Sea, China. Environ. Earth Sci. 2016, 75, 94–101. [Google Scholar] [CrossRef]
- Shao, S.G.; Xue, L.Q.; Liu, C. Assessment of heavy metals in sediment in a heavily polluted urban river in the Chaohu Basin, China. Chin. J. Oceanol. Limnol. 2015, 34, 526–538. [Google Scholar] [CrossRef]
- Wang, L.; Wang, L.A.; Yang, W. Contamination and comprehensive risk assessment of heavy metals in Liangtan River, Chongqing, China. Chem. Speciat. Bioavailab. 2016, 28, 119–126. [Google Scholar] [CrossRef] [Green Version]
- Yang, S.R.; Danek, T.; Yang, X.F. Distributing Characteristics of Heavy Metal Elements in A Tributary of Zhedong River in Laowangzhai Gold Deposit, Yunnan (China): An Implication to Environmentology from Sediments. IOP Conf. Ser. Earth Environ. Sci. 2016, 44, 052064. [Google Scholar] [CrossRef] [Green Version]
- Yi, Y.J.; Sun, J.; Tang, C.H.; Zhang, S.H. Ecological risk assessment of heavy metals in sediment in the upper reach of the Yangtze River. Environ. Sci. Pollut. Res. Int. 2016, 23, 11002–11013. [Google Scholar] [CrossRef]
- Wang, J.; Liu, G.J.; Lu, L.L. Geochemical normalization and assessment of heavy metals (Cu, Pb, Zn, and Ni) in sediments from the Huaihe River, Anhui, China. Catena 2015, 129, 30–38. [Google Scholar] [CrossRef]
- Zhang, H.; Jiang, Y.H.; Yang, T. Heavy Metal Concentrations and Risk Assessment of Sediments and Surface Water of the Gan River, China. J. Environ. Stud. 2016, 25, 1529–1540. [Google Scholar] [CrossRef]
- Zhu, X.L.; Shan, B.Q.; Tang, W.Z. Heavy metal in sediments of Ziya River in northern China: Distribution, potential risks, and source apportionment. Environ. Sci. Pollut. Res. Int. 2016, 23, 23511–23521. [Google Scholar] [CrossRef]
- He, D.; Shi, X.M.; Wu, D.Y. Particle-size distribution characteristics and pollution of heavy metals in the surface sediments of Kuitun River in Xinjiang, China. Environ. Earth Sci. 2016, 75, 23511–23521. [Google Scholar] [CrossRef]
- Zhang, Z.Y.; Li, J.Y.; Mamat, Z.; Ye, Q.F. Sources identification and pollution evaluation of heavy metals in the surface sediments of Bortala River, Northwest China. Ecotoxicol. Environ. Saf. 2016, 126, 94–101. [Google Scholar] [CrossRef] [PubMed]
- Meng, X.; Zhang, H.; Shan, B.Q.; Li, J. Pollution and Ecological Risk Assessment of Heavy Metal sin Surface Sediment of the Duliujian River Drainage Basin. Urban Environ. Urban Ecol. 2016, 29, 373–389. (In Chinese) [Google Scholar]
- Lin, C.Q.; Hu, G.R.; Yu, R.L. Pollution assessment and source analysis of heavy metals in offshore surface sediments from Jiulong River. China Environ. Sci. 2016, 36, 1218–1225. (In Chinese) [Google Scholar]
- Chang, H.J.; Gao, G.C.; Chen, K.L.; Sun, X.Z. Heavy Metal Contamination Characteristics of Fluvial Sediment Sections and Soil Sections in the Northeastern Qinghai Lake Watershed, China. Earth Environ. 2016, 44, 671–677. (In Chinese) [Google Scholar]
- Zhang, C.P.; Li, F.X. Spatial distribution and potential ecological risk assessment of heavy metals in sediments of Yalu River estuary wetland mudflat. Chin. J. Appl. Ecol. 2016, 27, 2884–2890. (In Chinese) [Google Scholar]
- Li, Y.; Chen, W.F.; Wei, R.; Yang, L.M. Distribution characteristics, toxicity and risk assessment of heavy metals in sediments of Minjiang River in Fuzhou City. Acta Sci. Circumstantiae 2016, 36, 1792–1799. (In Chinese) [Google Scholar]
- Chen, X.H. Research on the Pollution of Heavy Metals in Sediments along Kuye River in Shenfu Coal Mining Area; Henan Polytechnic University: Jiaozuo, China, 2016; p. 23. (In Chinese) [Google Scholar]
- Liu, X.X. The Pollution of Heavy Metals and Polycyclic Aromatic Hydrocarbons (PAHs) in the Sediments of Songhua River; Jilin University: Jilin, China, 2016; p. 31. (In Chinese) [Google Scholar]
- Huang, Q.R.; Cheng, X.F.; Xu, J. Analysis on Heavy Metal Distribution in Overlying Deposit and Pollution Characteristics in Drainage Basin of Xiaojiang River in Dongchuan District, China. IOP Conf. Ser. Earth Environ. Sci. 2017, 95, 022052. [Google Scholar] [CrossRef]
- Yu, R.; Hu, G.R.; Lin, C.Q.; Yang, Q.L. Contamination of heavy metals and isotopic tracing of Pb in intertidal surface sediments of Jinjiang River Estuary, SE China. Appl. Geochem. 2017, 83, 41–49. [Google Scholar] [CrossRef]
- Wu, P.B.; Yin, A.J.; Yang, X.H. Distribution and source identification of heavy metals in the sediments of a river flowing an urbanization gradient, Eastern China. Environ. Earth Sci. 2017, 76, 41–49. [Google Scholar] [CrossRef]
- Ke, X.; Gui, S.F.; Huang, H. Ecological risk assessment and source identification for heavy metals in surface sediment from the Liaohe River protected area, China. Chemosphere 2017, 175, 473–481. [Google Scholar] [CrossRef] [PubMed]
- Li, N.; Tian, Y.; Zhang, J. Heavy metal contamination status and source apportionment in sediments of Songhua River Harbin region, Northeast China. Environ. Sci. Pollut. Res. Int. 2017, 24, 3214–3225. [Google Scholar] [CrossRef]
- Weng, J.X. Post-dredging effect assessment based on sediment chemical quality in urban rivers of Yangzhou. Environ. Monit. Assess 2017, 189, 246. [Google Scholar] [CrossRef] [PubMed]
- Qu, X.D.; Ren, Z.; Zhang, M. Sediment heavy metals and benthic diversities in Hun-Tai River, northeast of China. Environ. Sci. Pollut. Res. Int. 2017, 24, 10662–10673. [Google Scholar] [CrossRef]
- Wang, Y.G.; Wu, J.L.; Wang, X.; Xu, F.; Li, H.L. Assessment on heavy metal pollution of the surface sediments from rivers in Beijing central district. South North Water Transf. Water Sci. Technol. 2017, 15, 74–80, 107. (In Chinese) [Google Scholar]
- Ning, Z.P.; Xiao, Q.X.; Lan, X.L. Spatial Distribution Characteristics and Potential Ecological Risk of Antimony and Selected Heavy Metals in Sediments of Duliujiang River. Environ. Sci. 2017, 38, 2784–2792. [Google Scholar]
- Yu, X.X.; Zhao, X.Q.; Sun, B.F. Spatial Distribution, Ecological Risk and Source Apportionment of Heavy Metals in Sediments from Xiaoqinghe Watershed of Jinan. J. Southwest China Norm. Univ. 2017, 42, 78–84. (In Chinese) [Google Scholar]
- Chang, H.J.; Cao, G.C. Pollution and Potential Ecological Risk of Heavy Metals in Sediment Pollution and Potential Ecological Risk of Heavy Metals in Sediment from the Lower Reaches of Shaliuhe River, Qinghai Lake Watershed. Sci. Geogr. Sin. 2017, 37, 259–265. (In Chinese) [Google Scholar]
- Tang, J.W.; Chai, L.Y.; Li, H.; Yang, Z.H. A 10-Year Statistical Analysis of Heavy Metals in River and Sediment in Hengyang Segment, Xiangjiang River Basin, China. Sustainability 2018, 10, 1057. [Google Scholar] [CrossRef] [Green Version]
- Zhang, Z.X.; Lu, Y.; Li, H.P. Assessment of heavy metal contamination, distribution and source identification in the sediments from the Zijiang River, China. Sci. Total Environ. 2018, 645, 235–243. [Google Scholar] [CrossRef] [PubMed]
- Gao, L.; Wang, Z.W.; Li, S.H.; Chen, J.Y. Bioavailability and toxicity of trace metals (Cd, Cr, Cu, Ni, and Zn) in sediment cores from the Shima River, South China. Chemosphere 2018, 192, 31–42. [Google Scholar] [CrossRef] [PubMed]
- Ji, H.B.; Li, H.X.; Zhang, Y. Distribution and risk assessment of heavy metals in overlying water, porewater, and sediments of Yongding River in a coal mine brownfield. J. Soils Sediments 2017, 18, 624–639. [Google Scholar] [CrossRef]
- Wang, Q.; Chen, Q.Y.; Yan, D.; Xin, S.G. Distribution, ecological risk, and source analysis of heavy metals in sediments of Taizihe River, China. Environ. Earth Sci. 2018, 77, 569. [Google Scholar] [CrossRef]
- Jia, Y.Y.; Wang, L.; Qu, Z.P.; Yang, Z.G. Distribution, contamination and accumulation of heavy metals in water, sediments, and freshwater shellfish from Liuyang River, Southern China. Environ. Sci. Pollut. Res. Int. 2018, 25, 7012–7020. [Google Scholar] [CrossRef]
- Xiao, D.D.; Shi, Z.T.; Wu, F. Seasonal and spatial variations of heavy metals in surface sediments collected from the Baoxiang River in the Dianchi Watershed, China. Hum. Ecol. Risk Assess. Int. J. 2018, 24, 1916–1929. [Google Scholar] [CrossRef]
- Zhou, K.S. Assessing Heavy Metal Pollution in Surface Sediments of China′s Shaying River. J. Environ. Stud. 2019, 28, 4495–4502. [Google Scholar]
- Wang, J.K.; Gao, B.; Yin, S.H.; Liu, L.S. Comprehensive Evaluation and Source Apportionment of Potential Toxic Elements in Soils and Sediments of Guishui River, Beijing. Water 2019, 11, 1847. [Google Scholar] [CrossRef] [Green Version]
- Shen, F.; Mao, L.J.; Sun, R.X. Contamination Evaluation and Source Identification of Heavy Metals in the Sediments from the Lishui River Watershed, Southern China. Int. J. Environ. Res. Public Health 2019, 16, 336. [Google Scholar] [CrossRef] [PubMed] [Green Version]
- Chen, M.; Li, F.G.; Tao, M.X. Distribution and ecological risks of heavy metals in river sediments and overlying water in typical mining areas of China. Mar. Pollut. Bull. 2019, 146, 893–899. [Google Scholar] [CrossRef] [PubMed]
- Rasool, A.; Xiao, T.F. Distribution and potential ecological risk assessment of trace elements in the stream water and sediments from Lanmuchang area, southwest Guizhou, China. Environ. Sci. Pollut. Res. Int. 2019, 26, 3706–3722. [Google Scholar] [CrossRef] [PubMed]
- Li, X.L.; Shen, H.L.; Zhao, Y.J. Distribution and Potential Ecological Risk of Heavy Metals in Water, Sediments, and Aquatic Macrophytes: A Case Study of the Junction of Four Rivers in Linyi City, China. Int. J. Environ. Res. Public Health 2019, 16, 2861. [Google Scholar] [CrossRef] [PubMed] [Green Version]
- Lan, X.L.; Liu, Y.Z.; Xiao, Q.X. Geochemical distribution, fractionation, and sources of heavy metals in dammed-river sediments: The Longjiang River, Southern China. Acta Geochim. 2019, 38, 190–201. [Google Scholar] [CrossRef]
- Cui, S.; Zhang, F.X.; Hu, P. Heavy Metals in Sediment from the Urban and Rural Rivers in Harbin City, Northeast China. Int. J. Environ. Res. Public Health 2019, 16, 4313. [Google Scholar] [CrossRef] [Green Version]
- Chen, L. Distribution and Potential Ecological Risk Assessment of Heavy Metals in River Sediments of Zigong. Guangzhou Chem. Ind. 2019, 47, 121–124. (In Chinese) [Google Scholar]
- Yu, C.; Zhang, Y.L.; Li, J.F. Morphological characteristics of heavy metals in the river sediments in the Baiyinnuoer lead-zinc mining area. Hydrogeol. Eng. Geol. 2019, 46, 162–168. [Google Scholar]
- Li, Z.; Liu, J.J.; Guo, H.C. Plateau River research: Ecological risk assessment of surface sediments in the Yarlung Tsangpo River. Environ. Sci. Pollut. Res. Int. 2020, 27, 6126–6138. [Google Scholar] [CrossRef]
- Liu, C.C.; Yin, J.; Hu, L.; Zhang, B. Spatial Distribution of Heavy Metals and Associated Risks in Sediment of the Urban River Flowing into the Pearl River Estuary, China. Arch. Environ. Contam. Toxicol. 2020, 78, 622–630. [Google Scholar] [CrossRef]
- Li, S.L.; Zhao, Z.F.; Qiu, X.C. Distribution Characteristics and Risk Assessment of Heavy Metals in Qingshui River Basin of Ningxia. J. Irrig. Drain. 2020, 39, 622–630. (In Chinese) [Google Scholar]
- MacDonald, D.D.; Ingersoll, C.G.; Berger, T.A. Development and evaluation of consensus-based sediment quality guidelines for freshwater ecosystems. Arch. Environ. Contam. Toxicol. 2000, 39, 20–31. [Google Scholar] [CrossRef]
- Muller, G. Index of geoaccumulation in sediments of the Rhine River. Geojournal. 1969, 3, 109–118. [Google Scholar]
- CEMS. Background Values of Elements in Soils of China; Environmental Science Press of China: Beijing, China, 1990. (In Chinese) [Google Scholar]
- Hakanson, L. An ecological risk index for aquatic pollution control: A sedimentological approach. Water Res. 1980, 14, 975–1001. [Google Scholar] [CrossRef]
- Nguyen, T.T.H.; Zhang, W.G.; Li, Z. Assessment of heavy metal pollution in Red River surface sediments, Vietnam. Mar. Pollut. Bull. 2016, 113, 513–519. [Google Scholar] [CrossRef] [PubMed]
- Zaini, N.M.; Lee, H.W.; Mohamed, K.N.; Sabuti, A.A.; Suratman, S.; Ong, M.C. Datasets on spatial and temporal distribution of heavy metals concentration in recent sediment at merang river system, Terengganu, Malaysia. Data Brief 2020, 31, 105900. [Google Scholar] [CrossRef]
- Rastmanesh, F.; Safaie, S.; Zarasvandi, A.R.; Edraki, M. Heavy metal enrichment and ecological risk assessment of surface sediments in Khorramabad River, West Iran. Environ. Monit. Assess. 2018, 190, 273. [Google Scholar] [CrossRef] [PubMed]
- Malvandi, H. Preliminary evaluation of heavy metal contamination in the Zarrin-Gol River sediments, Iran. Mar. Pollut. Bull. 2017, 117, 547–553. [Google Scholar] [CrossRef]
- Woitke, P.; Wellmitz, J.; Helm, D. Analysis and assessment of heavy metal pollution in suspended solids and sediments of the river Danube. Chemosphere 2003, 51, 633–642. [Google Scholar] [CrossRef]
- Morillo, J.; Usero, J.; Gracia, I. Heavy Metal Fractionation in Sediments from the Tinto River (Spain). Int. J. Environ. Anal. Chem. 2010, 82, 245–257. [Google Scholar] [CrossRef]
- Alyazichi, Y.M.; Jones, B.G.; McLean, E. Geochemical Assessment of Trace Element Pollution in Surface Sediments from the Georges River, Southern Sydney, Australia. Arch. Environ. Contam. Toxicol. 2017, 72, 247–259. [Google Scholar] [CrossRef] [PubMed] [Green Version]
- Hanif, N.; Eqani, S.A.M.A.S.; Ali, S.M. Geo-accumulation and enrichment of trace metals in sediments and their associated risks in the Chenab River, Pakistan. J. Geochem. Explor. 2016, 165, 62–70. [Google Scholar] [CrossRef]
- Dirbaba, N.B.; Yan, X.; Wu, H.J. Occurrences and Ecotoxicological Risk Assessment of Heavy Metals in Surface Sediments from Awash River Basin, Ethiopia. Water 2018, 10, 535. [Google Scholar] [CrossRef] [Green Version]
- Ru, X. Quantification and Evaluation of the Effects of Human Activities on the Regional Differences of Heavy Metal Distributions in Surface Sediments of Rivers: A Case Study of Xijiang River Basin, in South China University of Technology; South China University of Technology: Guangzhou, China, 2018; p. 77. (In Chinese) [Google Scholar]


| River Sites | Year | Number of the Sites | As | Hg | Cd | Co | Cr | Cu | Mn | Ni | Pb | Zn | Reference |
|---|---|---|---|---|---|---|---|---|---|---|---|---|---|
| Wuli River | 2008 | 10 | — | 8.67 | 7.95 | — | — | 56.63 | — | — | 80.50 | 525.20 | [18] |
| Liuchahe Watershed | 2008 | — | — | — | 0.11 | — | 67.80 | 39.80 | — | 38.30 | 37.70 | 53 | [19] |
| Lianshan River | 2008 | 4 | — | 1.59 | 9.73 | — | — | 73.08 | — | — | 104.90 | 450.90 | [18] |
| Second Songhua River | 2008 | — | — | — | — | 9.97 | 49.42 | 23.58 | 775 | 18.75 | 23.76 | 90.29 | [6] |
| Mainstream of the Yangtze River Catchment of Wuhan | 2009 | 16 | 15.85 | 0.15 | 1.53 | — | 87.82 | 51.64 | — | 41.91 | 45.18 | 140.27 | [20] |
| Luan River | 2009 | 10 | 5.15 | 0.18 | 0.15 | — | 71.47 | 45.98 | — | — | 22.11 | 75.52 | [21] |
| Lanzhou Section of Yellow River | 2010 | — | — | — | 0.59 | — | — | 18.49 | — | — | 16.13 | 78.53 | [22] |
| Dongjiang Harbor | 2010 | 11 | 17.13 | 0.07 | 0.06 | — | — | 19.36 | — | — | 4.34 | 88.40 | [23] |
| Lianshui River | 2011 | 64 | — | — | 9.11 | 55 | 95 | 71 | — | 102 | 412 | 1299 | [24] |
| Estuary in Daliao River and Yingkou Bay | 2011 | 35 | — | — | 0.34 | — | 60.83 | — | 615.58 | 35.23 | — | — | [25] |
| Wuding River | 2011 | 5 | — | — | 0.30 | — | 60.71 | 19 | 426.86 | 29.64 | 15.60 | 76.55 | [26] |
| Lower Reach of Yangtze River | 2011 | 83 | 13.54 | 0.16 | 2.82 | 17.33 | 98.32 | 48.61 | — | 41.49 | 50.77 | 129.73 | [27] |
| Guangzhou Section of Pearl River | 2011 | 22 | — | — | 1.80 | — | 97.40 | 351.80 | — | — | 103.50 | 387.40 | [28] |
| Rivers of Chaohu City | 2012 | 9 | 44.35 | 0.49 | — | — | 102.03 | 79.44 | — | — | 49.46 | 206.07 | [13] |
| Pearl River Estuary | 2012 | 20 | 17.42 | — | 0.29 | — | — | — | — | — | 40.51 | 109.09 | [29] |
| Shuangqiao River | 2012 | 66 | 4.40 | 3.80 | 7.10 | — | 52.70 | 435.20 | — | — | — | 779.90 | [30] |
| Wenruitang River | 2012 | 29 | — | — | 13.84 | — | 369.11 | 520.42 | — | 203.11 | 58.68 | 1065.82 | [31] |
| Luanhe River | 2012 | 15 | — | — | 0.30 | — | 60.40 | 48.07 | — | 26.15 | 25.55 | 76.42 | [32] |
| Urban River in Northern Anhui Province | 2013 | 37 | 14 | — | — | 245.64 | 53.42 | 44.80 | 854 | — | 33.45 | 107.43 | [33] |
| Tuo River of Suzhou | 2013 | 5 | — | — | — | 251.58 | 55.51 | 44.91 | — | — | — | 108.47 | [34] |
| Tuohe River | 2013 | — | — | — | 40 | — | 46 | 35 | 853 | — | 24 | 61 | [35] |
| Shiqiao River | 2013 | 9 | — | — | 2.79 | — | 133 | 100 | — | 66 | 96 | 327 | [12] |
| Shawan River | 2013 | 7 | — | — | 2.99 | — | 109 | 75 | — | 53 | 86 | 253 | [12] |
| Yangtze Estuary | 2013 | — | 10.10 | 0.07 | 0.23 | — | 86 | 29 | — | 34 | 27 | 93 | [36] |
| Haihe Basin | 2013 | 117 | — | — | 0.36 | 13.40 | 81.90 | 53.30 | 435 | 27.80 | 20 | 256 | [37] |
| Changhua River Estuary | 2013 | 27 | 9.50 | 0.02 | 0.09 | — | 53.10 | 15 | — | 23 | 27 | 73.70 | [38] |
| Upper Reach of Hun River | 2013 | — | 9.93 | — | 1.08 | — | 86.63 | 23.18 | — | 35.77 | 23.34 | 472.32 | [39] |
| Shenzhen River | 2014 | 9 | 12.30 | 0.25 | 0.82 | — | 134 | 178.20 | — | 120 | 92 | 692.20 | [40] |
| Jialu River | 2014 | 19 | 6.31 | 0.10 | 2.93 | — | 60.80 | 39.22 | — | 42.44 | 29.35 | 107.58 | [41] |
| Wusuli River | 2014 | 40 | — | — | — | 9.30 | 50.75 | 17.43 | 194.75 | 19.28 | 57.75 | 50.75 | [42] |
| Yangtze River | 2014 | 61 | 25.40 | 0.16 | 2.46 | 18.53 | 89.54 | 82 | — | 37.40 | 60 | 174 | [43] |
| Wuyuer River Basin | 2014 | 187 | 15.25 | 0.12 | 0.13 | — | 54.49 | 19.58 | — | 61.40 | 24.87 | 80.11 | [44] |
| Lancang River | 2014 | 22 | 47.33 | — | — | 14.40 | 128.23 | 37.38 | 562.91 | 49.38 | 98.27 | 99.67 | [45] |
| Sanmenxia Section of Yellow River Wetland National Nature Reserve | 2015 | 7 | — | — | 0.11 | — | 53.60 | 39.30 | 1633.50 | — | 41.10 | 72.40 | [5] |
| Dayan River | 2015 | 11 | — | — | 0.77 | — | — | 103.40 | — | — | 76.72 | 188.26 | [46] |
| Yellow River | 2015 | — | — | — | 0.23 | — | 77 | 34 | 912 | — | 27 | 97 | [47] |
| Inflow Rivers of Taihu Basin | 2015 | 71 | — | 0.16 | 0.74 | 15.04 | 165.57 | 115.78 | 503.10 | 63.05 | 69.39 | 344.03 | [48] |
| Hainan Island rivers | 2015 | 36 | 8.79 | 0.05 | 0.33 | — | 56.48 | 33.35 | — | — | 43.44 | 102.10 | [49] |
| Rivers in Yangyuan | 2015 | — | — | — | 5.71 | — | 138.97 | 87.20 | — | 75.07 | 64.47 | 322.40 | [50] |
| Dan River Drainage | 2015 | 95 | 7.97 | — | 0.80 | 0.81 | 4.69 | 2.13 | 39.76 | 1.91 | 3.40 | 12.76 | [51] |
| Tiaozi River | 2015 | — | — | — | 0.19 | — | — | 42.48 | 377.08 | 29.39 | 21.50 | 83.56 | [52] |
| Liaohe River | 2015 | 24 | — | — | 0.47 | — | — | 12.70 | 104.20 | 10.30 | 7.40 | 169.50 | [53] |
| Daqing River System | 2015 | 37 | — | — | 0.68 | — | 110.28 | 73.91 | — | 34.74 | 32.01 | 227.88 | [54] |
| Rivers in Chongqing | 2015 | 14 | — | — | 0.63 | — | 94.10 | 48.50 | — | 31.40 | 30.70 | 190 | [55] |
| Yanghe River | 2016 | 8 | — | — | 0.16 | — | 44.25 | 25.40 | — | — | 20.90 | 74.30 | [56] |
| Nanfei River in Chaohu Basin | 2016 | 21 | 12.20 | 0.90 | 3.80 | — | 143.20 | 145.40 | — | 45.70 | 70.80 | 869.30 | [57] |
| Liangtan River | 2016 | 10 | — | — | — | — | 75.77 | — | 533.30 | — | 186.16 | 226.60 | [58] |
| Tributary of Zhedong River | 2016 | 13 | 168.72 | 0.20 | — | — | — | 28.87 | — | — | 23.06 | 92.38 | [59] |
| Lijiang River | 2016 | 20 | 18.05 | 0.18 | 1.72 | — | 56.38 | 38.07 | — | — | 51.54 | 142.16 | [14] |
| Upper Reach of the Yangtze River | 2016 | 30 | 8.79 | 0.10 | 0.93 | — | 80.04 | 65.80 | — | — | 51.01 | 141.85 | [60] |
| Huaihe River | 2016 | 54 | — | — | — | — | — | 31.30 | 876.49 | 32.79 | 53.43 | 183.57 | [61] |
| Gan River | 2016 | 21 | — | — | 2.29 | 15.78 | 59.94 | 48 | — | 25.43 | 60.49 | 139.44 | [62] |
| Ziya River | 2016 | 28 | — | — | 1.31 | — | 460 | 91 | — | 39.10 | 49.70 | 459 | [63] |
| Kuitun River | 2016 | 18 | — | — | — | 5.43 | 69.55 | 50.27 | 551.14 | 22.32 | 26.19 | 92.06 | [64] |
| Bortala River | 2016 | 41 | 9.67 | 0.02 | 0.17 | — | 51.55 | 30.09 | — | 22.32 | 31.98 | 99.19 | [65] |
| Duliujian River Drainage Basin | 2016 | 42 | 68.40 | — | 0.60 | — | 62.10 | 142.50 | — | 33.9 | 30.10 | 111.40 | [66] |
| Jiulong River | 2016 | 39 | — | 0.17 | 0.96 | 14.92 | 93.64 | 83.03 | 1132.90 | 28.24 | 103.02 | 172.20 | [67] |
| Qinghai Lake watershed | 2016 | 6 | 10.32 | 0.10 | — | 32.20 | 11.59 | 409.40 | 15.83 | 14.43 | 43.40 | [68] | |
| Yalu River Estuary | 2016 | 27 | — | 0.06 | 0.30 | — | 56.50 | 113.60 | — | — | 30.20 | 100.30 | [69] |
| Minjiang River in Fuzhou | 2016 | — | 10.02 | — | 0.90 | — | 66.62 | 42.33 | — | — | 79.14 | 195.57 | [70] |
| Kuye River | 2016 | 26 | 33.53 | — | 1.08 | 16.68 | 289.59 | 56.01 | 1471.91 | — | 51.92 | 172.86 | [71] |
| Songhua River | 2016 | 10 | — | 0.98 | 1.10 | — | — | 10.70 | 759 | 45.70 | 32.40 | 214 | [72] |
| Xiaojiang River | 2017 | 15 | 39.50 | — | 2.30 | — | — | 130.40 | — | — | 103.40 | 564.90 | [73] |
| Jiaozhou Bay Catchment | 2017 | — | 7.70 | — | 0.16 | — | 69.30 | 23.60 | — | — | 20.20 | 64.60 | [10] |
| Jinjiang River Estuary | 2017 | 14 | — | 0.49 | 1.59 | 13.10 | 99.90 | 102 | 1264 | 28.50 | 95.60 | 331 | [74] |
| Qinhuai River | 2017 | 35 | 10.78 | 0.25 | 0.61 | — | 79.92 | 44.71 | — | 34.60 | 33.39 | 149 | [75] |
| Liaohe River protected Area | 2017 | 19 | 9.88 | — | 1.20 | — | 35.06 | 17.82 | — | 17.73 | 10.57 | 50.24 | [76] |
| Songhua River Harbin Region | 2017 | 11 | 10.13 | 0.56 | 0.27 | — | 121.40 | 13.33 | — | 12.89 | 18.80 | 92.54 | [77] |
| Xiangjiang River | 2017 | 16 | 54.90 | — | 13.68 | 23.19 | 120.44 | 101.36 | 1805.17 | 57.14 | 214.91 | 443.32 | [15] |
| Rivers of Yangzhou | 2017 | 38 | 11.12 | 0.20 | 0.28 | — | 37.85 | 29.07 | — | 24.15 | 38.87 | 64.40 | [78] |
| Huntai River | 2017 | 184 | — | — | 0.29 | — | 30 | 34 | 551 | 23 | 1.44 | 71 | [79] |
| Rivres in Beijing Central District | 2017 | 42 | 6.01 | 0.67 | 0.29 | — | 63 | 45 | 277 | — | 31.10 | — | [80] |
| Duliujiang River | 2017 | 62 | 30.61 | — | 0.42 | 17.91 | 38.60 | 22.65 | — | 33.36 | 27.21 | 93.40 | [81] |
| Xiaoqinghe Watershed | 2017 | — | 4.37 | — | 6.20 | — | 257.79 | 73.35 | — | 56.89 | 250.49 | 418.44 | [82] |
| Shaliuhe River | 2017 | 56 | 10.40 | — | 0.12 | — | 49.10 | 19.70 | 618 | 24.90 | 18.70 | 68.10 | [83] |
| Hengyang Segment of Xiangjiang River Basin | 2018 | 8 | 135.20 | 1.19 | 21.66 | — | 54.59 | 112.10 | 1884 | — | 359.40 | 659.70 | [84] |
| Zijiang River | 2018 | 59 | 31.53 | — | 3 | 16.76 | 67.51 | 34.19 | 1322.89 | 34.66 | 35.68 | 141.90 | [85] |
| Shima River | 2018 | 40 | — | — | 1.05 | — | 141.48 | 186 | — | 79.88 | — | 528.98 | [86] |
| River of Nantong | 2018 | 134 | 15.8 | 0.13 | 2.53 | — | 112 | 53.90 | — | 31.20 | 448 | 869 | [11] |
| Yongding River | 2018 | 11 | — | — | — | — | 47.61 | 24.71 | 450.09 | 40.45 | 35.47 | 94.75 | [87] |
| Taizihe River | 2018 | 24 | — | — | — | — | 136.80 | 92.60 | — | — | 1434.25 | 1737.35 | [88] |
| Liuyang River | 2018 | 13 | 14.55 | — | 1.24 | 10.72 | 38.67 | 50.20 | 581.67 | 17.48 | 37.82 | 138.48 | [89] |
| Baoxiang River | 2018 | 10 | — | — | — | — | 24.9 | 34.26 | — | 13.52 | 13.99 | 55.25 | [90] |
| Pearl River Delta | 2018 | 323 | 18.23 | 0.10 | 0.84 | — | 55.19 | 42.89 | — | — | 44.61 | 135.87 | [3] |
| Shaying River | 2019 | 14 | 0.44 | — | 5.32 | — | 58.19 | 37.14 | — | — | 35.64 | — | [91] |
| Modaomen Estuary | 2019 | 19 | — | — | 1.16 | 20.05 | 124.13 | 34.64 | — | 35.22 | 51.85 | 161.8 | [8] |
| Chunfeng Lake Estuary | 2019 | 13 | 45.45 | — | 0.64 | — | 28.06 | 9.06 | — | 16.54 | 42.83 | 84.76 | [17] |
| Guishui River | 2019 | — | 6.81 | — | 0.14 | 10.48 | 50.45 | 17.95 | 631.74 | 21.78 | 22.42 | 66.76 | [92] |
| Lishui River Watershed | 2019 | 21 | — | — | — | 9.39 | 61.20 | 22.84 | 757.15 | 25.31 | 40.19 | 91.66 | [93] |
| Quannan Section of Taojiang River | 2019 | 12 | 15.95 | 1.70 | 9.09 | — | 38.94 | 43.09 | — | — | 48.72 | 156.80 | [94] |
| Lanmuchang | 2019 | 13 | 250.73 | — | 0.69 | 33.61 | 201.41 | 98.47 | — | 79.41 | 28.16 | 213.84 | [95] |
| Rivers of Linyi | 2019 | 12 | — | — | — | — | 14.12 | 12.25 | — | 9.99 | 11.75 | 21.73 | [96] |
| Wei River | 2019 | 12 | 5.44 | 0.03 | — | — | 59.17 | — | — | — | 45.96 | 79.08 | [16] |
| Longjiang River | 2019 | 6 | 46.72 | — | 13.92 | — | — | — | — | — | 139.23 | 472.83 | [97] |
| Majiagou River | 2019 | 12 | — | — | 0.76 | — | 107.37 | 28.05 | — | 17.82 | 26.98 | 358.54 | [98] |
| Yunliang River | 2019 | 6 | — | — | 1.83 | — | 68.19 | 19.46 | — | 8.16 | 32.75 | 861.63 | [98] |
| River of Zigong | 2019 | 15 | 19.46 | 0.18 | 0.64 | — | 61.95 | 48.62 | — | 33.76 | 29.92 | 165.03 | [99] |
| River in the Baiyinnuoer lead–zinc Mining Area | 2019 | 6 | 35.17 | — | 6.06 | — | — | 32.23 | — | — | 906.50 | 1432.88 | [100] |
| Xiashan Stream | 2020 | 13 | 12.68 | 1.05 | 2 | — | 112.76 | 261.88 | — | 46.52 | 93.62 | 332.83 | [9] |
| Yarlung Tsangpo River | 2020 | 67 | 23.70 | 3.26 | 0.16 | 10.25 | 82.29 | 46.01 | 628.24 | 36.73 | 37.05 | 75.53 | [101] |
| Urban Rivers in Baoan District | 2020 | 28 | — | 0.20 | — | — | 101.76 | 465.91 | — | 77.42 | 71.73 | 481.34 | [102] |
| Qingshui River Basin | 2020 | 32 | 10.23 | 0.20 | — | — | 41.38 | — | — | — | 13.99 | — | [103] |
| Items | As | Hg | Cd | Co | Cr | Cu | Mn | Ni | Pb | Zn | Reference |
|---|---|---|---|---|---|---|---|---|---|---|---|
| Min | 0.44 | 0.02 | 0.06 | 0.81 | 4.69 | 2.13 | 39.76 | 1.91 | 1.44 | 12.76 | This study |
| Max | 250.73 | 8.67 | 40 | 251.58 | 460 | 520.42 | 1884 | 203.11 | 1434.25 | 1737.35 | |
| Median | 13.11 | 0.19 | 0.87 | 14.98 | 67.995 | 43.9 | 618 | 33.95 | 38.345 | 141.06 | |
| Mean ± SD | 27.36 ± 42.75 | 0.75 ± 1.56 | 2.87 ± 5.66 | 35.47 ± 66.47 | 88.71 ± 68.87 | 71.24 ± 90.55 | 751.27 ± 460.70 | 39.61 ± 30.38 | 84.06 ± 180.12 | 265.61 ± 311.35 | |
| CV | 156.28 | 206.77 | 197.56 | 187.38 | 77.64 | 127.10 | 61.46 | 76.70 | 214.28 | 117.22 | |
| TEC | 9.79 | 0.18 | 0.99 | — | 43.40 | 31.60 | — | 22.70 | 35.80 | 121 | [104] |
| PEC | 33.0 | 1.06 | 4.98 | — | 111 | 149 | — | 48.6 | 128 | 459 | [104] |
| % of samples < TEC | 25.45 | 46.16 | 54.76 | — | 13.64 | 31.25 | — | 25.75 | 47.48 | 44.90 | |
| % of samples between TEC-PEC | 52.73 | 38.46 | 28.57 | — | 65.91 | 61.46 | — | 54.55 | 43.43 | 38.78 | |
| % of samples > PEC | 21.82 | 15.38 | 16.67 | — | 20.45 | 7.29 | — | 19.70 | 9.09 | 16.32 | |
| Background | 11.20 | 0.065 | 0.097 | 12.70 | 61 | 22.60 | 583 | 26.90 | 26 | 74.20 | [106] |
| Regions | As | Hg | Cd | Co | Cr | Cu | Mn | Ni | Pb | Zn | Reference |
|---|---|---|---|---|---|---|---|---|---|---|---|
| China | 27.36 | 0.75 | 2.87 | 35.47 | 88.71 | 71.24 | 751.27 | 39.61 | 84.06 | 265.61 | This study |
| Red River, Vietnam | — | — | 0.35 | — | 85.71 | 83 | 806 | 38 | 66 | 127 | [108] |
| Merang river, Malaysia | 6.06 | — | — | — | 39.26 | 9.87 | 226.29 | — | 11.58 | 49.39 | [109] |
| Khorramabad River, West Iran | 5.80 | — | — | — | 169.60 | 49.40 | 636.30 | 76.80 | 19.20 | 87.60 | [110] |
| Danube River, Serbia | 13.89 | 0.80 | 1.69 | — | — | 50.93 | — | — | 64.92 | 270.40 | [4] |
| Zarrin-Gol River, Iran | 21.91 | — | — | 8.79 | 37.67 | — | 286.28 | 12.39 | — | 32.68 | [111] |
| Danube, Europe | 17.60 | — | 1.20 | — | 64 | 65.70 | 819 | 49.60 | 46.30 | 187 | [112] |
| Tinto River, Spain | — | — | 2.70 | 21 | 56 | 805 | — | 17 | 2330 | 901 | [113] |
| Georges River, Australia | 11 | — | — | — | 39 | 30 | — | 13 | 67 | 157 | [114] |
| River Chenab, Pakistan | — | — | 1.67 | 7.95 | — | 8.16 | 494 | — | 18.10 | 33.70 | [115] |
| Awash River, Ethiopia | 15.87 | 0.17 | 2.60 | — | 120.58 | 79.43 | — | 89.46 | 13.53 | 382.73 | [116] |
Publisher’s Note: MDPI stays neutral with regard to jurisdictional claims in published maps and institutional affiliations. |
© 2021 by the authors. Licensee MDPI, Basel, Switzerland. This article is an open access article distributed under the terms and conditions of the Creative Commons Attribution (CC BY) license (https://creativecommons.org/licenses/by/4.0/).
Share and Cite
Lian, G.; Lee, X. Concentrations, Distribution, and Pollution Assessment of Metals in River Sediments in China. Int. J. Environ. Res. Public Health 2021, 18, 6908. https://doi.org/10.3390/ijerph18136908
Lian G, Lee X. Concentrations, Distribution, and Pollution Assessment of Metals in River Sediments in China. International Journal of Environmental Research and Public Health. 2021; 18(13):6908. https://doi.org/10.3390/ijerph18136908
Chicago/Turabian StyleLian, Guoqi, and Xinqing Lee. 2021. "Concentrations, Distribution, and Pollution Assessment of Metals in River Sediments in China" International Journal of Environmental Research and Public Health 18, no. 13: 6908. https://doi.org/10.3390/ijerph18136908