Abstract
In the Karst area of southwestern China, the heavy metals in the sediment of a reservoir are determined by both human activities and the high background values. Thus, this study explores the change of heavy metals in surface sediment after ten-year sustainable development in the upstream areas of a reservoir, Huaxi Reservoir, located in Guiyang of southwestern China, then evaluates the risk of these heavy metals to water environment systematically and finally identifies the sources in both 2019 and 2009. The results reveal that all of the measured heavy metals decrease dramatically and their spatial distributions change from the increase-decrease pattern to decrease-increase pattern, implying different locations of main source input. The risk indices based on the total or average content and relative or reference values have decreased to the lowest level. However, those indices calculated from the absolute content of each metalloid still show a low or a moderate risk because of the high background value, such as As and Cr. Moreover, although only one main source of heavy metals is identified in both 2019 and 2009, the risk from human activities still cannot be neglected because agricultural production and infrastructure construction would promote the weathering of soil and then these heavy metals from the soil will be brought into the reservoir with the rainfall-runoff process. The high background value of specific heavy metals, e.g., As and Cr would still exert some challenges to the water environment protections because the non-point source input of heavy metal cannot be controlled easily by promulgating a series of bans. These results provide important reference for creating the policies of water environment protection, especially in some Karst area of southwestern China that exhibits high background value of heavy metals.
1. Introduction
Heavy metals are one of the main sources of pollution to water body. Generally, heavy metals originate from natural sources and anthropogenic activities [1]. Mining, smelting, traffic, machinery manufacturing, sewage, chemical fertilizer and pesticide are the main contributors to environment pollution by heavy metal [2,3,4,5]. Once these heavy metals are discharged into water environment, they could threaten the ecosystem and public health due to the bioaccumulation or biomagnification in the aquatic food web [6,7,8,9,10,11]. Particularly, the risk level could be higher in areas with high background values such as Karst region of Guizhou Province in southwestern China [12,13,14,15,16].
Sediments, which are one of the key components of aquatic ecosystem, not only provide habitats and foods for benthic organisms but have also been considered as sinks and secondary sources of heavy metals in the water environment [17,18,19]. The reason is that more than 90% of total heavy metals load in the aquatic environment is bound to suspend matter and then settle down to the bottom of the sediment [5,11,20]. However, the contaminated sediment would release heavy metals into the overlying water when the bottom environment is disturbed [11] and then pollute the water and pose environmental risk to the aquatic ecosystems [21]. A large number of research have reported that the heavy metal contaminated sediment has become a serious threat to aquatic ecosystems, such as river [9,19,22], lake [11,23], estuarine [24], wetland [25] and reservoirs [26]. Thus, sediments have been widely used as aquatic environmental indicators of the present contamination characteristics of trace metals [27].
In order to quantify the environmental risk of the heavy metals in sediment, several empirical and statistical indices have also been applied to evaluate the pollution status and ecological risk. For example, geo-accumulation index (Igeo), enrichment factor (EF), potential ecological risk index (RI), contamination factor (CF) and sediment quality guidelines (SQG) have been employed to assess the heavy metal contamination [21,28,29]. Hazard index (HI) and carcinogenic risk or the lifetime cancer risk (LCR) have also been adopted to assess potential human health risks [30]. Moreover, the Pearson’s correlation coefficient (PCC), principal component analysis (PCA) and hierarchical cluster analysis (HCA) are the main statistical methods for recognizing the origin and the evaluation of the load contaminated status of heavy metals [21,22,23].
Reservoirs play an important role in the functions of irrigation, drinking water, control flooding and hydropower [31]. In order to protect the water environment, many restoration projects have been executed for several decades in China, such as shutting down polluting enterprises, rationally use fertilizers and pesticides, strictly regulating emission standards and turning agricultural land back into forests. After taking a series of tools, the content of some heavy metals decreases dramatically. However, whether there are still environmental risks that still exists are not clear.
Therefore, the objectives of this study are to explore the change of heavy metals in sediments after ten years of sustainable development in the upstream areas of reservoir, Huaxi Reservoir, located in Guiyang of southwestern China with high background values of specific heavy metals such as As and Cr and then to evaluate the risk of these heavy metals to the water environment. The results would provide important reference for making policies of water environment protection, especially in the areas where heavy metals exhibit high background values.
2. Materials and Methods
2.1. Study Area
The study area, Huaxi Reservoir, is located in the Guiyang of southwestern China (N26°25″ N; 106°40″ E), as shown in Figure 1. This area features subtropical humid climate with the average temperature of 15.3 °C and annual precipitation of 1129.5 mm. The reservoir was built in 1958. The storage capacity reached 31.4 million m3 after the latest upgrade in 2008. The maximum height of the dam is 51.6 m and the length of the dam is 384 m. The design flood level is 1143.32 m. The main functions of the reservoir are controlling floods and water supply because the main areas of the Guiyang City and Huaxi District are in the downstream area of the dam. The ability of controlling floods can prevent the extreme risk level of once-in-a-century. There is little agricultural purpose with the process of urbanization. Recreational activities were banned in the reservoir in 2013. In the upstream of the dam, the catchment covers an area of 176 km2 and features the city mixed with a series of hills. The average height is about 1165 m with the range of 1094 m to 1237 m based on DEM. As shown in Figure 1, the length of river is about 14.42 km in the upstream areas.
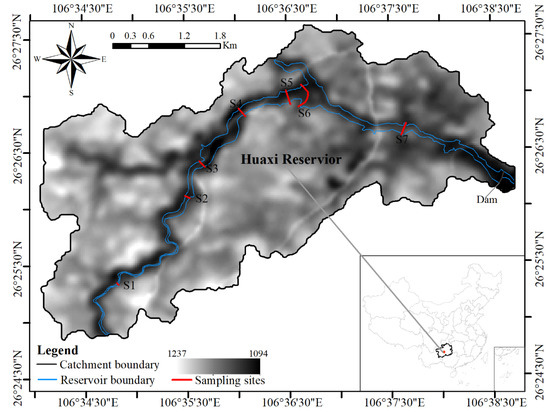
Figure 1.
Sampling sites and DEM of in the catchment of Huaxi Reservoir.
With urbanization in the last ten years, the area of urban land increased from 7.73% to 16.86%, while the others show a more or less decreasing trend. Based on the investigations in 2009, the main sources of pollution were domestic sewage and agricultural non-point source pollution in the whole catchment and infrastructure constructions in the middle stream areas. At present, most of the domestic sewage is collected systematically, farming activities have decreased substantially because of the development of tourism and there are still some infrastructure constructions in the upstream areas while most of the infrastructure constructions in the middle stream have been completed.
2.2. Sample Collection
In this study, surface sediments (0–5 cm) in Huaxi Reservoir are sampled from 7 typical transects in April 2019. These samples are collected by a stainless-steel hand shovel covered by rubber from upstream to downstream and the location of sampling transects are also shown in Figure 1. In order to evaluate the change of heavy metals in sediment and the restoration of aquatic environment of Huaxi Reservoir, the sampling profiles are kept the same as or close to the previous latest study [32].
2.3. Sample Analysis
The method of sample analysis is based on the standard issued by Ministry of Environment Protection of the People’s Republic of China (HJ832-2017) [33]. The sediment samples are naturally air-dried at room temperature and then pulverized in an agate mortar and filtered through a sieve of 100 mesh nylon sieve. For heavy metals, approximately 0.10 g of dry sediment sample is digested with acid (6 mL HNO3, 2 mL HCl and 2 mL HF) and is incubated in the microwave (Mars-40TFM) of 200 °C for 30 min. After digestion, the resulting solutions are diluted to 50 mL ultrapure water and the analysis was performed by ICP-MS (Thermo Fisher X2, Waltham, MA, USA). Three duplicates are measured in the experimental analysis.
2.4. Methods for Evaluation of Pollution Risk
2.4.1. Sediment Quality Guidelines
Sediment quality guidelines (SQGs) are widely used to assess the sediment toxicity [18,22,34]. According to the recommendation of MacDonald et al. [35], the threshold effect level (TEL) is used to identify the contaminant concentration below which there is no adverse effects on sediment-dwelling organisms. The probable effect level (PEL) and the severe effect level (SEL) are used to identify the concentration above which there are possible adverse effects on sediment-dwelling organisms [22,25]. The threshold values of these indices are presented in Table 1.

Table 1.
Concentrations of heavy metals in the sediments of the Huaxi Reservoir and other nearby reservoirs, the background values and sediment quality guidelines (mg/kg).
2.4.2. Geo-Accumulation Index (Igeo)
Geo-accumulation index, Igeo, is widely used to evaluate contamination by correlating the measured current concentration of metals with their background concentrations. The calculation of geo-accumulation index (Igeo) is as follows:
where Cn is the current measured concentration of heavy metals in sediment and Bn is the geochemical background concentration [41]. This study refers the soil metal concentration of Guizhou Province as the sediment background [40], i.e., 95.9 mg/kg for Cr, 20 mg/kg for As, 0.66 mg/kg for Cd, 32 mg/kg for Cu, 99.5 mg/kg for Zn and 35.2 mg/kg for Pb. The constant 1.5 is a matrix correction for lithogenic effects [2]. The Igeo index is divided into seven classes: Igeo ≤ 0, unpolluted; 0 < Igeo < 1, unpolluted to moderately polluted; 1 < Igeo < 2, moderately polluted; 2 < Igeo < 3, moderately to strongly polluted; 3 < Igeo < 4, strongly polluted; 4 < Igeo < 5, strongly to very strongly polluted; and 5 ≤ Igeo, very strongly polluted.
2.4.3. Contamination Factor (CF)
Contamination factor (CF) is usually used to disclose the contamination level of potential toxic elements in sediments and the calculation of CF is described as follows [42,43]:
where Cmetal is the average concentration of heavy metals in the sediments and Cbackground is geochemical background concentration. The CF index can be divided into four classes: low degree with CF < 1; moderate contamination with 1 < CF < 3; considerable contamination with 3 ≤ CF < 6; and very high contamination with CF > 6.
2.4.4. Potential Ecological Risk Index ()
Potential ecological risk index () aims to evaluate the degree of pollution in sediment and to determine the pollution [42]. The calculation of is given below:
where Cn is the measured concentration of metal, Cref is the reference value of metal, is the toxic response factor, i.e., 30 for Cd, 10 for As, 5 for Cu, Pb and Ni, 2 for Cr and 1 for Zn. According to the study of Maanan et al. [44], the risk range and their corresponding classifications are as follows: low ecological risk with < 40; medium ecological risk with 40 ≤ < 160; high ecological risk with 160 ≤ < 320; and significantly high ecological risk with 320 ≥ .
2.4.5. Enrichment Factor (EF)
Enrichment factor (EF) is an effective tool to evaluate the pollution degree of heavy metals driven by anthropogenic or geologic forces in sediments [45,46,47]. It is a normalization method suggested by Sinex and Helz [48] and is used in standardizations of the acquired heavy metal content in sediments with respect to a reference metal that is either Fe or Al [49]. In this study, Fe is used as a reference metal for geochemical normalization. The EF is calculated by the following formula:
where Cn is the measured concentration of heavy metal, Cbackground is its corresponding background value and Fen and Febackground are the concentrations of Fe in the sample and its corresponding background value, respectively. The sediments could be divided into six classes based on the EF value: EF < 1.5, no enrichment; 1.5 < EF < 2, slight enrichment; 2 < EF < 5, moderate enrichment; 5 < EF < 20, severe enrichment; 20 < EF < 40, highly severe enrichment; and 40 < EF, extremely severe enrichment [50].
2.4.6. Toxic Risk Index (TRI)
Toxic risk index (TRI) method depends on the TEL and PEL effects for the toxic risk evaluation of heavy metals in sediments [22]. The TRI calculation formula is described as the following.
The following equation is used to calculate the integrated toxic risks of heavy metals in sediments:
where is the toxic risk index of a single heavy metal, Ci is current heavy metal concentration in the sediment sample, n is the number of metals and TRI is the integrated toxic risk index. The classification of TRI is the following: TRI ≤ 5, no toxic risk; 5< TRI ≤10, low toxic risk; 10 < TRI ≤ 15, moderate toxic risk; 15 < TRI ≤ 20, considerable toxic risk; and TRI > 20, very high toxic risk [22,51].
2.4.7. Modified Hazard Quotient (mHQ)
Metal concentration in sediments and the synoptic adverse ecological effect distributions for the threshold levels (TEL, PEL and SEL) were reported by MacDonald et al. [35]. The method of modified hazard quotient (mHQ) is used to assess the degree of risk posed by heavy metals to the aquatic environment and the sediment dwelling organisms. The following equation is used to calculate the value of mHQ [22].
The mHQ rank comprises of eight classes: mHQ < 0.5, nil to very low severity of contamination; 0.5 < mHQ < 1.0, very low severity of contamination; 1.0 < mHQ < 1.5, low severity of contamination; 1.5 < mHQ < 2.0, moderate severity of contamination; 2.0 < mHQ < 2.5, considerable severity of contamination; 2.5 < mHQ <3.0, high severity of contamination; 3.0 < mHQ < 3.5, very high severity of contamination; mHQ > 3.5, extreme severity of contamination.
2.4.8. Ecological Contamination Index (ECI)
The ECI is an aggregative empirical approach that estimates the risks associated with an ecosystem using a source specific factor derived primarily from principal component analysis (PCA)/factor analysis (FA). The ECI is calculated in the following [18]:
where Bn is the reciprocal of derived eigenvalue of heavy metal concentrations. The proposed ranking of risks posed by heavy metals to ecological systems using the ECI is the following: ECI > 7, extremely contaminated; 6 < ECI < 7, highly contaminated; 5 < ECI < 6, considerably to highly contaminated; 4 < ECI < 5, moderately to considerably contaminated; 3 < ECI < 4, slightly to moderately contaminated; 2 < ECI < 3, uncontaminated to slightly contaminated; ECI < 2, uncontaminated [18].
2.4.9. Potential Human Health Risk Assessment
Health risk assessment is a commonly used method to estimate the risk posed to humans due to exposure to certain contaminants of known amounts [30,52]. Heavy metal exposure to humans can occur through three major pathways either by means of (1) direct oral ingestion of heavy metal particles, (2) inhalation of the heavy metal particles through the mouth and nose and (3) dermal absorption of the particles attached to exposed skin [30,53].
The chronic daily intake (CDI) (mg/kg/day) of contaminant was applied to estimate the health risks via ingestion, inhalation and dermal contact path ways on both adults and children. The equations estimating the CDI are described as follows [30]:
where Csed is the concentration of heavy metal in sediment (mg/kg), IngR indicates the ingestion rate of the soil (100 mg/day for adult and 200 mg/day for children), EF is the exposure frequency (350 days/year), ED is the exposure duration (24 years for adult and 6 years for children), BW is the average body weight (70 kg for adult and 15 kg for children), AT is the averaging time (365 × ED), CF, as shown in 2.4.3, is the conversion factor (1 × 10⁻⁶ kg/mg), InhR is the inhalation rate (20 mg/cm2), PEF is the particle emission factor (1.36 × 10⁹ m3/kg), SA is the surface area of the skin that is in contact with the soil (5700 cm2/event), AFsed is the skin adherence factor (0.07 mg/cm2) and ABS is the dermal absorption factor (0.001). The exposure factors referenced by Yuswir et al. [54] are based on the values documented in USEPA [55].
The hazard index (HI) was used to evaluate the cumulative non-carcinogenic risk. HI equals to the sum of hazard quotient (HQ), as shown in Equations (12) and (13):
where RfD refers to the reference dose based on USEPA [56]. The values of RfD are different from one another, i.e., 0.0371 for Cu, 0.0035 for Pb, 0.3 for Zn, 0.003 for Cr, 0.001 for Cd and 0.0003 for As [56]. No significant risk and non-carcinogenic effects are expected if the value is smaller than one (HI < 1). However, if the HI value is higher than one (HI > 1), non-carcinogenic risk effects may arise [30].
According to USEPA [57], Cd, Cr, Pb and As are classified into heavy metals that induce carcinogenic risk. Therefore, the carcinogenic risk or the lifetime cancer risk (LCR) is calculated as follow:
where LCR is the summation of the cancer risk from each exposure pathway. The values of cancer slope factor (CSF) for Cd, Cr, Pb and As are 6.3, 0.5, 0.0085 and 1.5 mg/kg/day, respectively [56]. The tolerable threshold value of the cancer risk is 1 × 10⁻⁴, while the acceptable LCR for regulatory purposes is 1 × 10⁻⁶ to 1 × 10⁻⁴ [55].
2.5. Statistical Analyses
Pearson simple-linear regression analysis is conducted to investigate the correlation among these metals. The principal component analysis (PCA) is used to identify the potential sources.
(1) Pearson correlation coefficient
The Pearson correlation coefficient of two variables is calculated below:
where ρ is the correlation coefficient; Cov (X, Y) is the covariance of the two variables; σX and σY is the standard deviation of the variable X and Y, respectively.
The transformed ρ follows t distribution with n–2 degrees of freedom [58] as described as follows.
(2) Principal component analysis
The principal component analysis, PCA, is a specific linear transformation based on multi original variables [59]. A vector with dimension P is described in the following.
The linear transformation is described below.
In order to maintain the transformed variable, Z, as representing the maximum information, the Zi is independent from one another.
(3) The rank sum test
If the two populations with the number of n1 and n2 have the same continuous distribution, then mean of the rank sum follows the normal distribution. Thus, the z stat is obtained by a normalized transformation [59] described in the following:
where μw and σw are mean and standard deviation of the rank sum, N = n1 + n2. The significant level is obtained based on the z stat, e.g., α = 0.05 with z stat of 1.96.
3. Results
3.1. Spatial and Temporal Trends of Heavy Metals
3.1.1. Temporal Changes
Based on the current values measured in this study and the values reported in 2009, all the heavy metals in sediment decreased dramatically in Huaxi Reservoir after a ten-year development, as shown in Table 1 and Figure 2.
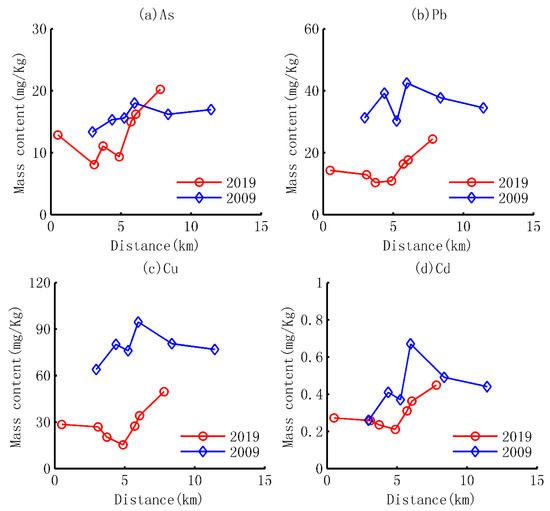
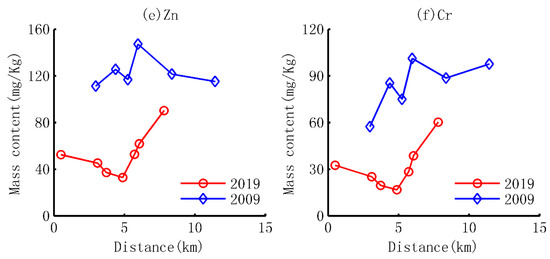
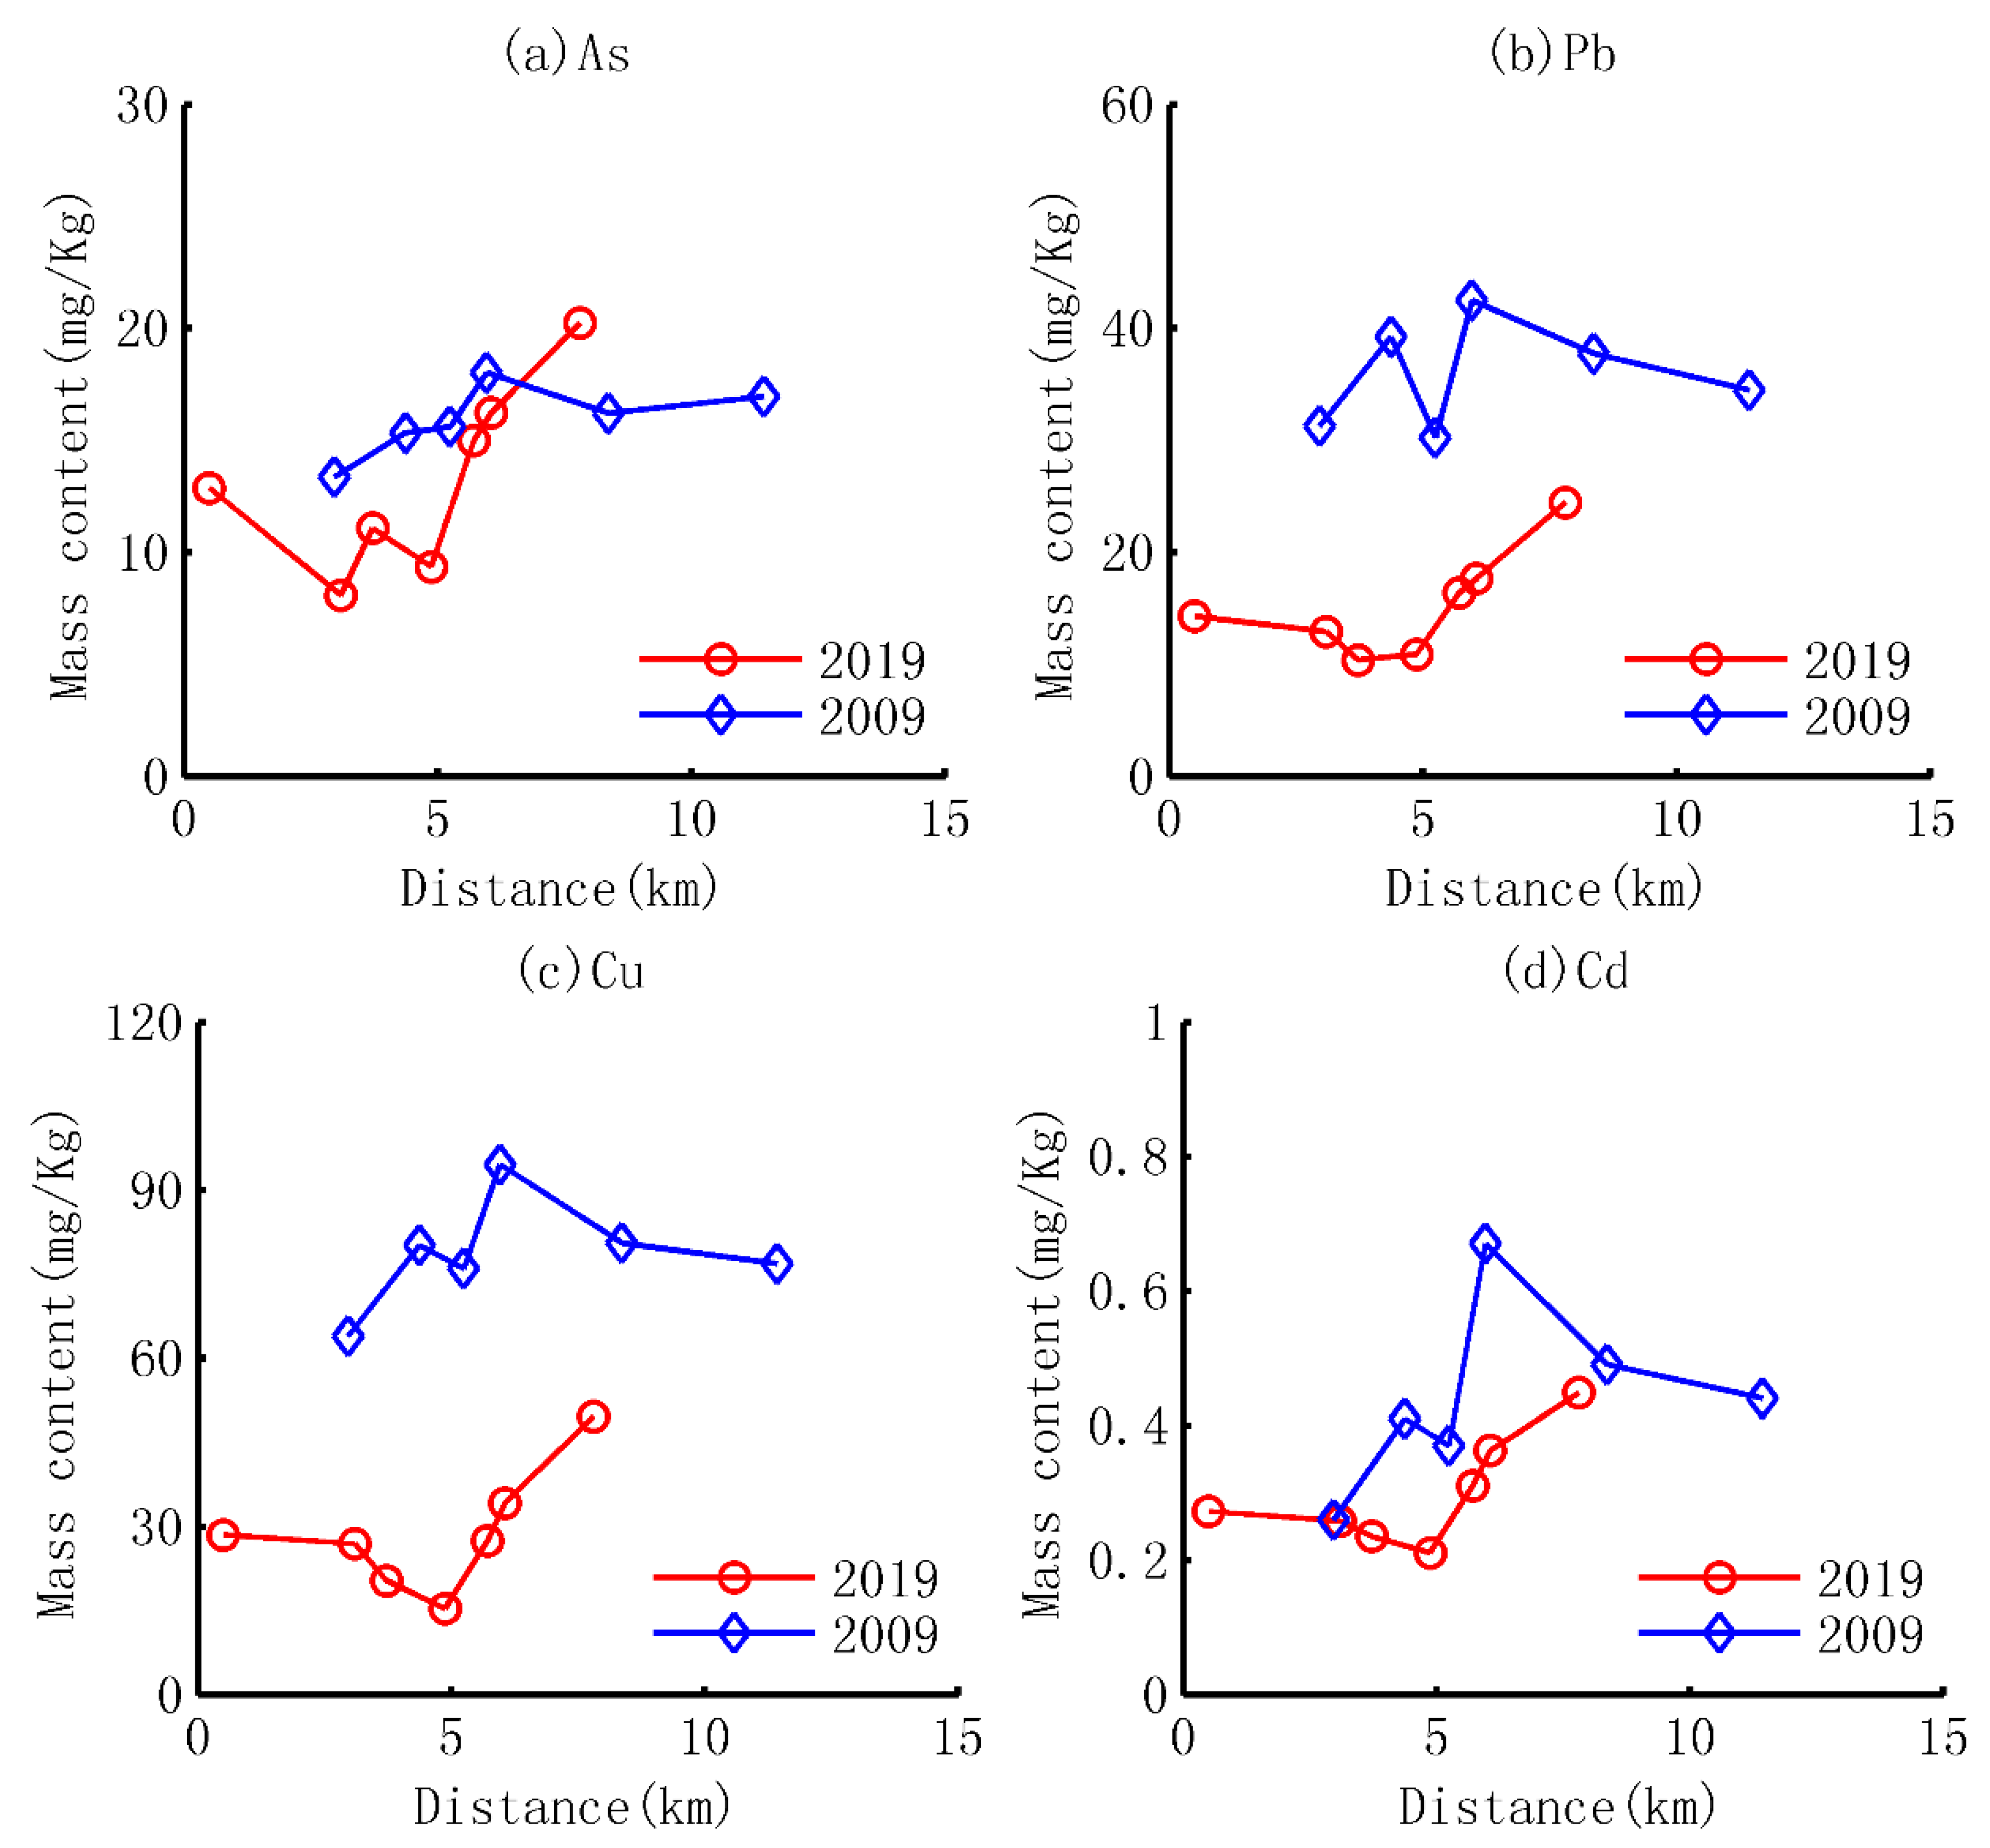
Figure 2.
Comparisons on the average content of heavy metals between 2019 measured in this study and 2009 from literature [32] following the water flow direction; (a) As; (b) Pb; (c) Zn; (d) Cd; (e) Zn; (f) Cr.
In 2019, the average total concentrations of As, Pb, Cu, Cd, Zn and Cr are 14.10 mg/kg, 13.26 mg/kg, 29.32 mg/kg, 0.29 mg/kg, 55.58 mg/kg and 31.33 mg/kg, respectively. The average concentration of heavy metals in sediment of Huaxi Reservoir feature the following order: Cd < As < Pb < Cu < Cr < Zn. Meanwhile, all the contents of these heavy metals are lower than their background values in the study area (Guizhou Province), as is shown in Table 1.
Compared with the heavy metal contents in 2009, the average content of heavy metals in sediment has decreased by 16%, 59%, 63%, 34%, 54% and 62% which corresponds to As, Pb, Cu, Cd, Zn and Cr, respectively. In 2009, the average contents of Pb, Cu, Zn in the sediments were higher than their background values, especially Cu (78.63 vs. 35.2 mg/kg) and Zn (122.94 vs. 99.5 mg/kg), while the other heavy metals such as As, Cd, Cr were lower than their background contents. The higher value than the background value suggests that Pb, Cu, Zn are mainly impacted by anthropogenic activities before the tools were taken [60,61]. In 2019, however, the average contents of all the six heavy metals have decreased and are lower than their background value, which shows that the external source of specific heavy metals such as Pb, Cu and Zn has been cut off in the upstream areas of the reservoir after the ten-year development.
The differences of these heavy metals in content between 2019 and that of 2009 are identified by a widely used nonparametric test and rank sum test with significant levels of α = 0.05, as shown in Table 2. The results show that all of the heavy metals display a significant decreasing trend except As, with the significant level of 0.09. Despite this result, the relative decrement of 16% reflects an obvious decrease trend of As.
Table 2.
The results from the rank sum test with significant level of α = 0.05 between the average content of heavy metals in 2019 and that of 2009 from literature [32].
3.1.2. Spatial Distributions and Their Affecting Factors
Based on the average content of heavy metals in the sediment sampled from seven profiles following the water flow direction, the spatial distribution patterns of heavy metals are also shown in Figure 2 and the stats are given in Table 2.
Spatial Distributions
The spatial distributions of all six heavy metals in sediment, generally, display the trend of decrease first and then increase from the upstream to downstream in 2019. The decrease trend begins from the first sampling site, S1, and ends at the second sites, S2, for As and at the fourths sampling site, S4, for the other heavy metals. After that, the average contents of heavy metals rise with the water flow direction. However, the different spatial patterns are observed in 2009 and are also shown in Figure 2. The contents of heavy metals show the trend of increase first and then gradual decrease. The maximum values of all six heavy metals are observed at Zhengshan Village, sampling site 6 (S6) in Figure 1. By the comparisons between 2019 and 2009, it can be concluded that the spatial distributions changes substantially after the ten-year development in the upstream areas of the dam.
Affecting Factors
The decrease pattern is usually affected by the input of pollution sources. Conversely, the increase trend shows a similar pattern to the natural river system that is not contaminated and the increase in heavy metals is mainly affected by the finer texture of sediment from the upstream to downstream.
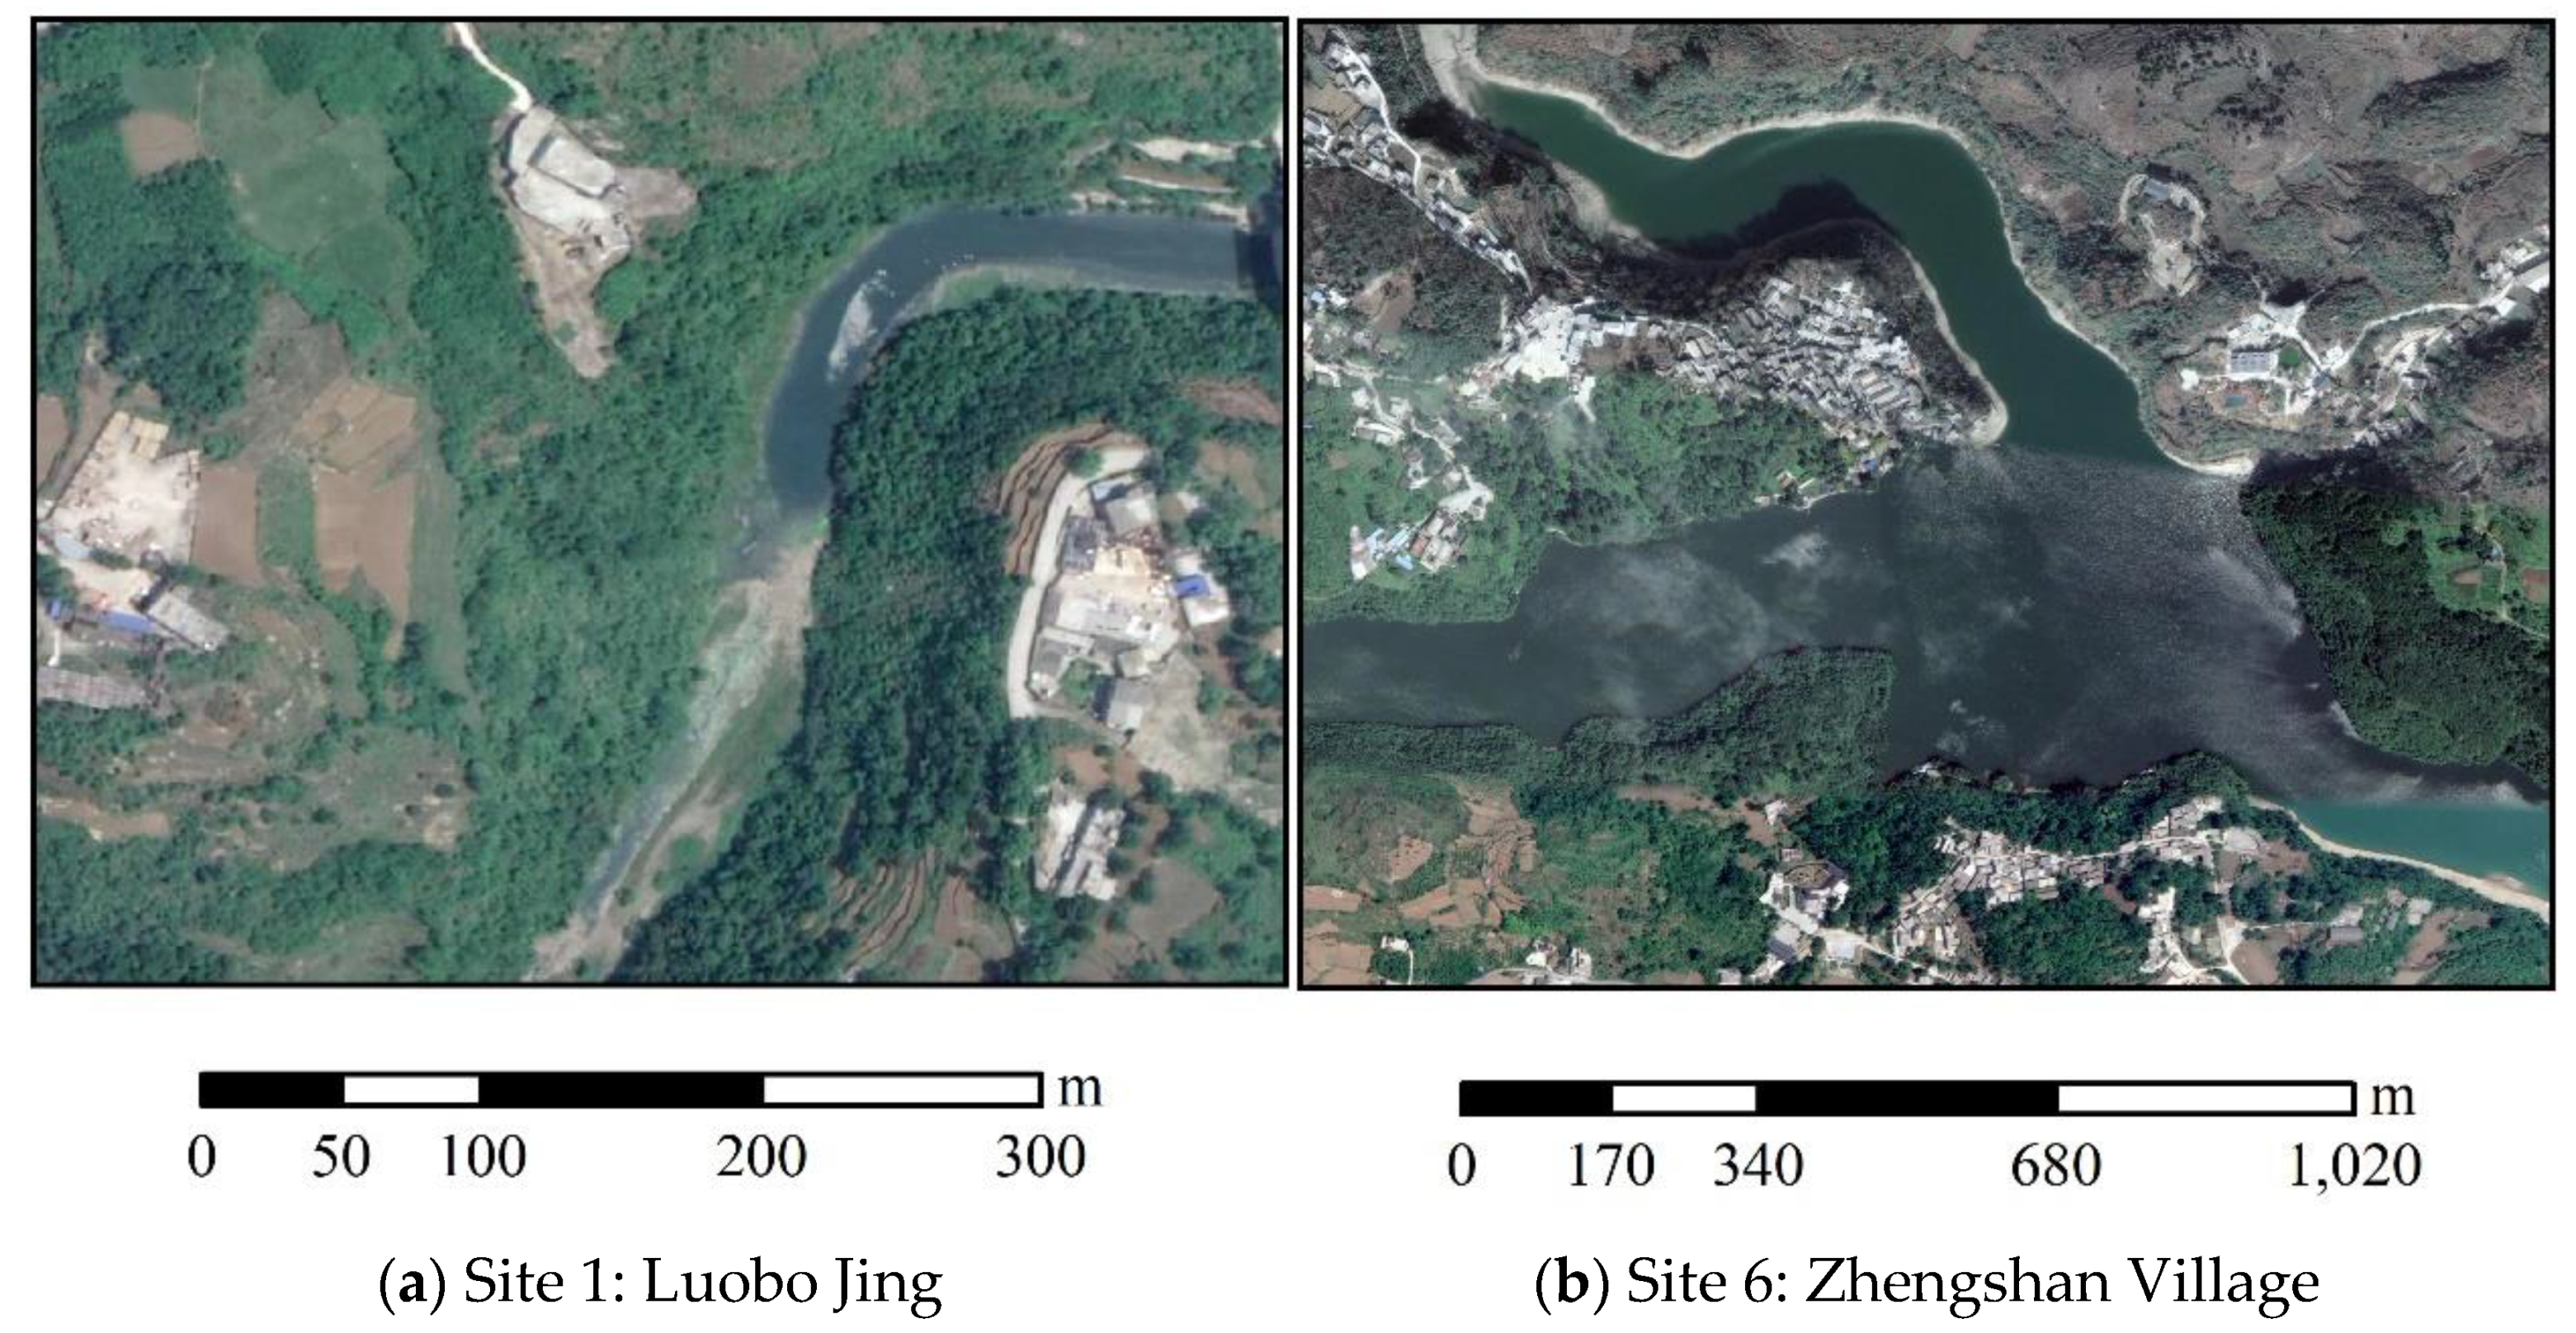
Based on the investigation, the high value in 2009 can be mainly attributed to the non-point source pollution, such as domestic sewage; agricultural pollution such as pesticide and fertilizer; and soil erosion from infrastructure construction. Moreover, Zhengshan Village is a tourist attraction which results in pollution more or less before the industrial restructuring. In the downstream of Zhengshan Village, the content of heavy metals displays a decreasing trend following water flow direction, which is different from the patterns in 2019. Furthermore, the high value at the first sampling site is mainly a result from agricultural production and infrastructure construction, as shown in Figure 3a. The heavy metals of background soil from the agricultural production and construction sites enter the reservoir with surface runoff in rainy days and then results in the high values in the sediment. In fact, the average contents of these heavy metals in the sediment are less than their background values in Guizhou Province (as shown in Table 1), although the contents of the first sample are higher than the following several samples.

Figure 3.
Remote sensing images from Google Earth around high value sampling sites in 2019.
3.2. Assessment of Heavy Metal Contamination
3.2.1. Sediment Quality Guidelines
Based on the calculated TEL, it can be observed that the current sediment toxicity of heavy metals is much smaller than that of ten years ago, as shown in Table 1. In 2009, the average concentration of As, Pb, Cu and Cr in sediment exceeded the TEL value while was less than the PEL value that could have adverse effect on sediment-dwelling organisms. After the ten-year industrial restructuring, all of the four exceeded heavy metals have decreased to less than TEL value with the exception of As. Normally, As is considered as the most dangerous trace metal in terms of environmental concern due to its high potential toxicity [22,62]. As shown in Table 1, the contents of As in sediment exceeds the TEL value in 2019, implying some threat to the sediment-dwelling organisms.
The high concentration of As is mainly associated with various anthropogenic activities such as chemical fertilizers, arsenical pesticides, domestic and industrial wastes. In 2009, the high background and anthropogenic activities could be the main reasons. The average Pb concentration is high in sediments which might be due to the vehicle emissions, domestic wastes and agricultural chemicals. The average concentration of Cu was higher in sediments due to the fragmentation of the rocks in the river basins, the activities of the stone pebbles, intensive utilization of pesticides and fertilizers for crop production and the urban wastes disposal [2,22,63]. Inorganic fertilizers, atmospheric deposition and sewage sludge were found to be the main sources of Cr [64].
3.2.2. Geo-Accumulation Index (Igeo) of Metals
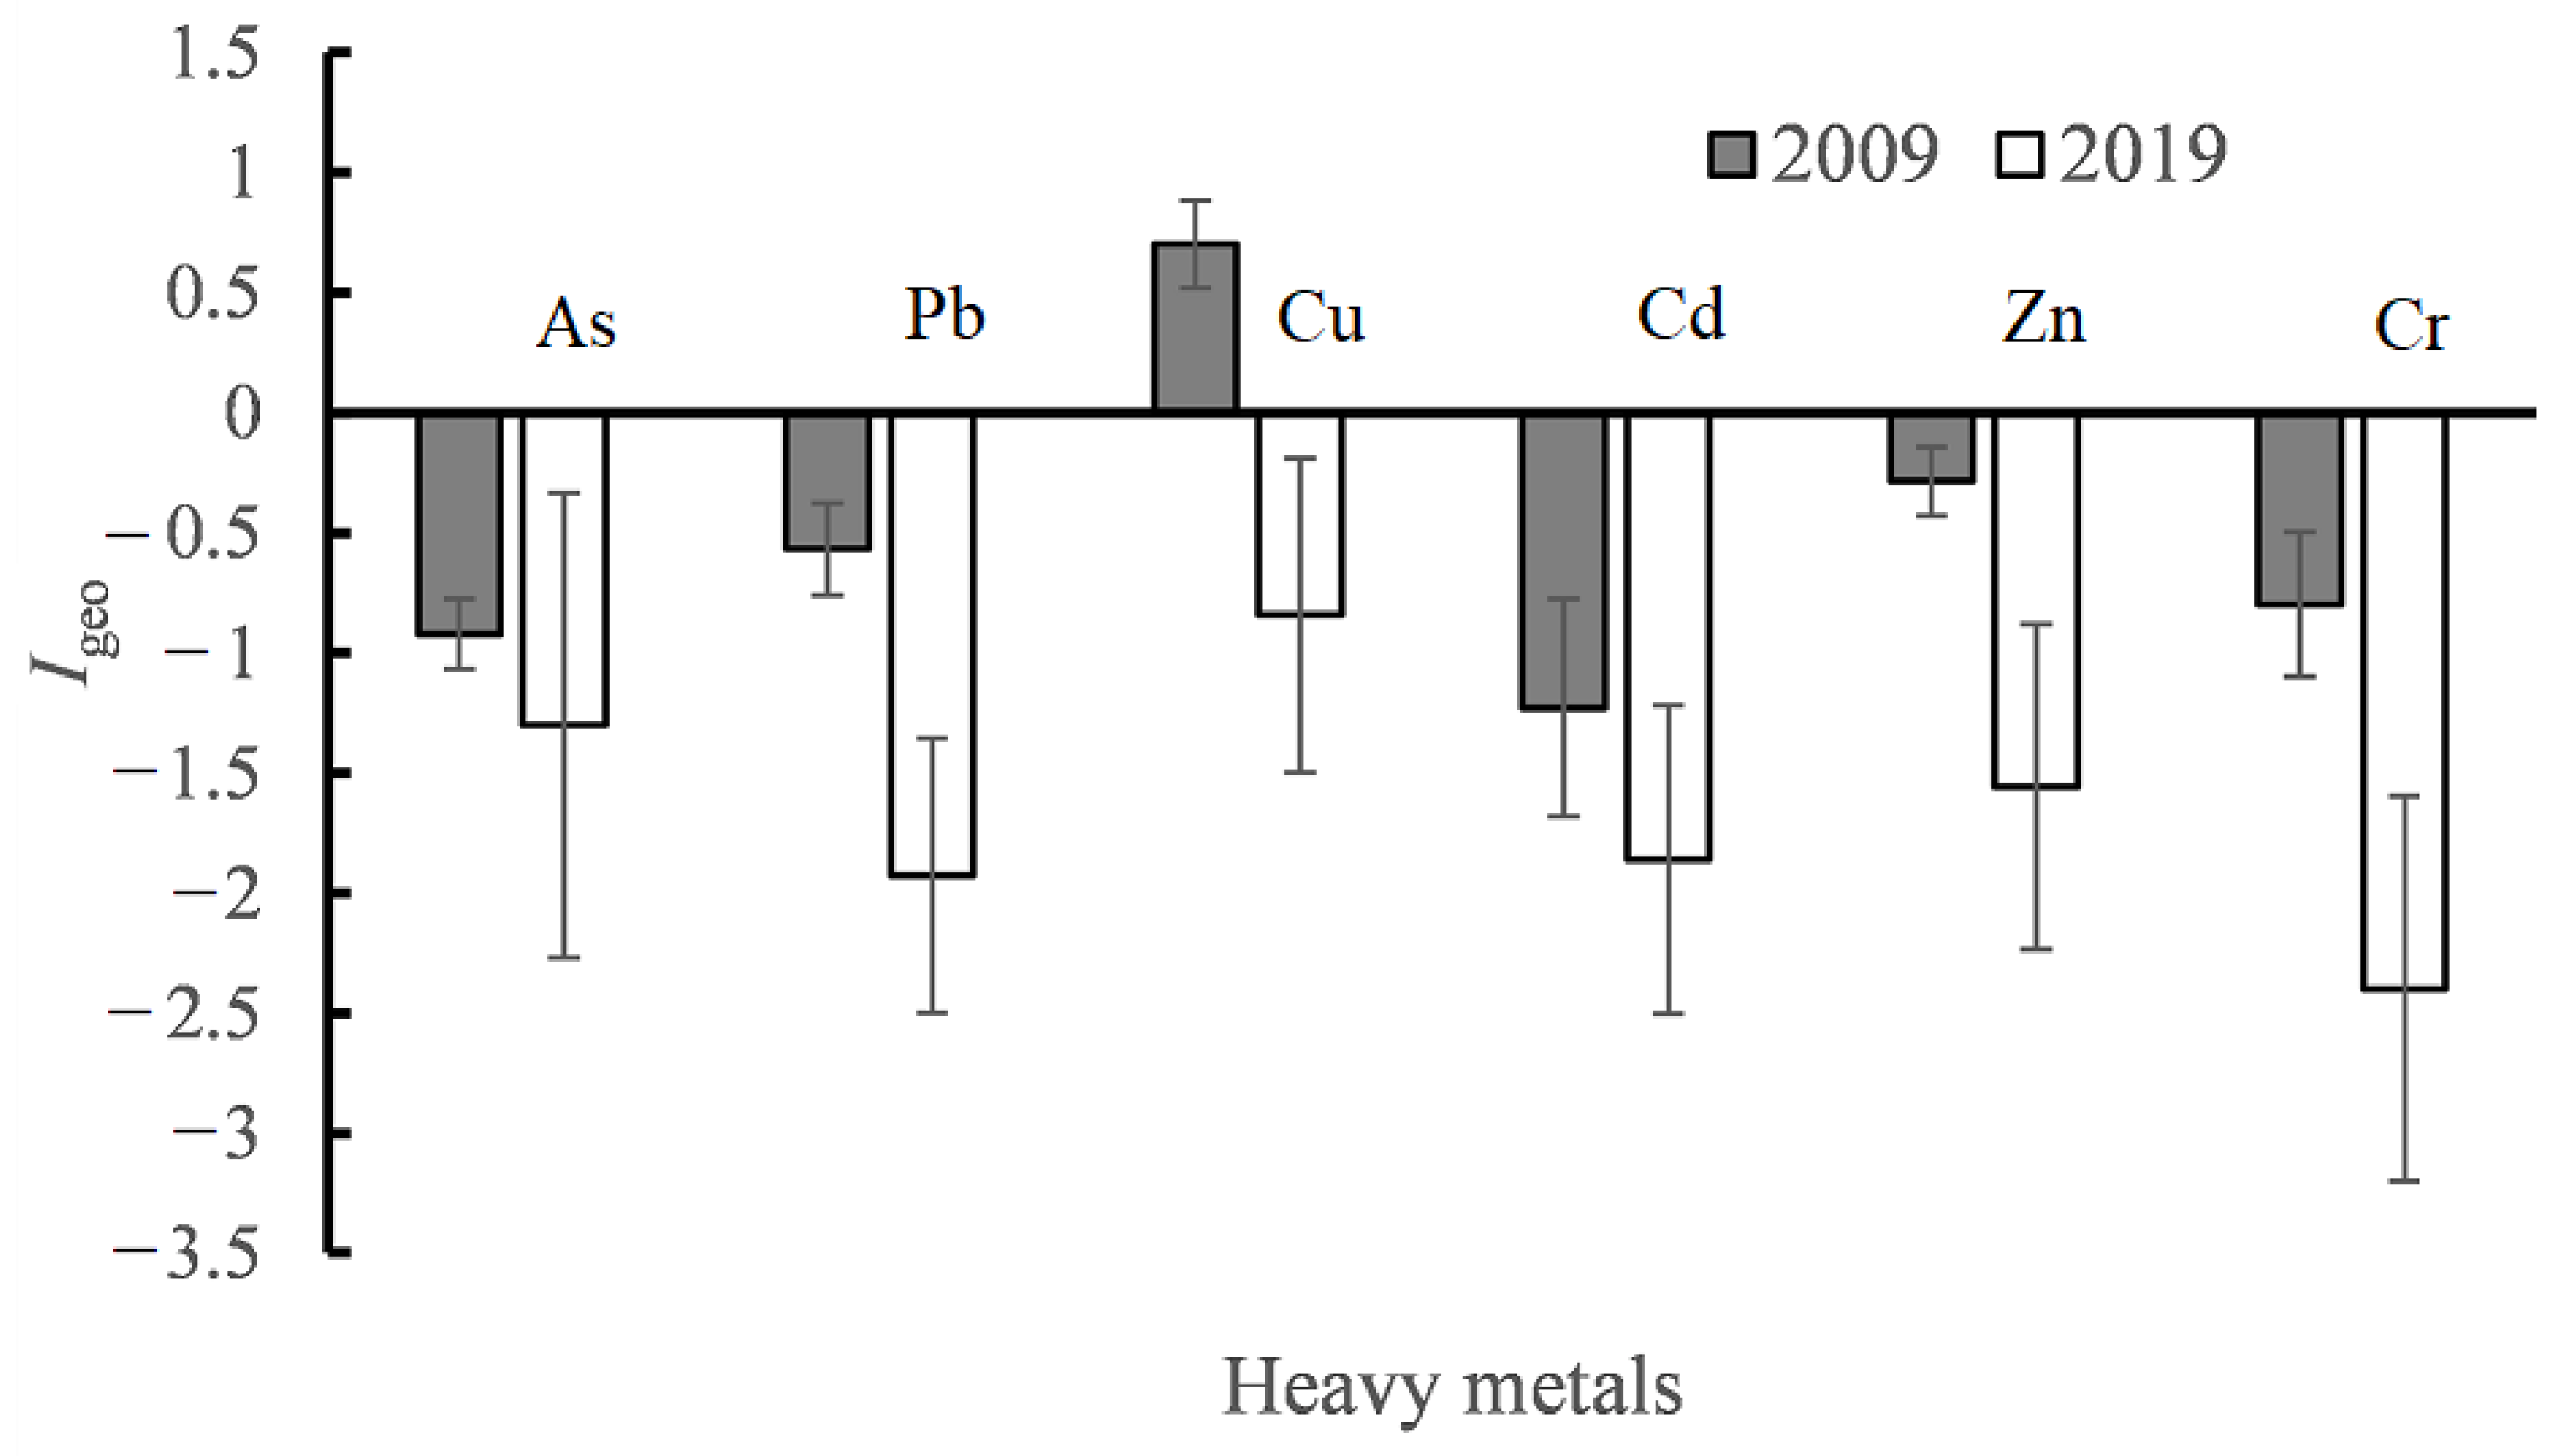
The results of Igeo are shown in Figure 4. It can be observed that the average Igeo also decreases dramatically after ten years of environmental protection and the average Igeo has decreased to an unpolluted level with a value of less than zero in 2019. In particular, the Igeo of Cu has decreased from a positive to negative value.
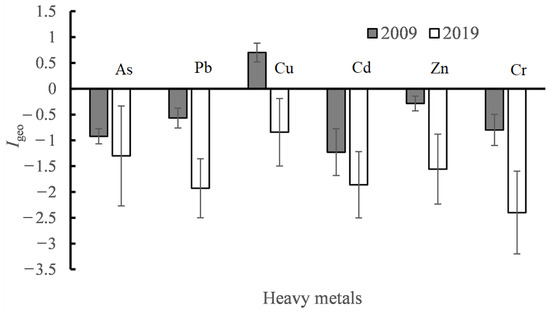
Figure 4.
Igeo of heavy metals calculated from the data in 2019 and that of 2009 from literature [32].
In addition, the ranking of Igeo for the six heavy metals has changed. It follows the order of Cr < Pb < Cd < Zn < As < Cu in 2019 while it followed the order Cd < As < Cr < Pb < Zn < Cu in 2009. The only change in order of Igeo is As, from the fifth to second. The highest Igeo value of Cu is mainly from the infrastructure constructions and their ancillary industries, such as quarrying and grease.
3.2.3. Contamination Factor (CF) and Potential Ecological Risk Index (Eir)
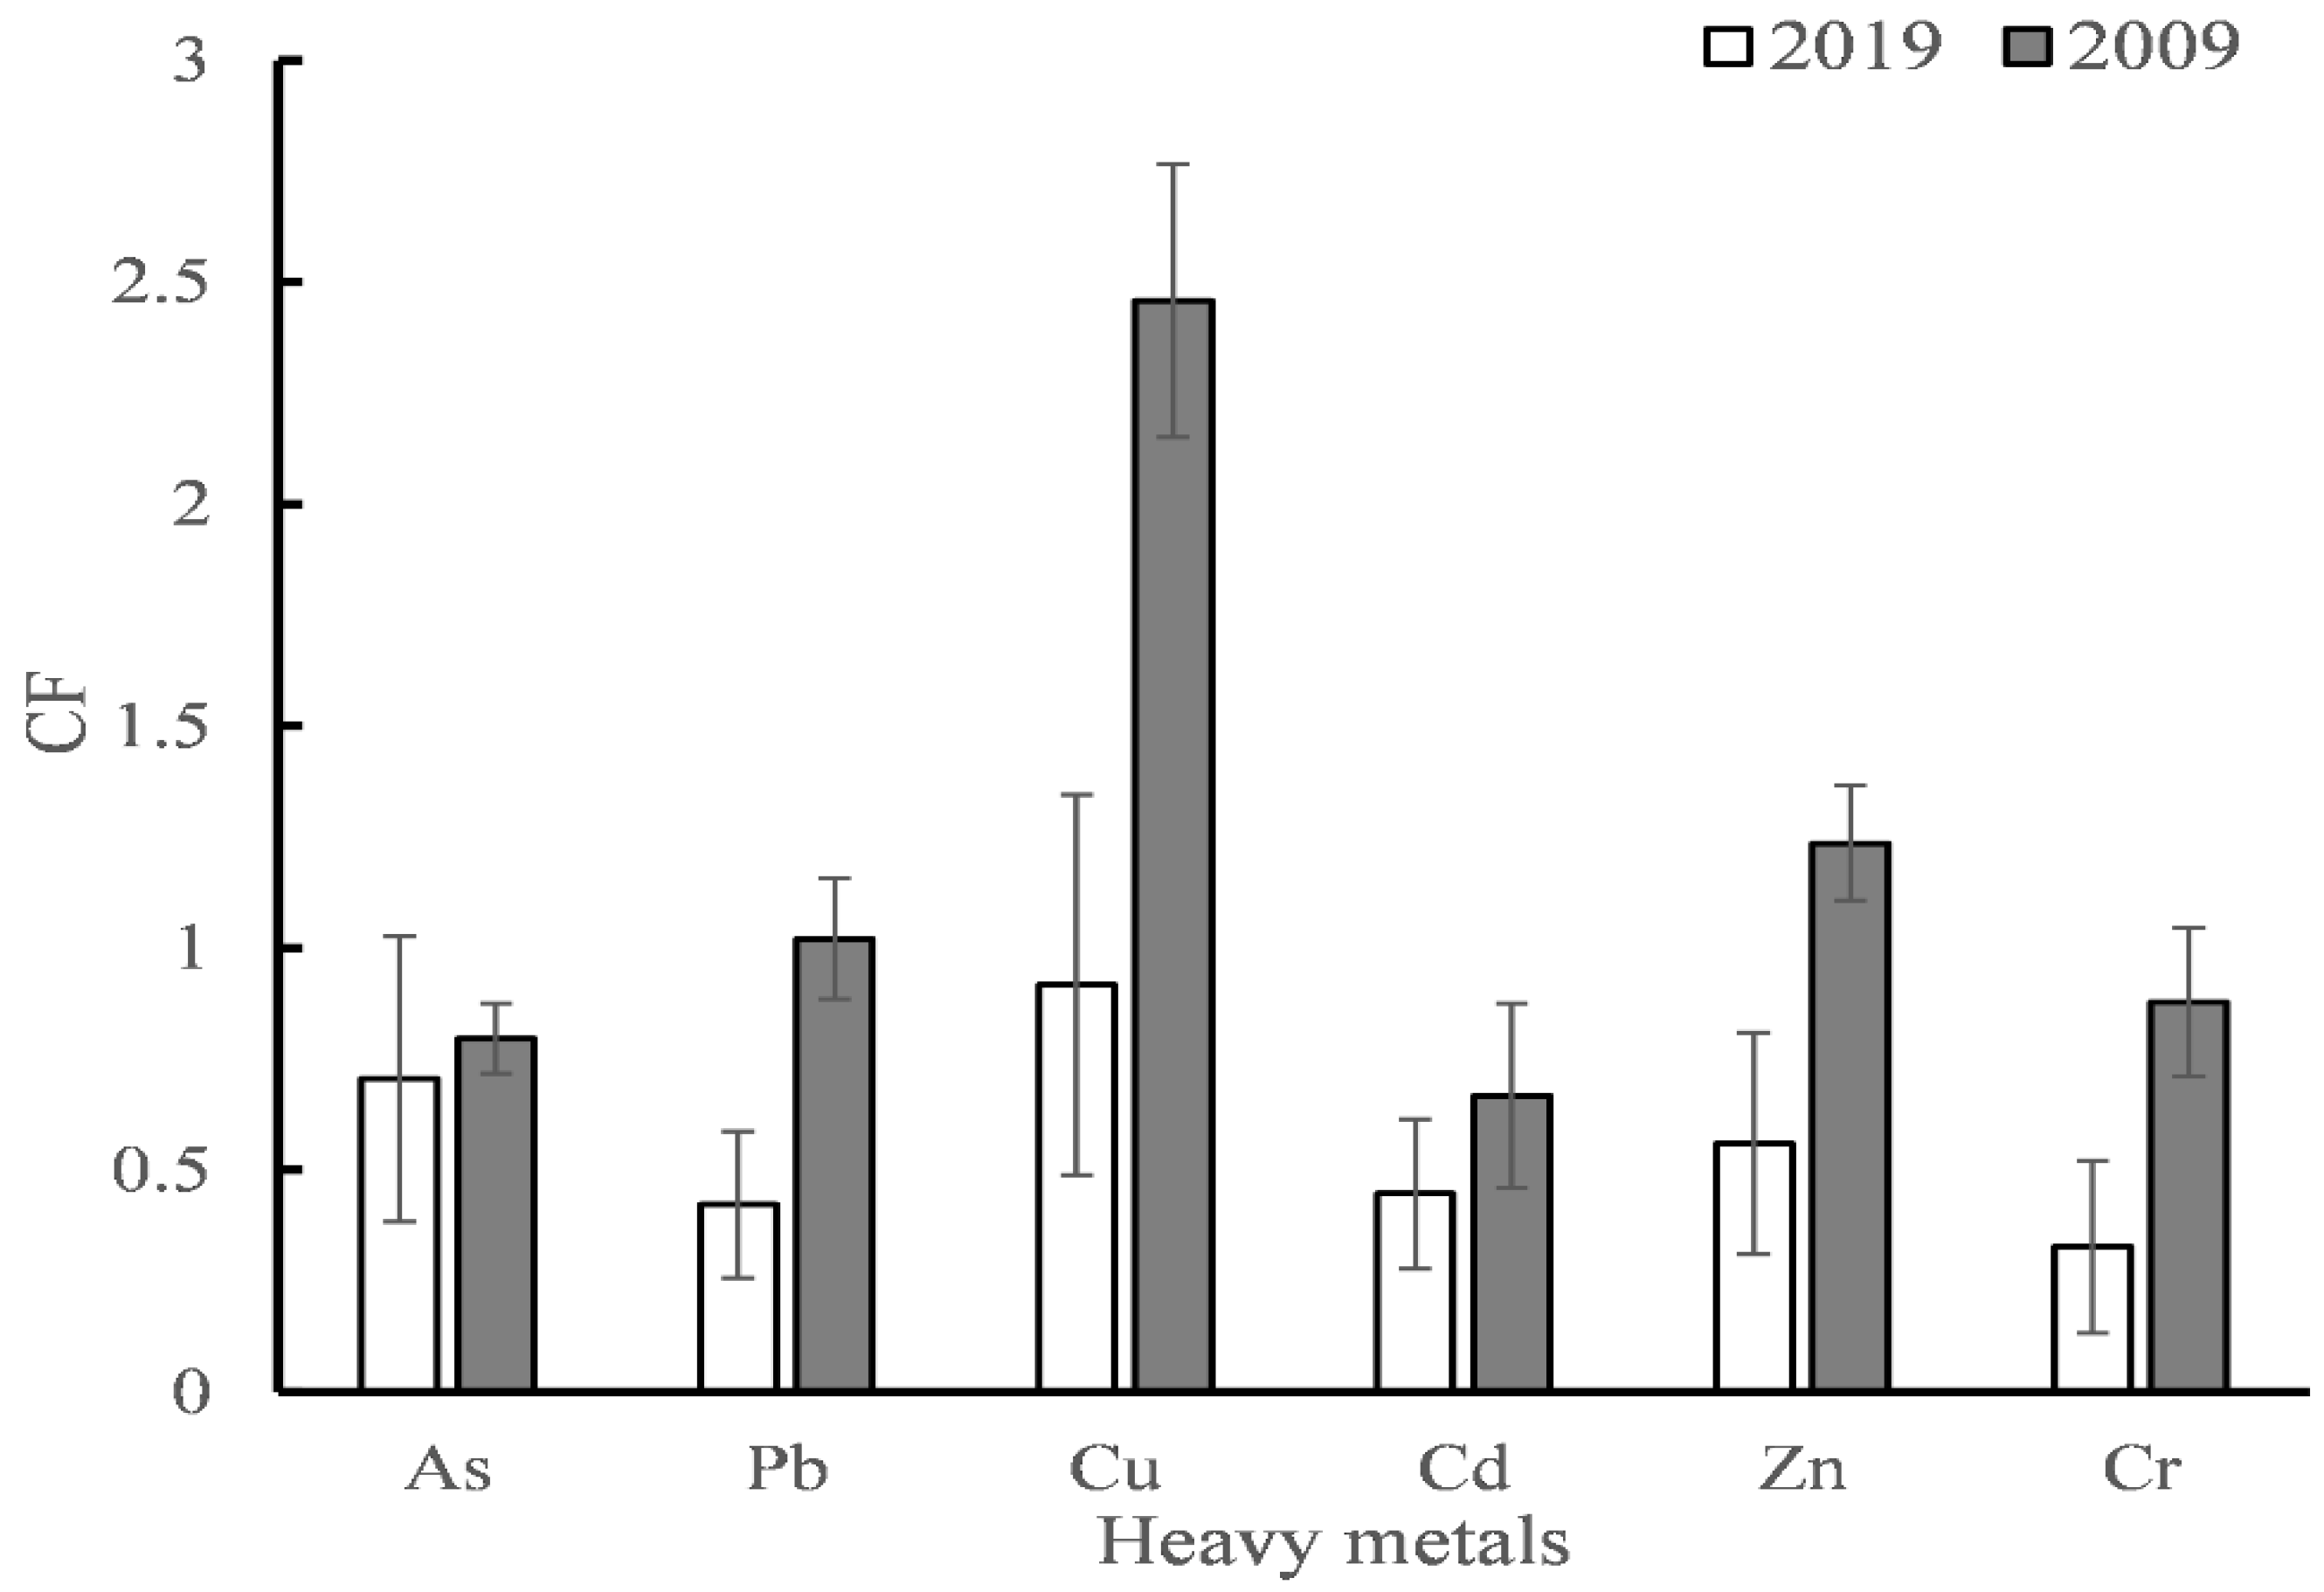
The contamination factor (CF) values of all metals in 2019 and 2009 are presented in Figure 5. It can be found that each CF is less than 1 in 2019. However, the average values of Pb, Cu and Zn were larger than 1 in 2009. The decreasing trend shows that some heavy metals such as Pb, Cu and Zn have decreased from the moderate contamination degree (1 < CF < 3) to low degree of contamination (CF < 1) after ten years.
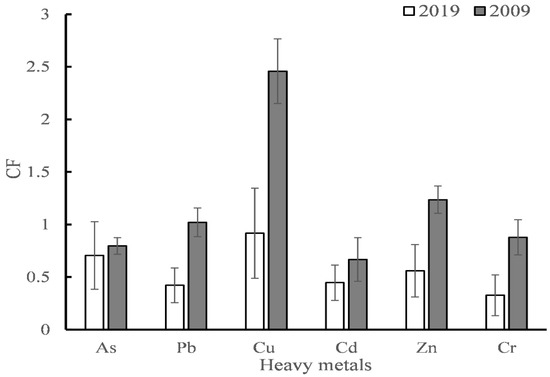
Figure 5.
CF values of heavy metals calculated from data in 2019 and that of 2009 from literature [32].
Graphical representations of the values are shown in Figure 6. Accordingly, all heavy metals in sediments display low levels of potential ecological risk ( < 40) in both 2019 and 2009. Moreover, the values of all metals in sediments in 2019 have decreased substantially compared to the data from 2009.
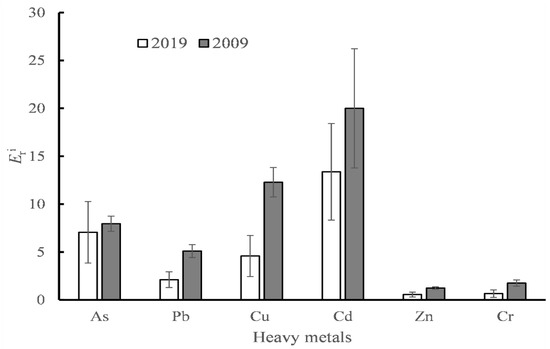
Figure 6.
value of heavy metals calculated from data in 2019 and that of 2009 from literature [32].
By using the above analysis, the contamination factor and potential ecological risk index have decreased after the ten year sustainable development. However, the average concentration of As is still larger than TEL, implying some threat to the sediment-dwelling organisms health.
3.2.4. Potential Acute Toxicity of Metals
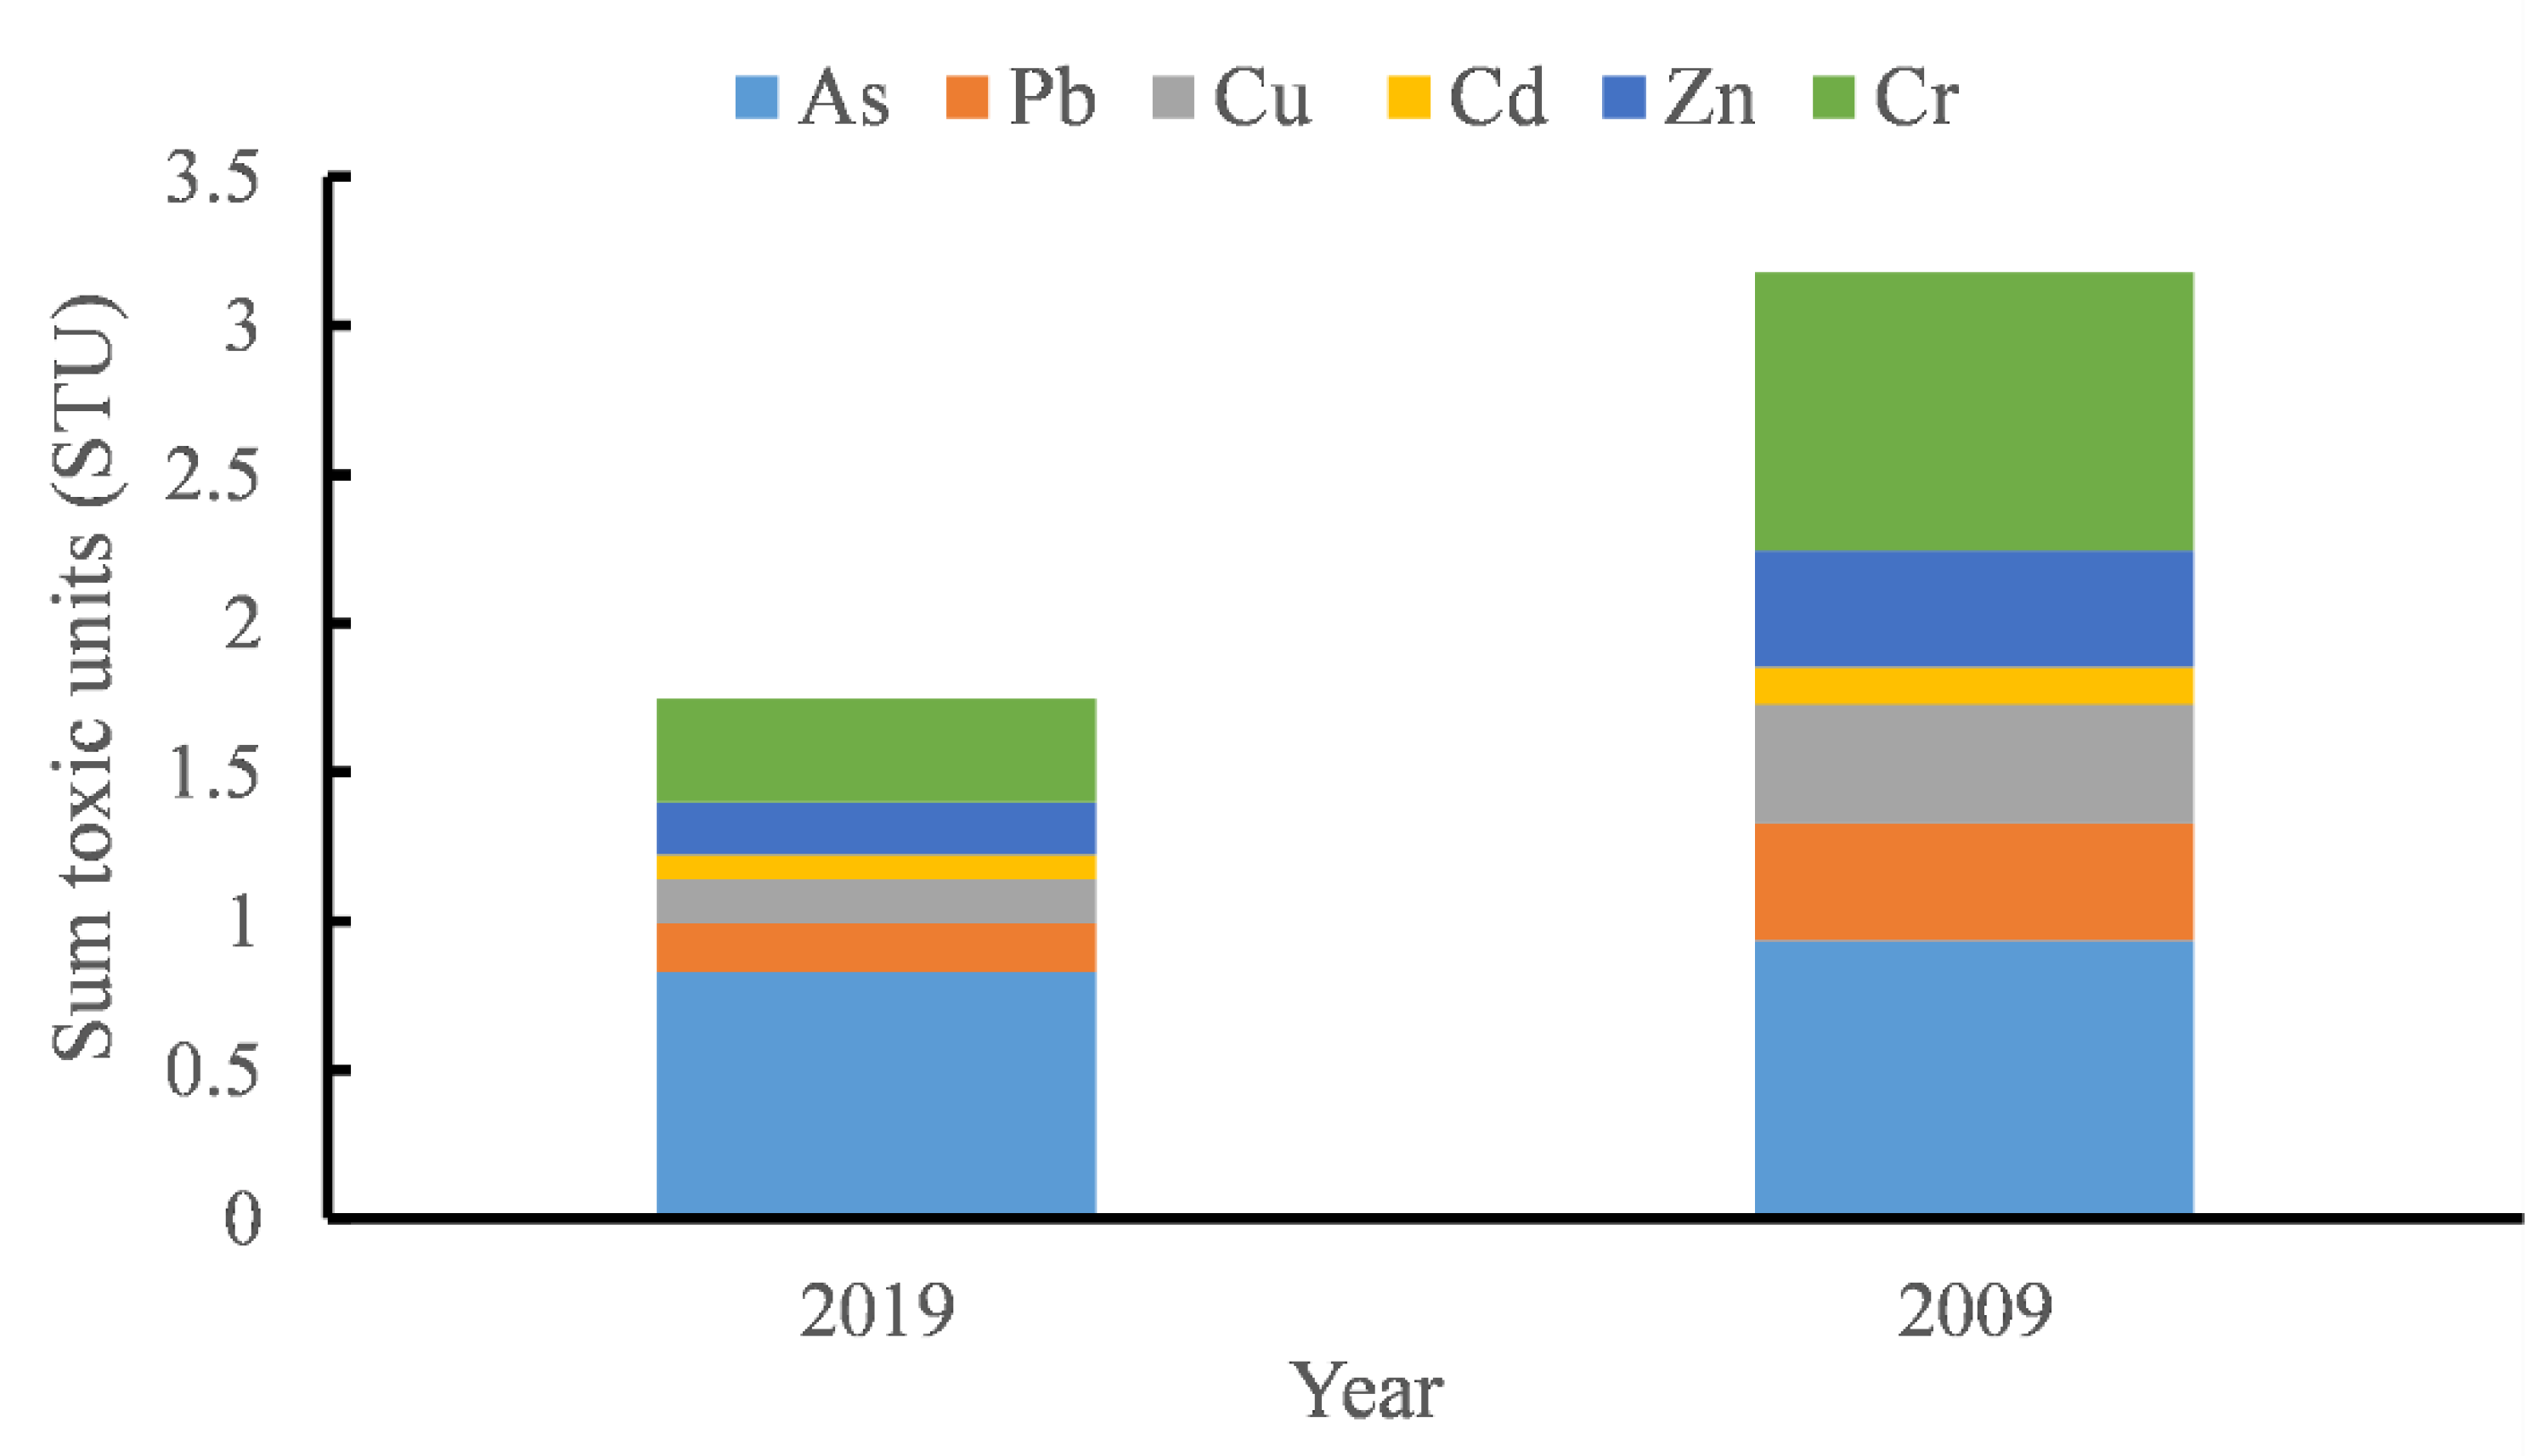
Potential acute toxicity of metals in sediments can be estimated as the sum of the toxic units (STU) calculated as the ratio of the determined concentration of toxic metals to the probable effect levels (PELs) value [65]. The levels of toxicity are divided into three classes: low toxicity level with STU less than 4; moderate toxicity level with STU between 4 and 6; and heavy toxicity level with STU larger than 6 [66]. The sum of toxic units for toxic metals in the sediments of Huaxi Reservoir is presented in Figure 7. It can be found that both the sums of toxic units at Huaxi Reservoir in 2009 and 2019 are not greater than 4 which indicates low toxicity level of heavy metals to sediment-dwelling fauna in this area [67,68].
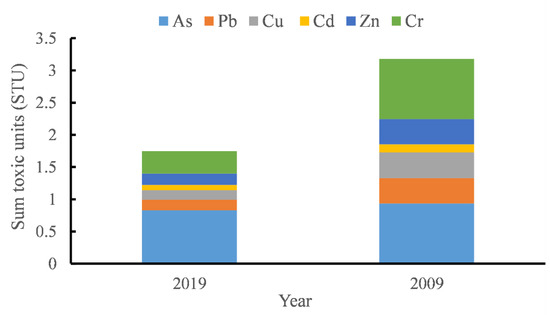
Figure 7.
Sum of the toxic units in surface sediments of Huaxi Reservoir based on the data in 2019 and that of 2009 from literature [32].
3.2.5. EF, mHQ, ECI and TRI Values
The values of EF, mHQ, ECI and TRI are presented in Table 3. The average EF is 1.32, 1.02, 0.81, 0.64, 0.61 and 0.47 in 2019 corresponding to the heavy metal of Cu, As, Zn, Cd, Pb and Cr, respectively. Generally, the value of EF less than 1 refers to the content of a given heavy metal entirely coming from earth crust or natural weathering processes, while an EF value greater than 1.5 indicates that the considerable volume of the heavy metal more likely results from anthropogenic processes [22]. In this study, the EFs of all the heavy metal are less than 1.5 and the EFs of the four metals (Zn, Cd, Pb and Cr) are less than 1. The EF values suggests that a natural source is the main cause of the enrichment of all metals in sediments of Huaxi Reservoir. The EFs of 2009 were not calculated due to the lacking concentration of Fe.
Table 3.
mHQ, ECI and TRI values for heavy metals in stream sediments of Huaxi Reservoir.
In addition, both ECI and TRI show the substantial decreasing trend. The former, ECI, from 1.78 to 1.29, implies the uncontaminated level (ECI < 2) in both 2019 and 2009. The latter, TRI from 7.39 to 4.03, implies the risk shifting from the low toxic risk in 2009 to no toxic risk in 2019.
The calculated mHQ exhibits some differences. In 2019, no heavy metal shows considerable severity of contamination, one metalloid (As) shows the moderate severity of contamination, two heavy metals (Cr and Cu) show low severity of contamination and three heavy metals (Pb, Cd and Zn) show very low severity of contamination. In 2009, Cd shows very low severity, As shows considerable severity and the other four heavy metals show moderate severity. Thus, the mHQ shows that contamination still cannot be neglected, especially the risk posed from As.
3.2.6. Health Risk Evaluation of Metals
The CDI, HQ and HI for non-carcinogenic risk of metals from the three exposure pathways on adults and children are presented in Table 4.
Table 4.
Chronic daily intake (CDI, mg/kg/day), hazard quotient (HQ) and cumulative hazard index (HI) for non-carcinogenic risk.
As for non-carcinogenic risk, it mainly shows the following two characteristics. The first that all of the HI values are lower than one, indicating no significant risk of non-carcinogenic effects of the heavy metals in both 2019 and 2009 and the much smaller values in 2019 shows the positive effect of the development in the past ten years. Secondly, HI values of both children and adult follow the order of As > Cr > Pb > Cu >Cd > Zn in 2009 and 2019.
The LCR value of Pb, Cd, Cr and As in sediments of Huaxi Reservoir are presented in Table 5. The results show that the LCR of all four heavy metals are lower than the threshold value of 1 × 10⁻⁴ in 2019 for both adults and children. Although the LCR of Cr for children is 1.35 × 10⁻⁴ in 2009, it has decreased to 5.02 × 10⁻⁵ in 2019. Thus, it can be concluded that there is no carcinogenic risk from the heavy metals in sediments after the ten-year development.
Table 5.
Carcinogenic risk of different exposure pathways for adult and children.
3.3. Source Analysis of Heavy Metals
In order to further identify the potential sources of heavy metals in the sediment of Huaxi Reservoir, the Pearson’s correlation coefficient (PCC) analysis and principal component analysis (PCA) are used to uncover more details.
As shown in Table 6, most of the heavy metal pairs exhibit a significant positive correlation at the significant level of 0.05, with the minimum correlation coefficient of 0.52 in 2009 and 0.65 in 2019. The high correlation coefficient indicates that two metals are possibly originated from the same resources. A larger value in 2019 implies the main source of pollution accounts for a higher proportion than before.
Table 6.
Pearson’s correlation matrix for the heavy metal concentrations in the surface sediments of the Huaxi Reservoir in 2019 and 2009.
The results of PCA are given in Table 7. It can be found that only one main factor is identified and the first principal component accounts for 86.07% and 86.83% of the variance in the dataset of 2019 and 2009, respectively. The results indicate that the heavy metals in the sediment of the Huaxi Reservoir are derived from similar sources. A similar conclusion has also been obtained from a higher correlation between the variables in 2019.
Table 7.
Result of principal components matrix for metals of Huaxi Reservoir in 2019 and 2009.
The combined results of the Pearson’s correlation coefficient analysis, principal component analysis and background data suggest that heavy metal concentrations are mainly from natural sources in the Huaxi Reservoir.
4. Discussions
4.1. Different Spatial Patterns Following Water Flow Direction
(1) Lower vs. higher than background value
In this study, it was found that the content of heavy metals in Huaxi Reservoir is lower than their background value. However, the contents of most metals in the sediment of the other three large reservoirs (Hongfeng Lake, Baihua Lake and Aha Lake) in the city (Guiyang) are higher than their background value (Table 1). The higher values are mainly the result of human activities [36,37,38,69]. Compared with the other three, reducing the internal pollution of heavy metals in Huaxi Reservoir has, thus. achieved great success after the ten-year sustainable development.
(2) Decrease-increase vs. increase decrease pattern
The spatial patterns of heavy metals in a natural river, generally, display an increasing trend following the water flow direction. However, the decreasing trend from the pollution source to the downstream area is widely observed in the heavy contaminated river, lake or reservoir. For example, Hongfeng Lake located about 40 km east of the study area reflects the decreasing trend [69]. In this study, the spatial distribution of these heavy metals generally exhibits a decrease-increase pattern following water flow in 2019 while an opposite pattern is observed in 2009. The different patterns imply that the input of the main pollution source has shifted from the middle to upstream areas.
4.2. Differences among These Risk or Pollution Indices
The pollution or risk indices calculated from data measured in 2019 are given in Table 8. Nine indices exhibit the lowest level and possess good quality relative to the water body. The two exceptions are TEL and mHQ. The content of As is larger than TEL while less than PEL, implying some threat to the sediment-dwelling organisms. The mHQ shows the level of very low to moderate severity contaminations and As is the highest severity of these heavy metals.
Table 8.
Summary for different pollution or risk indices of heavy metals in sediment of Huaxi Reservoir in 2019.
The different level among these indices, generally, is the result of their formulas and is manifested by the following aspects.
(1) If these indices are calculated from the values of the background or the reference metal, then the results usually show the lowest level, e.g., Igeo, CF, Eri and EF. In this study, the background values of the heavy metals are higher than the levels in many other areas in China and the rest of the world.
(2) If the indices are calculated from the total or average value of these elements, the results also show the lowest level, e.g., TRI, ECI, HQ and LCR. The reason is the complement from different elements. The negative effect of some element such as As may by complemented by the positive effect of some low content element such as Cd.
(3) If the indices are calculated from the content of each element and based on the absolute value instead of removing the effect of the background value, the risk still exists more or less, e.g., mHQ and TEL. Here, the high background value of As may exert some risk to the water environment.
After the ten-year development, the risk of heavy metals in the sediment of Huaxi Reservoir cannot be neglected, although many indices show the lowest level.
4.3. Source Analysis and Management in the Future
(1) Source analysis
The source analysis above has revealed only one main source of heavy metals in the sediment in both 2019 and 2009. In other words, the natural source dominates the content of heavy metals in sediment. However, the spatial pattern of the increasing trend first and then the decreasing trend in 2009 indicates an obvious external source input in Zhengshan Village located in the middle of the reservoir. At that time, the main external source was agriculture, infrastructure construction and the outdoor barbecuing. However, both the PCC and PCA failed to identify the external source.
Here, the reason for the failure of the two methods can be attributed to the shortage of their algorithms. Both the PCA and PCC, generally, are based on the average or total trend. Similar to the indices such as TRI, ECI, HQ and LCR above, the negative effect from one element may by complemented by another positive effect.
(2) Management in the future
The ten-year sustainable development has substantially reduced the heavy metals in the sediment of the Huaxi Reservoir. In 2009, the contents of Pb, Cu and Cr in the Huaxi Reservoir are close to or larger than those in the other reservoirs around the study area [36,37,38]. In 2019, the contents of these elements are much lower in study area. Thus, the success of the Huaxi Reservoir can provide references to protect the other reservoirs in the Karst area of southwestern China.
However, the challenge to water environment protection still cannot be neglected in the future. The study area is located in a geochemically sensitive and ecologically fragile karst carbonate rock region with a higher background value of heavy metals. Human activities such as agricultural production and infrastructure construction would promote the weathering of the rocks and soil. The heavy metals are adsorbed by the soil particles and then been transported into the river accompanied with the flow of surface or underground runoff driven by rainfall. These non-point source inputs of heavy metals from the high background value soil cannot be easily controlled by promulgating a series of bans.
5. Conclusions
By comparing the contents, spatial distributions, risk indices and sources of metals in 2019 with that of the information from 2009, the conclusion are as follows.
(1) The contents of heavy metals in sediment have decreased dramatically in Huaxi Reservoir and the average reduction rate is 16%, 59%, 63%, 34%, 54% and 62% corresponding to As, Pb, Cu, Cd, Zn and Cr, respectively. The spatial distribution of these metals generally exhibits a decrease-increase pattern following water flow in 2019, while an opposite pattern was observed in 2009. The different patterns imply that the input of the main pollution source has shifted from the middle to upstream areas.
(2) The water environment risk indices have decreased substantially. The indices based on the total content, average content and background value have decreased to the lowest level. However, those indices calculated from the content of each element, e.g., mHQ and TEL, indicate that the risk still cannot be neglected. The difference is mainly from the high background value of As and Cr, which are higher than PEL.
Therefore, the ten-year sustainable development has achieved significant progress in water environmental protection. However, the high background value of specific heavy metals, e.g., As and Cr, would still exert some risk to the water environment protections and the non-point source input of heavy metal from the weathering cannot be controlled easily by promulgating a series of bans. These results will provide important reference for creating the policies of water environment protection, especially in the Karst area of southwestern China where heavy metals exhibit high background values.
Author Contributions
Formal analysis, W.L.; funding acquisition, X.Z. and W.L.; investigation, K.Z. (Kejia Zhou), R.L., S.S., Y.Y., X.G., L.C. and K.Z. (Kun Zou); writing—original draft, X.Z.; writing—review and editing, W.L. All authors have read and agreed to the published version of the manuscript.
Funding
This research was funded by the National Natural Science Foundation of China (Grant No. 41701558; 51969006), the Science and Technology Funding of Guizhou Province (Grant No. [2019]2875; [2018]5781-45; RCJD2018-21) and the Talent Project of Guizhou University (Grant No. ([2017]79; [2018]08).
Conflicts of Interest
The authors declare no conflict of interest.
References
- Sun, M.X.; Wang, T.; Xu, X.B.; Zhang, L.X.; Li, J.; Shi, Y.J. Ecological risk assessment of soil cadmium in China’s coastal economic development zone: A meta-analysis. Ecosyst. Health Sustain. 2020, 6, 1733921. [Google Scholar] [CrossRef] [Green Version]
- Islam, M.S.; Ahmed, M.K.; Raknuzzaman, M.; Habibullah-Al-Mamun, M.; Islam, M.K. Heavy metal pollution in surface water and sediment: A preliminary assessment of an urban river in a developing country. Ecol. Indic. 2015, 48, 282–291. [Google Scholar] [CrossRef]
- Ding, Z.W.; Li, Y.; Sun, Q.Y.; Zhang, H.J. Trace elements in soils and selected agricultural plants in the Tongling mining Area of China. Int. J. Environ. Res. Public Health 2018, 15, 202. [Google Scholar] [CrossRef] [PubMed] [Green Version]
- Qiao, D.H.; Wang, G.S.; Li, X.S.; Wang, S.; Zhao, Y.Y. Pollution, sources and environmental risk assessment of heavy metals in the surface AMD water, sediments and surface soils around unexploited Rona Cu deposit, Tibet, China. Chemosphere 2020, 248, 125988. [Google Scholar] [CrossRef] [PubMed]
- Liu, C.C.; Yin, J.; Hu, L.; Zhang, B. Spatial Distribution of Heavy Metals and Associated Risks in Sediment of the Urban River Flowing into the Pearl River Estuary, China. Arch. Environ. Contam. Toxicol. 2020, 78, 622–630. [Google Scholar] [CrossRef]
- Authman, M.M.; Abbas, H.H.; Abbas, W.T. Assessment of metal status in drainage canal water and their bioaccumulation in Oreochromis niloticus fish in relation to human health. Environ. Monit. Assess. 2015, 185, 891–907. [Google Scholar] [CrossRef]
- Cheng, H.X.; Li, M.; Zhao, C.D. Concentrations of toxic metals and ecological risk assessment for sediments of major freshwater lakes in China. J. Geochem. Explor. 2015, 157, 15–26. [Google Scholar] [CrossRef]
- Liu, G.N.; Wang, J.; Liu, X.; Liu, X.H.; Li, X.S.; Ren, Y.Q.; Wang, J.; Dong, L.M. Partitioning and geochemical fractions of heavy metals from geogenic and anthropogenic sources in various soil particle size fractions. Geoderma 2018, 312, 104–113. [Google Scholar] [CrossRef]
- Wang, Z.F.; Zhou, J.Y.; Zhang, C.; Qu, L.Y.; Mei, K.M.; Dahlgren, R.A.; Zhang, M.H.; Xia, F. A comprehensive risk assessment of metals in riverine surface sediments across the rural-urban interface of a rapidly developing watershed. Environ. Pollut. 2019, 245, 1022–1030. [Google Scholar] [CrossRef] [Green Version]
- Xia, W.L.; Chen, L.; Deng, X.W.; Liang, G.D.; Giesy, J.P.; Rao, Q.Y.; Wen, Z.H.; Wu, Y.; Chen, J.; Xie, P. Spatial and interspecies differences in concentrations of eight trace elements in wild freshwater fishes at different trophic levels from middle and eastern China. Sci. Total Environ. 2019, 672, 883–892. [Google Scholar] [CrossRef]
- Qian, Y.; Cheng, C.L.; Feng, H.; Hong, Z.J.; Zhu, Q.Z.; Kolencik, M.; Chang, X.X. Assessment of metal mobility in sediment, commercial fish accumulation and impact on human health risk in a large shallow plateau lake in southwest of China. Ecotoxicol. Environ. Saf. 2020, 194, 110346. [Google Scholar] [CrossRef]
- Feng, X.; Qiu, G. Mercury pollution in Guizhou, Southwestern China-An overview. Sci. Total Environ. 2008, 400, 227–237. [Google Scholar] [CrossRef]
- Guo, W.; Huo, S.L.; Xi, B.D.; Zhang, J.T.; Wu, F.C. Heavy metal contamination in sediments from typical lakes in the five geographic regions of China: Distribution, bioavailability, and risk. Ecol. Eng. 2015, 81, 243–255. [Google Scholar] [CrossRef]
- Jiang, F.; Ren, B.Z.; Hursthouse, A.; Deng, R.J.; Wang, Z.H. Distribution, source identification, and ecological-health risks of potentially toxic elements (PTEs) in soil of thallium mine area (southwestern Guizhou, China). Environ. Sci. Pollut. Res. 2019, 26, 16556–16567. [Google Scholar] [CrossRef] [Green Version]
- Shen, W.D.; Xiong, K.N.; Gao, Y.; Quan, M.Y.; Peng, H.J.; Yan, T.; He, L.F.; Bao, K.S. Distribution of Potential Harmful Trace Elements and Potential Ecological Risk in the Jiulongchi Wetland of Fanjing Mountain, Southwest China. Int. J. Environ. Res. Public Health 2020, 17, 1731. [Google Scholar] [CrossRef] [Green Version]
- Luo, K.; Liu, H.Y.; Yu, E.J.; Tu, Y.; Gu, X.F.; Xu, M. Distribution and release mechanism of heavy metals in sediments of Yelang Lake by DGT. Stoch. Environ. Res. Risk Assess. 2020, 34, 793–805. [Google Scholar] [CrossRef]
- Pejman, A.; Bidhendi, N.G.; Ardestani, M.; Saeedi, M.; Baghvand, A. A new index for assessing heavy metals contamination in sediments: A case study. Ecol. Indic. 2015, 58, 365–373. [Google Scholar] [CrossRef]
- Benson, N.U.; Adedapo, A.E.; Fred-Ahmadu, O.H.; Williams, A.B.; Udosen, E.D.; Ayejuyo, O.O.; Olajire, A.A. A new method for assessment of sediment-associated contamination risks using multivariate statistical approach. MethodsX 2018, 5, 268–276. [Google Scholar] [CrossRef]
- Bo, L.J.; Wang, D.J.; Li, T.L.; Li, Y.; Zhang, G.; Wang, C.; Zhang, S.Q. Accumulation and risk assessment of heavy metals in water, sediments, and aquatic organisms in rural rivers in the Taihu Lake region, China. Environ. Sci. Pollut. Res. 2015, 22, 6721–6731. [Google Scholar] [CrossRef]
- Bradl, H.B. Adsorption of heavy metal ions on soils and soils constituents. J. Colloid Interface Sci. 2004, 277, 1–18. [Google Scholar] [CrossRef]
- Chai, L.Y.; Li, H.; Yang, Z.H.; Min, X.B.; Liao, Q.; Liu, Y.; Men, S.H.; Yan, Y.N.; Xu, J.X. Heavy metals and metalloids in the surface sediments of the Xiangjiang River, Hunan, China: Distribution, contamination, and ecological risk assessment. Environ. Sci. Pollut. Res. 2017, 24, 874–885. [Google Scholar] [CrossRef] [PubMed]
- Ustaoğlu, F.; Islam, M.S. Potential toxic elements in sediment of some rivers at Giresun, Northeast Turkey: A preliminary assessment for ecotoxicological status and health risk. Ecol. Indic. 2020, 113, 106237. [Google Scholar] [CrossRef]
- Karthikeyan, P.; Vennila, G.; Venkatachalapathy, R.; Subramani, T.; Prakash- Aswini, M.K. Assessment of heavy metals in the surface sediments of the Emerald Lake using of spatial distribution and multivariate techniques. Environ. Monit. Assess. 2018, 190, 668. [Google Scholar] [CrossRef] [PubMed]
- Liu, Q.Q.; Wang, F.F.; Meng, F.P.; Jiang, L.; Li, G.J.; Zhou, R.G. Assessment of metal contamination in estuarine surface sediments from Dongying City, China: Use of a modified ecological risk index. Mar. Pollut. Bull. 2018, 126, 293–303. [Google Scholar] [CrossRef]
- Bai, J.H.; Zhao, Q.Q.; Lu, Q.Q.; Wang, J.J.; Reddy, K.R. Effects of freshwater input on trace element pollution in salt marsh soils of a typical coastal estuary, China. J. Hydrol. 2015, 520, 186–192. [Google Scholar] [CrossRef]
- Li, Y.Y.; Gao, B.; Xu, D.Y.; Peng, W.Q.; Liu, X.B.; Qu, X.D.; Zhang, M. Hydrodynamic impact on trace metals in sediments in the cascade reservoirs, North China. Sci. Total Environ. 2020, 716, 136914. [Google Scholar] [CrossRef]
- Li, F.; Zeng, X.Y.; Wu, C.H.; Duan, Z.P.; Wen, Y.M.; Huang, G.R.; Long, X.L.; Li, M.J.; Li, M.J.; Xu, J.Y. Ecological risks assessment and pollution source identification of trace elements in contaminated sediments from the Pearl River Delta, China. Biol. Trace Elem. Res. 2013, 155, 301–313. [Google Scholar] [CrossRef] [Green Version]
- Yang, Z.F.; Wang, Y.; Shen, Z.Y.; Niu, J.F.; Tang, Z.W. Distribution and speciation of heavy metals in sediments from the mainstream, tributaries, and lakes of the Yangtze River catchment of Wuhan, China. J. Hazard. Mater. 2009, 166, 1186–1194. [Google Scholar] [CrossRef]
- Huang, L.L.; Pu, X.M.; Pan, J.F.; Wang, B. Heavy metal pollution status in surface sediments of Swan Lake lagoon and Rongcheng Bay in the northern Yellow Sea. Chemosphere 2013, 93, 1957–1964. [Google Scholar] [CrossRef]
- Diami, S.M.; Kusin, F.M.; Madzin, Z. Potential ecological and human health risks of heavy metals in surface soils associated with iron ore mining in Pahang, Malaysia. Environ. Sci. Pollut. Res. 2016, 23, 21086–21097. [Google Scholar] [CrossRef]
- Deng, M.H.; Yang, X.; Dai, X.; Zhang, Q.; Malik, A.; Sadeghpour, A. Heavy metal pollution risk assessments and their transportation in sediment and overlay water for the typical Chinese reservoirs. Ecol. Indic. 2020, 112, 106166. [Google Scholar] [CrossRef]
- Xu, X.; Zhi, C.Y.; Chen, L. Potential ecological risk assessment of heavy metal in surface sediments from the Huaxi reservoir. Environ. Monit. China 2012, 28, 76–78. [Google Scholar]
- HJ832-2017; Soil and Sediment-Digestion of Total Metal Elements-Microwave Assisted Acid Digestion Method; Ministry of Environmental Protection: Beijing, China, 2017.
- Hübner, R.; Brian, A.K.; Herbert, R.J.H. Comparison of sediment quality guidelines (SQGs) for the assessment of metal contamination in marine and estuarine environments. J. Environ. Monit. 2009, 11, 713–722. [Google Scholar] [CrossRef]
- MacDonald, D.D.; Ingersoll, C.G.; Berger, T.A. Development and Evaluation of Consensus-Based Sediment Quality Guidelines for Freshwater Ecosystems. Arch. Environ. Contam. Toxicol. 2000, 39, 20–31. [Google Scholar] [CrossRef]
- Jiang, X.X. Influence of Temporal Spatial Variation of Heavy Metals on Diatoms Distribution in Surface Sediments of in Aha Reservoirs; Guizhou Normal University: Guiyang, China, 2007. [Google Scholar]
- Tian, L.F.; Hu, J.W.; Luo, G.L.; Ma, J.J.; Huang, X.F.; Qin, F.X. Ecological risk and stability of heavy metals in sediments from Lake Baihua in Guizhou Province. Acta Sci. Circumstantiae 2012, 32, 885–894. [Google Scholar]
- Liu, F.; Hu, J.W.; Qin, F.X.; Wu, D.; Li, C.X.; Huang, X.F.; Jiang, C.H. An assessment of heavy metal contamination sources in sediments from Hongfeng Lake. Acta Sci. Circumstantiae 2010, 30, 1871–1879. [Google Scholar]
- Yan, M.C.; Chi, Q.H.; Gu, T.X. Average element content of various sediments in China. Geophys. Geochem. Explor. 1995, 19, 468–472. [Google Scholar]
- State Environmental Protection Administration Background Values of Soil Elements in China; China Environmental Science Press: Beijing, China, 1990; pp. 335–379.
- Turekian, K.K.; Wedepohl, K.H. Distribution of the elements in some major units of the earth’s crust. Bull. Geol. Soc. Am. 1961, 72, 175–192. [Google Scholar] [CrossRef]
- Håkanson, L. An ecological risk index for aquatic pollution control a sedimentological approach. Water Res. 1980, 14, 975–1001. [Google Scholar] [CrossRef]
- Loska, K.; Cebula, J.; Pelczar, J.; Wiechuła, D.; Kwapulinski, J. Use of enrichment and contamination factors together with geo-accumulation indexes to evaluate the content of Cd, Cu, and Ni in the Rybnik water reservoir in Poland. Water Air Soil Pollut. 1997, 93, 347–365. [Google Scholar] [CrossRef]
- Maanan, M.; Saddik, M.; Maanan, M.; Chaibi, M.; Assobhei, O.; Zourarah, B. Environmental and ecological risk assessment of heavy metals in sediments of Nador lagoon, Morocco. Ecol. Indic. 2015, 48, 616–626. [Google Scholar] [CrossRef]
- Franco-Uria, A.; Lopez-Mateo, C.; Roca, E.; Fernandez-Marcos, M.L. Source identification of heavy metals in pasture land by multivariate analysis in NW Spain. J. Hazard. Mater. 2009, 165, 1008–1015. [Google Scholar] [CrossRef]
- Harikrishnan, N.; Ravisankar, R.; Chandrasekaran, A.; Suresh, G.M.; Kanagasabapathy, K.V.; Prasad, M.V.R.; Satapathy, K.K. Assessment of heavy metal contamination in marine sediments of East coast of Tamil Nadu affected by different pollution sources. Mar. Pollut. Bull. 2017, 121, 418–424. [Google Scholar] [CrossRef] [PubMed]
- Wang, X.J.; Fu, R.L.; Li, H.L.; Zhang, Y.; Lu, M.Q.; Xiao, K.; Zhang, X.L.; Zheng, C.M.; Xiong, Y. Heavy metal contamination in surface sediments: A comprehensive, large-scale evaluation for the Bohai Sea, China. Environ. Pollut. 2020, 260, 113986. [Google Scholar] [CrossRef] [PubMed]
- Sinex, S.A.; Helz, G.R. Regional geochemistry of trace elements in Chesapeake Bay sediments. Environ. Geol. 1981, 3, 315–323. [Google Scholar] [CrossRef]
- Ravichandran, M.; Baskaran, M.; Santschi, P.H.; Bianchi, T.S. History of trace metal pollution in Sabine-Neches Estuary, Beaumont Texas. Environ. Sci. Technol. 1995, 29, 1495–1503. [Google Scholar] [CrossRef] [PubMed]
- Sutherland, R. Bed sediment-associated trace metals in an urban stream, Oahu, Hawaii. Environ. Geol. 2000, 39, 611–627. [Google Scholar] [CrossRef]
- Kükrer, S.; Çakır, Ç.; Kaya, H.N.; Erginal, A.E. Historical record of metals in Lake Küçükçekmece and Lake Terkos (Istanbul, Turkey) based on anthropogenic impacts and ecological risk assessment. Environ. Forensics 2019, 20, 385–401. [Google Scholar] [CrossRef]
- Yang, Q.Q.; Li, Z.Y.; Lu, X.N.; Duan, Q.N.; Huang, L.; Bi, J. A review of soil heavy metal pollution from mines in China: Pollution and health risk assessment. Sci. Total Environ. 2018, 642, 690–700. [Google Scholar] [CrossRef]
- Luo, X.S.; Ding, J.; Xu, B.; Wang, Y.J.; Li, H.B.; Yu, S. Incorporating bio-accessibility into human risk assessments of heavy metals in urban park soils. Sci. Total Environ. 2012, 424, 88–96. [Google Scholar] [CrossRef]
- Yuswir, N.S.; Praveena, S.M.; Aris, A.Z.; Ismail, S.N.S.; Hashim, Z. Health risk assessment of heavy metal in urban surface soil (Klang District, Malaysia). Bull. Environ. Contam. Toxicol. 2015, 95, 80–89. [Google Scholar] [CrossRef]
- US Environmental Protection Agency (USEPA). Supplemental Guidance for Developing Soil Screening Levels for Superfund Sites, OSWER 9355; Office of Emergency and Remedial Response: Washington, DC, USA, 2002.
- US Environmental Protection Agency (USEPA). Integrated Risk Information System of the US Environmental Protection Agency; US Environmental Protection Agency (USEPA): Washington, DC, USA, 2012.
- US Environmental Protection Agency (USEPA). Exposure Factors Handbook; National Center for Environmental Assessment: Washington, DC, USA, 2011.
- Helsel, D.R.; Hirsch, R.M.; Ryberg, K.R. Statistical Methods in Water Resources; Geological Survey: Reston, VA, USA, 2002. [Google Scholar]
- Rencher, A.C. Methods of Multivariate Analysis; John Wiley & Sons: Hoboken, NJ, USA, 2003. [Google Scholar]
- Cao, Y.X.; Lei, K.; Zhang, X.; Xu, L.; Lin, C.Y.; Yang, Y.N. Contamination and ecological risks of toxic metals in the Hai River, China. Ecotoxicol. Environ. Saf. 2018, 164, 210–221. [Google Scholar] [CrossRef]
- Zhang, X.W.; Wei, S.; Sun, Q.Q.; Wadood, S.A.; Guo, B.L. Source identification and spatial distribution of arsenic and heavy metals in agricultural soil around Hunan industrial estate by positive matrix factorization model, principal components analysis and geo statistical analysis. Ecotoxicol. Environ. Saf. 2018, 159, 354–362. [Google Scholar] [CrossRef]
- Nriagu, J.O.; Bhattacharya, P.; Mukherjee, A.B.; Bundschuh, J.; Zevenhoven, R.; Loeppert, R.H. Arsenic in soil and groundwater: An overview. Trace Met. Other Contam. 2007, 9, 3–60. [Google Scholar]
- Mohiuddin, K.M.; Otomo, K.; Ogawa, Y.; Shikazono, N. Seasonal and spatial distribution of trace elements in the water and sediments of the Tsurumi River in Japan. Environ. Monit. Assess. 2012, 184, 265–279. [Google Scholar] [CrossRef]
- Quinton, J.N.; Catt, J.A. Enrichment of heavy metals in sediment resulting from soil erosion on agricultural fields. Environ. Sci. Technol. 2007, 41, 3495–3500. [Google Scholar] [CrossRef]
- Zheng, N.; Wang, Q.; Liang, Z.; Zheng, D. Characterization of heavy metal concentrations in the sediments of three freshwater rivers in Huludao City, Northeast China. Environ. Pollut. 2008, 154, 135–142. [Google Scholar] [CrossRef]
- Pedersen, F.; Bjørnestad, E.; Andersen, H.V.; Kjølholt, J.; Poll, C. Characterization of sediments from Copenhagen Harbour by use of biotests. Water Sci. Technol. 1998, 37, 233–240. [Google Scholar] [CrossRef]
- Wang, S.L.; Lin, C.Y.; Cao, X.Z. Heavy metals content and distribution in the surface sediments of the Guangzhou section of the Pearl River, Southern China. Environ. Earth Sci. 2011, 64, 1593–1605. [Google Scholar] [CrossRef]
- Xiao, R.; Bai, J.H.; Gao, H.F.; Wang, J.J.; Huang, L.B.; Liu, P.P. Distribution and contamination assessment of heavy metals in water and soils from the college town in the Pearl River Delta, China. Clean Soil Air Water 2012, 40, 1167–1173. [Google Scholar] [CrossRef]
- Yan, L.Y.; Fan, C.W.; Liu, G.H.; Hu, G.; Chen, J.B.; Qin, S. Case study of the characteristic features of the nutritious and heavy metal contents in sediments of the Karst rock mountain reservoir in Guizhou. J. Saf. Environ. 2017, 17, 2031–2037. [Google Scholar]


Publisher’s Note: MDPI stays neutral with regard to jurisdictional claims in published maps and institutional affiliations. |
© 2021 by the authors. Licensee MDPI, Basel, Switzerland. This article is an open access article distributed under the terms and conditions of the Creative Commons Attribution (CC BY) license (https://creativecommons.org/licenses/by/4.0/).