Empirical Evaluation of Alternative Time-Series Models for COVID-19 Forecasting in Saudi Arabia
Abstract
:1. Introduction
2. Literature Review
3. Materials and Methods
3.1. Data Description
3.2. Time-Series Analysis Models
3.2.1. Simple Exponential Smoothing (SES)
3.2.2. Autoregressive Integrated Moving Average (ARIMA)
3.2.3. Exponential Smoothing State Space Model with Box–Cox Transformation, ARMA Errors, Trend and Seasonal Components (TBATS)
3.2.4. Exponential Smoothing (ETS)
3.2.5. Cubic Spline
3.2.6. Holt and HoltWinters
3.3. Experimental Settings
3.4. Performance Measures
- Root mean square error (RMSE)—the square root of the mean of the square of all the errors.where and are the actual and forecasted values of the series at time t, respectively.
- Mean absolute error (MAE)—the average of absolute errors in a dataset. It is calculated as follows:
- Mean absolute percentage error (MAPE)—the accuracy of the forecasting model as a ratio, calculated as follows:
4. Results
4.1. Experiment Results
4.1.1. Confirmed Cases in Saudi Arabia
4.1.2. Recoveries in Saudi Arabia
4.1.3. Deaths in Saudi Arabia
4.1.4. Confirmed Cases in Riyadh
4.2. Discussion
5. Conclusions
Supplementary Materials
Author Contributions
Funding
Data Availability Statement
Conflicts of Interest
References
- Alballa, N.; Al-Turaiki, I. Machine learning approaches in COVID-19 diagnosis, mortality, and severity risk prediction: A review. Informatics Med. Unlocked 2021, 24, 100564. [Google Scholar] [CrossRef]
- World Health Organization. WHO Coronavirus (COVID-19) Dashboard. 2021. Available online: https://covid19.who.int (accessed on 14 July 2021).
- Han, J.; Kamber, M. Data Mining: Concepts and Techniques, 3rd ed.; The Morgan Kaufmann Series in Data Management Systems; Morgan Kaufmann: San Fransisco, CA, USA, 2011. [Google Scholar]
- Kane, M.J.; Price, N.; Scotch, M.; Rabinowitz, P. Comparison of ARIMA and Random Forest time series models for prediction of avian influenza H5N1 outbreaks. BMC Bioinform. 2014, 15, 276. [Google Scholar] [CrossRef] [PubMed]
- Gaudart, J.; Touré, O.; Dessay, N.; Lassane Dicko, A.; Ranque, S.; Forest, L.; Demongeot, J.; Doumbo, O.K. Modelling malaria incidence with environmental dependency in a locality of Sudanese savannah area, Mali. Malar. J. 2009, 8, 61. [Google Scholar] [CrossRef]
- Hanf, M.; Adenis, A.; Nacher, M.; Carme, B. The role of El Niño southern oscillation (ENSO) on variations of monthly Plasmodium falciparum malaria cases at the cayenne general hospital, 1996-2009, French Guiana. Malar. J. 2011, 10, 1–4. [Google Scholar] [CrossRef] [PubMed] [Green Version]
- Dominguez, A.; Muñoz, P.; Martínez, A.; Orcau, A. Monitoring mortality as an indicator of influenza in Catalonia, Spain. J. Epidemiol. Community Health 1996, 50, 293–298. [Google Scholar] [CrossRef] [PubMed] [Green Version]
- Reichert, T.A.; Simonsen, L.; Sharma, A.; Pardo, S.A.; Fedson, D.S.; Miller, M.A. Influenza and the winter increase in mortality in the United States, 1959–1999. Am. J. Epidemiol. 2004, 160, 492–502. [Google Scholar] [CrossRef] [PubMed]
- Song, X.; Xiao, J.; Deng, J.; Kang, Q.; Zhang, Y.; Xu, J. Time series analysis of influenza incidence in Chinese provinces from 2004 to 2011. Medicine 2016, 95, e3929. [Google Scholar] [CrossRef]
- Yi, J.; Du, C.; Wang, R.; Liu, L. Applications of multiple seasonal autoregressive integrated moving average (ARIMA) model on predictive incidence of tuberculosis. Zhonghua Yu Fang Yi Xue Za Zhi Chin. J. Prev. Med. 2007, 41, 118–121. [Google Scholar]
- Wang, H.; Tian, C.; Wang, W.; Luo, X. Time-series analysis of tuberculosis from 2005 to 2017 in China. Epidemiol. Infect. 2018, 146, 935–939. [Google Scholar] [CrossRef] [Green Version]
- Luz, P.M.; Mendes, B.V.; Codeço, C.T.; Struchiner, C.J.; Galvani, A.P. Time series analysis of dengue incidence in Rio de Janeiro, Brazil. Am. J. Trop. Med. Hyg. 2008, 79, 933–939. [Google Scholar] [CrossRef]
- Liu, Q.; Liu, X.; Jiang, B.; Yang, W. Forecasting incidence of hemorrhagic fever with renal syndrome in China using ARIMA model. BMC Infect. Dis. 2011, 11, 218. [Google Scholar] [CrossRef] [Green Version]
- Gecili, E.; Ziady, A.; Szczesniak, R.D. Forecasting COVID-19 confirmed cases, deaths and recoveries: Revisiting established time series modeling through novel applications for the USA and Italy. PLoS ONE 2021, 16, e0244173. [Google Scholar] [CrossRef] [PubMed]
- Tandon, H.; Ranjan, P.; Chakraborty, T.; Suhag, V. Coronavirus (COVID-19): ARIMA based time-series analysis to forecast near future. arXiv 2020, arXiv:2004.07859. [Google Scholar]
- Kanagarathinam, K.; Algehyne, E.A.; Sekar, K. Analysis of ‘earlyR’epidemic model and time series model for prediction of COVID-19 registered cases. Mater. Today Proc. 2020. [Google Scholar] [CrossRef]
- Aslam, M. Using the Kalman filter with Arima for the COVID-19 pandemic dataset of Pakistan. Data Brief 2020, 31, 105854. [Google Scholar] [CrossRef]
- Satrio, C.B.A.; Darmawan, W.; Nadia, B.U.; Hanafiah, N. Time series analysis and forecasting of coronavirus disease in Indonesia using ARIMA model and PROPHET. Procedia Comput. Sci. 2021, 179, 524–532. [Google Scholar] [CrossRef]
- Tseng, Y.J.; Shih, Y.L. Developing epidemic forecasting models to assist disease surveillance for influenza with electronic health records. Int. J. Comput. Appl. 2020, 42, 616–621. [Google Scholar] [CrossRef]
- Maleki, M.; Mahmoudi, M.R.; Heydari, M.H.; Pho, K.H. Modeling and forecasting the spread and death rate of coronavirus (COVID-19) in the world using time series models. Chaos Solitons Fractals 2020, 140, 110151. [Google Scholar] [CrossRef]
- Liu, Z.; Guo, W. Government Responses Matter: Predicting COVID-19 cases in US using an empirical Bayesian time series framework. medRxiv 2020. [Google Scholar] [CrossRef]
- Alzahrani, S.I.; Aljamaan, I.A.; Al-Fakih, E.A. Forecasting the spread of the COVID-19 pandemic in Saudi Arabia using ARIMA prediction model under current public health interventions. J. Infect. Public Health 2020, 13, 914–919. [Google Scholar] [CrossRef] [PubMed]
- Abuhasel, K.A.; Khadr, M.; Alquraish, M.M. Analyzing and forecasting COVID-19 pandemic in the Kingdom of Saudi Arabia using ARIMA and SIR models. Comput. Intell. 2020. [Google Scholar] [CrossRef]
- Elhassan, T.; Gaafar, A. Mathematical modeling of the COVID-19 prevalence in Saudi Arabia. medRxiv 2020. [Google Scholar] [CrossRef]
- Khoj, H.; Mujallad, A.F. Epidemic Situation and Forecasting if COVID-19 in Saudi Arabia using SIR model. medRxiv 2020. [Google Scholar] [CrossRef]
- Alrasheed, H.; Althnian, A.; Kurdi, H.; Al-Mgren, H.; Alharbi, S. COVID-19 Spread in Saudi Arabia: Modeling, Simulation and Analysis. Int. J. Environ. Res. Public Health 2020, 17, 7744. [Google Scholar] [CrossRef] [PubMed]
- Awwad, F.A.; Mohamoud, M.A.; Abonazel, M.R. Estimating COVID-19 cases in Makkah region of Saudi Arabia: Space-time ARIMA modeling. PLoS ONE 2021, 16, e0250149. [Google Scholar] [CrossRef]
- Omran, N.F.; Abd-el Ghany, S.F.; Saleh, H.; Ali, A.A.; Gumaei, A.; Al-Rakhami, M. Applying Deep Learning Methods on Time-Series Data for Forecasting COVID-19 in Egypt, Kuwait, and Saudi Arabia. Complexity 2021, 2021, 6686745. [Google Scholar] [CrossRef]
- Alharbi, N. Forecasting the COVID-19 Pandemic in Saudi Arabia Using a Modified Singular Spectrum Analysis Approach: Model Development and Data Analysis. JMIRx Med. 2021, 2, e21044. [Google Scholar] [CrossRef]
- Saudi Arabian Ministry of HealthCorona Virus Response. 2021. Available online: https://covid19-saudimoh.hub.arcgis.com/ (accessed on 14 July 2021).
- Ostertagova, E.; Ostertag, O. Forecasting using simple exponential smoothing method. Acta Electrotech. Inform. 2012, 12, 62. [Google Scholar] [CrossRef]
- Yorucu, V. The analysis of forecasting performance by using time series data for two Mediterranean islands. Rev. Soc. Econ. Bus. Stud. 2003, 2, 175–196. [Google Scholar]
- Peter, Ď.; Silvia, P. ARIMA vs. ARIMAX–which approach is better to analyze and forecast macroeconomic time series. In Proceedings of the 30th International Conference Mathematical Methods in Economics, Karvina, Czech Republic, 11–13 September 2012; Volume 2, pp. 136–140. [Google Scholar]
- Box, G.E.; Jenkins, G.M.; Reinsel, G.C.; Ljung, G.M. Time Series Analysis: Forecasting and Control; John Wiley & Sons: New York, NY, USA, 2015. [Google Scholar]
- Tariq, H.; Hanif, M.K.; Sarwar, M.U.; Bari, S.; Sarfraz, M.S.; Oskouei, R.J. Employing Deep Learning and Time Series Analysis to Tackle the Accuracy and Robustness of the Forecasting Problem. Secur. Commun. Netw. 2021, 2021, e5587511. [Google Scholar] [CrossRef]
- De Livera, A.M.; Hyndman, R.J.; Snyder, R.D. Forecasting time series with complex seasonal patterns using exponential smoothing. J. Am. Stat. Assoc. 2011, 106, 1513–1527. [Google Scholar] [CrossRef] [Green Version]
- Brown, R.G. Statistical Forecasting for Inventory Control; McGraw/Hill: New York, NY, USA, 1959. [Google Scholar]
- Holt, C.C. Forecasting seasonals and trends by exponentially weighted moving averages. Int. J. Forecast. 2004, 20, 5–10. [Google Scholar] [CrossRef]
- Winters, P.R. Forecasting sales by exponentially weighted moving averages. Manag. Sci. 1960, 6, 324–342. [Google Scholar] [CrossRef]
- Hyndman, R.J.; King, M.L.; Pitrun, I.; Billah, B. Local linear forecasts using cubic smoothing splines. Aust. N. Z. J. Stat. 2005, 47, 87–99. [Google Scholar] [CrossRef] [Green Version]
- Chatfield, C. The Holt-Winters forecasting procedure. J. R. Stat. Soc. Ser. C Appl. Stat. 1978, 27, 264–279. [Google Scholar] [CrossRef]
- Ismail, L.; Materwala, H.; Znati, T.; Turaev, S.; Khan, M.A.B. Tailoring time series models for forecasting coronavirus spread: Case studies of 187 countries. Comput. Struct. Biotechnol. J. 2020, 18, 2972–3206. [Google Scholar] [CrossRef] [PubMed]
- Liu, X.; Huang, J.; Li, C.; Zhao, Y.; Wang, D.; Huang, Z.; Yang, K. The role of seasonality in the spread of COVID-19 pandemic. Environ. Res. 2021, 195, 110874. [Google Scholar] [CrossRef] [PubMed]
- Petropoulos, F.; Makridakis, S.; Stylianou, N. COVID-19: Forecasting confirmed cases and deaths with a simple time series model. Int. J. Forecast. 2020. [Google Scholar] [CrossRef]
- Byun, W.S.; Heo, S.W.; Jo, G.; Kim, J.W.; Kim, S.; Lee, S.; Park, H.E.; Baek, J.H. Is coronavirus disease (COVID-19) seasonal? A critical analysis of empirical and epidemiological studies at global and local scales. Environ. Res. 2021, 110972. [Google Scholar] [CrossRef]
- Chen, S.; Prettner, K.; Kuhn, M.; Geldsetzer, P.; Wang, C.; Bärnighausen, T.; Bloom, D.E. Climate and the spread of COVID-19. Sci. Rep. 2021, 11, 9042. [Google Scholar] [CrossRef]
- COVID-19 KSA. Available online: https://covid19.moh.gov.sa/ (accessed on 7 June 2021).


| Study | Country | Models | Dataset |
|---|---|---|---|
| [15] | India, USA, Spain, Italy, France, Germany, China, Iran, others | ARIMA, SVM, WNN | 22 Jan to 13 Apr 2020 (81 days) |
| [16] | India | earlyR, ARIMA | 3–24 May 2020 (21 days) |
| [14] | USA, Italy | Holt, ARIMA, TBATS, cubic smoothing spline | 22 Feb to 29 Apr 2020 (67 days) |
| [20] | Global | TP–SMN, Gaussian time series | 22 Jan to 8 Apr 2020 (77 days) |
| [21] | Global | Bayesian | 21 Jan to 26 Mar 2020 (65 days) |
| [18] | Indonesia | Facebook’s Prophet, ARIMA | 20 Jan to 21 May 2020 (122 days) |
| [17] | Pakistan | pragmatic approach of the Kalman filter, ARIMA | 26 Feb to 30 Apr 2020 (64 days) |
| [22] | Saudi Arabia | AR, MA, ARMA, ARIMA | 2 Mar to 20 Apr 2020 (49 days) |
| [23] | Saudi Arabia | ARIMA | 2 Mar to 30 Jun 2020 (120 days) |
| [24] | Saudi Arabia | ARIMA and logistic-growth models | 2 Mar to 21 Jun 2020 (111 days) |
| [25] | Saudi Arabia | SIR | 2 Mar to 29 Apr 2020 (58 days) |
| [26] | Saudi Arabia | network-based model | 2 Mar to 25 Apr 2020 (54 days) |
| [27] | Saudi Arabia | ARIMA, STARIMA | 31 May to 11 Oct 2020 (58 days) |
| [28] | Egypt, Saudi Arabia, and Kuwait | LSTM, GRU | 1 May to 6 Dec 2020 (219 days) |
| [29] | Saudi Arabia | SSA | 2 Mar to 12 May 2020 (71 days) |
| KSA | Riyadh | ||||
|---|---|---|---|---|---|
| Date | Confirmed | Recovered | Deaths | Confirmed | Percentage of the Total Confirmed Cases |
| 31 March 2020 | 1563 | 165 | 10 | 573 | 37% |
| 30 April 2020 | 24,097 | 3555 | 169 | 4524 | 19% |
| 31 May 2020 | 85,261 | 62,474 | 503 | 20,927 | 25% |
| 30 June 2020 | 190,823 | 130,766 | 1649 | 47,457 | 25% |
| 31 July 2020 | 275,905 | 235,658 | 2866 | 54,780 | 20% |
| 31 August 2020 | 315,772 | 290,796 | 3897 | 57,391 | 18% |
| 30 September 2020 | 334,605 | 319,154 | 4768 | 58,652 | 18% |
| 31 October 2020 | 347,282 | 333,842 | 5402 | 59,930 | 17% |
| 30 November 2020 | 357,360 | 346,802 | 5896 | 61,722 | 17% |
| 31 December 2020 | 362,741 | 353,853 | 6223 | 62,896 | 17% |
| 31 January 2021 | 368,074 | 359,573 | 6375 | 64,460 | 18% |
| 28 February 2021 | 377,383 | 368,305 | 6494 | 67,634 | 18% |
| 31 March 2021 | 390,007 | 378,083 | 6669 | 69,330 | 18% |
| Period 1 | Period 2 | Period 3 | |||||||
|---|---|---|---|---|---|---|---|---|---|
| Model | RMSE | MAE | MAPE | RMSE | MAE | MAPE | RMSE | MAE | MAPE |
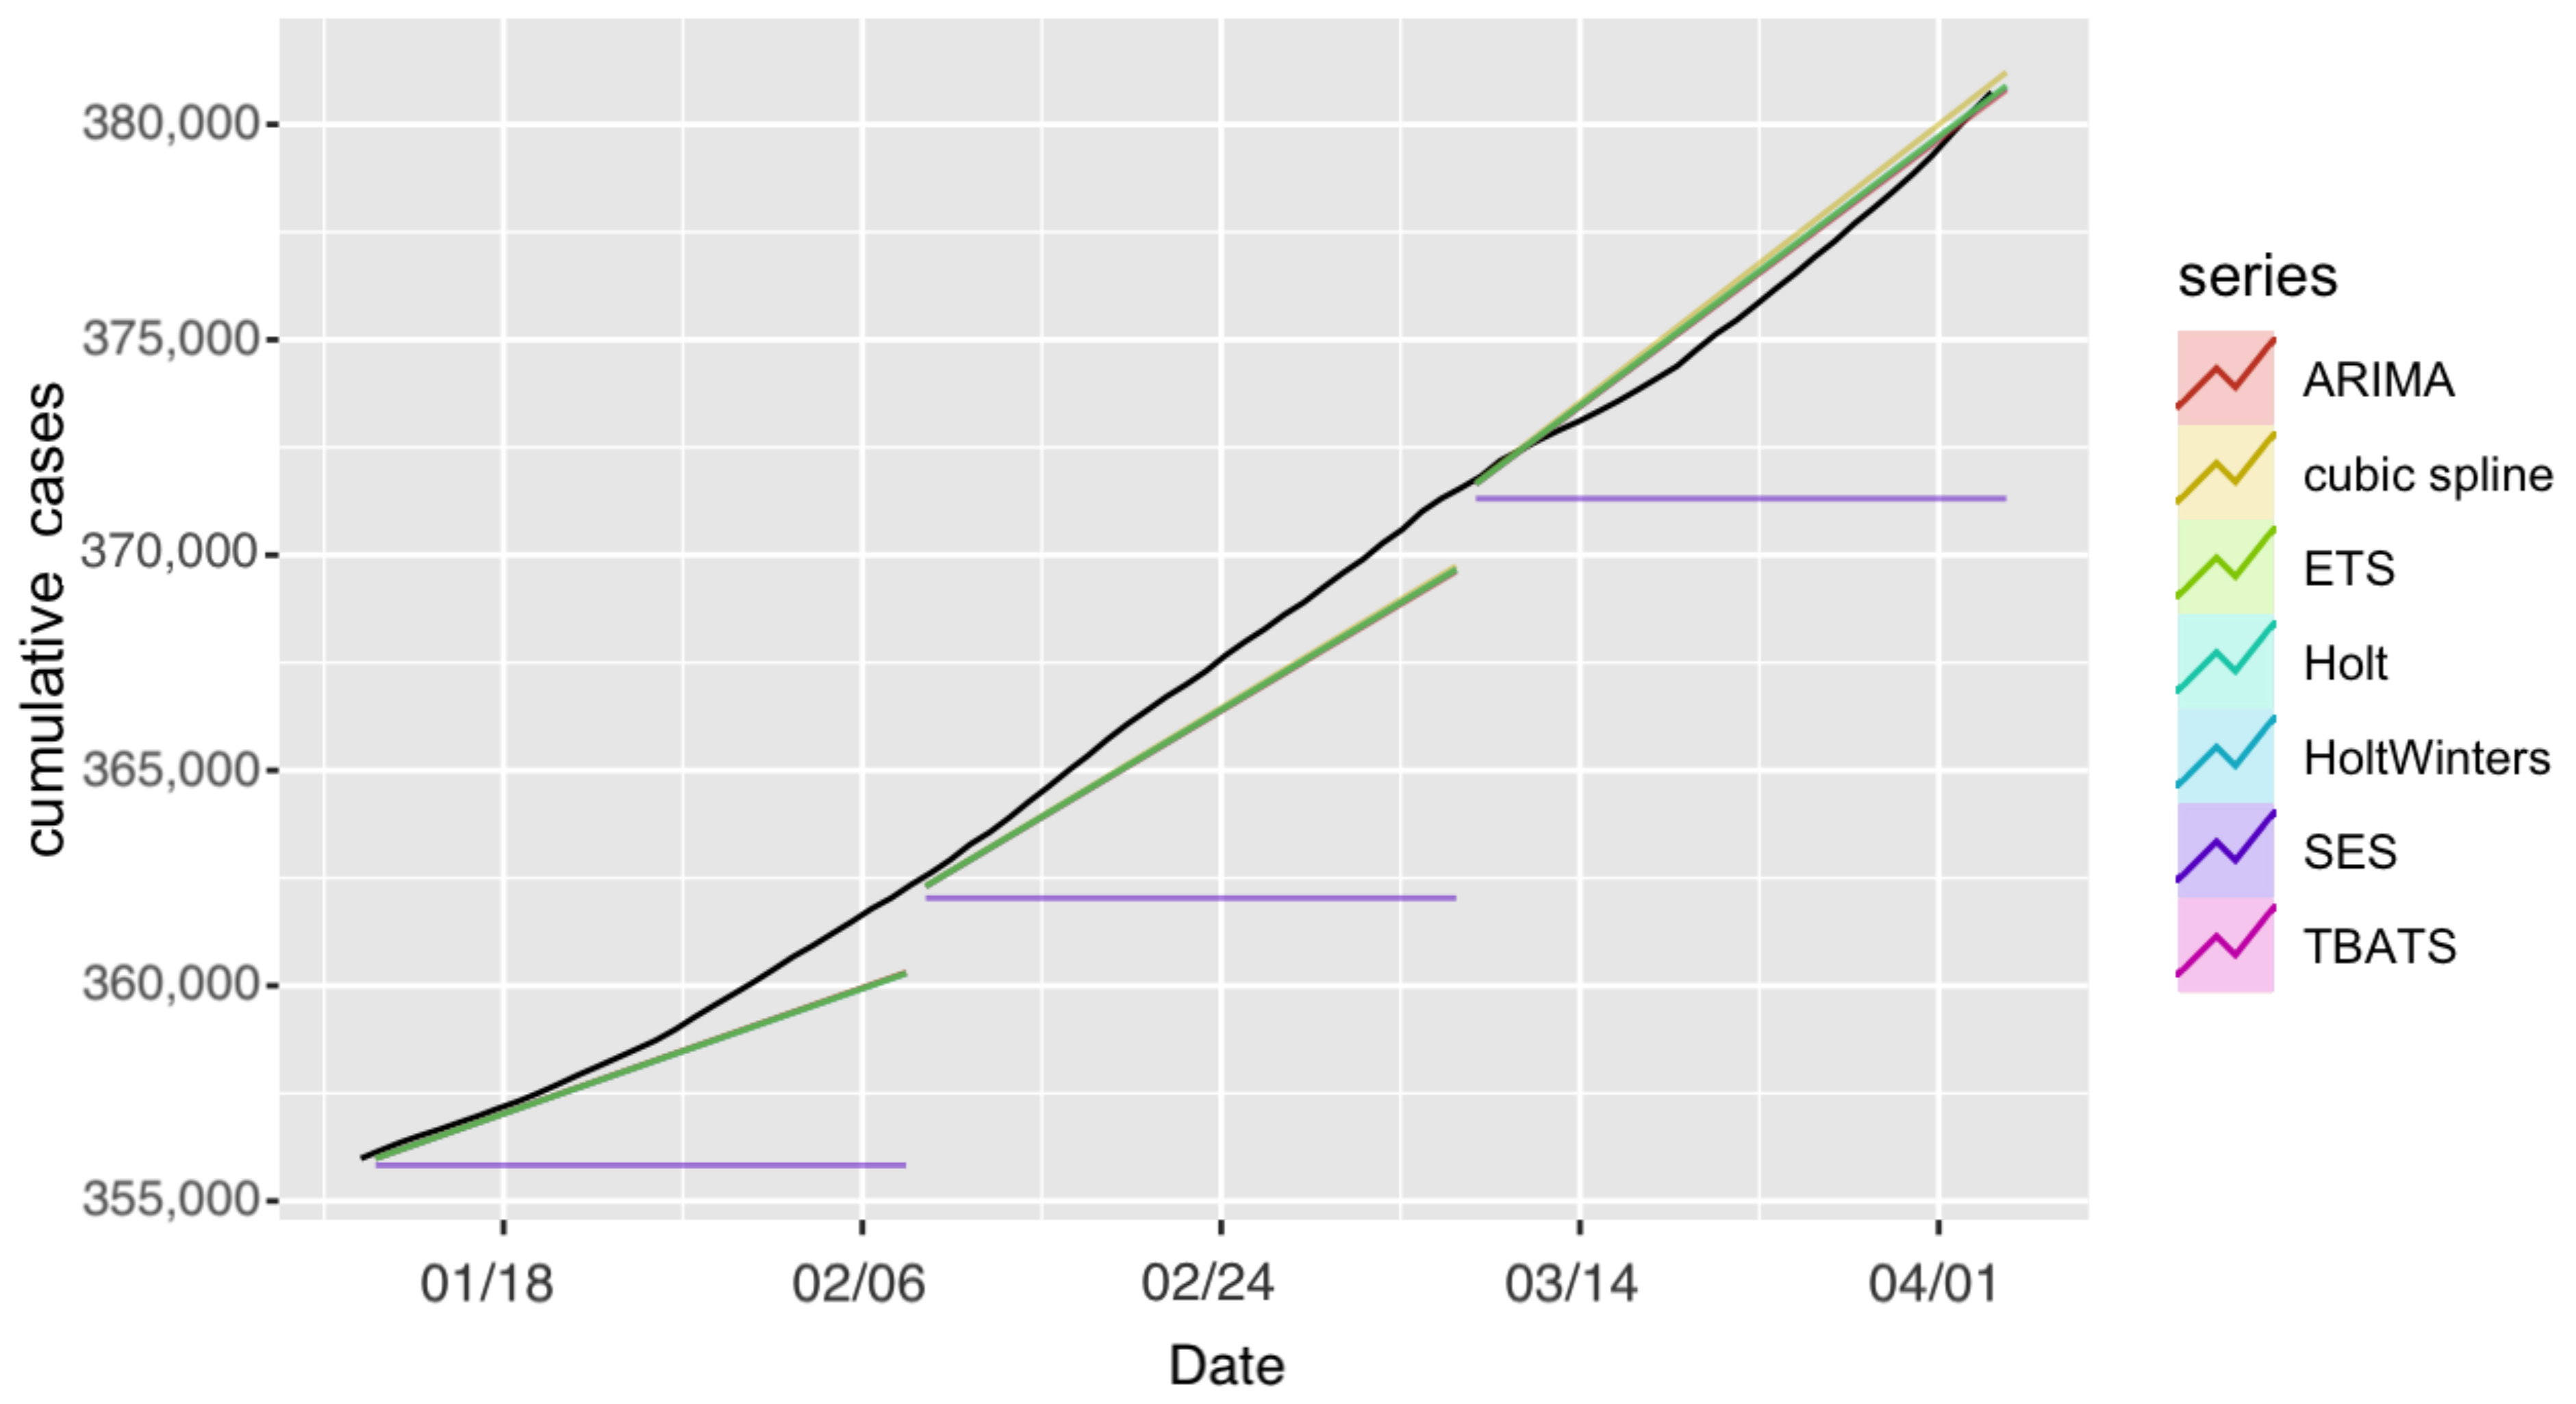
| ARIMA | 1225.9 | 921.3 | 0.250 | 54.67 | 41.8 | 0.01 | 865.6 | 539.7 | 0.138 |
| TBATS | 1281.39 | 972.3 | 0.264 | 251.71 | 216.59 | 0.057 | 1397.4 | 849.1 | 0.217 |
| ETS | 1274.1 | 965.8 | 0.262 | 255.15 | 219.5 | 0.058 | 976.48 | 588.67 | 0.151 |
| Cubic splines | 1460 | 1136.44 | 0.309 | 223.68 | 192.73 | 0.051 | 1175.3 | 698.36 | 0.179 |
| Holt | 1274.15 | 965.83 | 0.262 | 255.16 | 219.5 | 0.058 | 976.03 | 588.46 | 0.151 |
| HoltWinters | 1274.16 | 965.84 | 0.262 | 255.10 | 219.4 | 0.058 | 976.26 | 588.57 | 0.151 |
| SES | 3672.4 | 3085.1 | 0.839 | 5611.9 | 4907.9 | 1.302 | 7192.1 | 6070 | 1.562 |
| Period 1 | Period 2 | Period 3 | |||||||
|---|---|---|---|---|---|---|---|---|---|
| Model | RMSE | MAE | MAPE | RMSE | MAE | MAPE | RMSE | MAE | MAPE |
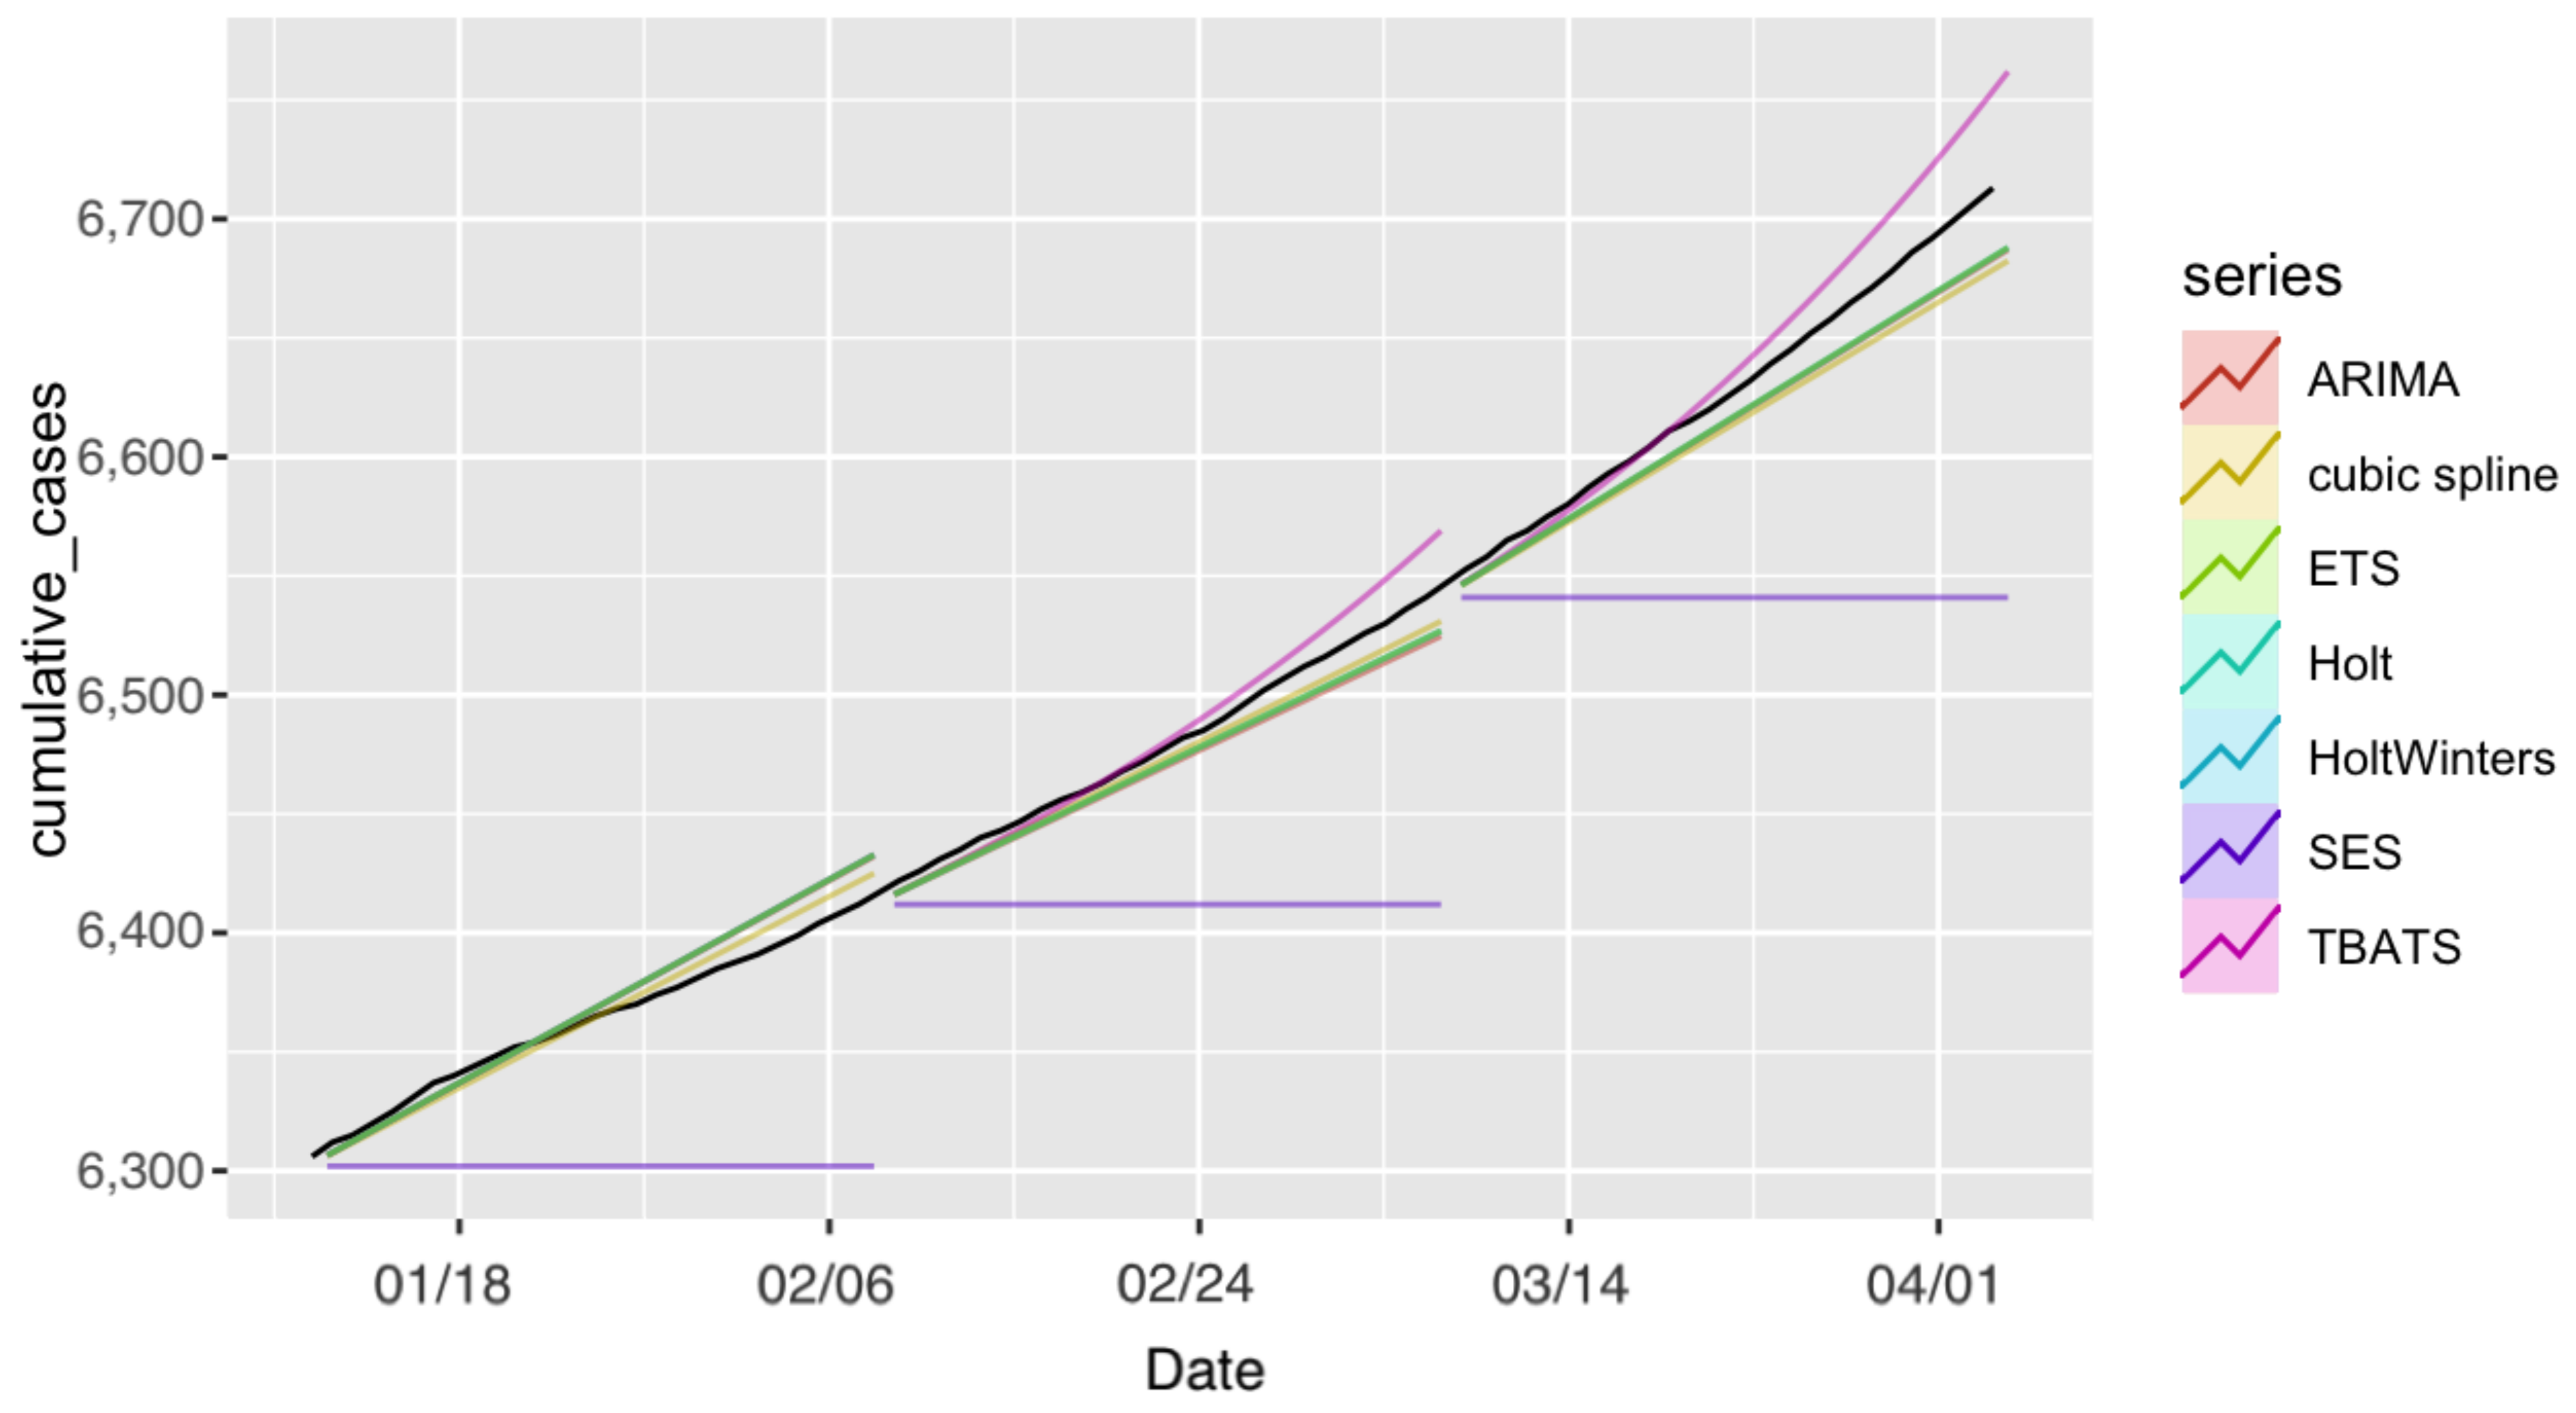
| ARIMA | 771.63 | 529.84 | 0.147 | 980.55 | 841.21 | 0.228 | 678.52 | 607.44 | 0.162 |
| TBATS | 779.25 | 537.41 | 0.149 | 960.41 | 824.15 | 0.224 | 697.27 | 627.98 | 0.167 |
| ETS | 783.04 | 540.17 | 0.150 | 949.71 | 813.38 | 0.221 | 727.31 | 659.30 | 0.175 |
| Cubic splines | 769.71 | 526.29 | 0.146 | 898.9 | 766.4 | 0.208 | 895.64 | 829.17 | 0.220 |
| Holt | 783.03 | 540.17 | 0.150 | 949.69 | 813.35 | 0.221 | 727.23 | 659.22 | 0.175 |
| HoltWinters | 783.01 | 540.14 | 0.150 | 949.72 | 813.39 | 0.221 | 727.23 | 659.23 | 0.175 |
| SES | 3381.3 | 2846.7 | 0.791 | 5471 | 4765 | 1.294 | 5085.2 | 4302.9 | 1.140 |
| Period 1 | Period 2 | Period 3 | |||||||
|---|---|---|---|---|---|---|---|---|---|
| Model | RMSE | MAE | MAPE | RMSE | MAE | MAPE | RMSE | MAE | MAPE |
| ARIMA | 11.16 | 8.36 | 0.131 | 7.917 | 6.5 | 0.10 | 12.13 | 9.6 | 0.144 |
| TBATS | 11.56 | 8.68 | 0.136 | 12.04 | 8.76 | 0.134 | 22.09 | 16.06 | 0.241 |
| ETS | 11.51 | 8.64 | 0.135 | 6.64 | 5.31 | 0.082 | 11.64 | 9.19 | 0.138 |
| Cubic splines | 7.24 | 5.64 | 0.0884 | 4.38 | 3.22 | 0.049 | 14.93 | 12.19 | 0.183 |
| Holt | 11.51 | 8.64 | 0.135 | 6.64 | 5.31 | 0.082 | 11.64 | 9.19 | 0.138 |
| HoltWinters | 11.51 | 8.64 | 0.135 | 6.64 | 5.31 | 0.082 | 11.64 | 9.19 | 0.138 |
| SES | 66.66 | 59.44 | 0.932 | 74.58 | 64.9 | 0.999 | 98.56 | 85.37 | 1.283 |
| Period 1 | Period 2 | Period 3 | |||||||
|---|---|---|---|---|---|---|---|---|---|
| Model | RMSE | MAE | MAPE | RMSE | MAE | MAPE | RMSE | MAE | MAPE |
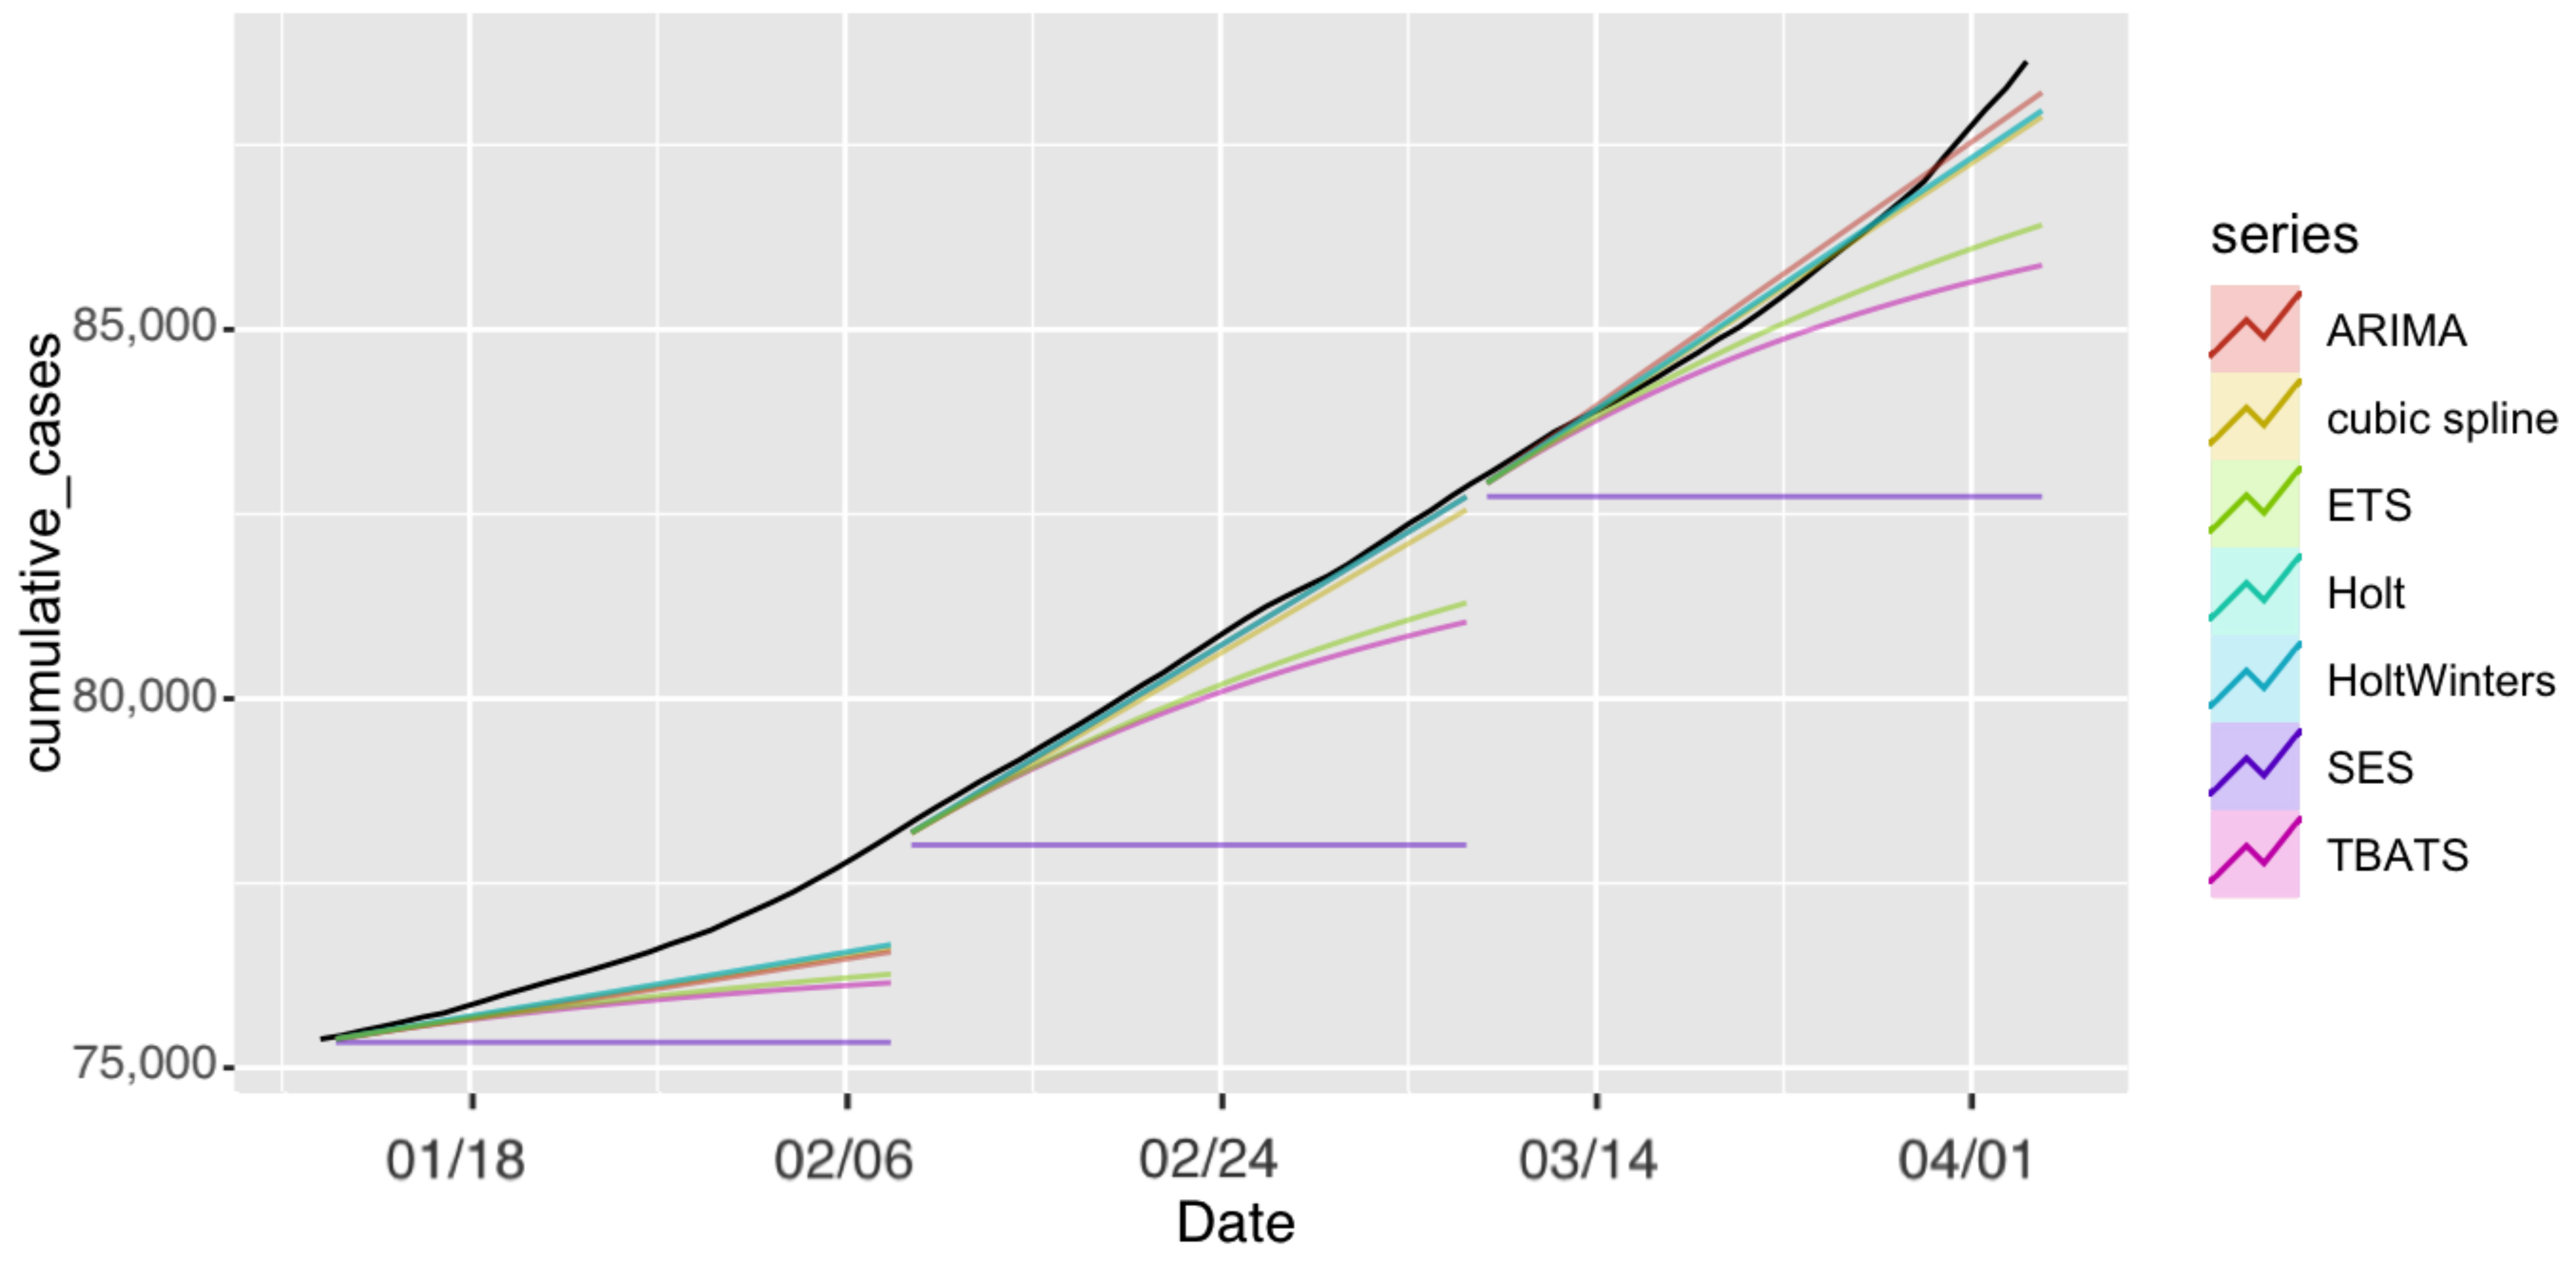
| ARIMA | 645.1 | 488.4 | 0.633 | 29.17 | 23.89 | 0.029 | 300.5 | 265.9 | 0.31 |
| TBATS | 841.36 | 633.1 | 0.821 | 814.67 | 626.3 | 0.768 | 1105.07 | 728.89 | 0.836 |
| ETS | 782 | 586.22 | 0.760 | 686.59 | 528.25 | 0.648 | 838.60 | 518.99 | 0.594 |
| Cubic splines | 616.84 | 462 | 0.599 | 93 | 79.65 | 0.98 | 262.1 | 199.87 | 0.231 |
| Holt | 587.59 | 435.72 | 0.565 | 29.57 | 23.89 | 0.0296 | 259.09 | 213.44 | 0.248 |
| HoltWinters | 587.55 | 435.69 | 0.565 | 29.56 | 23.88 | 0.0296 | 259.1 | 213.6 | 0.248 |
| SES | 1358.3 | 1120.2 | 1.455 | 2780 | 2428.4 | 2.991 | 3102.6 | 2630.2 | 3.045 |
Publisher’s Note: MDPI stays neutral with regard to jurisdictional claims in published maps and institutional affiliations. |
© 2021 by the authors. Licensee MDPI, Basel, Switzerland. This article is an open access article distributed under the terms and conditions of the Creative Commons Attribution (CC BY) license (https://creativecommons.org/licenses/by/4.0/).
Share and Cite
Al-Turaiki, I.; Almutlaq, F.; Alrasheed, H.; Alballa, N. Empirical Evaluation of Alternative Time-Series Models for COVID-19 Forecasting in Saudi Arabia. Int. J. Environ. Res. Public Health 2021, 18, 8660. https://doi.org/10.3390/ijerph18168660
Al-Turaiki I, Almutlaq F, Alrasheed H, Alballa N. Empirical Evaluation of Alternative Time-Series Models for COVID-19 Forecasting in Saudi Arabia. International Journal of Environmental Research and Public Health. 2021; 18(16):8660. https://doi.org/10.3390/ijerph18168660
Chicago/Turabian StyleAl-Turaiki, Isra, Fahad Almutlaq, Hend Alrasheed, and Norah Alballa. 2021. "Empirical Evaluation of Alternative Time-Series Models for COVID-19 Forecasting in Saudi Arabia" International Journal of Environmental Research and Public Health 18, no. 16: 8660. https://doi.org/10.3390/ijerph18168660
APA StyleAl-Turaiki, I., Almutlaq, F., Alrasheed, H., & Alballa, N. (2021). Empirical Evaluation of Alternative Time-Series Models for COVID-19 Forecasting in Saudi Arabia. International Journal of Environmental Research and Public Health, 18(16), 8660. https://doi.org/10.3390/ijerph18168660


