
Is Technological Progress Selective for Multiple Pollutant Emissions?


Abstract
:1. Introduction
2. Methods and Data
2.1. The DEA-SBM Model
2.2. The Regression Model
2.3. Data Sources
- (1)
- Labor input. Labor input is measured using the number of employed persons in each province of China, and the data are obtained from the statistical yearbooks of each province of China.
- (2)
- Capital input. The amount of completed fixed asset investment in each province of China is used to measure capital input. The data are obtained from the statistical yearbooks of each province of China.
- (3)
- Energy input. We use the data of energy consumption of each province in China; the data come from the China Energy Statistical Yearbook.
- (4)
- Desired output. Nominal GDP data of each province in China are used and deflated to real GDP using CPI index, data from China Statistical Yearbook.
- (5)
- Undesired output. We use pollution data for each province in China, where CO2 is the converted emissions from energy consumption in each province, and the conversion method uses the carbon emission calculation method in the Guidelines for National Greenhouse Gas Inventories prepared by the Intergovernmental Panel on Climate Change (IPCC, 2016).
3. Empirical Results
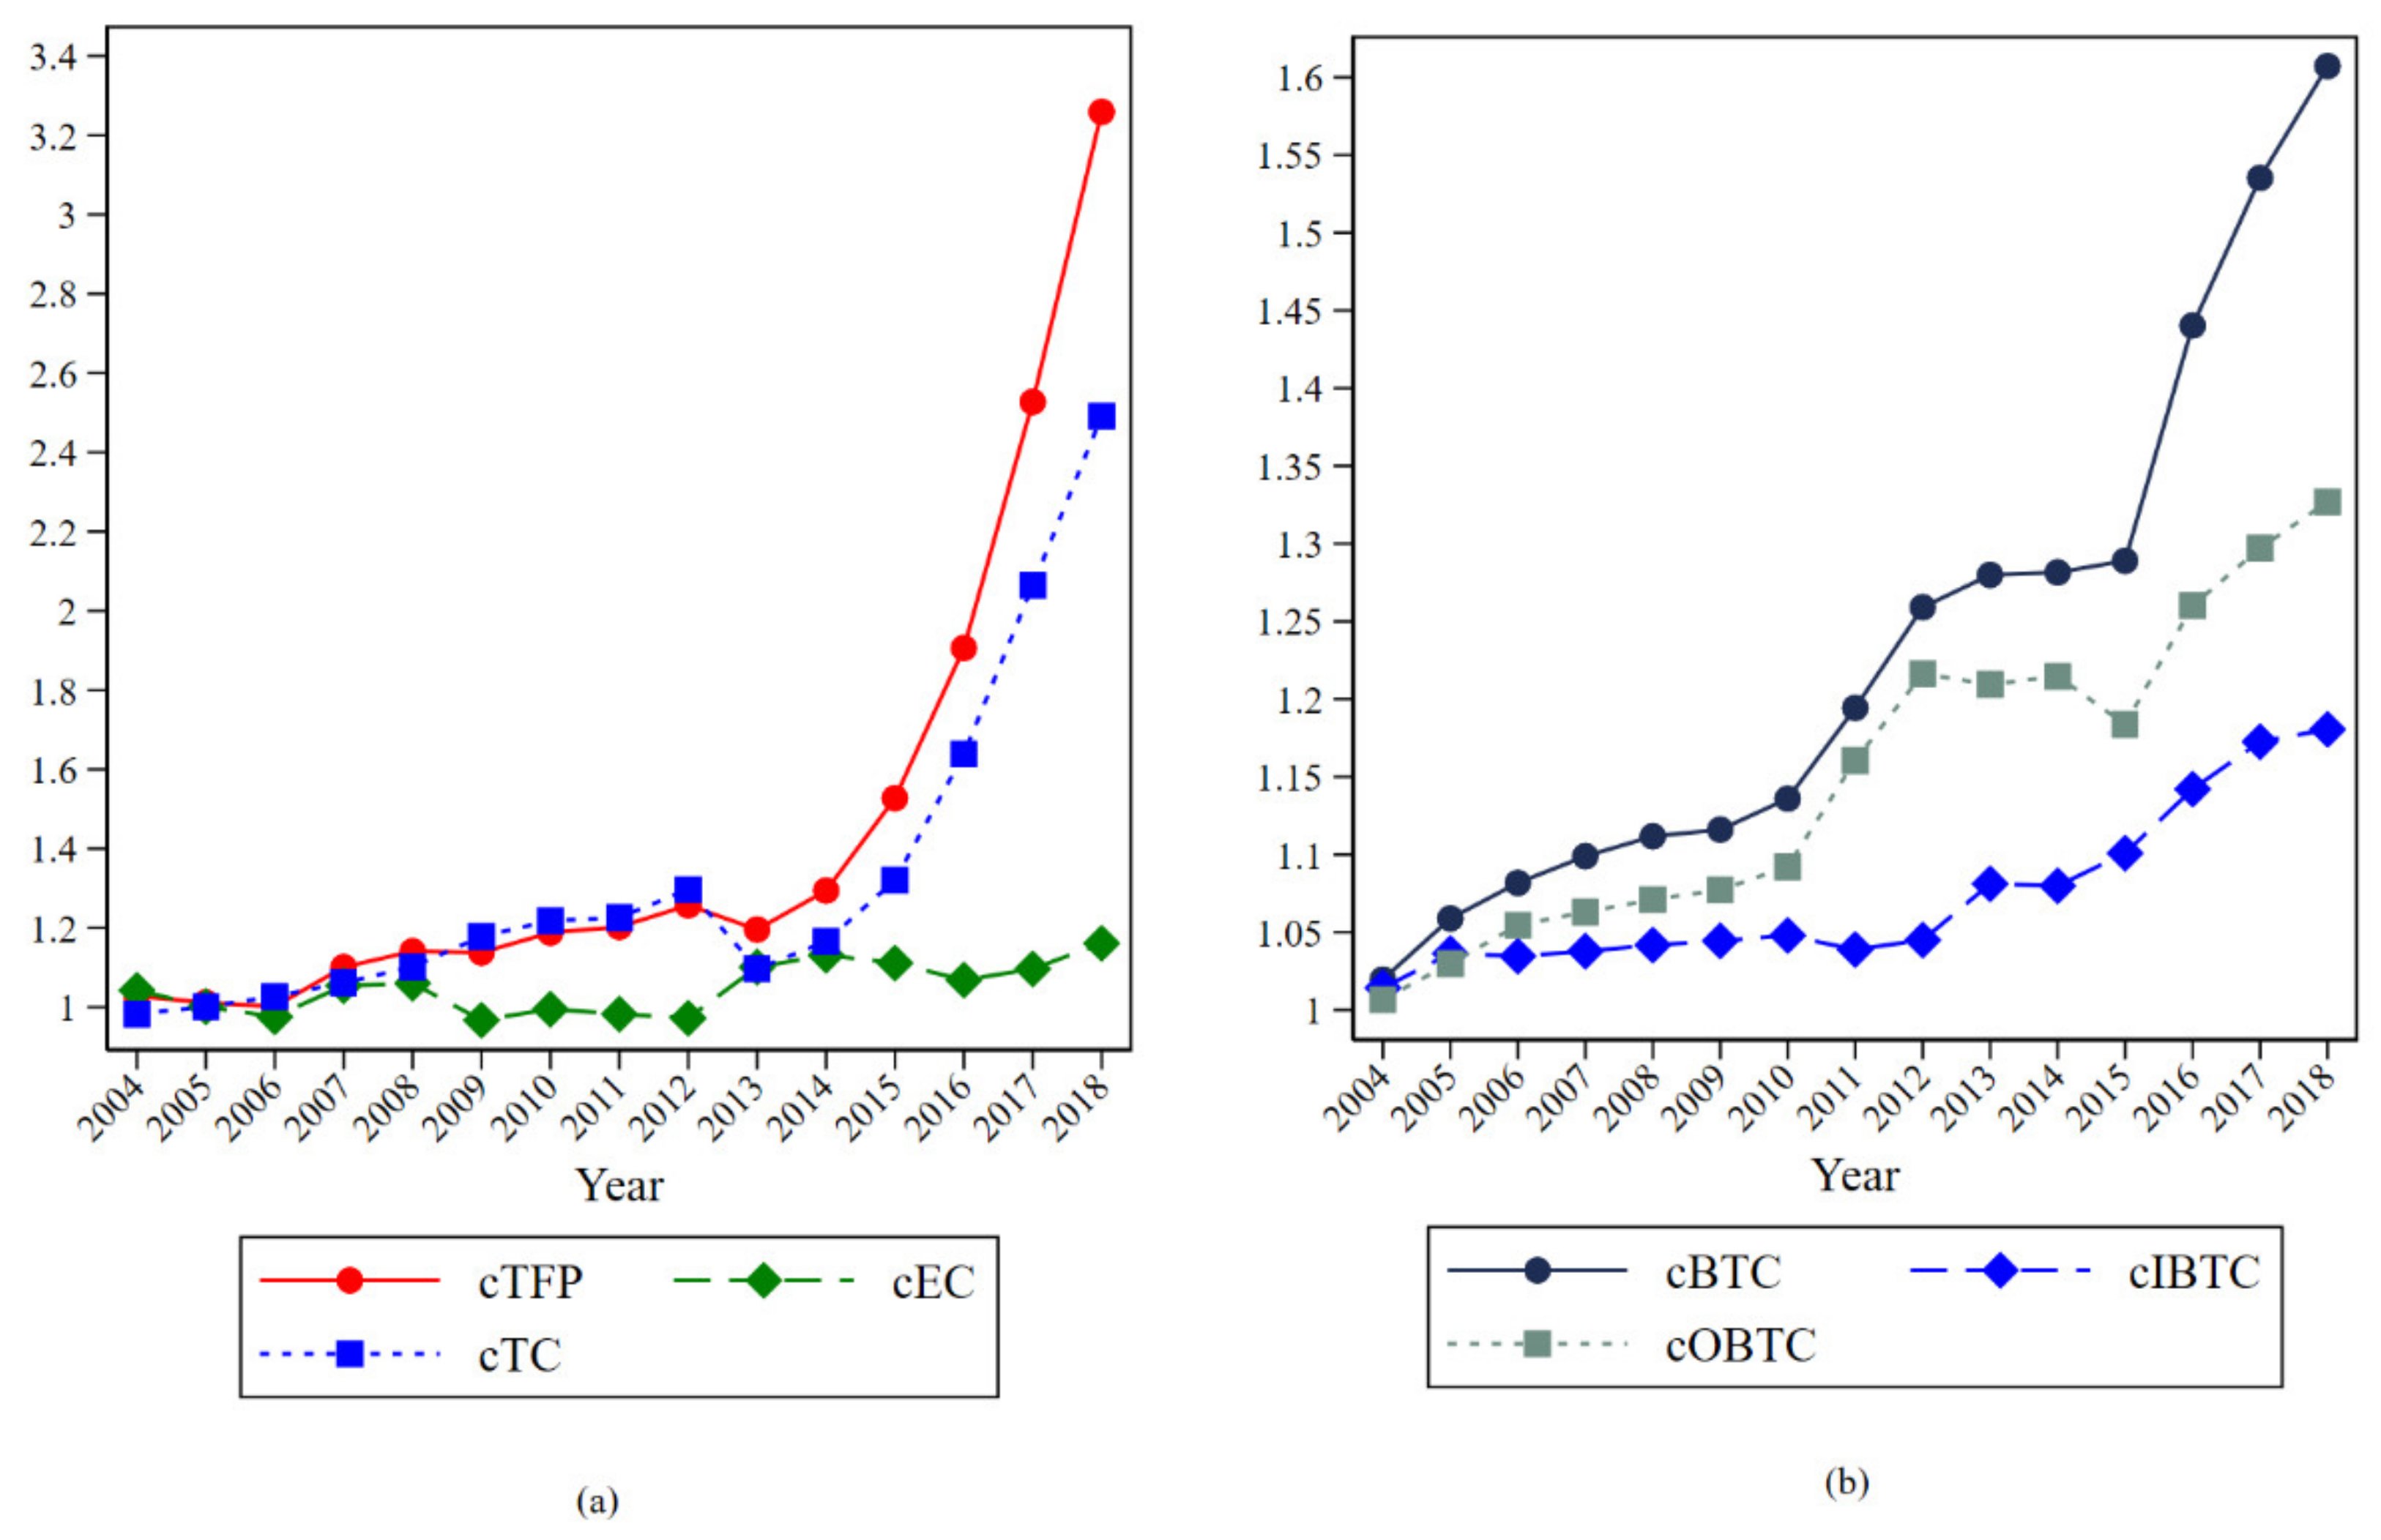
3.1. Green Total Factor Productivity and Its Decomposition Results
3.2. Analysis of the Characteristics of Output Biased Technological Progress Factors
3.3. Analysis of the Influencing Factors of Pollutants
4. Discussions and Conclusions
- (1)
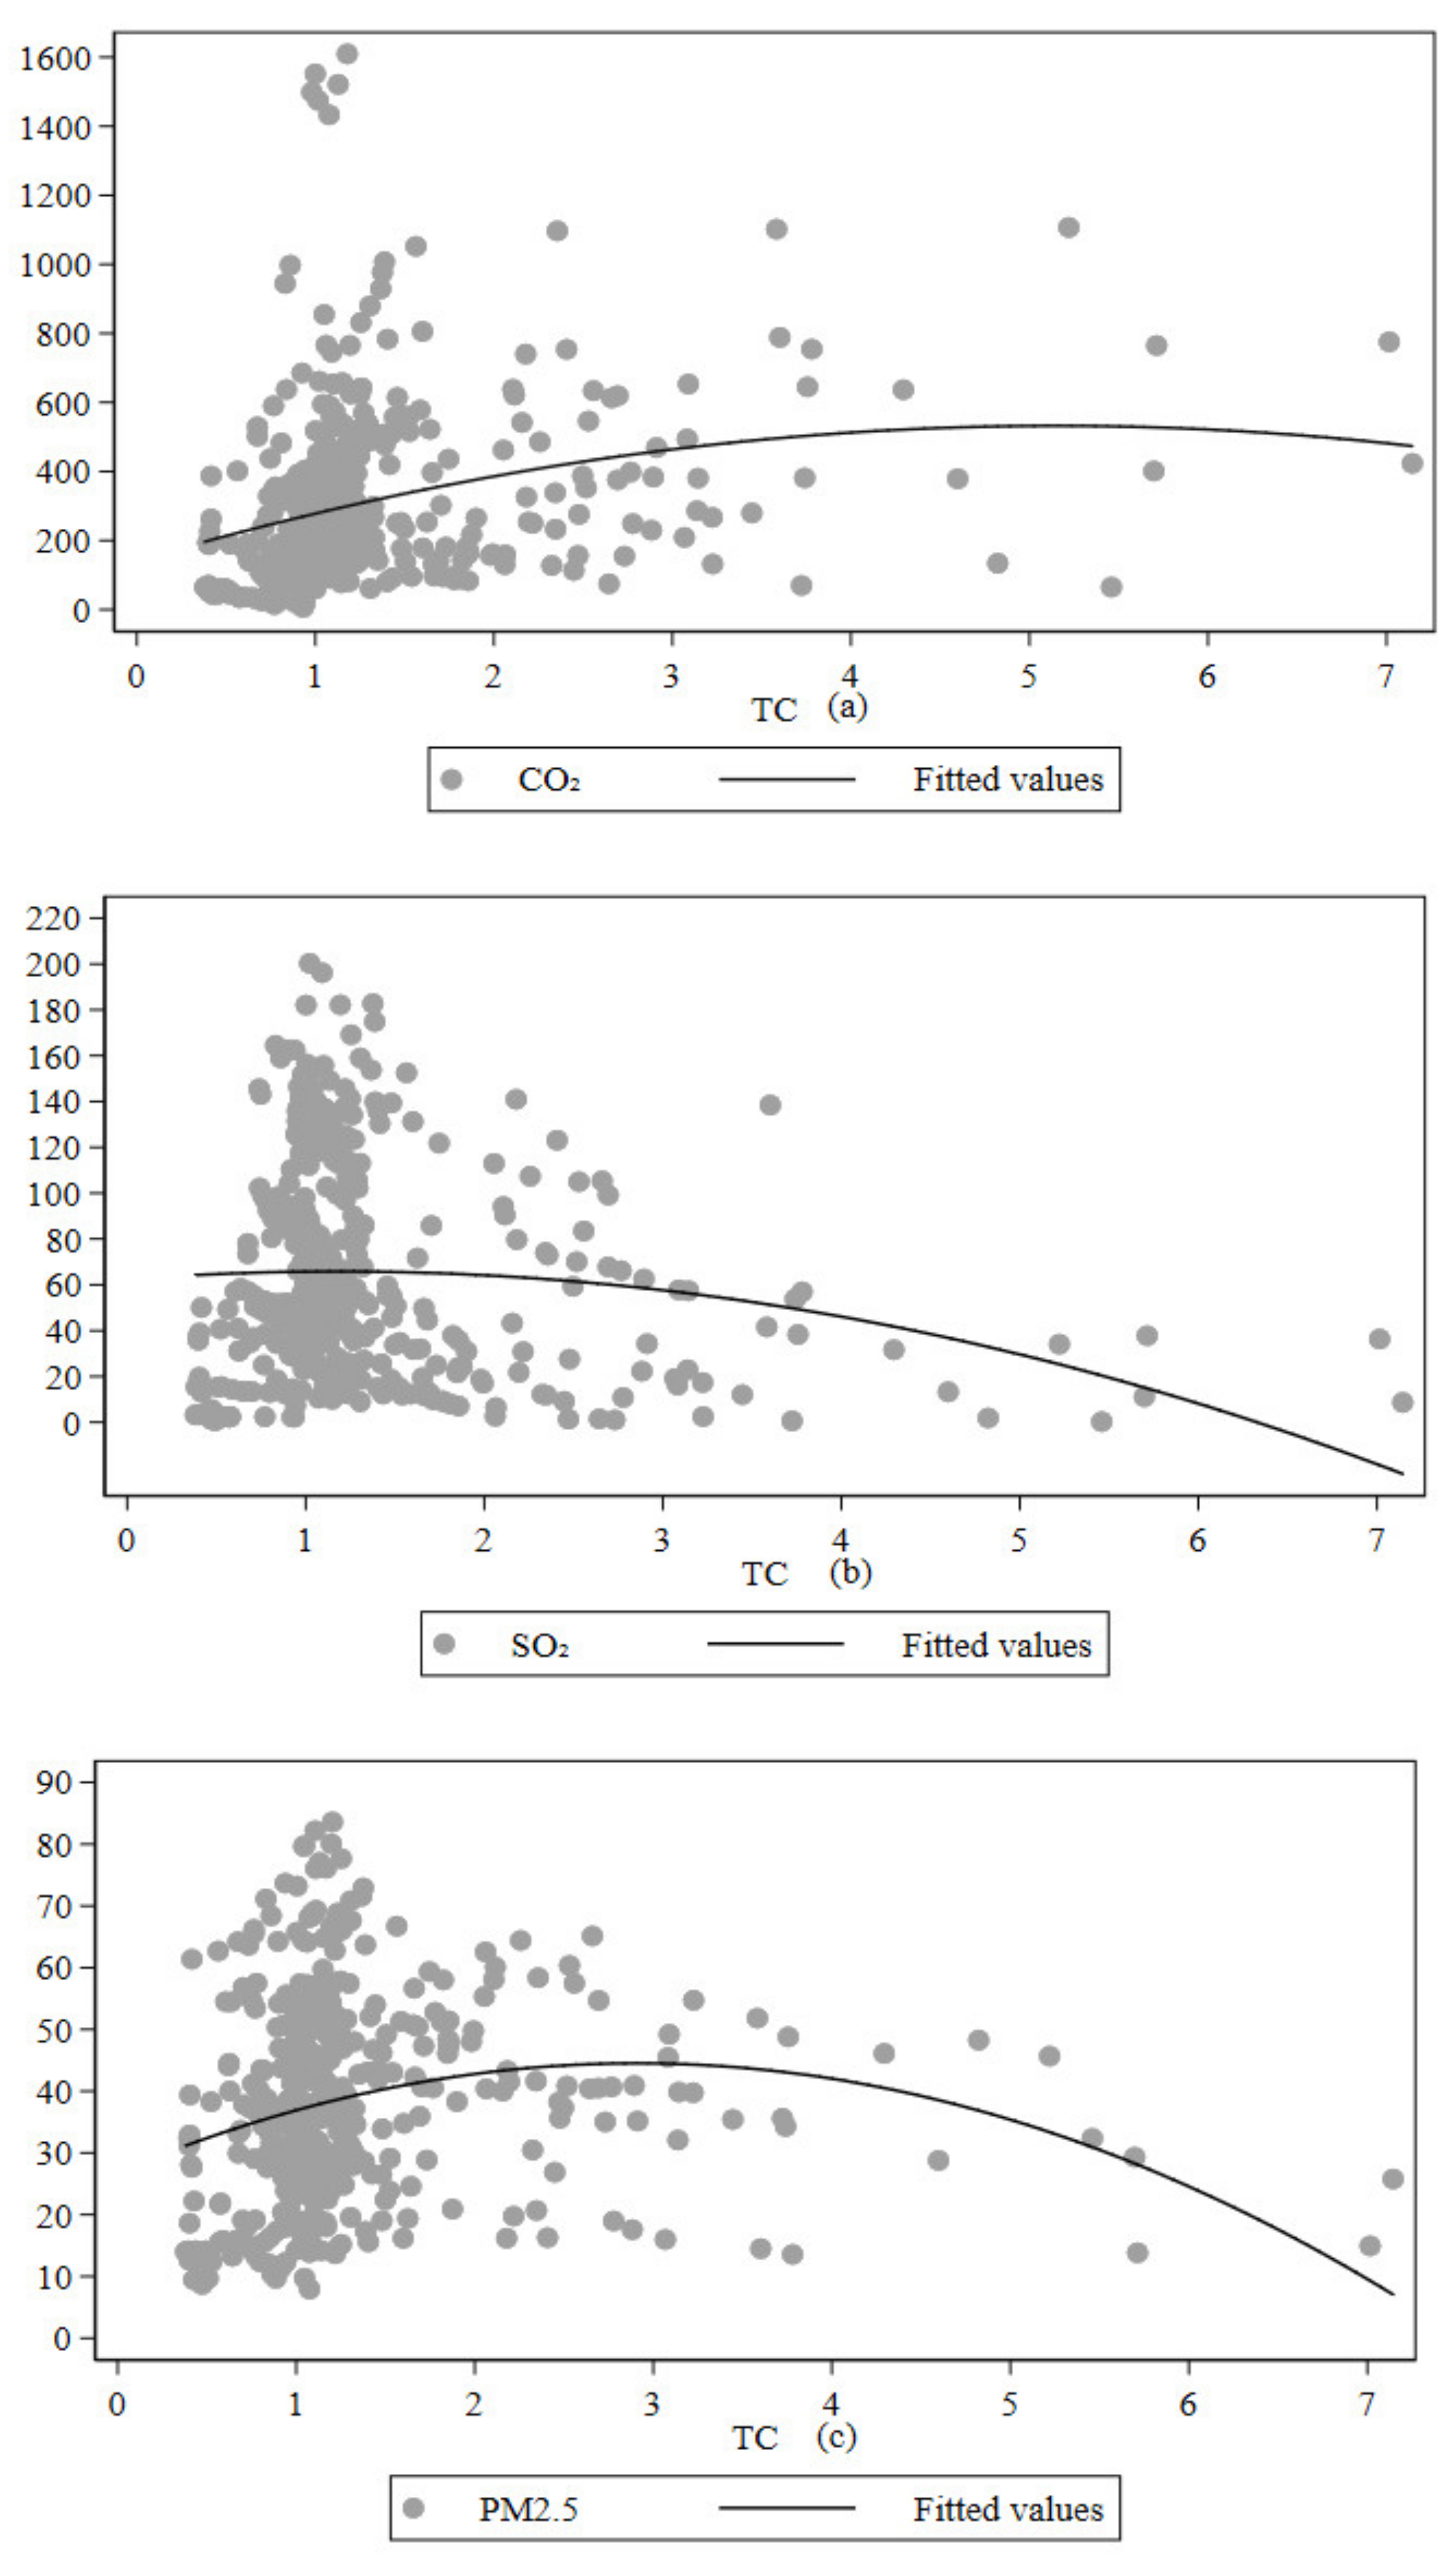
- There is a selection bias for pollutant emissions in China’s technological progress. CO2, PM2.5, and SO2 have an inverted U-shaped relationship with technological progress. As the level of technological progress increases, SO2 and PM2.5 emissions are significantly suppressed, and the level of technology breaks the inflection point of the inverted U-shape. As for CO2, the improvement in technology level has not yet played a significant role in reducing CO2 emissions, which indicates that there is a certain “carbon locking effect” and “energy rebound effect” in China’s technological progress, and also indicates that China has not yet shifted from its crude economic development model.
- (2)
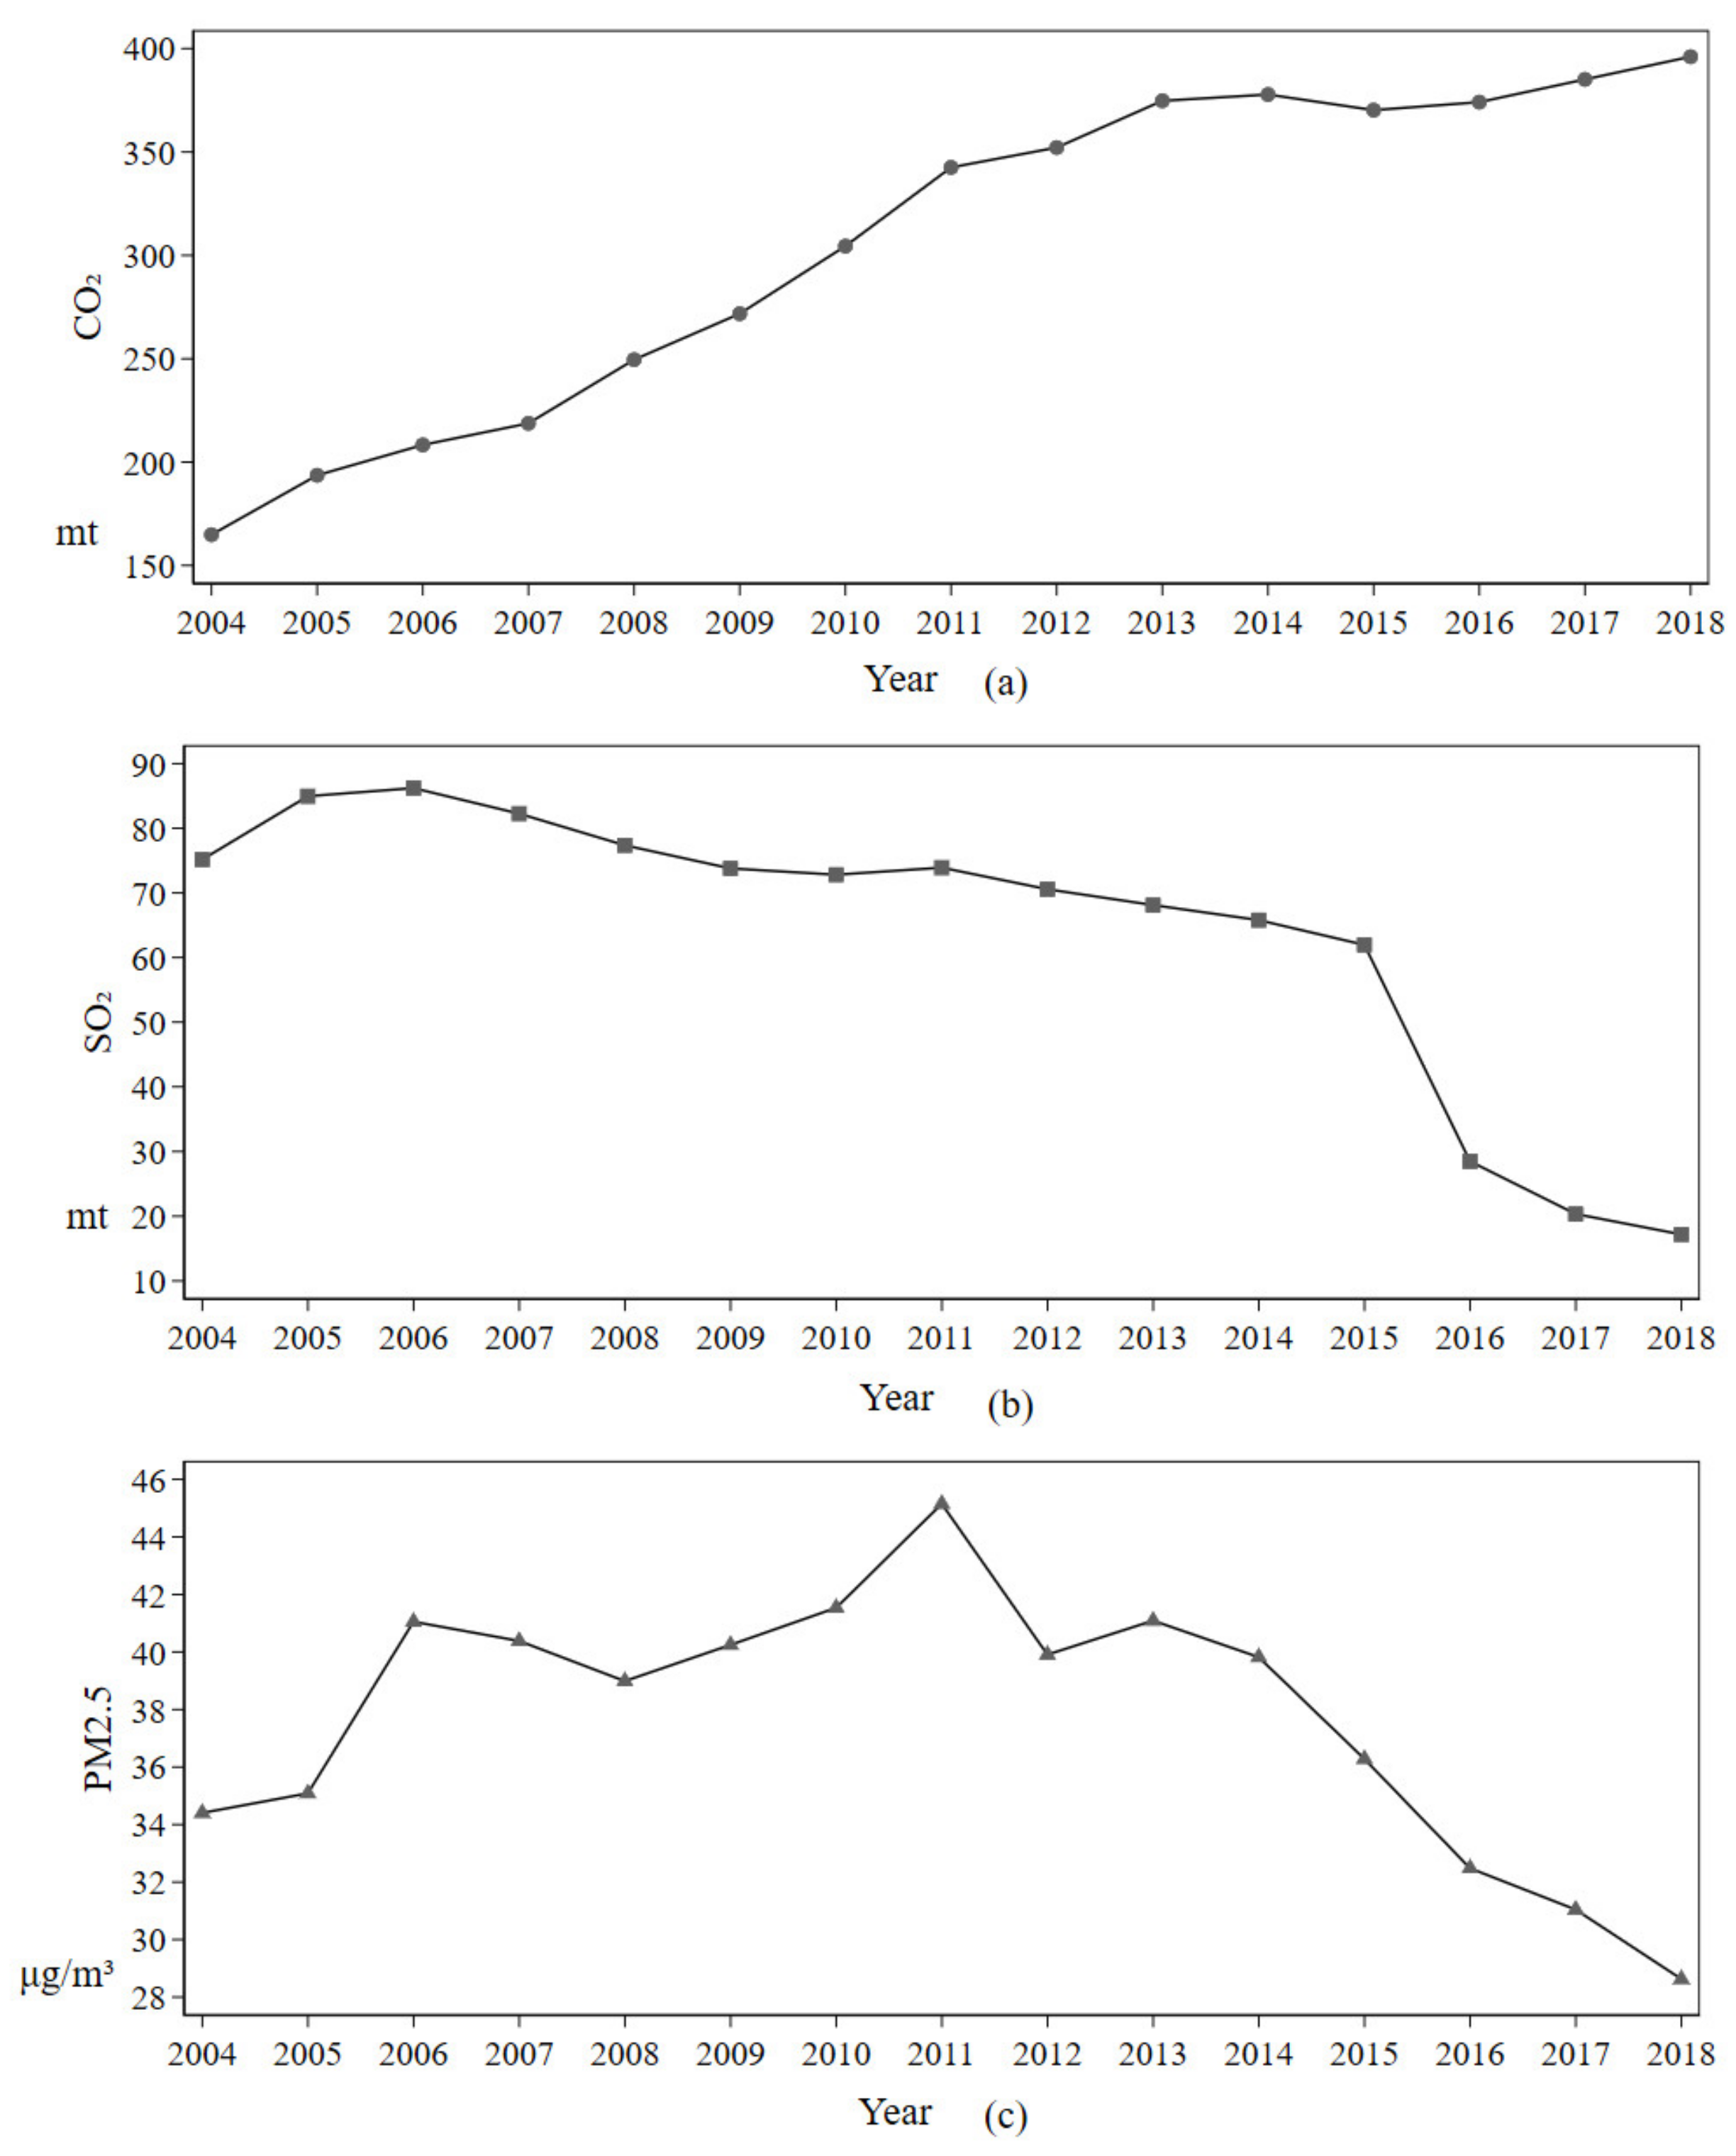
- From the perspective of the output-based technological progress bias factor, it can be seen that the output-based technological progress bias in CO2 output is steadily increasing, SO2 is decreasing, and PM2.5 is increasing and then decreasing. This is corroborated by the changes in pollutant concentrations. However, due to the vast geographical area of China, there are obvious differences in economic structure and technological level among different regions, and their output-based technological progress bias factors also differ. In general, the northeast, central, and western regions show the output bias of GDP < CO2 < PM2.5 < SO2, while the eastern region shows the output preference of PM2.5 < CO2 < SO2 < GDP. However, as time progresses, the output of both PM2.5 and SO2 shows a decreasing trend, while CO2 still shows an increasing trend, indicating that fossil combustion is still the main energy supply system in these regions, and there is a “carbon lock-in effect” in technological progress, and China’s emission treatment technologies for both PM2.5 and SO2 are more mature, achieving the emission of both pollutants. China’s emission treatment technology for PM2.5 and SO2 is more mature and has achieved the reduction of these two pollutants.
- (3)
- In terms of pollutant influencing factors, energy structure and industrial structure are positively related to pollutants, and its economic development is also positively related to CO2 and PM2.5, indicating that China’s technological progress has a carbon lock-in effect and economic development is still accompanied by environmental pollution, indicating that China has not ended the brutal economic development mode during the study period and is still in the process of economic transformation.
- (1)
- Strengthen government support to guide technological innovation. The government should fully support technological innovation and other behaviors in terms of policies, such as subsidies and tax incentives for R&D and application of clean technologies, to promote technological progress in each region to cross the inverted U-shaped inflection point in carbon emissions. At the same time, the government should actively guide research institutes and other research institutes to cooperate with enterprises to better transform and apply clean technologies.
- (2)
- Increase the proportion of new energy applications and eliminate the carbon lock-in effect. China’s economic model is still in transition from the pursuit of economic growth to high-quality development, and the pollution problems accompanying economic development have existed for a long time, with CO2 emissions being the primary target of all pollutants. The reduction of SO2 and PM2.5 pollution concentrations is attributed to the Chinese government controlling these two pollutants’ emissions and the technological progress of pollutant treatment processes. However, there are still pollutant outputs at the source of production. Moreover, from the results of this paper, there is a “carbon lock-in effect” in China’s economy. The coal-based energy consumption structure makes the emission of CO2 and other pollutants more serious, and increasing the proportion of new energy applications such as photovoltaic, wind power, and hydropower can effectively reduce the output of pollutants on the production side.
- (3)
- Promote the development of technology to be clean and green. China’s existing production system is based on fossil energy. Transitioning to clean, green development can effectively reduce the pollutant emissions in the production process, as can strengthening technology research and development, enhancing the learning effect of foreign investment, and taking other actions to help improve the level of technological progress.
- (4)
- Actively guide the technology exchange between regions and promote the transformation of industries to a low-pollution direction. The northeast, central, and western regions show an overall preference for pollutant emissions, which is due to the less developed production levels dominating these regions. Actively guiding these regions and the developed eastern regions in technology exchange and cooperation, breaking the technical barriers between regions, and promoting the transfer and diffusion of advanced clean production technologies from the eastern regions to these regions will help these regions to improve their technology levels. The government should promote the transformation of industries in a low-pollution direction and promote the transformation of regional industries in a green direction, facing the obvious differences in economic structure and technology level between the regions that exist. To promote the transformation of regions with underdeveloped production capacity and polluting industries to low-pollution production methods, the government should introduce policies including subsidies for the renewal of clean equipment so that regions with polluting industries can end the status of rough economic development.
Author Contributions
Funding
Institutional Review Board Statement
Informed Consent Statement
Data Availability Statement
Conflicts of Interest
References
- Chen, R.; Kan, H.; Chen, B.; Huang, W.; Bai, Z.; Song, G.; Pan, G. Association of particulate air pollution with daily mortality: The China Air Pollution and Health Effects Study. Am. J. Epidemiol. 2012, 175, 1173–1181. [Google Scholar] [CrossRef]
- Chan, C.K.; Yao, X. Air pollution in mega cities in China. Atmos. Environ. 2008, 42, 1–42. [Google Scholar] [CrossRef]
- Bank, W. Cost of Pollution in China; World Bank: Washington, DC, USA, 2007. [Google Scholar]
- Lelieveld, J.; Evans, J.S.; Fnais, M.; Giannadaki, D.; Pozzer, A. The contribution of outdoor air pollution sources to premature mortality on a global scale. Nature 2015, 525, 367–371. [Google Scholar] [CrossRef]
- Huang, Y.-T.; Chen, C.-C.; Ho, Y.-N.; Tsai, M.-T.; Tsai, C.-M.; Chuang, P.-C.; Cheng, F.-J. Short-term effects of particulate matter and its constituents on emergency room visits for chronic obstructive pulmonary disease: A time-stratified case-crossover study in an urban area. Int. J. Environ. Res. Public Health 2021, 18, 4400. [Google Scholar] [CrossRef] [PubMed]
- Ministry of Ecology and Environment the People’s Republic of China. Report on the State of the Ecology and Environment in China 2017; Ministry of Ecology and Environment the People’s Republic of China: Beijing, China, 2017.
- Wu, X.; Chen, Y.; Ji, G.; Wang, G.; Gong, Y. Spatial concentration, impact factors and prevention-control measures of PM2.5 pollution in China. Nat. Hazards 2017, 86, 393–410. [Google Scholar] [CrossRef]
- Briggs, D.; Abellan, J.J.; Fecht, D. Environmental inequity in England: Small area associations between socio-economic status and environmental pollution. Soc. Sci. Med. 2008, 67, 1612–1629. [Google Scholar] [CrossRef]
- Ajibade, F.O.; Adelodun, B.; Lasisi, K.H.; Fadare, O.O.; Ajibade, T.F.; Nwogwu, N.A.; Sulaymon, I.D.; Ugya, A.Y.; Wang, H.C.; Wang, A. Environmental pollution and their socioeconomic impacts. In Microbe Mediated Remediation of Environmental Contaminants; Woodhead Publishing: Sawston, UK, 2021; pp. 321–354. [Google Scholar]
- Liu, W.; Du, M.; Bai, Y. Mechanisms of environmental regulation’s impact on green technological progress—Evidence from China’s manufacturing sector. Sustainability 2021, 13, 1600. [Google Scholar] [CrossRef]
- Wang, S.; He, Y.; Song, M. Global value chains, technological progress, and environmental pollution: Inequality towards developing countries. J. Environ. Manag. 2020, 277, 110999. [Google Scholar] [CrossRef]
- Bin, L.I.; Zhao, X.H. Economic structure, technological progress and environmental pollution: Based on the analysis of industrial data in China. J. Financ. Econ. 2011, 37, 112–122. [Google Scholar]
- Zhao, Y.; Zhang, T.; Wu, T.; Xu, S.; Yang, S. Effects of technological progress from different sources on haze pollution in China. Sustainability 2021, 13, 2730. [Google Scholar] [CrossRef]
- Yi, M.; Wang, Y.; Sheng, M.; Sharp, B.; Zhang, Y. Effects of heterogeneous technological progress on haze pollution: Evidence from China. Ecol. Econ. 2020, 169, 106533. [Google Scholar] [CrossRef]
- Bell, M.L.; Davis, D.L.; Fletcher, T. A retrospective assessment of mortality from the london smog episode of 1952: The role of influenza and pollution. Environ. Health Perspect. 2004, 112, 6–8. [Google Scholar] [CrossRef] [Green Version]
- Mosley, S. Environmental History of Air Pollution and Protection; John Wiley & Sons, Ltd.: Hoboken, NJ, USA, 2014; pp. 914–919. [Google Scholar]
- Unruh, G.C. Escaping carbon lock-in. Energy Policy 2002, 30, 317–325. [Google Scholar] [CrossRef]
- Mattauch, L.; Creutzig, F.; Edenhofer, O. Avoiding carbon lock-in: Policy options for advancing structural change. Econ. Model. 2015, 50, 49–63. [Google Scholar] [CrossRef] [Green Version]
- Mi, L.Y.; Sun, Y.H.; Qiao, L.J.; Jia, T.W.; Yang, Y.; Lv, T. Analysis of the cause of household carbon lock-in for Chinese urban households. Int. J. Environ. Res. Public Health 2021, 18, 2201. [Google Scholar] [CrossRef] [PubMed]
- Seto, K.C.; Davis, S.J.; Mitchell, R.B.; Stokes, E.C.; Unruh, G.; Urge-Vorsatz, D. Carbon lock-in: Types, causes, and policy implications. In Annual Review of Environment and Resources; Gadgil, A., Gadgil, T.P., Eds.; Annual Reviews: Palo Alto, CA, USA, 2016; Volume 41, pp. 425–452. [Google Scholar]
- Wang, Z.H.; Lu, M.L.; Wang, J.C. Direct rebound effect on urban residential electricity use: An empirical study in China. Renew. Sustain. Energy Rev. 2014, 30, 124–132. [Google Scholar] [CrossRef]
- Liao, M.L.; Wang, Y.J. China’s energy consumption rebound effect analysis based on the perspective of technological progress. Sustainability 2019, 11, 1461. [Google Scholar] [CrossRef] [Green Version]
- Lin, B.Q.; Du, K.R. Measuring energy rebound effect in the Chinese economy: An economic accounting approach. Energy Econ. 2015, 50, 96–104. [Google Scholar] [CrossRef]
- Wang, Q.H.; Qu, J.S.; Wang, B.; Wang, P.L.; Yang, T.B. Green technology innovation development in China in 1990–2015. Sci. Total Environ. 2019, 696, 134008. [Google Scholar] [CrossRef]
- Zhu, S.; Song, M.L.; Lim, M.K.; Wang, J.L.; Zhao, J.J. The development of energy blockchain and its implications for China’s energy sector. Resour. Policy 2020, 66, 101595. [Google Scholar] [CrossRef]
- Vujanovic, M.; Wang, Q.W.; Mohsen, M.; Duic, N.; Yan, J.Y. Recent progress in sustainable energy-efficient technologies and environmental impacts on energy systems. Appl. Energy 2021, 283, 116280. [Google Scholar] [CrossRef]
- Cao, B.R.; Wang, S.H. Opening up, international trade, and green technology progress. J. Clean. Prod. 2017, 142, 1002–1012. [Google Scholar] [CrossRef]
- Chen, X.; Chen, Z.G. Can China’s environmental regulations effectively reduce pollution emissions? Int. J. Environ. Res. Public Health 2021, 18, 4658. [Google Scholar] [CrossRef] [PubMed]
- Du, J.T.; Sun, Y.H. The nonlinear impact of fiscal decentralization on carbon emissions: From the perspective of biased technological progress. Environ. Sci. Pollut. Res. 2021, 28, 29890–29899. [Google Scholar] [CrossRef]
- Kumar, S.; Managi, S. Sulfur dioxide allowances: Trading and technological progress. Ecol. Econ. 2010, 69, 623–631. [Google Scholar] [CrossRef]
- Cansino, J.M.; Roman-Collado, R.; Molina, J.C. Quality of Institutions, technological progress, and pollution havens in Latin America. An analysis of the environmental kuznets curve hypothesis. Sustainability 2019, 11, 3708. [Google Scholar] [CrossRef] [Green Version]
- Wang, X.L.; Sun, C.Z.; Wang, S.; Zhang, Z.X.; Zou, W. Going green or going away? A spatial empirical examination of the relationship between environmental regulations, biased technological progress, and green total factor productivity. Int. J. Environ. Res. Public Health 2018, 15, 1917. [Google Scholar] [CrossRef] [Green Version]
- Hao, Y.; Liu, Y.M. The influential factors of urban PM2.5 concentrations in China: A spatial econometric analysis. J. Clean. Prod. 2016, 112, 1443–1453. [Google Scholar] [CrossRef]
- Baiardi, D. Technological progress and the environmental kuznets curve in the twenty regions of italy. BE J. Econ. Anal. Policy 2014, 14, 1501–1542. [Google Scholar] [CrossRef]
- Chen, Y.; Lee, C.C. The impact of real estate investment on air quality: Evidence from China. Environ. Sci. Pollut. Res. 2020, 27, 22989–23001. [Google Scholar] [CrossRef] [PubMed]
- Tang, X.; Gao, X.; Li, C.L.; Zhou, Q.P.; Ren, C.; Feng, Z.B. Study on spatiotemporal distribution of airborne ozone pollution in subtropical region considering socioeconomic driving impacts: A case study in Guangzhou, China. Sustain. Cities Soc. 2020, 54, 101989. [Google Scholar] [CrossRef]
- Kang, Z.Y.; Li, K.; Qu, J.Y. The path of technological progress for China’s low-carbon development: Evidence from three urban agglomerations. J. Clean. Prod. 2018, 178, 644–654. [Google Scholar] [CrossRef]
- Jia, P.R.; Li, K.; Shao, S. Choice of technological change for China’s low-carbon development: Evidence from three urban agglomerations. J. Environ. Manag. 2018, 206, 1308–1319. [Google Scholar] [CrossRef]
- Song, M.L.; Wang, S.H. Can employment structure promote environment-biased technical progress? Technol. Forecast. Soc. Chang. 2016, 112, 285–292. [Google Scholar] [CrossRef]
- Song, M.L.; Wang, S.H. Measuring environment-biased technological progress considering energy saving and emission reduction. Process. Saf. Environ. Prot. 2018, 116, 745–753. [Google Scholar] [CrossRef]
- Li, J.; See, K.F.; Chi, J. Water resources and water pollution emissions in China’s industrial sector: A green-biased technological progress analysis. J. Clean. Prod. 2019, 229, 1412–1426. [Google Scholar] [CrossRef]
- Peng, J.C.; Xiao, J.Z.; Wen, L.; Zhang, L. Energy industry investment influences total factor productivity of energy exploitation: A biased technical change analysis. J. Clean. Prod. 2019, 237, 117847. [Google Scholar] [CrossRef]
- Hu, J.F.; Wang, Z.; Huang, Q.H. Factor allocation structure and green-biased technological progress in Chinese agriculture. Econ. Res.-Ekon. Istraz. 2021, 34, 2034–2058. [Google Scholar] [CrossRef]
- Yang, G.L.; Zha, D.L.; Zhang, C.Q.; Chen, Q. Does environment-biased technological progress reduce CO2 emissions in APEC economies? Evidence from fossil and clean energy consumption. Environ. Sci. Pollut. Res. 2020, 27, 20984–20999. [Google Scholar] [CrossRef]
- Lin, B.Q.; Chen, X. How technological progress affects input substitution and energy efficiency in China: A case of the non-ferrous metals industry. Energy 2020, 206, 118152. [Google Scholar] [CrossRef]
- Chen, P.C.; Yu, M.M. Total factor productivity growth and directions of technical change bias: Evidence from 99 OECD and non-OECD countries. Ann. Oper. Res. 2014, 214, 143–165. [Google Scholar] [CrossRef]
- Tone, K.; Tsutsui, M. Dynamic DEA: A slacks-based measure approach. Omega-Int. J. Manag. Sci. 2010, 38, 145–156. [Google Scholar] [CrossRef] [Green Version]
- Fare, R.; Grosskopf, S.; Margaritis, D. Productivity growth and convergence in the European Union. J. Product. Anal. 2006, 25, 111–141. [Google Scholar] [CrossRef]
- Fare, R.; GrifellTatje, E.; Grosskopf, S.; Lovell, C.A.K. Biased technical change and the Malmquist productivity index. Scand. J. Econ. 1997, 99, 119–127. [Google Scholar] [CrossRef]
- Weber, W.L.; Domazlicky, B.R. Total factor productivity growth in manufacturing: A regional approach using linear programming. Reg. Sci. Urban. Econ. 1999, 29, 105–122. [Google Scholar] [CrossRef]
- Yoon, H.; Heshmati, A. Do environmental regulations affect FDI decisions? The pollution haven hypothesis revisited. Sci. Public Policy 2021, 48, 122–131. [Google Scholar] [CrossRef]
- Wang, D.T.; Chen, W.Y. Foreign direct investment, institutional development, and environmental externalities: Evidence from China. J. Environ. Manag. 2014, 135, 81–90. [Google Scholar] [CrossRef] [Green Version]
- Demena, B.A.; Afesorgbor, S.K. The effect of FDI on environmental emissions: Evidence from a meta-analysis. Energy Policy 2020, 138, 111192. [Google Scholar] [CrossRef]


| Output Mix | |||
| Promote desirable output | Neutral | Increase undesirable output | |
| Increase undesirable output | Neutral | Promote desirable output |
| Variable | Description of Variable | Unit | Average | Max | Min | SD | |
|---|---|---|---|---|---|---|---|
| Inputs and outputs | L | Labor | Ten thousand-person | 490.136 | 1994.140 | 42.520 | 337.815 |
| K | Capital | 100 million yuan | 32,478.120 | 183,575.000 | 962.342 | 31,507.960 | |
| E | Energy Consumption | Ten thousand tons | 12,764.150 | 40,581.000 | 742.000 | 8231.907 | |
| GDP | Gross Domestic Product | 100 million yuan | 12,464.540 | 69,174.320 | 430.179 | 11,508.100 | |
| CO2 | Carbon Dioxide Emission | Ten thousand tons | 305.615 | 1609.710 | 7.550 | 253.756 | |
| SO2 | Sulfur Dioxide Emission | Ten thousand tons | 63.933 | 200.300 | 0.267 | 45.028 | |
| PM2.5 | Particulate Matter | Micrograms per cubic meter | 37.741 | 83.608 | 7.953 | 16.329 | |
| Influencing Factors | ES | Energy Structure | 0.4398043 | 0.440 | 0.778 | 0.016 | |
| IS | Industrial Structure | 44.10384 | 44.104 | 62.000 | 16.500 | ||
| HC | Human Capital | 9.362649 | 9.363 | 13.617 | 6.429 | ||
| FDI | Foreign Direct Investment | 0.0250811 | 0.025 | 0.121 | 0.000 | ||
| EL | Economic Level | 28,119.75 | 28,119.750 | 110,580.300 | 4081.554 | ||
| Area | TFP | EC | TC | OBTC | IBTC | MATC | BTC | |||||||
|---|---|---|---|---|---|---|---|---|---|---|---|---|---|---|
| Value | S.D | Value | S.D | Value | S.D | Value | S.D | Value | S.D | Value | S.D | Value | S.D | |
| China | 1.032 | 0.044 | 1.000 | 0.000 | 1.032 | 0.044 | 0.998 | 0.056 | 1.022 | 0.058 | 1.016 | 0.073 | 1.018 | 0.033 |
| Beijing | 1.130 | 0.165 | 1.000 | 0.000 | 1.130 | 0.165 | 1.042 | 0.092 | 1.010 | 0.046 | 1.074 | 0.116 | 1.055 | 0.123 |
| Tianjin | 1.149 | 0.354 | 1.039 | 0.329 | 1.127 | 0.218 | 1.094 | 0.192 | 1.003 | 0.004 | 1.026 | 0.040 | 1.096 | 0.194 |
| Hebei | 1.093 | 0.286 | 1.003 | 0.132 | 1.082 | 0.147 | 0.998 | 0.035 | 1.036 | 0.138 | 1.049 | 0.092 | 1.030 | 0.090 |
| Shanxi | 1.015 | 0.082 | 1.003 | 0.074 | 1.012 | 0.034 | 1.002 | 0.003 | 1.001 | 0.001 | 1.009 | 0.033 | 1.003 | 0.003 |
| Inner Mongolia | 1.257 | 0.323 | 1.170 | 0.583 | 1.213 | 0.391 | 1.019 | 0.271 | 0.974 | 0.055 | 1.316 | 0.613 | 0.994 | 0.283 |
| Liaoning | 1.032 | 0.071 | 0.997 | 0.053 | 1.035 | 0.061 | 1.003 | 0.004 | 1.001 | 0.001 | 1.031 | 0.060 | 1.004 | 0.004 |
| Jilin | 1.020 | 0.062 | 1.004 | 0.078 | 1.019 | 0.053 | 0.999 | 0.016 | 1.002 | 0.001 | 1.018 | 0.053 | 1.002 | 0.016 |
| Heilongjiang | 1.045 | 0.350 | 1.032 | 0.320 | 1.020 | 0.152 | 0.974 | 0.099 | 1.012 | 0.023 | 1.049 | 0.217 | 0.985 | 0.103 |
| Shanghai | 1.071 | 0.071 | 1.000 | 0.000 | 1.071 | 0.071 | 0.954 | 0.056 | 1.019 | 0.045 | 1.111 | 0.137 | 0.971 | 0.054 |
| Jiangsu | 1.135 | 0.141 | 1.026 | 0.101 | 1.109 | 0.120 | 0.919 | 0.045 | 0.992 | 0.036 | 1.226 | 0.186 | 0.911 | 0.061 |
| Zhejiang | 1.147 | 0.139 | 1.008 | 0.132 | 1.148 | 0.135 | 1.003 | 0.103 | 0.997 | 0.037 | 1.159 | 0.173 | 0.998 | 0.088 |
| Anhui | 1.092 | 0.258 | 1.025 | 0.288 | 1.126 | 0.338 | 0.973 | 0.135 | 1.039 | 0.146 | 1.161 | 0.427 | 1.001 | 0.130 |
| Fujian | 1.078 | 0.129 | 1.007 | 0.134 | 1.076 | 0.114 | 0.953 | 0.062 | 0.994 | 0.030 | 1.148 | 0.204 | 0.948 | 0.076 |
| Jiangxi | 1.037 | 0.045 | 1.000 | 0.040 | 1.038 | 0.038 | 1.004 | 0.006 | 1.002 | 0.005 | 1.032 | 0.035 | 1.006 | 0.004 |
| Shandong | 1.159 | 0.263 | 1.037 | 0.234 | 1.152 | 0.298 | 1.015 | 0.087 | 1.049 | 0.120 | 1.098 | 0.304 | 1.061 | 0.124 |
| Henan | 0.992 | 0.154 | 0.957 | 0.120 | 1.033 | 0.058 | 1.001 | 0.014 | 1.006 | 0.016 | 1.026 | 0.059 | 1.007 | 0.020 |
| Hubei | 1.164 | 0.270 | 1.066 | 0.225 | 1.095 | 0.161 | 1.033 | 0.105 | 1.011 | 0.032 | 1.047 | 0.063 | 1.043 | 0.095 |
| Hunan | 1.138 | 0.224 | 1.049 | 0.182 | 1.088 | 0.144 | 0.948 | 0.087 | 1.001 | 0.029 | 1.177 | 0.311 | 0.950 | 0.104 |
| Guangdong | 1.029 | 0.031 | 1.000 | 0.000 | 1.029 | 0.031 | 0.989 | 0.039 | 1.037 | 0.048 | 1.006 | 0.052 | 1.024 | 0.031 |
| Guangxi | 0.966 | 0.143 | 0.951 | 0.100 | 1.012 | 0.079 | 1.004 | 0.016 | 1.020 | 0.072 | 0.995 | 0.111 | 1.024 | 0.072 |
| Hainan | 0.960 | 0.113 | 1.000 | 0.000 | 0.960 | 0.113 | 1.135 | 0.096 | 1.023 | 0.030 | 0.835 | 0.120 | 1.159 | 0.091 |
| Chungking | 1.123 | 0.224 | 1.052 | 0.177 | 1.068 | 0.128 | 1.015 | 0.110 | 1.023 | 0.077 | 1.031 | 0.047 | 1.033 | 0.083 |
| Sichuan | 1.150 | 0.208 | 1.060 | 0.143 | 1.087 | 0.148 | 1.050 | 0.099 | 1.007 | 0.023 | 1.027 | 0.086 | 1.057 | 0.099 |
| Guizhou | 1.018 | 0.039 | 1.015 | 0.037 | 1.003 | 0.039 | 1.002 | 0.004 | 1.002 | 0.001 | 0.999 | 0.036 | 1.004 | 0.004 |
| Yunnan | 1.000 | 0.212 | 0.997 | 0.244 | 1.025 | 0.144 | 0.976 | 0.063 | 1.027 | 0.069 | 1.033 | 0.194 | 0.999 | 0.048 |
| Shaanxi | 0.967 | 0.134 | 0.970 | 0.113 | 0.998 | 0.079 | 1.034 | 0.097 | 0.978 | 0.068 | 0.991 | 0.050 | 1.006 | 0.048 |
| Gansu | 1.007 | 0.037 | 0.995 | 0.041 | 1.013 | 0.037 | 1.003 | 0.003 | 1.002 | 0.001 | 1.008 | 0.036 | 1.004 | 0.003 |
| Qinghai | 0.952 | 0.079 | 1.000 | 0.000 | 0.952 | 0.079 | 1.107 | 0.061 | 1.017 | 0.037 | 0.846 | 0.056 | 1.124 | 0.055 |
| Ningxia | 1.009 | 0.202 | 1.064 | 0.179 | 0.946 | 0.070 | 0.972 | 0.099 | 1.032 | 0.115 | 0.951 | 0.034 | 0.994 | 0.058 |
| Sinkiang | 0.997 | 0.068 | 0.993 | 0.060 | 1.004 | 0.033 | 1.003 | 0.005 | 1.001 | 0.001 | 0.999 | 0.032 | 1.005 | 0.005 |
| Total | 1.063 | 0.194 | 1.017 | 0.181 | 1.055 | 0.157 | 1.007 | 0.099 | 1.011 | 0.060 | 1.048 | 0.202 | 1.017 | 0.102 |
| Year | TFP | EC | TC | OBTC | IBTC | MATC | BTC |
|---|---|---|---|---|---|---|---|
| 2004 | 1.028 | 1.044 | 0.982 | 1.005 | 1.016 | 0.970 | 1.020 |
| 2005 | 0.968 | 0.954 | 1.015 | 1.018 | 1.020 | 0.990 | 1.035 |
| 2006 | 0.992 | 0.972 | 1.022 | 1.018 | 1.000 | 1.009 | 1.018 |
| 2007 | 1.080 | 1.084 | 1.018 | 1.005 | 1.003 | 1.019 | 1.009 |
| 2008 | 1.041 | 1.009 | 1.032 | 1.001 | 1.005 | 1.028 | 1.006 |
| 2009 | 0.989 | 0.936 | 1.078 | 0.996 | 1.001 | 1.092 | 0.996 |
| 2010 | 1.044 | 1.021 | 1.023 | 1.005 | 1.002 | 1.019 | 1.006 |
| 2011 | 1.001 | 1.008 | 0.995 | 1.044 | 0.992 | 0.971 | 1.034 |
| 2012 | 1.026 | 0.988 | 1.039 | 1.029 | 1.005 | 1.004 | 1.034 |
| 2013 | 0.959 | 1.146 | 0.868 | 0.983 | 1.026 | 0.869 | 1.006 |
| 2014 | 1.077 | 1.021 | 1.057 | 0.990 | 1.001 | 1.076 | 0.990 |
| 2015 | 1.120 | 1.002 | 1.132 | 0.973 | 1.020 | 1.168 | 0.993 |
| 2016 | 1.180 | 0.974 | 1.218 | 1.034 | 1.033 | 1.173 | 1.067 |
| 2017 | 1.240 | 1.030 | 1.200 | 1.003 | 1.028 | 1.192 | 1.029 |
| 2018 | 1.218 | 1.071 | 1.157 | 1.006 | 1.006 | 1.158 | 1.007 |
| Total | 1.064 | 1.017 | 1.056 | 1.007 | 1.011 | 1.049 | 1.017 |
| Year | CO2 vs. GDP | CO2 vs. SO2 | CO2 vs. PM2.5 | SO2 vs. PM2.5 | ||||
|---|---|---|---|---|---|---|---|---|
| CO2 | GDP | CO2 | SO2 | CO2 | PM2.5 | SO2 | PM2.5 | |
| 2004 | 9 | 20 | 14 | 15 | 12 | 17 | 12 | 17 |
| 2005 | 12 | 9 | 10 | 11 | 10 | 11 | 8 | 13 |
| 2006 | 21 | 9 | 6 | 24 | 16 | 14 | 20 | 10 |
| 2007 | 22 | 8 | 10 | 20 | 15 | 15 | 18 | 12 |
| 2008 | 15 | 15 | 7 | 23 | 10 | 20 | 16 | 14 |
| 2009 | 18 | 11 | 10 | 19 | 8 | 21 | 15 | 14 |
| 2010 | 18 | 10 | 7 | 21 | 10 | 18 | 18 | 10 |
| 2011 | 15 | 13 | 7 | 21 | 13 | 15 | 17 | 11 |
| 2012 | 18 | 9 | 7 | 20 | 8 | 19 | 10 | 17 |
| 2013 | 13 | 15 | 18 | 10 | 23 | 5 | 20 | 8 |
| 2014 | 15 | 13 | 13 | 15 | 11 | 17 | 12 | 16 |
| 2015 | 11 | 13 | 12 | 12 | 8 | 16 | 5 | 19 |
| 2016 | 15 | 15 | 10 | 20 | 11 | 19 | 20 | 10 |
| 2017 | 20 | 9 | 13 | 16 | 13 | 16 | 15 | 14 |
| 2018 | 19 | 11 | 12 | 18 | 17 | 13 | 16 | 14 |
| LnCO2 | LnSO2 | LnPM2.5 | |
|---|---|---|---|
| InTC | 1.774 *** | 4.047 *** | 0.981 *** |
| (−0.633) | (−0.652) | (−0.299) | |
| (LnTC)2 | −0.660 ** | −1.873 *** | −0.466 *** |
| (−0.289) | (−0.298) | (−0.137) | |
| LnES | 3.429 *** | 3.731 *** | 1.829 *** |
| (−0.514) | (−0.53) | (−0.243) | |
| LnIS | 1.501 *** | 1.848 *** | 0.281 *** |
| (−0.218) | (−0.224) | (−0.103) | |
| LnHC | 1.045 | −0.935 | 0.504 |
| (−0.649) | (−0.669) | (−0.307) | |
| LnFDI | −11.78 *** | −5.114 ** | 5.331 *** |
| (−2.057) | (−2.119) | (−0.971) | |
| LnEL | 0.678 *** | 0.0918 | 0.222 *** |
| (−0.15) | (−0.154) | (−0.0706) | |
| _cons | −11.30 *** | −4.917 *** | −2.147 *** |
| (−1.285) | (−1.324) | (−0.607) |
Publisher’s Note: MDPI stays neutral with regard to jurisdictional claims in published maps and institutional affiliations. |
© 2021 by the authors. Licensee MDPI, Basel, Switzerland. This article is an open access article distributed under the terms and conditions of the Creative Commons Attribution (CC BY) license (https://creativecommons.org/licenses/by/4.0/).
Share and Cite
Liu, W.; Du, M. Is Technological Progress Selective for Multiple Pollutant Emissions? Int. J. Environ. Res. Public Health 2021, 18, 9286. https://doi.org/10.3390/ijerph18179286
Liu W, Du M. Is Technological Progress Selective for Multiple Pollutant Emissions? International Journal of Environmental Research and Public Health. 2021; 18(17):9286. https://doi.org/10.3390/ijerph18179286
Chicago/Turabian StyleLiu, Weijiang, and Mingze Du. 2021. "Is Technological Progress Selective for Multiple Pollutant Emissions?" International Journal of Environmental Research and Public Health 18, no. 17: 9286. https://doi.org/10.3390/ijerph18179286
APA StyleLiu, W., & Du, M. (2021). Is Technological Progress Selective for Multiple Pollutant Emissions? International Journal of Environmental Research and Public Health, 18(17), 9286. https://doi.org/10.3390/ijerph18179286