Abstract
The present study uses the analysis of the EU’s regional performance structure based on clusters to test the versatility of the regional administrative capacity in relation to three disruptive global phenomena: the economic crisis, the coronavirus epidemic and the phenomenon of refugee migration to Europe. We defined a regional performance model based on maintaining sustainability indicators in the 240 EU regions. The objectives of the study are aimed primarily at a structured assessment of regional administrative capacity in the initial version, based on statistical indicators, and in the current version, after the outbreak of the pandemic, based on quantifying the impact of the disturbing factors. Secondly, the objectives of the study are to evaluate the reaction of the administrative units according to their ability to respond to the economic problems in the region, in the sense of improving the performance of the regional economies. The methods used in this paper will be empirical (the study of the specialized literature), analytical and will contain econometric modelling and statistical processing of the data. The results of the study will allow the identification of the necessary traits to train a leader in regional performance, traits that will be useful to European decision makers in adjusting the EU regional policy. Moreover, the need to redefine the EU in terms of performance will be substantiated once again. The study is current and is based on the latest Eurostat information, pertinent tables and diagrams.
1. General Approach
The current context is an atypical one, in which disturbing factors are manifested both from the social and economic point of view. From the social point of view, regional development is directly influenced by the spread of the new virus (COVID-19), whose effects have manifested in all EU Member States. To this end, we have built a statistical database for the period 2006–2002, using Eurostat information [1].
From the regional point of view, the evolution in the most-affected Member States reflects that the regional character is typical of this disturbing phenomenon. Additionally, the regional specificity of the spread of the disease is manifested in Romania.
Overall, it is noted that three EU-representative economies are placed in the top 12 worldwide in terms of total COVID cases’ impact in September 2021: France (6th place), Spain (11th place) and Italy (12th place). The UK has left the EU, but is ranked 4th overall. All European countries are currently facing social and economic crises amid dissent over anti-counterfeiting protective measures [2].
From the economic point of view, the direct impact estimated by the national statistical systems at the level of the four above analysed countries consists of a decrease in GDP.
In this context, the population from the other EU Member States established in areas strongly affected by COVID-19, such as France, Italy or Germany, had the possibility to return massively to their countries of origin, favouring the spread of the virus and generating social problems and economic difficulties for their country of origin. In addition to the restriction of the health system and the increasing need for equipment, medicines and medical staff compared to the planned need, this phenomenon had to provide measures to quarantine the population that returned to the country, as well as to ensure the social protection of the population that lost their places of work during the pandemic. This migration phenomenon is strictly induced by the global pandemic, but Europe is also facing another migration phenomenon of the African, Arab and East Asian populations, which raises issues for European forums regarding ensuring social protection and integrating migrants into a system already incapacitated by the outbreak of the pandemic. The traffic restrictions imposed as a measure to control of the spread of the virus reduced the EU’s economic activity and generated financial blockages of those companies which were virtually taken into account when forecasting the budgets of the EU Member States.
These three aggravating factors (pandemic, migration under different aspects and overstretching of economic activity) are significant premises for estimating a serious economic crisis, which will affect global society.
In this context, we aim to develop a regional performance model in the sense of the regional administrative capacity’s versatility in relation to these aforementioned phenomena.
The novelty of the present scientific approach lies in identifying and managing a regional leader in terms of socio-economic performance. Moreover, our approach achieves a unified vision of EU regional policy, by standardizing and building on the literature on the subject. Another new element is the emphasis on the need to redefine the EU in performance-related terms.
The paper proceeds as follows. Section 2, Literature Review, discusses relevant models for the topic. It is followed by Section 3, Data and Methodology, in which we highlight the NUTS 2 regional efficiency indicators able to evaluate on a 5-step scale the administrative efficiency data, models and results. This is followed by an analysis of the results in Section 4. An overview in Section 5 and Section 6 discusses the results and concludes the paper.
2. Literature Review
Since December 2019, global society has been facing unfavourable conditions regarding economic growth against the background of the COVID-19 pandemic and the necessary global measures to limit the spread of the pandemic.
Although up to this date, the global economy was on an upward slope with normal fluctuations induced by business cycles, the effect of the pandemic downturn has been to freeze the upward slope, as global society is currently facing a significant economic downturn, in the form of short-circuiting the traditional mechanisms of financial, social and security balance of the global market. The factor perpetuating the effects of the pandemic is population migration, which, in this case, contributed to the amplification of the pandemic’s effects, generating the multiplication of COVID-19 outbreaks in multiple global regions, from the initial Wuhan centre to Europe, via Italy and America, where the most disastrous effects of the pandemic are currently manifesting.
Faced with the economic downturn, the states of the world have been confronted with an atypical situation against which the traditional models developed by specialists over time and the efforts of sustainable economic growth are annihilated, both in terms of their effects and the expected economic results. In this context, there is a need for a new approach to address the vulnerabilities of classical theories due to the disregard of the exaggerated values of the pandemic, the social and economic risk of disturbing factors which can act on the global economy at a given time. The effect of this action constitutes the global economic crisis itself.
In this gear, several factors related to the specificities of the global economy, namely transactions in financial markets, the role of single currencies, the mechanism of global financing and the interconnection between national economies through multinational companies, are introduced.
From the regional point of view, there is a direct induced reflection of the global economic crisis on regional autonomy by destabilizing the financial equilibrium levers that highlight the difficulty of the regional territorial administrative units and which weaken the effects of the social protection and the sustainable development programs that they had in the usual course.
A summary of the previous research on the effects of the disturbing factors on economic growth, as well as the expiration of the previous models through the effect of disturbing factors, is presented in Table 1.

Table 1.
Literature review.
The analysis of the specialized literature on all the major disturbing aspects that are the subject of the present study supports the opportunity to draw up in the current context a new integrated model for analysing the regional performance of the administrative capacity through the indicators with an essential impact on the disturbance.
3. Data and Methodology
In order to achieve the major objective of the research, namely the analysis of regional performance according to the versatility of administrative capacity in relation to disturbing factors (the COVID-19 crisis, the induced economic crisis and the migration from Europe manifested in recent years), we proceeded to interrogate the Eurostat database in order to obtain a series of data on NUTS 2 regional efficiency indicators, such as:
- I1.
- Investment share of GDP by institutional sectors, predicted as % of GDP total investment, Eurostat code: 0sdg_08_11
- I2.
- Early leavers from education and training by sex, predicted as % of population aged 18 to 24, Eurostat code: 0sdg_04_10
- I3.
- Gross domestic expenditure on R&D by sector, predicted as % of GDP, Eurostat code: 0sdg_09_10
- I4.
- Employment in high- and medium-high-technology manufacturing and knowledge-intensive services, predicted as % of total employment, Eurostat code: 0sdg_09_20
- I5.
- People at risk of poverty or social exclusion, predicted as percentage, Eurostat code: 0sdg_01_10
- I6.
- People at risk of income poverty after social transfers, predicted as percentage, Eurostat code: 0sdg_01_20
- I7.
- People living in households with very low work intensity, predicted as percentage of total population aged less than 60, Eurostat code: 0sdg_01_40
- I8.
- Share of renewable energy in gross final energy consumption by sector, predicted as % Renewable energy sources, Eurostat code: 0sdg_07_40
- I9.
- Real GDP per capita, predicted as chain-linked volumes (2010), EUR per capita, Eurostat code: 0sdg_08_10 GDP
- I10.
- Long-term unemployment rate by sex, predicted as % of active population, Eurostat code: 0sdg_08_40
- I11.
- R&D personnel by sector, predicted as % of active population, Eurostat code: 0sdg_09_30
- I12.
- Patent applications to the European Patent Office (source: EPO), predicted as number, Eurostat code: 0sdg_09_40
- I13.
- Employment rates of recent graduates by sex, predicted as % of population aged 20 to 34 with at least upper secondary education, Eurostat code: 0sdg_04_50
- I14.
- Energy import dependency by products, predicted as % of imports in total energy consumption, Eurostat code: 0sdg_07_50
These indicators have been selected from specific statistical indicators used by Eurostat in its sustainability analysis (https://ec.europa.eu/eurostat/web/sdi/indicators (accessed on 2 March 2021)). The selection of indicators was based on the relevance of the data to the topic under analysis.
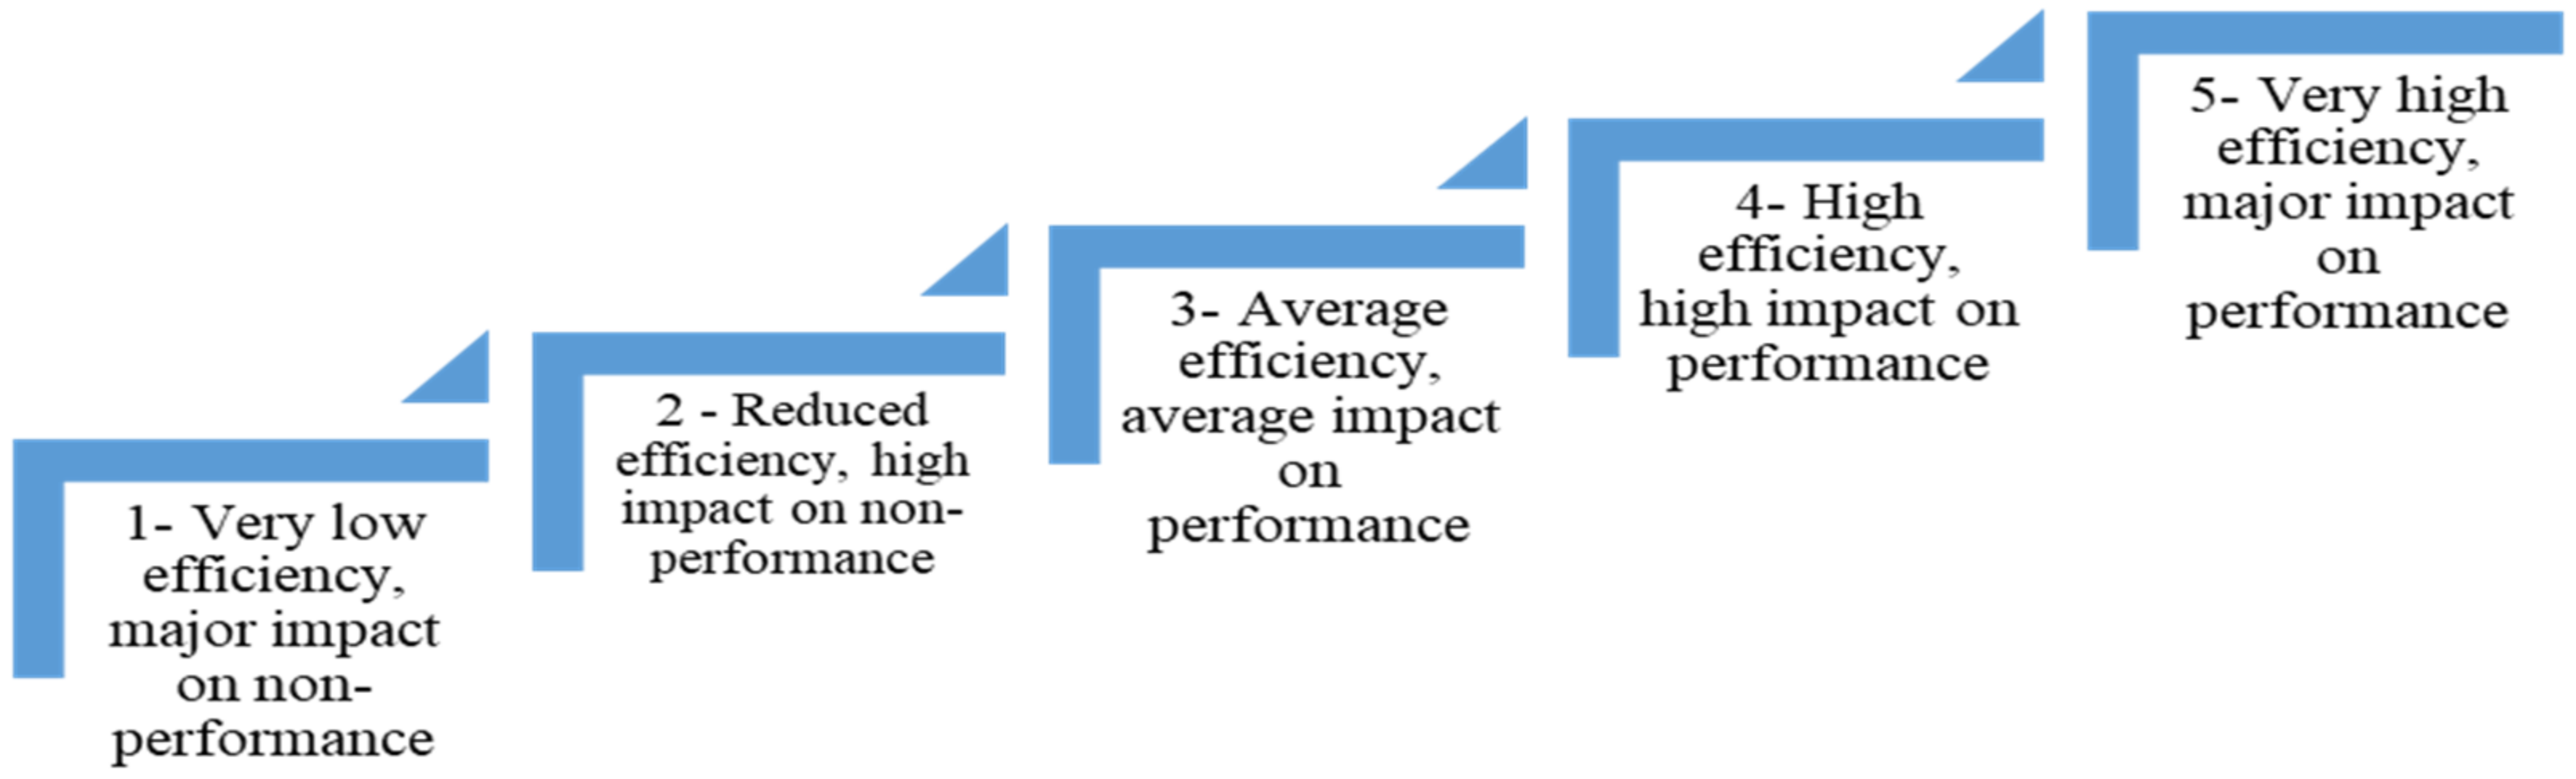
For the assessment of the initial regional administrative capacity (before manifesting the disturbing factors potentiated by the COVID-19 epidemic), the authors proceeded to evaluate on a 5-step scale the administrative efficiency. The scale was adjusted to the values reported by Eurostat for the aforementioned indicators and allowed by using the mean, the median and the module to classify each NUTS 2 region for the 14 indicators on one of the 5 steps of the scale, as defined in Figure 1.
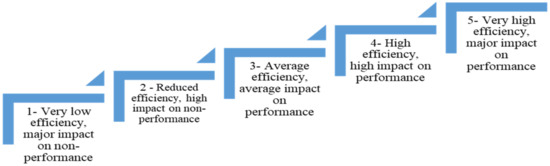
Figure 1.
The 5-step scale for administrative efficiency.
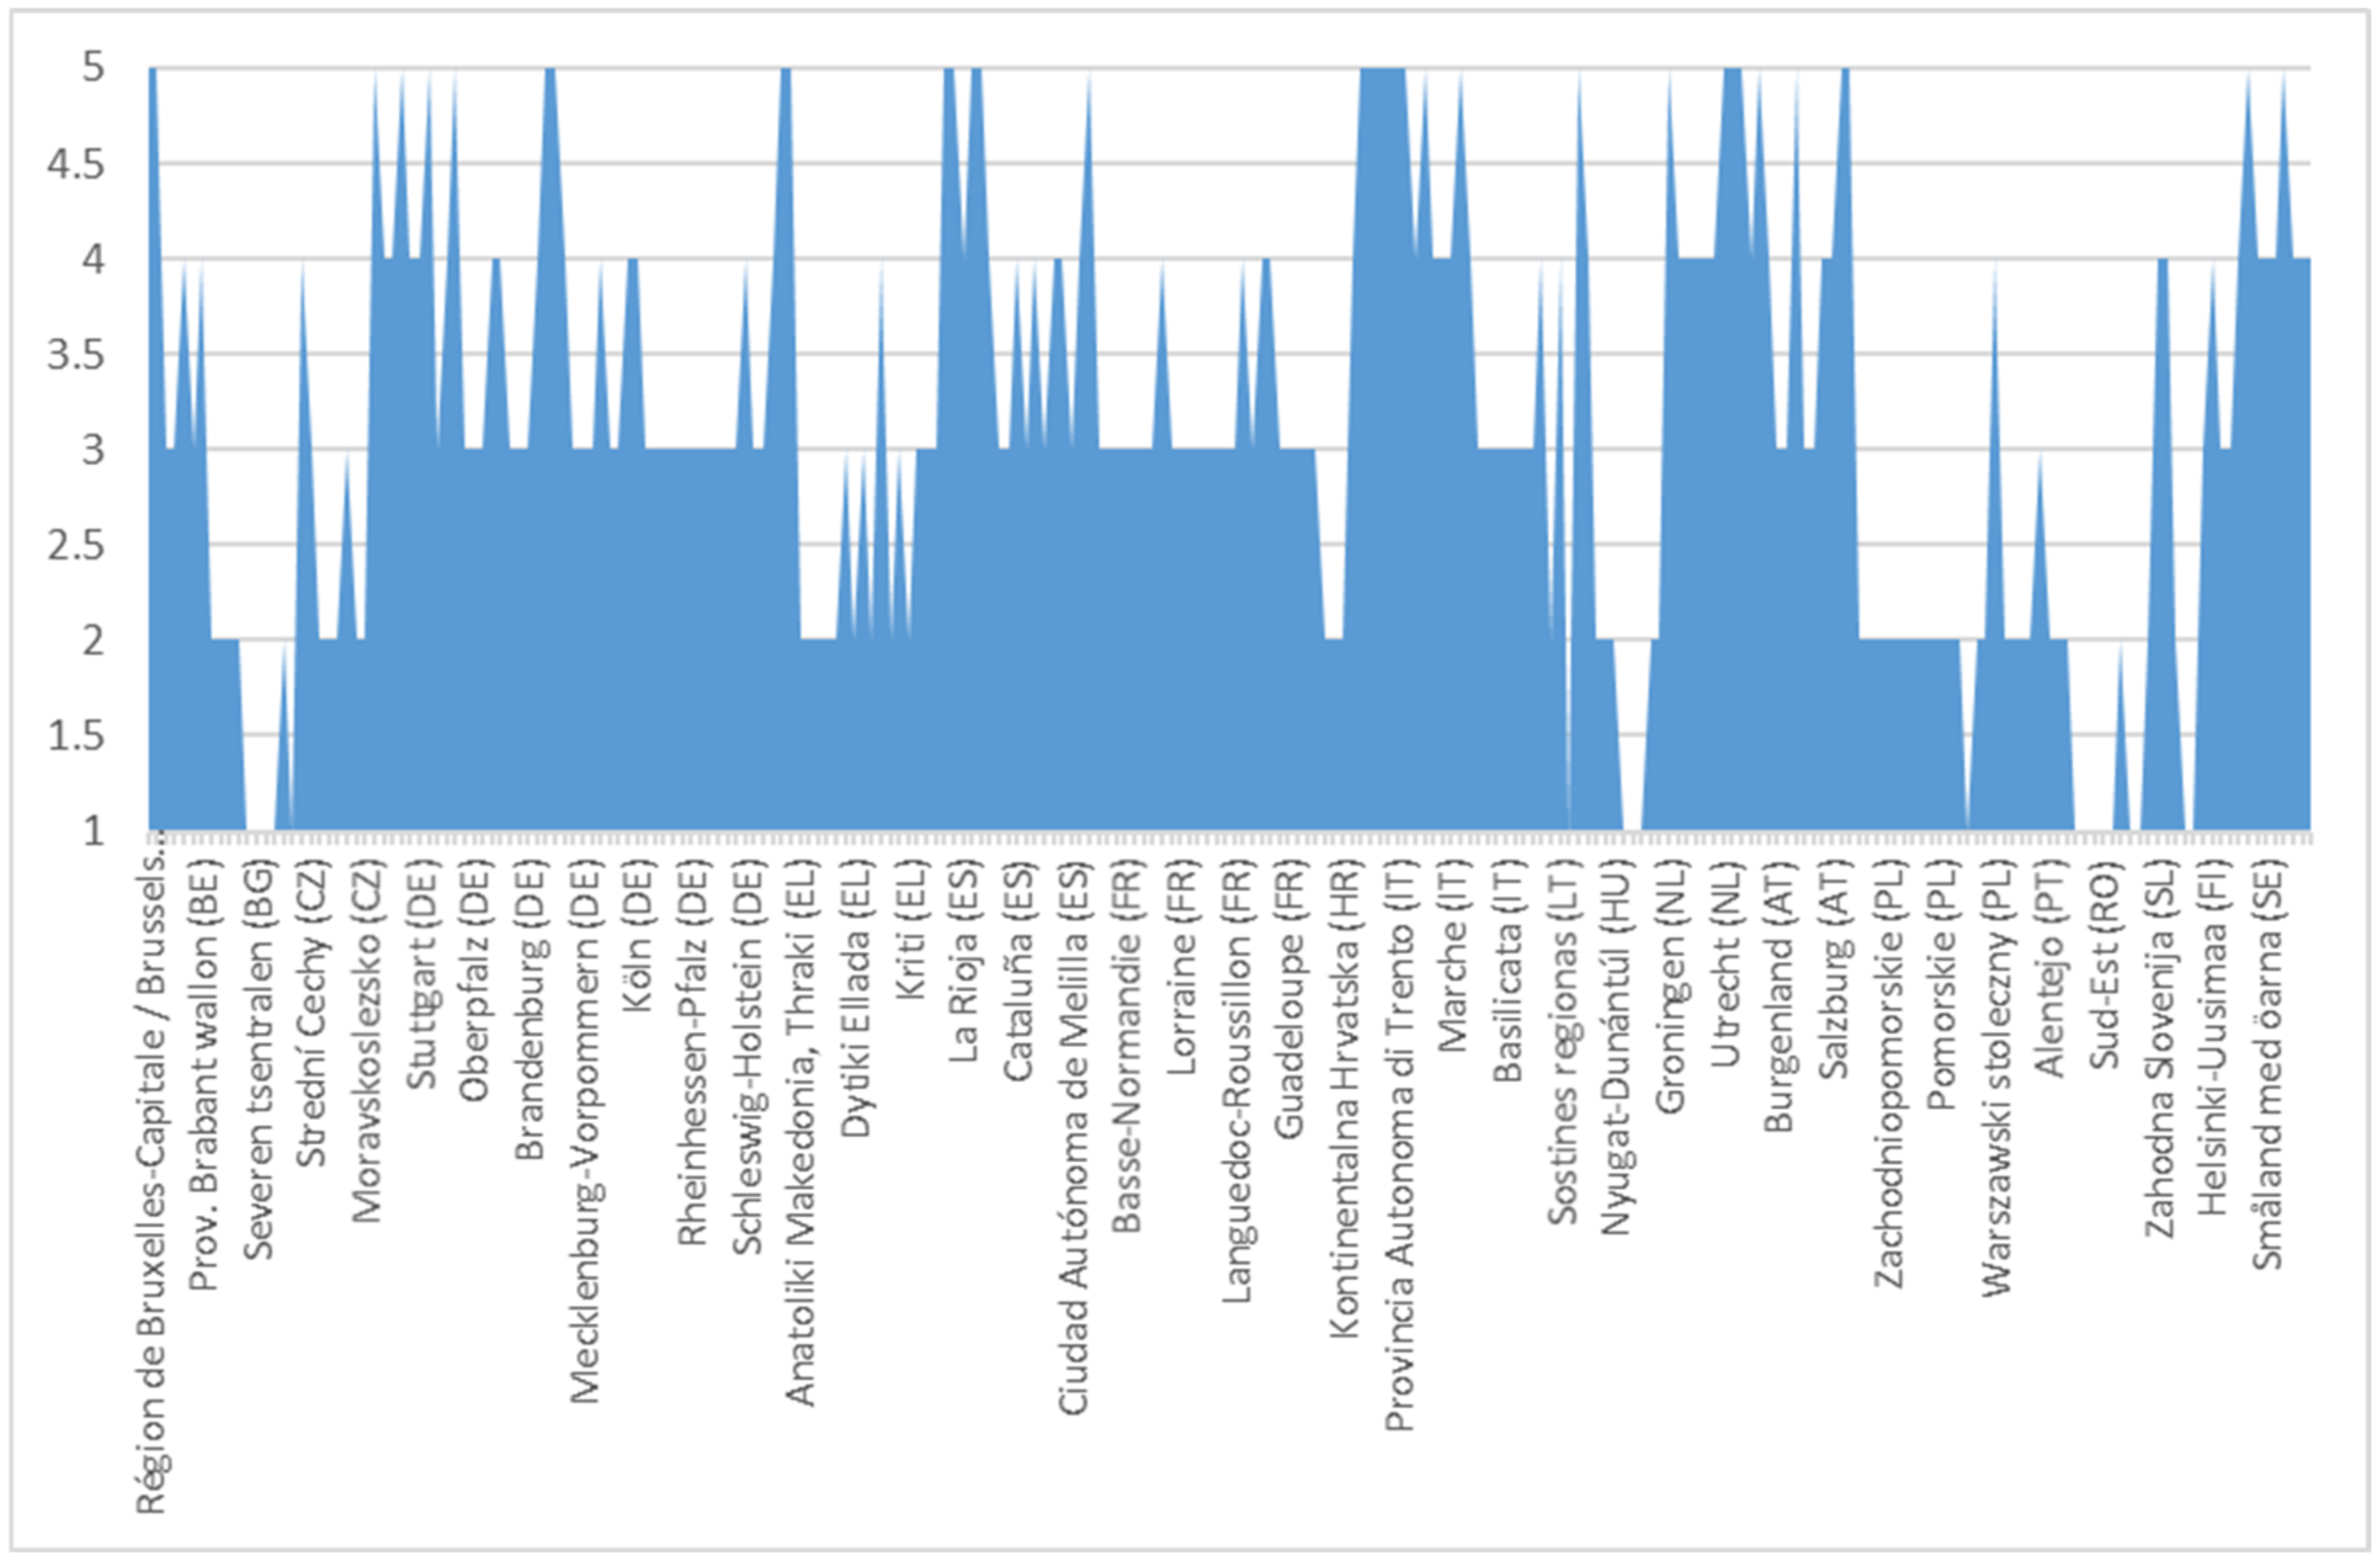
After comparing the data series, a 14-step efficiency chart was obtained for each of the 240 NUTS 2 regions of the EU. This picture, resulting from the application of the individual arithmetic mean to the region, allowed the calculation on the aforementioned scale of basic regional administrative capacity on a performance structure unaffected by the 3 disruptive factors. The graphical centralization of the performance is presented in Figure 2, where due to space restrictions the legend does not show all the regions. These are detailed in the Appendix A (Figure A1).
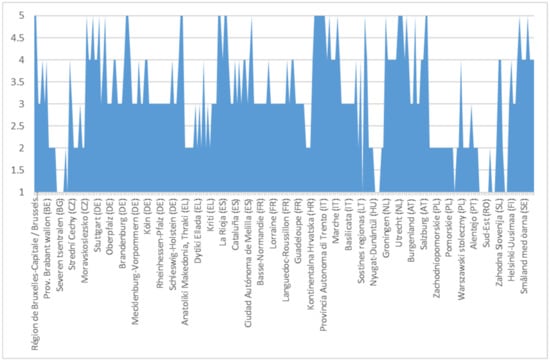
Figure 2.
Regional efficiency chart on NUTS 2 regions.
From Figure 2, it appears that the overall distribution is one in favour of medium efficiency, with a medium impact on performance. There are some situations (8 out of 10 regions) where the scalar level of the reliability indicator is very low, denoting a major impact on non-performance. These regions are located in the east of the EU.
The calculation of the coefficients was performed according to the formula:
where: Pri,t—regional performance in basic terms, without the effects of the COVID-19 pandemic; Ii,t—the value of the 14 aforementioned indicators for the 240 regions over the 15-year horizon (data collected from Eurostat 2006–2020); i—number of EU regions (240); t—the time horizon for which the analysis was performed; and coefficients 1, 2, 3, 4, 5—the scalar values shown in Figure 3.

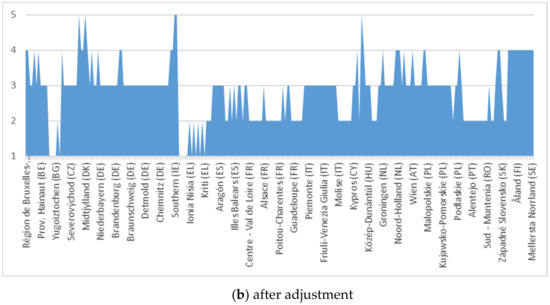
Figure 3.
Refugee migration.
For the scalar evaluation of the European population and of the refugees’ migration phenomenon, we analysed data from the specialized literature and the official figures presented by Eurostat. Finally, we made our own dimension based on the reality in each Member State regarding the migration and its impact on the destination state, as well as on the migration of the European population from states with less developed economies to those with developed economies. The empirically and statistically evaluated data are presented in Figure 3 and Figure 4.
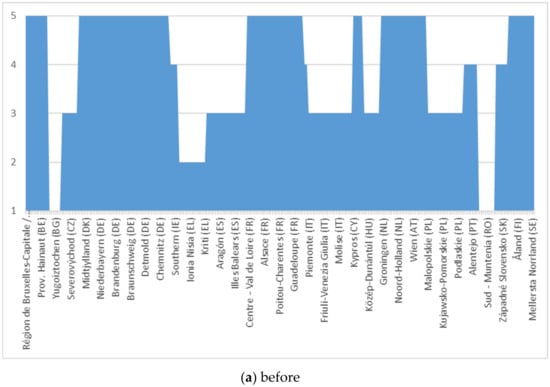
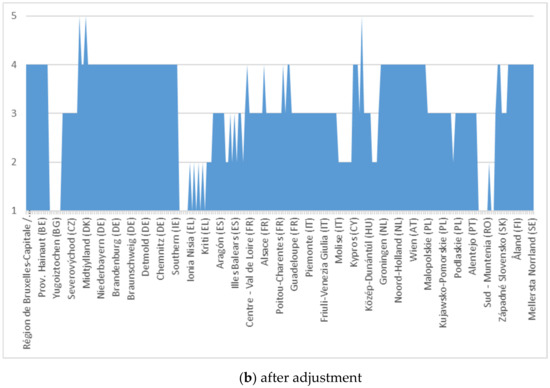
Figure 4.
EU population’s migration.
Following the analysis of the migration phenomenon through the lens of the proposed model, there is an increase in the impact of the phenomenon on European regions, especially on those with a low level of influence of the indicators in the initial (unadjusted) version. According to the figure, the trend is one of evenness/reduction in disparities, but towards the high impact area.
In Figure 4, we have analysed the migration of the European population within the Union, showing a more pronounced trend compared to the baseline period, but less pronounced than in the case of refugee migration. Under the impact of the refugee crisis, we estimate that some of the restrictive measures will also have an effect on the migration of the European population, which can be seen by comparing the fitted diagrams in Figure 3 and Figure 4.
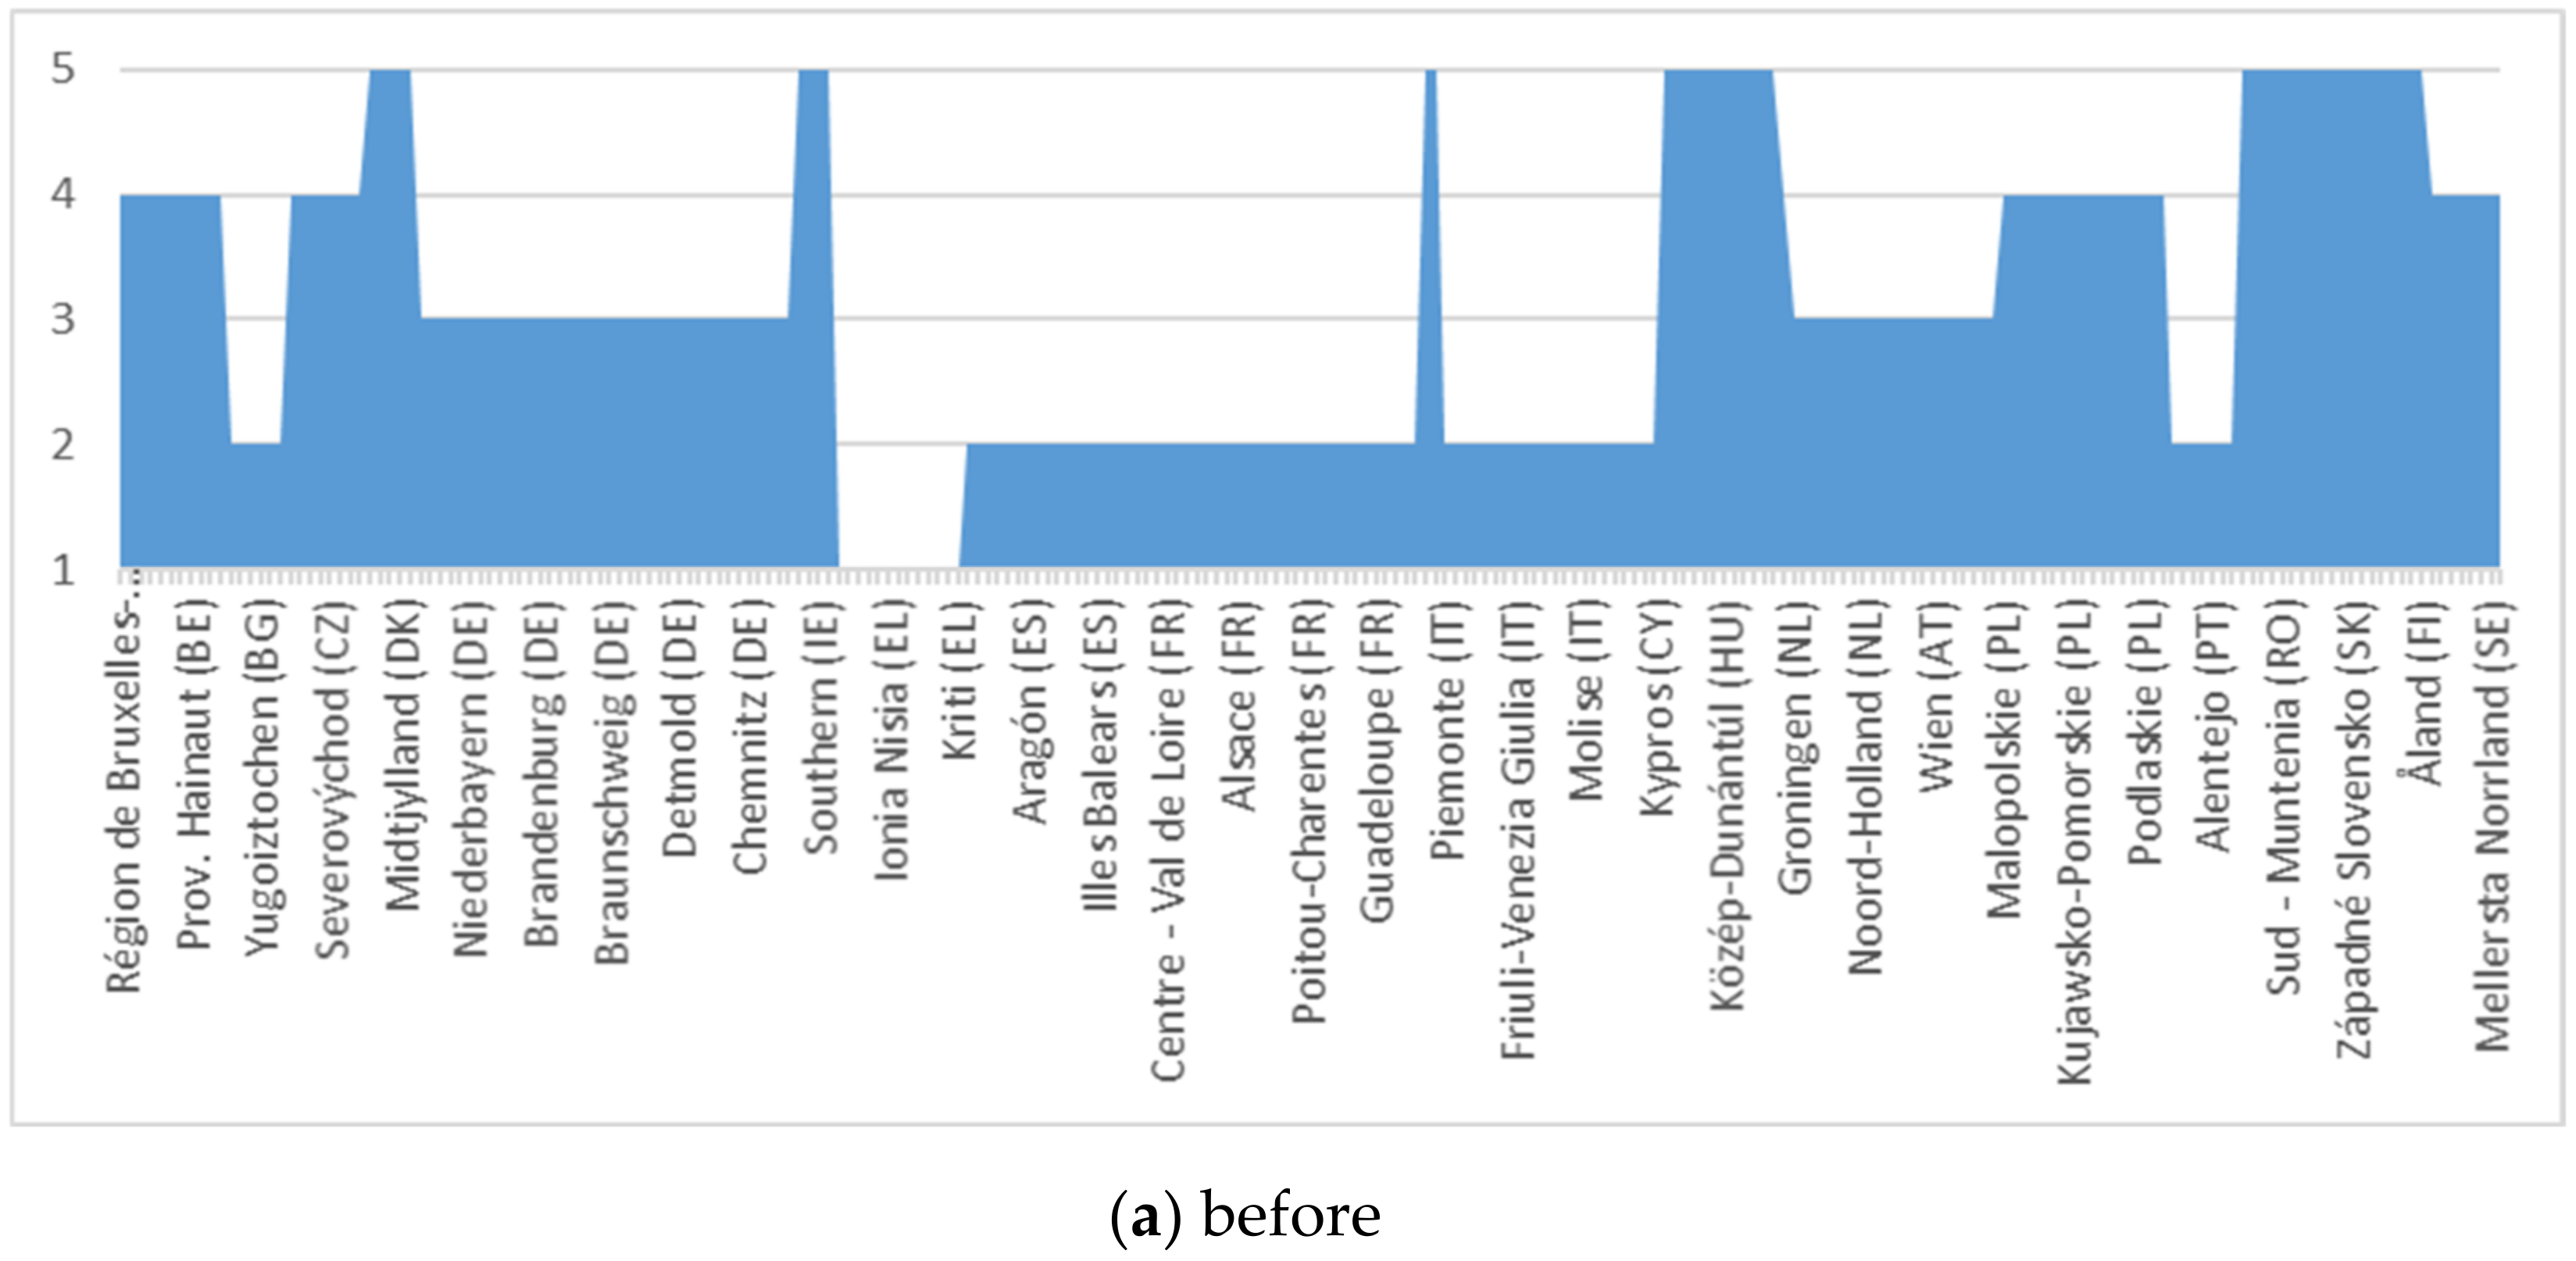
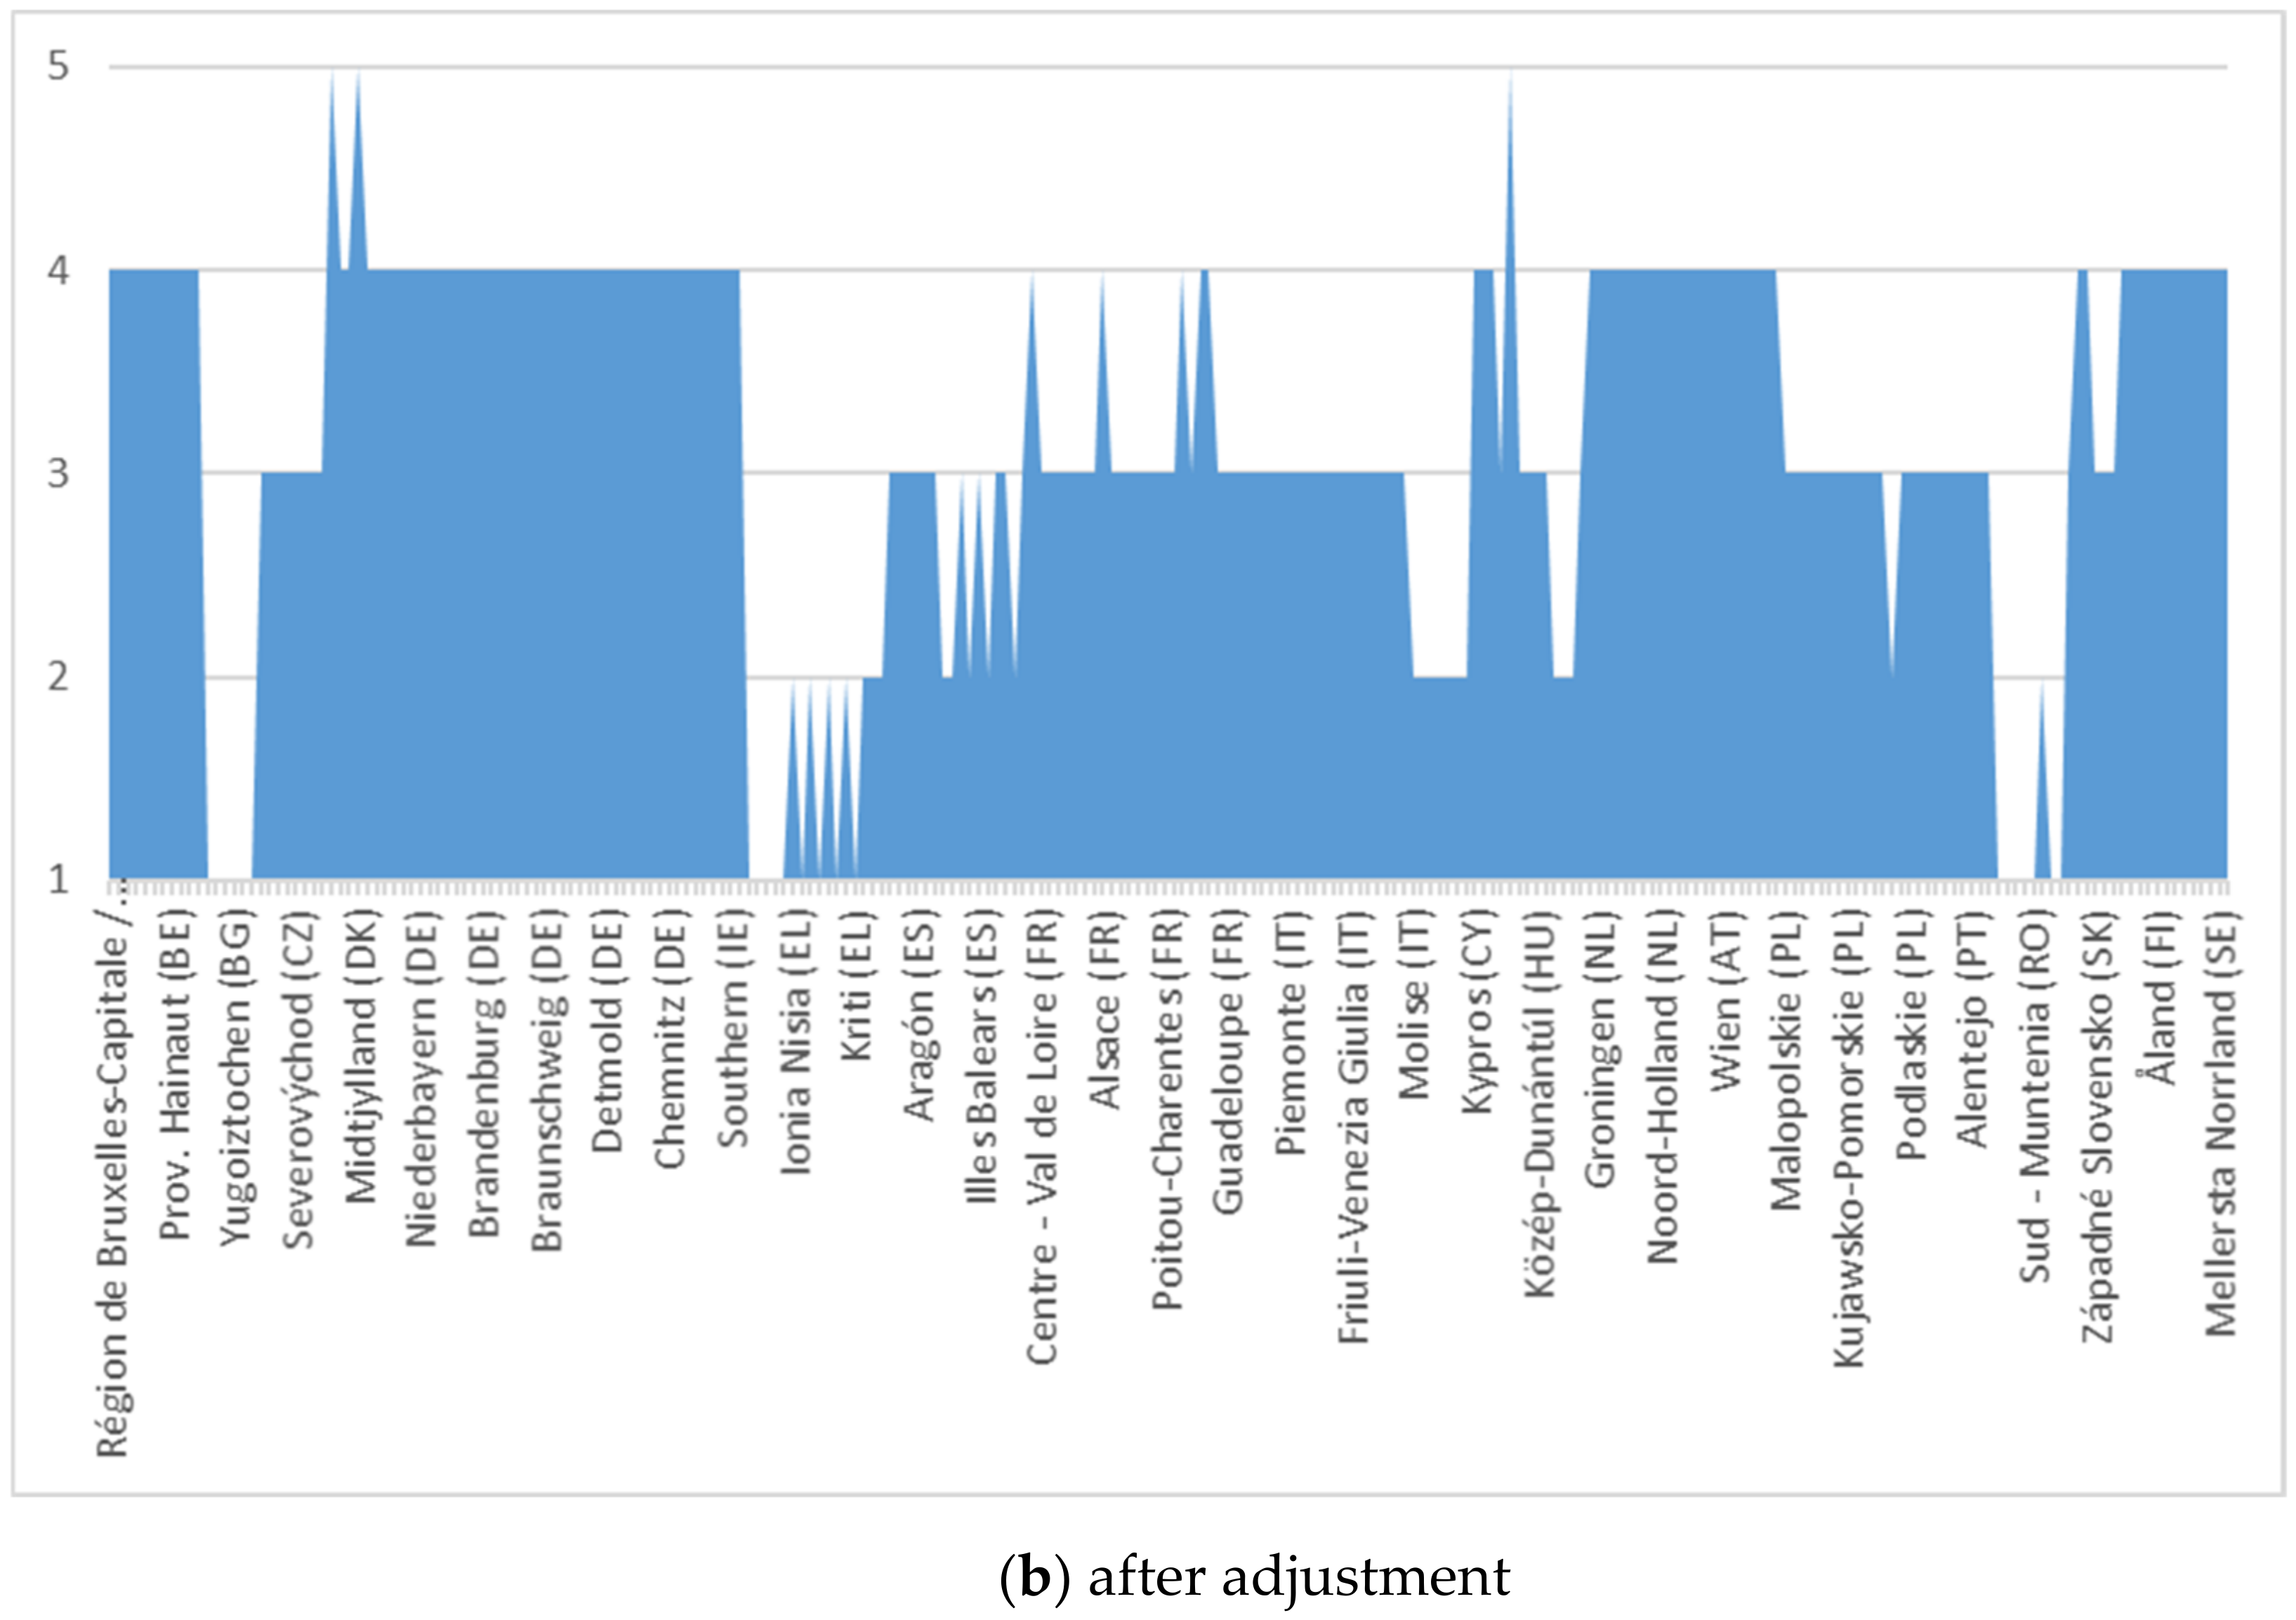
For the homogeneity of the analysis process, we used the same scale in Figure 3, so that our new model allows data parity. After estimating the data series (point “a” in Figure 5 and Figure 6), their adjustment was made regarding the impact on the versatility of regional administrative capacity through the analysed disturbance factor (internal migration + refugees).
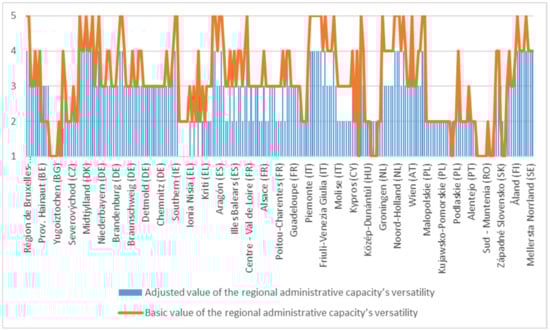
Figure 5.
Regional administrative capacity under the conditions of the analysed disturbed factors.

Figure 6.
Distribution of the dependent variable.
The adjustment model started from the results obtained by calculating the basic administrative capacity at the regional level, on which the consecutive impact of the two phenomena was evaluated according to the formula:
where: Mi—the intensity of the migration phenomenon in region i, i ϵ , —adjusting the basic model with the scalar afferent to the migration phenomenon calculated based on the above formula.
where: Ri—the intensity of the refugee migration phenomenon in region i, i ϵ , —adjusting the basic model with the scalar of the refugee migration phenomenon calculated based on the above formula.
Regarding the impairment of regional administrative capacity with the scalar values of the impact due to the COVID-19 pandemic in EU regions, we used the data communicated on the statista.com website, which presents in detail the distribution of the regional spread of the diseases with COVID-19 in each Member State. These data were centralized by the authors, compared with the demographic values reported by Eurostat through the population on 1 January by NUTS 2 region persons indicator at the level of 2019, calculating the regional disease rate defined as COVID-19’s rate, according to Appendix B (Table A1).
The scaling procedure was similar to those presented above, namely:
where: COVID-19—the intensity of the population infection phenomenon following the outbreak of the pandemic in region i, i ϵ , —adjusting the basic model with the scalar afferent to the phenomenon of population infection following the outbreak of the pandemic, calculated based on the above formula.
In order to evaluate the impact of the economic crisis, a two-step formula was applied. In the first step, the scalar indicators I7, I9 and I13 were used: I7, people living in households with very low work intensity, predicted as the percentage of the total population aged less than 60, Eurostat code: 0sdg_01_40; I9, real GDP per capita, predicted as chain-linked volumes (2010), EUR per capita, Eurostat code: 0sdg_08_10 GDP; and I13, employment rates of the recent graduates by sex, predicted as % of population aged 20 to 34 with at least upper secondary education, Eurostat code: 0sdg_04_50.
In the second stage, the scalar indicator calculated for COVID-19 was used, according to the formula:
where: Ci—the scalar coefficient of the economic crisis impact on the regional administrative capacity calculated according to the above formula; —scalar indicators I7, I9 and I13; —adjusting the basic model with the scalar afferent to the phenomenon after the outbreak of the pandemic, calculated based on the above formula.
The composite value of the versatility indicator of regional administrative capacity in relation to the 3 disturbing phenomena (economic crisis, COVID-19 pandemic and migration) was calculated based on the 4 intermediate values, adjusted by rounded arithmetic mean to the value of the scalars defined in Figure 1, according to the formula:
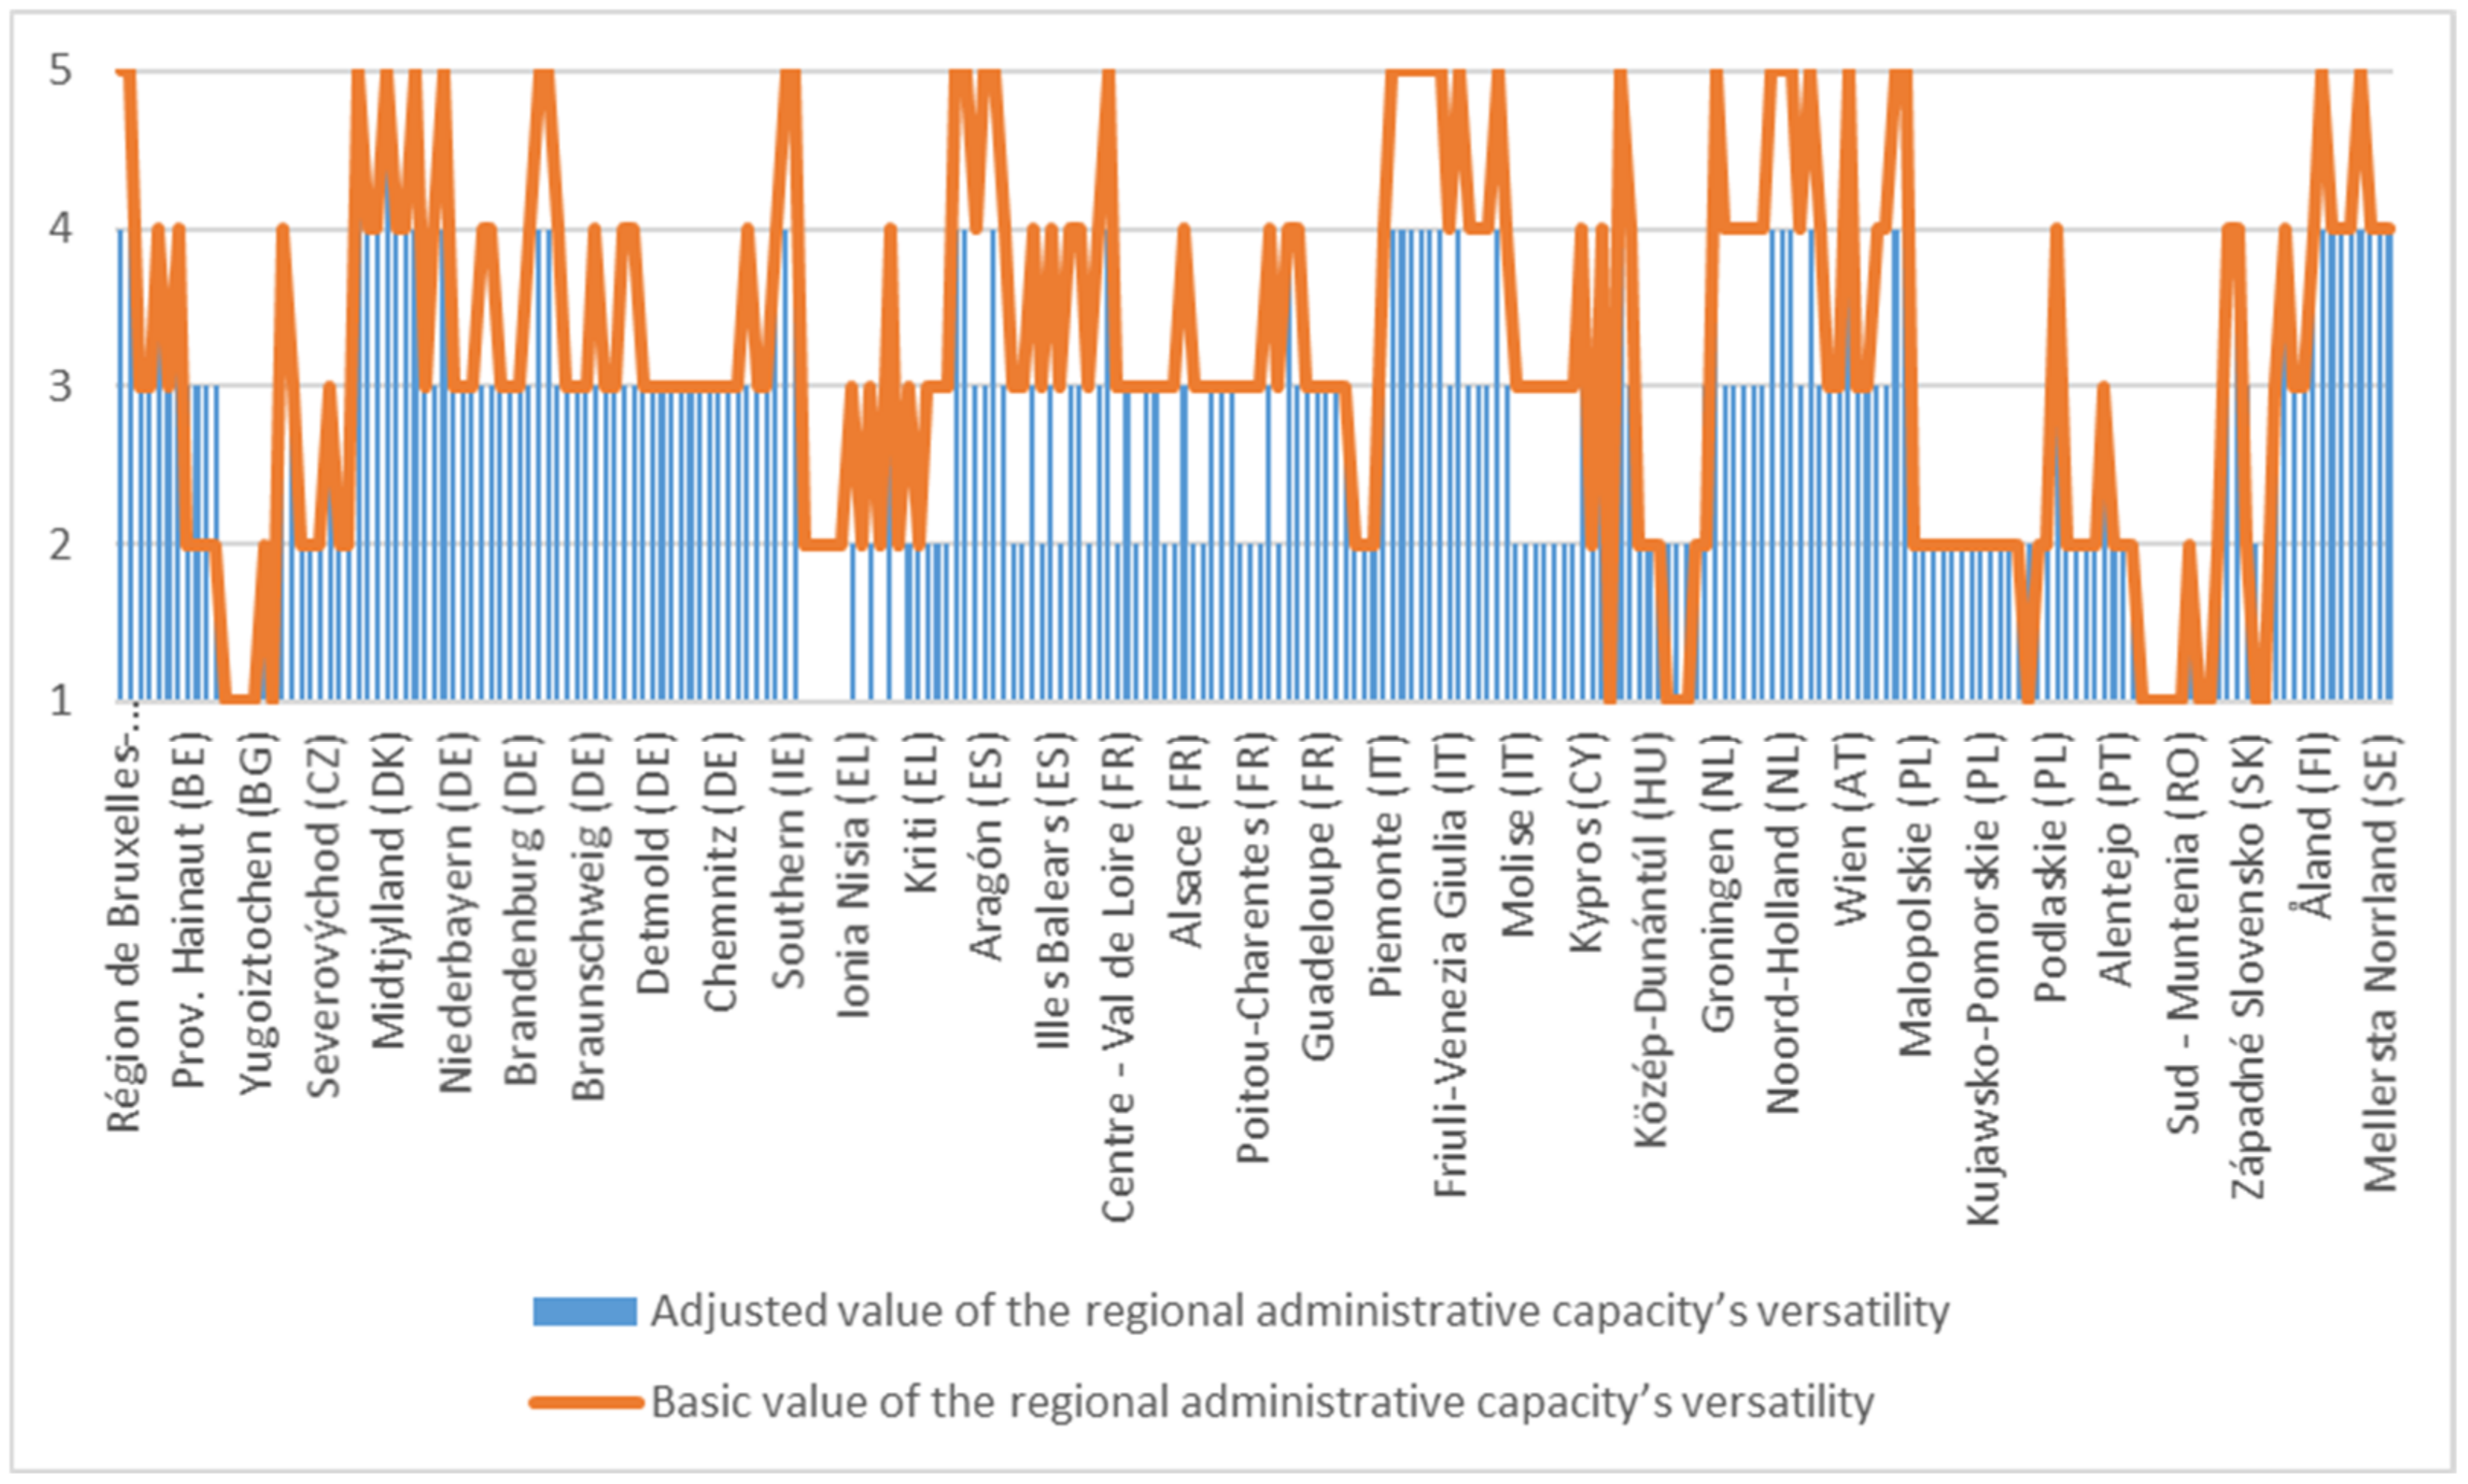
The graphical representation of the predicted final values for the analysed indicator, namely the versatility of the regional administrative capacity under the conditions of the analysed disturbed factors, is shown in Figure 5:
From Figure 5, it emerges that the final predictive values for regional administrative capacity versatility under the disturbing factors denote an evolving amplitude for most regions. There are cases where the versatility of regional administrative capacity is reduced by at least one point of influence from the base level. This means that disturbing factors constitute monitoring elements for the regional administrations on the basis of which the regional policies can be rebuilt in the short and medium term, with the advantage of maintaining the stability of the regional capacity by mitigating or eliminating the influence of these disturbing factors.
4. Results
We designed an econometric model in order to test the correlation between the previously presented variables, with the title of global phenomena with negative impact, namely the economic crisis, the refugees and the migration, and not lastly, the impact of the COVID-19 pandemic. These variables allowed the calculation of the scalar coefficients of regional administrative capacity in the absence of the disturbing factors (C0) and in the presence of each individual (C1–C4) in order to finally allow the calculation of the regional administrative capacity versatility under the current crisis conditions. The definitions of the aforementioned terms are:
- F1—Economic crisis’ impact;
- F2—Refugees’ impact;
- F3—Migration’s impact;
- F4—COVID-19’s impact;
- C0—Basic regional administrative capacity;
- C1—Refugees’ impact on regional administrative capacity;
- C2—Migration’s impact on regional administrative capacity;
- C3—COVID-19’s impact on regional administrative capacity;
- C4—Economic crisis’ impact on regional administrative capacity;
- R—Regional administrative capacity.
The new proposed model is based on the following hypotheses H1–H3:
Hypothesis 1 (H1).
There is a direct and quantifiable dependence between the regional administrative capacity and the regional economic power quantified in real GDP/capita. In the absence of the disturbing factors, it is estimated that the growth trend of the regional economies is directly related to the regional administrative capacity and in terms of economic growth in the EU as a whole.
Hypothesis 2 (H2).
In the presence of the disturbing factors, it is estimated that the greatest impact quantified by the correlation between the scalar of the phenomenon and the impact on the regional administrative capacity is generated by F4 (COVID-19 pandemic) and F1 (Economic crisis’ impact).
Hypothesis 3 (H3).
There is a demonstrable econometric correlation through the same dependent variable between the scalar value of the disturbing factors with regional manifestation and the scalar value of the regional administrative capacity through a high statistical confidence regarding the test of bivalent correlation between C0, R and the factors Fi.
In the above context of the hypotheses and the methodological concepts presented in Section 3, we define the correlational econometric model based on the two-stage least squares regression. The model used Gretl software version 2019, according to the regression equation as follows:
According to this regression equation, we find highly significant statistical values of the model for the dependent variable C0, the regressors Fi and the instrumented variables Ci. In this case, the statistical significance test indicates the value of 72.9%, while the C0-R correlation indicates a 96.8% value of the statistical significance test, which leads to a first conclusion of the model’s validity. In order to consolidate this conclusion, the statistical tests were performed for the TSLS model applied to the EU 240 NUTS 2 regions, obtaining significant values of the p-value indicator for the variable regression scales F1, F4 and F2 (see Table 2). The p-value is medium significant for F2, while it is highly significant for F1 and F4.
Table 2.
Model TSLS using observations 1–240. Dependent variable: C0; Instrumented: F1 F2 F3 F4; Instruments: C1 C2 C3 C4.
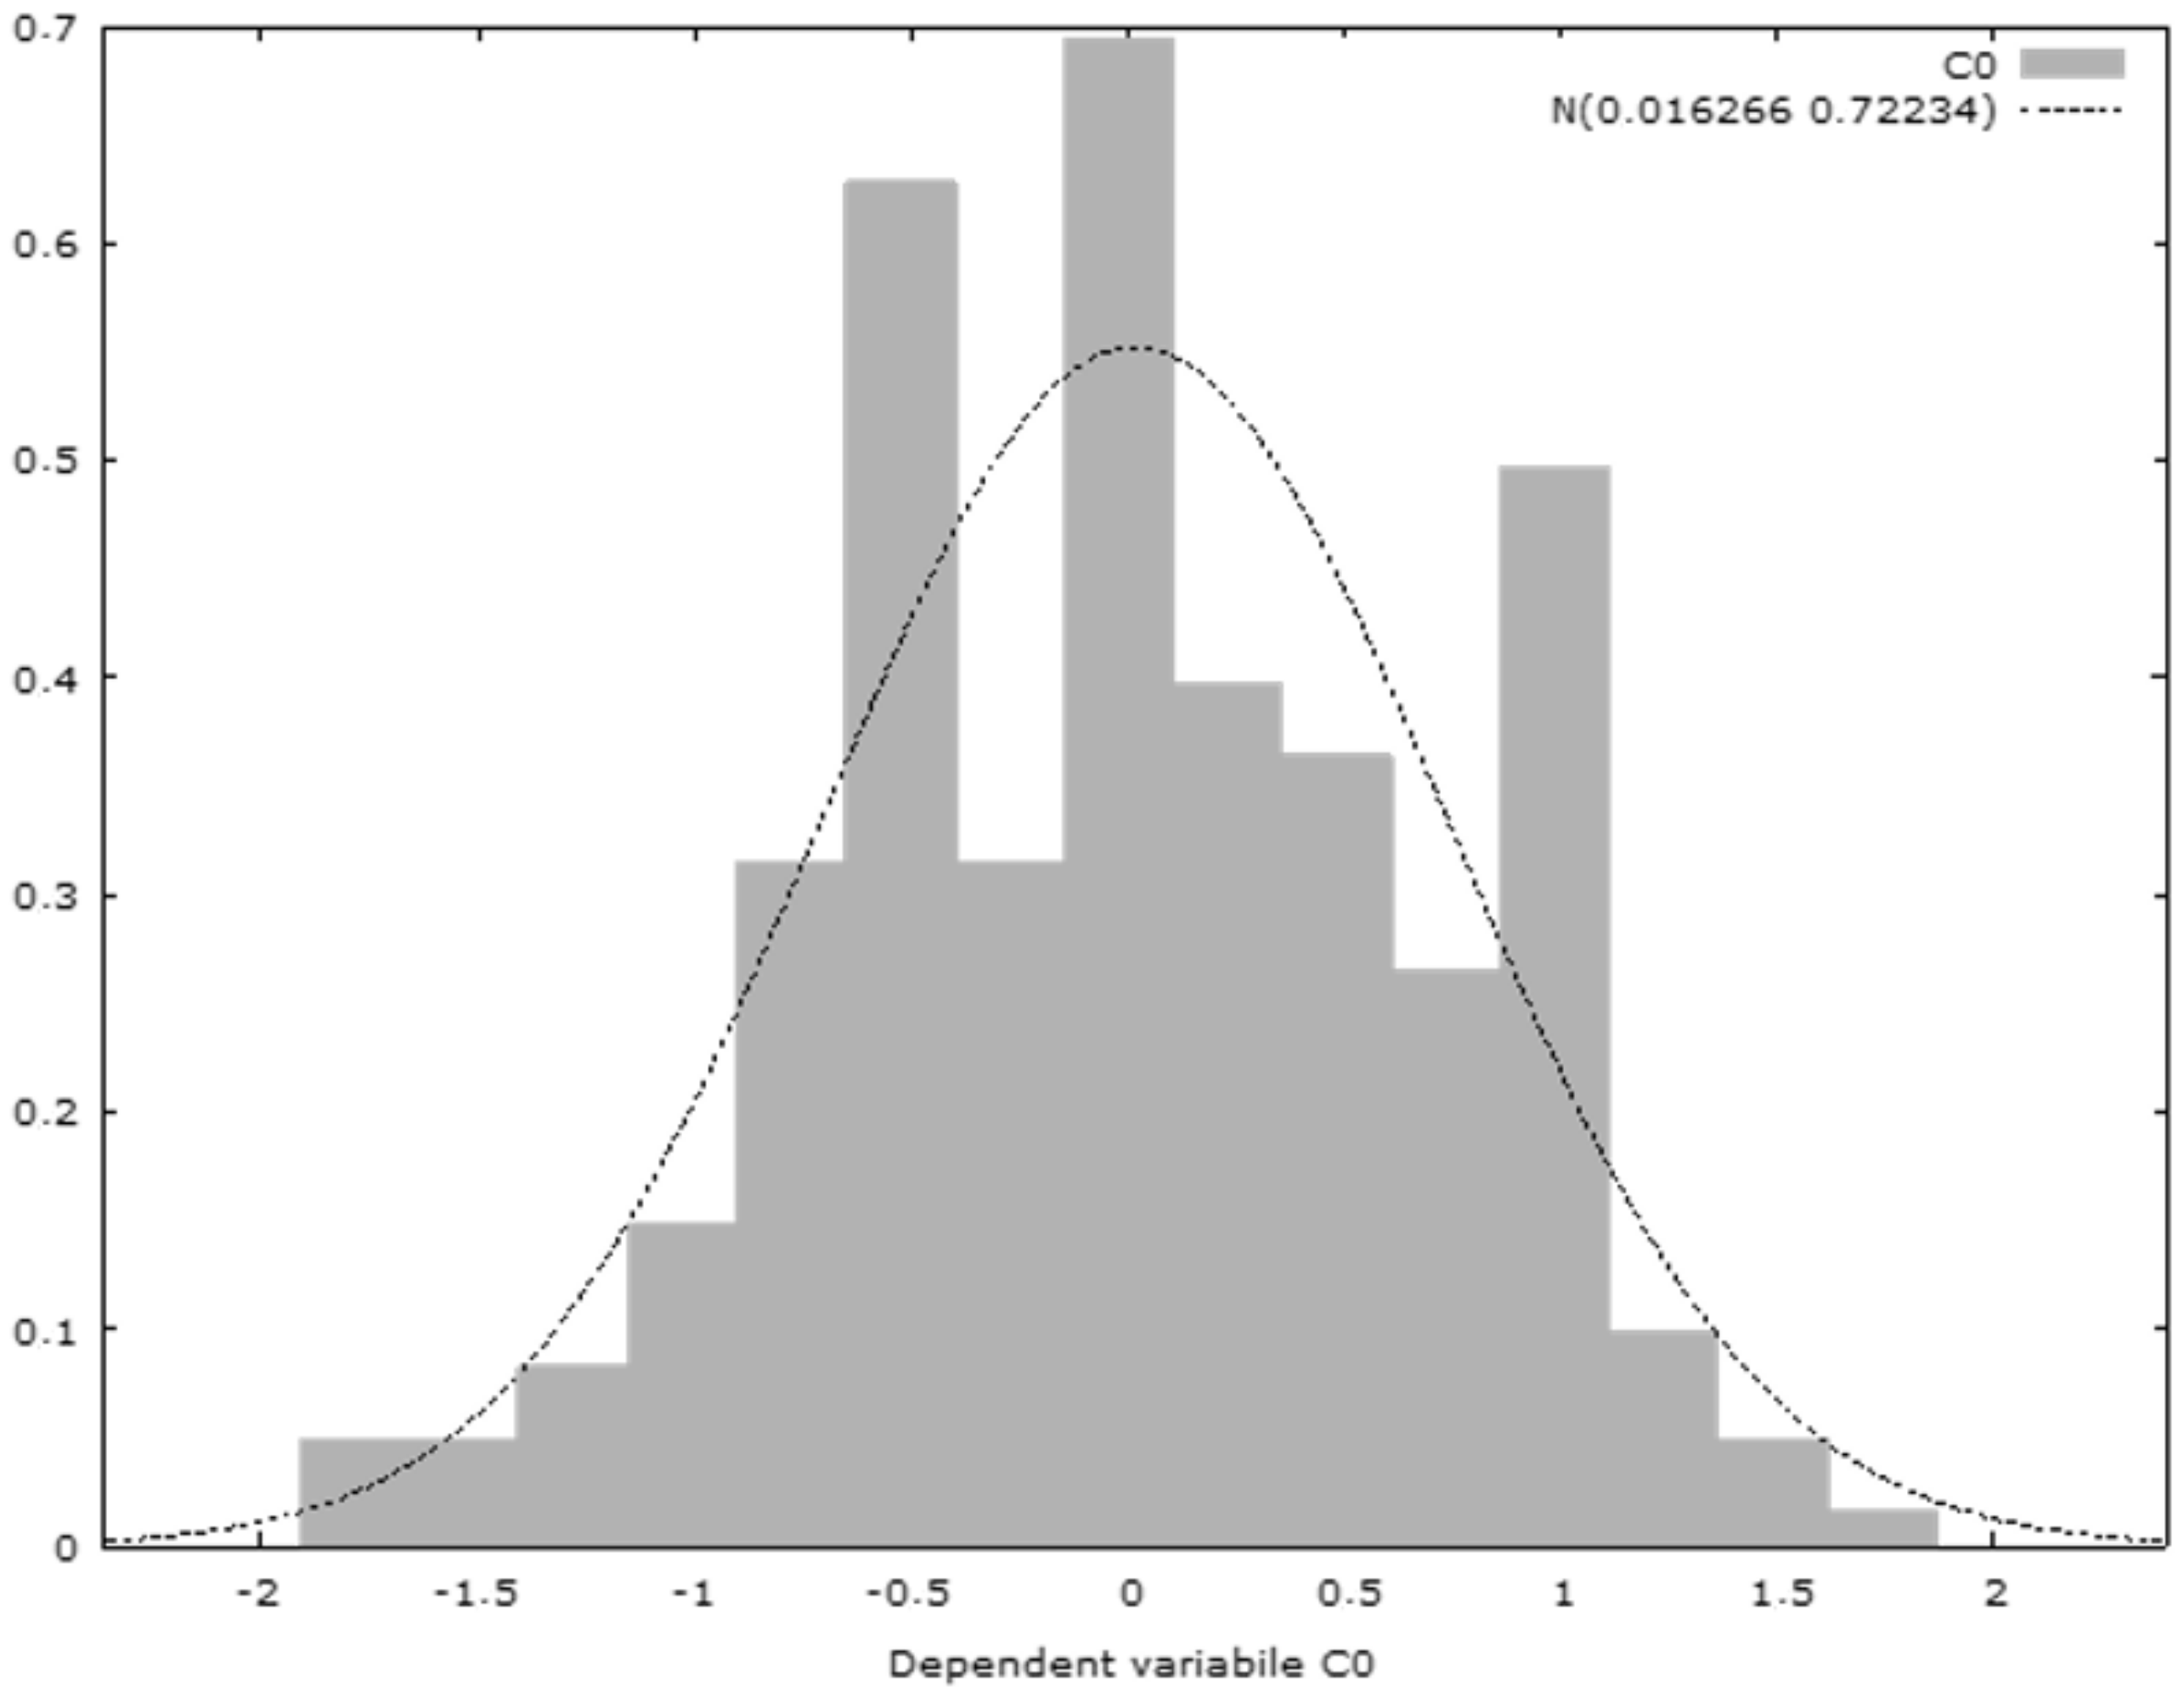
The heteroscedasticity test reveals that, in the case of the null hypothesis, the heteroscedascity is not present, and the test for the residual normality reflects that the error is normally distributed, according to the distribution diagram of the Gaussian curve.
Hausman test—null hypothesis: OLS estimates are consistent; asymptotic statistical test: Hi square (4) = 728.81 with p-value = 2.01207e−156; Pesaran–Taylor test for heteroskedasticity—null hypothesis: heteroscedasticity is not present; asymptotic statistical test: z = 0.329671 with p-value = 0.741648; test for residual normality—null hypothesis: the error is normally distributed; statistical test: Hi square (2) = 2.79135 with p-value = 0.247665; weak instrument test—Cragg–Donald minimum eigenvalue = 50.9864 (see Figure 6).
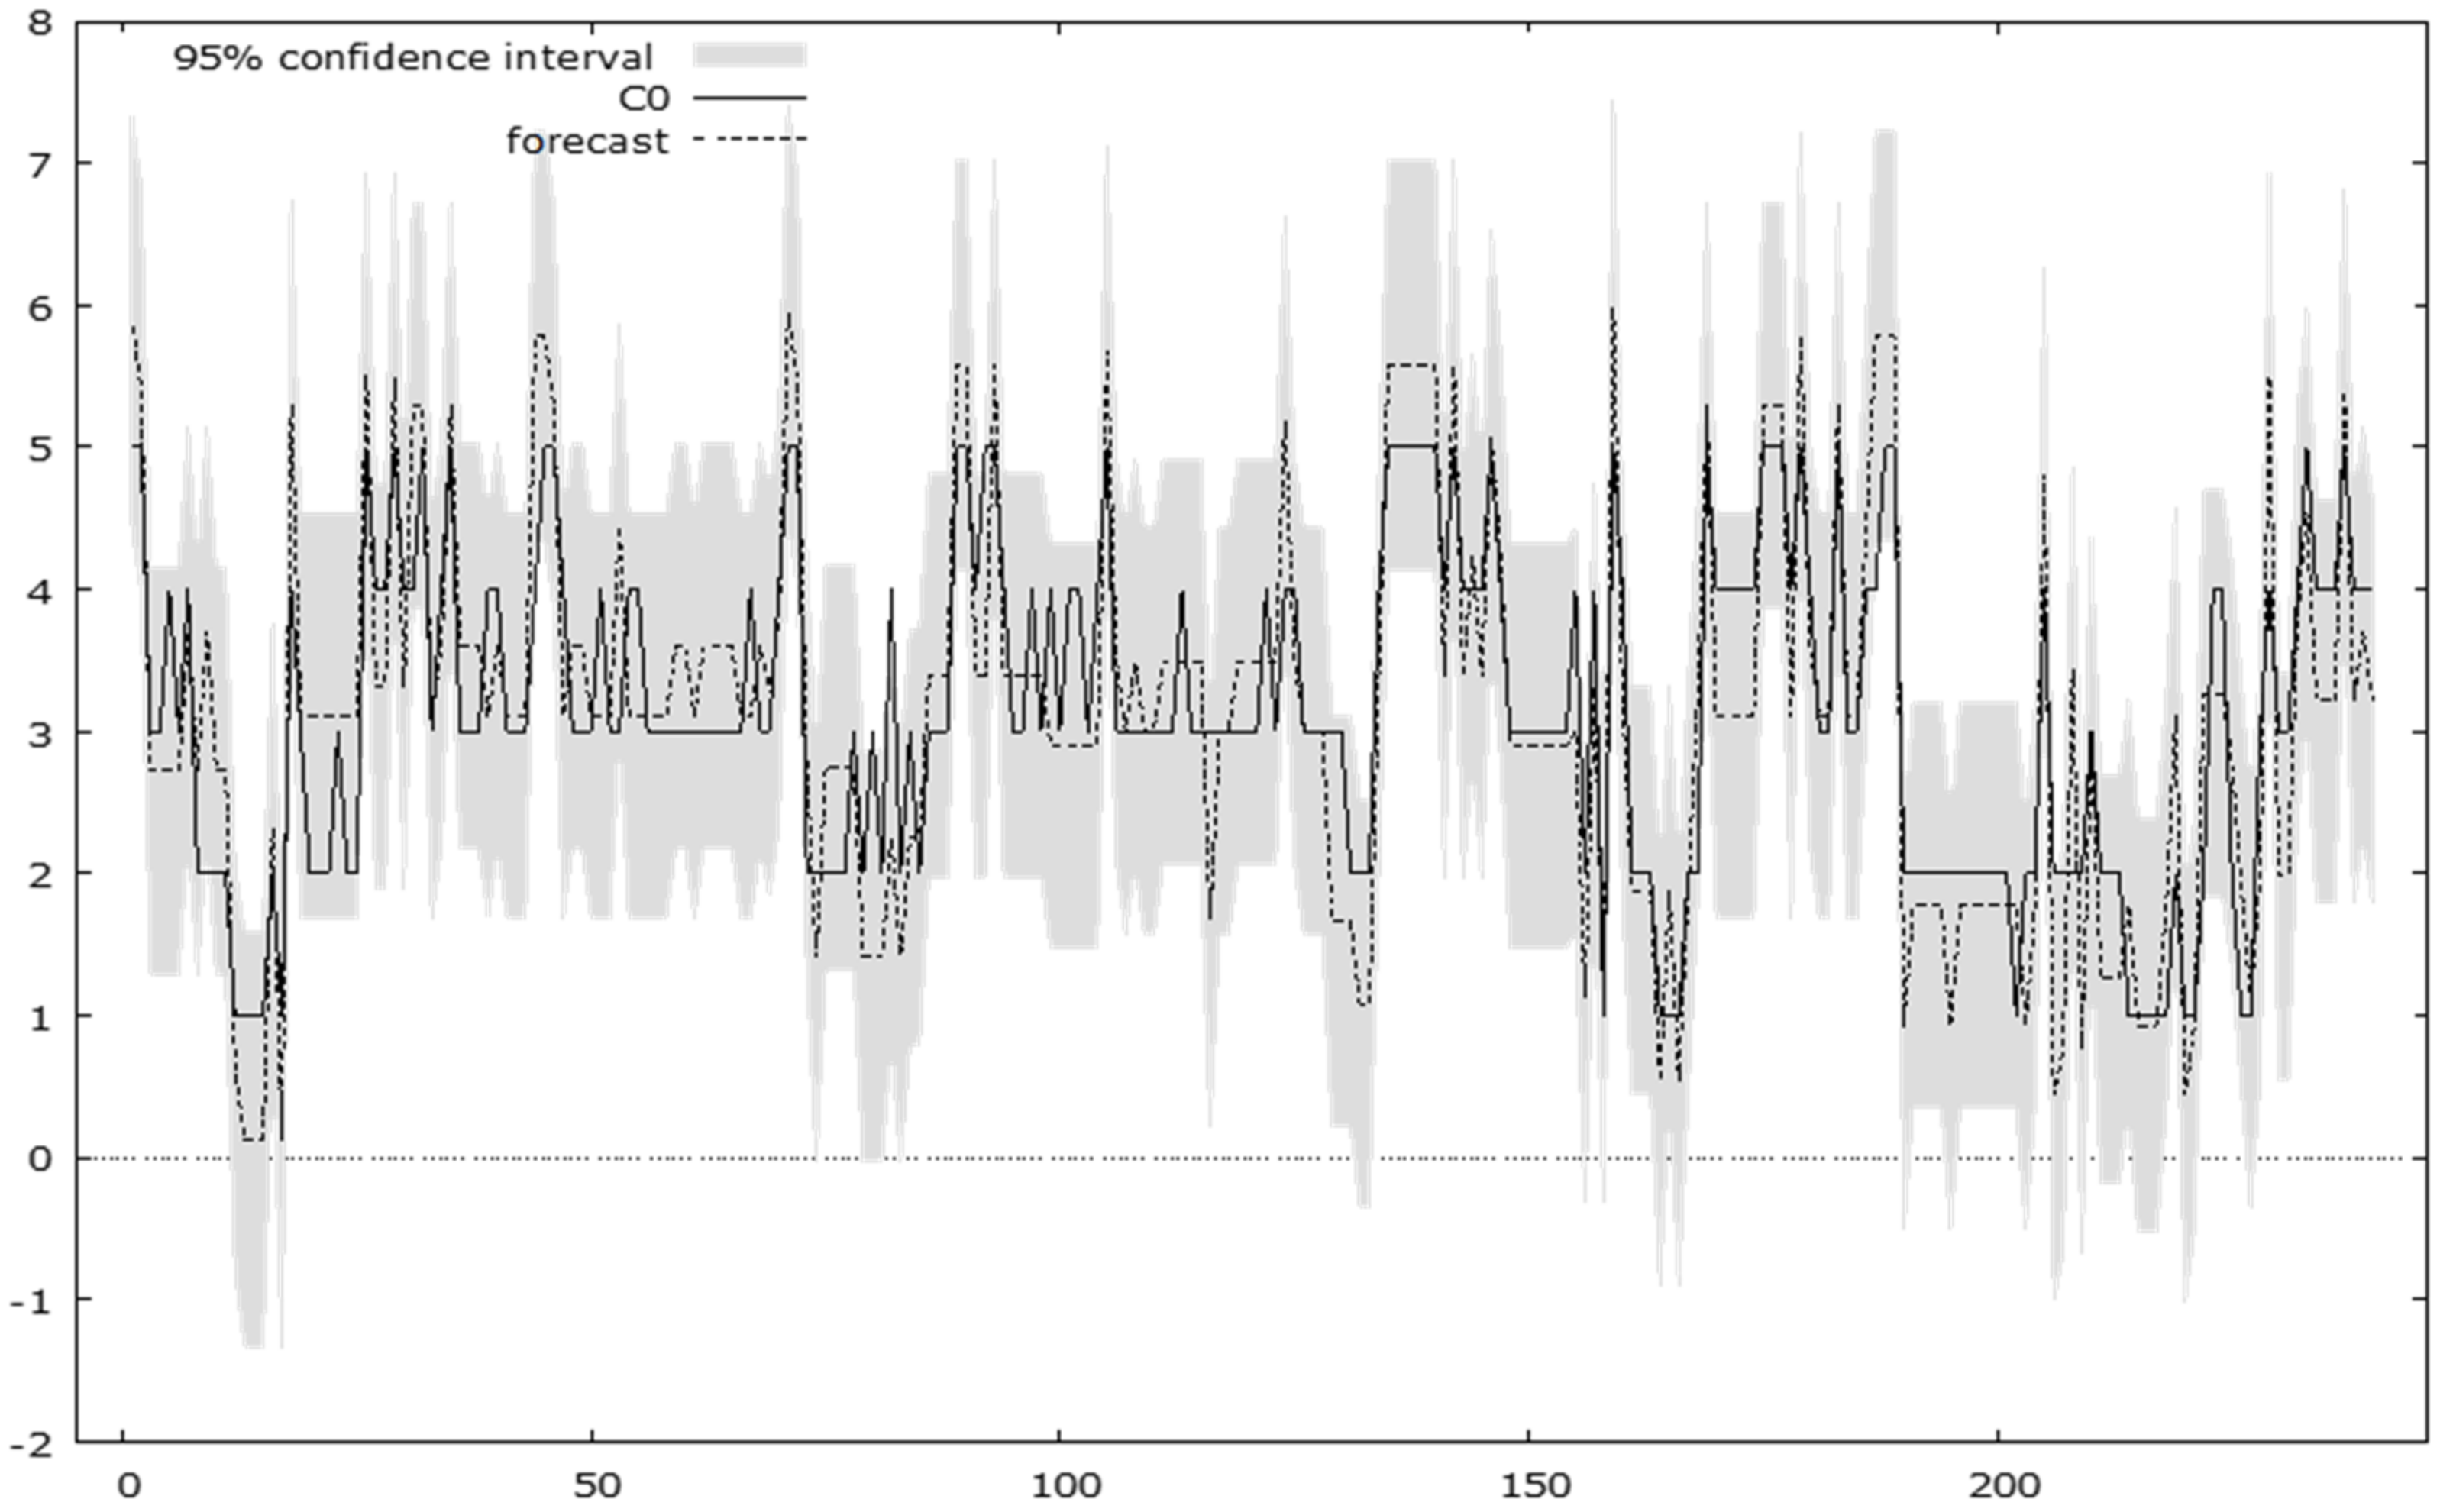
The predicted analysis of the amplitude of the dependent variable variation achieves over the 95% confidence interval and shows a significant impairment of the values of the basic regional capacity (C0) in the presence of the disturbing factors. This forecast is shown in the diagram (Figure 7):
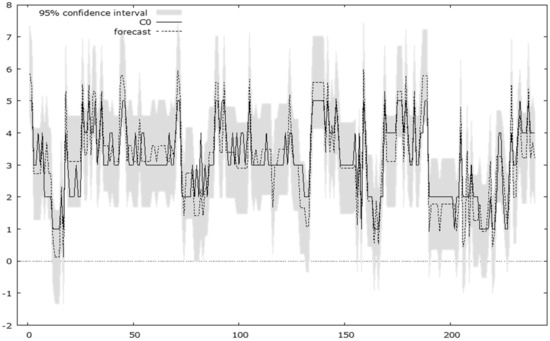
Figure 7.
Predicted distribution diagram of the dependent variable for the 95% confidence interval.
The model proposed in this paper objectively evaluated the versatility of the regional administrative capacity in relation to the disturbing factors, finding a high influence of F1 and F4 and an average influence of F2 on the dependent variable. Variable F3 represents a residual regressor in the proposed model because it is concerned with the measures adopted during the pandemic and economic crisis to limit the movement of people and to control the social distance.
5. Discussion
Through the analysis performed during the present research, the working hypotheses were demonstrated as follows:
H1 demonstration:
There is a direct and quantifiable dependence between the regional administrative capacity and the regional economic power quantified in real GDP/capita, so that, in the absence of disturbing factors, it is estimated that the growth trend of the regional economies is directly related to the regional administrative capacity and in terms of economic growth in the EU as a whole. This aspect was also highlighted by Asahi K, Undurraga EA, Valdés R and Wagner R. (2021) [15], who pointed out that, during the crisis period, there is an impairment of the regional economy compared to the development experienced by these regions before the crisis (see Table 1).
This aspect was demonstrated because for the calculation of the regional administrative capacity, 14 regional statistical indicators were integrated: I1. investment share of GDP by institutional sectors, I2. early leavers from education and training by sex, I3. gross domestic expenditure on R&D by sector, predicted as % of GDP, I4. employment in high- and medium-high-technology manufacturing and knowledge-intensive services, I5. people at risk of poverty or social exclusion, I6. people at risk of income poverty after social transfers, I7. people living in households with very low work intensity, I8. share of renewable energy in gross final energy consumption by sector, I9. real GDP per capita, I10. long-term unemployment rate by sex, I11. R&D personnel by sector, I12. patent applications to the European Patent Office, I13. employment rates of recent graduates by sex and I14. energy import dependency by products.
n = 240, R-squared = 0.956.
The correlation diagram is shown in Figure 8.
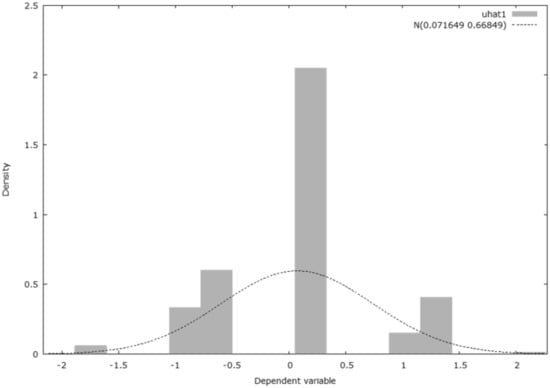
Figure 8.
The correlation diagram.
H2 demonstration:
In the presence of disturbing factors, it is estimated that the greatest impact quantified by the correlation between the phenomenon scalar and the impact on the regional administrative capacity is generated by F4 (COVID-19 pandemic) and F1 (Economic crisis’ impact). In the paper “Economic interventions to ameliorate the impact of COVID-19 on the economy and health: an international comparison,” [13] the authors show that the immediate measures taken by the authorities in the developed countries have a high fiscal impact in terms of combating the effects of the pandemic. Moreover, the authors show that there are common elements in the strategies adopted, namely reducing taxes and adopting measures to support the population. (see Table 1).
As we demonstrated in Section 4, the p-values of the two scalar factors are less than 0.0001 and are smaller than the other 2 scalar factors (F2, F3), contributing to the homogeneity of the proposed model.
H3 demonstration:
There is a demonstrable econometric correlation through the same dependent variable between the scalar value of the disturbing factors with regional manifestation and the scalar value of the regional administrative capacity through a high statistical confidence regarding the test of bivalent correlation between C0, R and the factors Fi. Some authors [6] show that the effect of population health on economic growth can be assessed by a directional model of valuation which, we believe, would be adjusted by the impact value of the disturbing factors. Additionally, other authors [7] consider that the impact of the pandemic on the health status of the population can be measured directly and on the pandemic indirectly based on a Markov chain model, demonstrating the need for a review of public health policies and measures to be implemented to reduce uncertainty. Some researchers [8] presented an analysis of the impact of the disruptive factors on the global economy during the economic crises. They show that these factors act as markers of the flattening of the growth curve. As shown in Table 1, their proposed model can be improved by adding social protection variables with an impact on the economic recovery.
The correlation is demonstrated for a high level of statistical representativeness, 96.8% for the C0-R correlation and 72.9% for the C0-Fi correlation. These values were presented together with the model equation in Section 4, demonstrating the correlations presented in the Methodology and indicating, together with the statistical tests, that the proposed model is reasonable, homogeneous, well determined and representative in relation to the analysed disturbing phenomena.
The objectives of the study are aimed primarily at the structured assessment of regional administrative capacity in the initial version, based on statistical indicators, and in the current version, after the outbreak of the pandemic, based on quantifying the impact of the disturbing factors.
The first objective defined according to the above was achieved by the authors carrying out a structured analysis of regional administrative capacity, based on the disturbing factors, obtaining the following results:
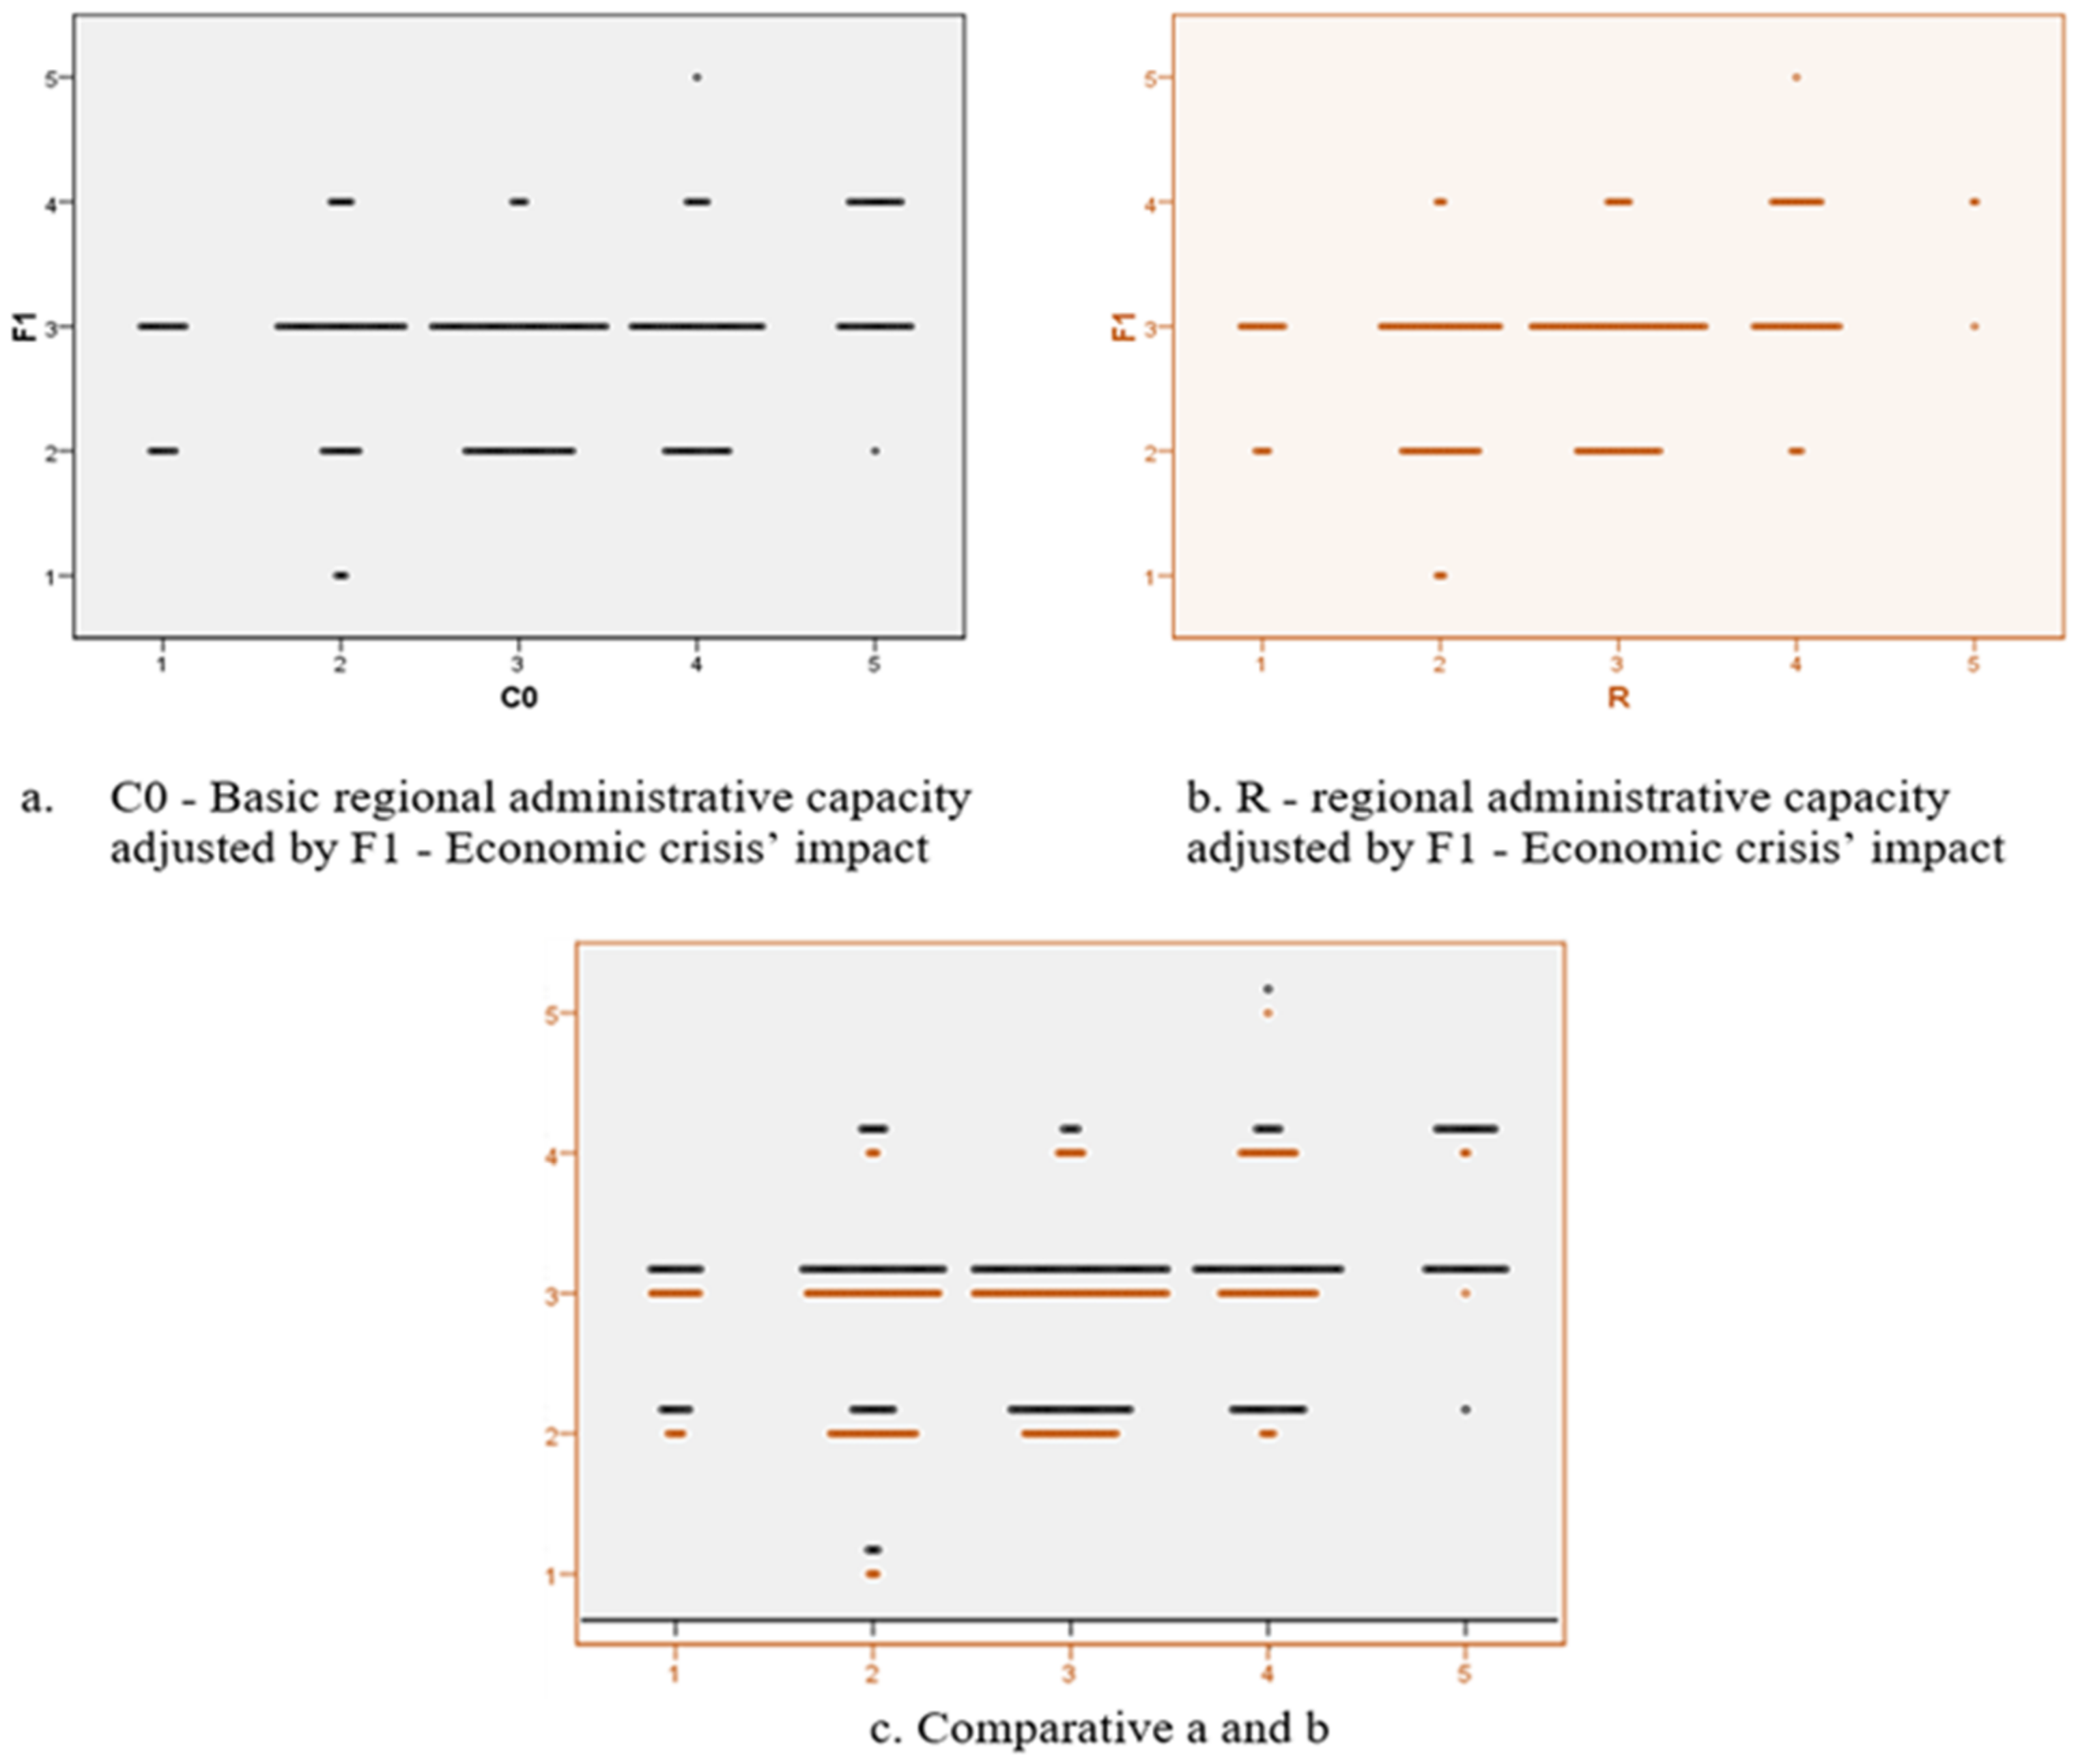
The regional administrative capacity is affected for the F1 scale in the critical value range 1–2, on the segment of the regional economies whose basic variable of the administrative capacity registers values towards the minimum interval (the lower values of the pre-crisis administrative capacity, assessed on the basis of the 14 Eurostat statistical indicators, lead to a higher impact of the economic crisis that disturbs the administrative capacity in the period after this phenomenon occurs). In the same sense, impairments are also found for the strengthened administrative capacities, in the sense of reducing or declassifying those to the average area of the range of scalar values (see Figure 9).
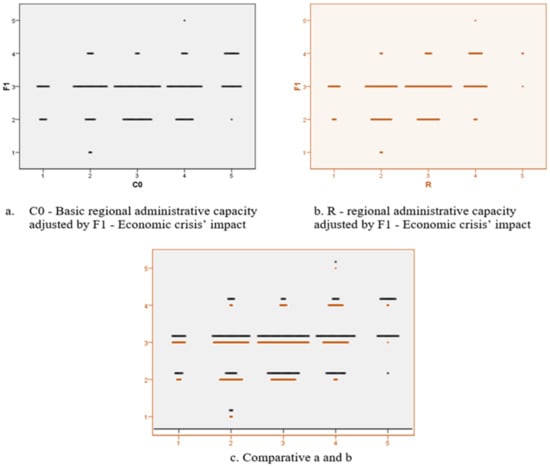
Figure 9.
Two-dimensional plot diagram for analysing the C0-R variables in relation to F1.
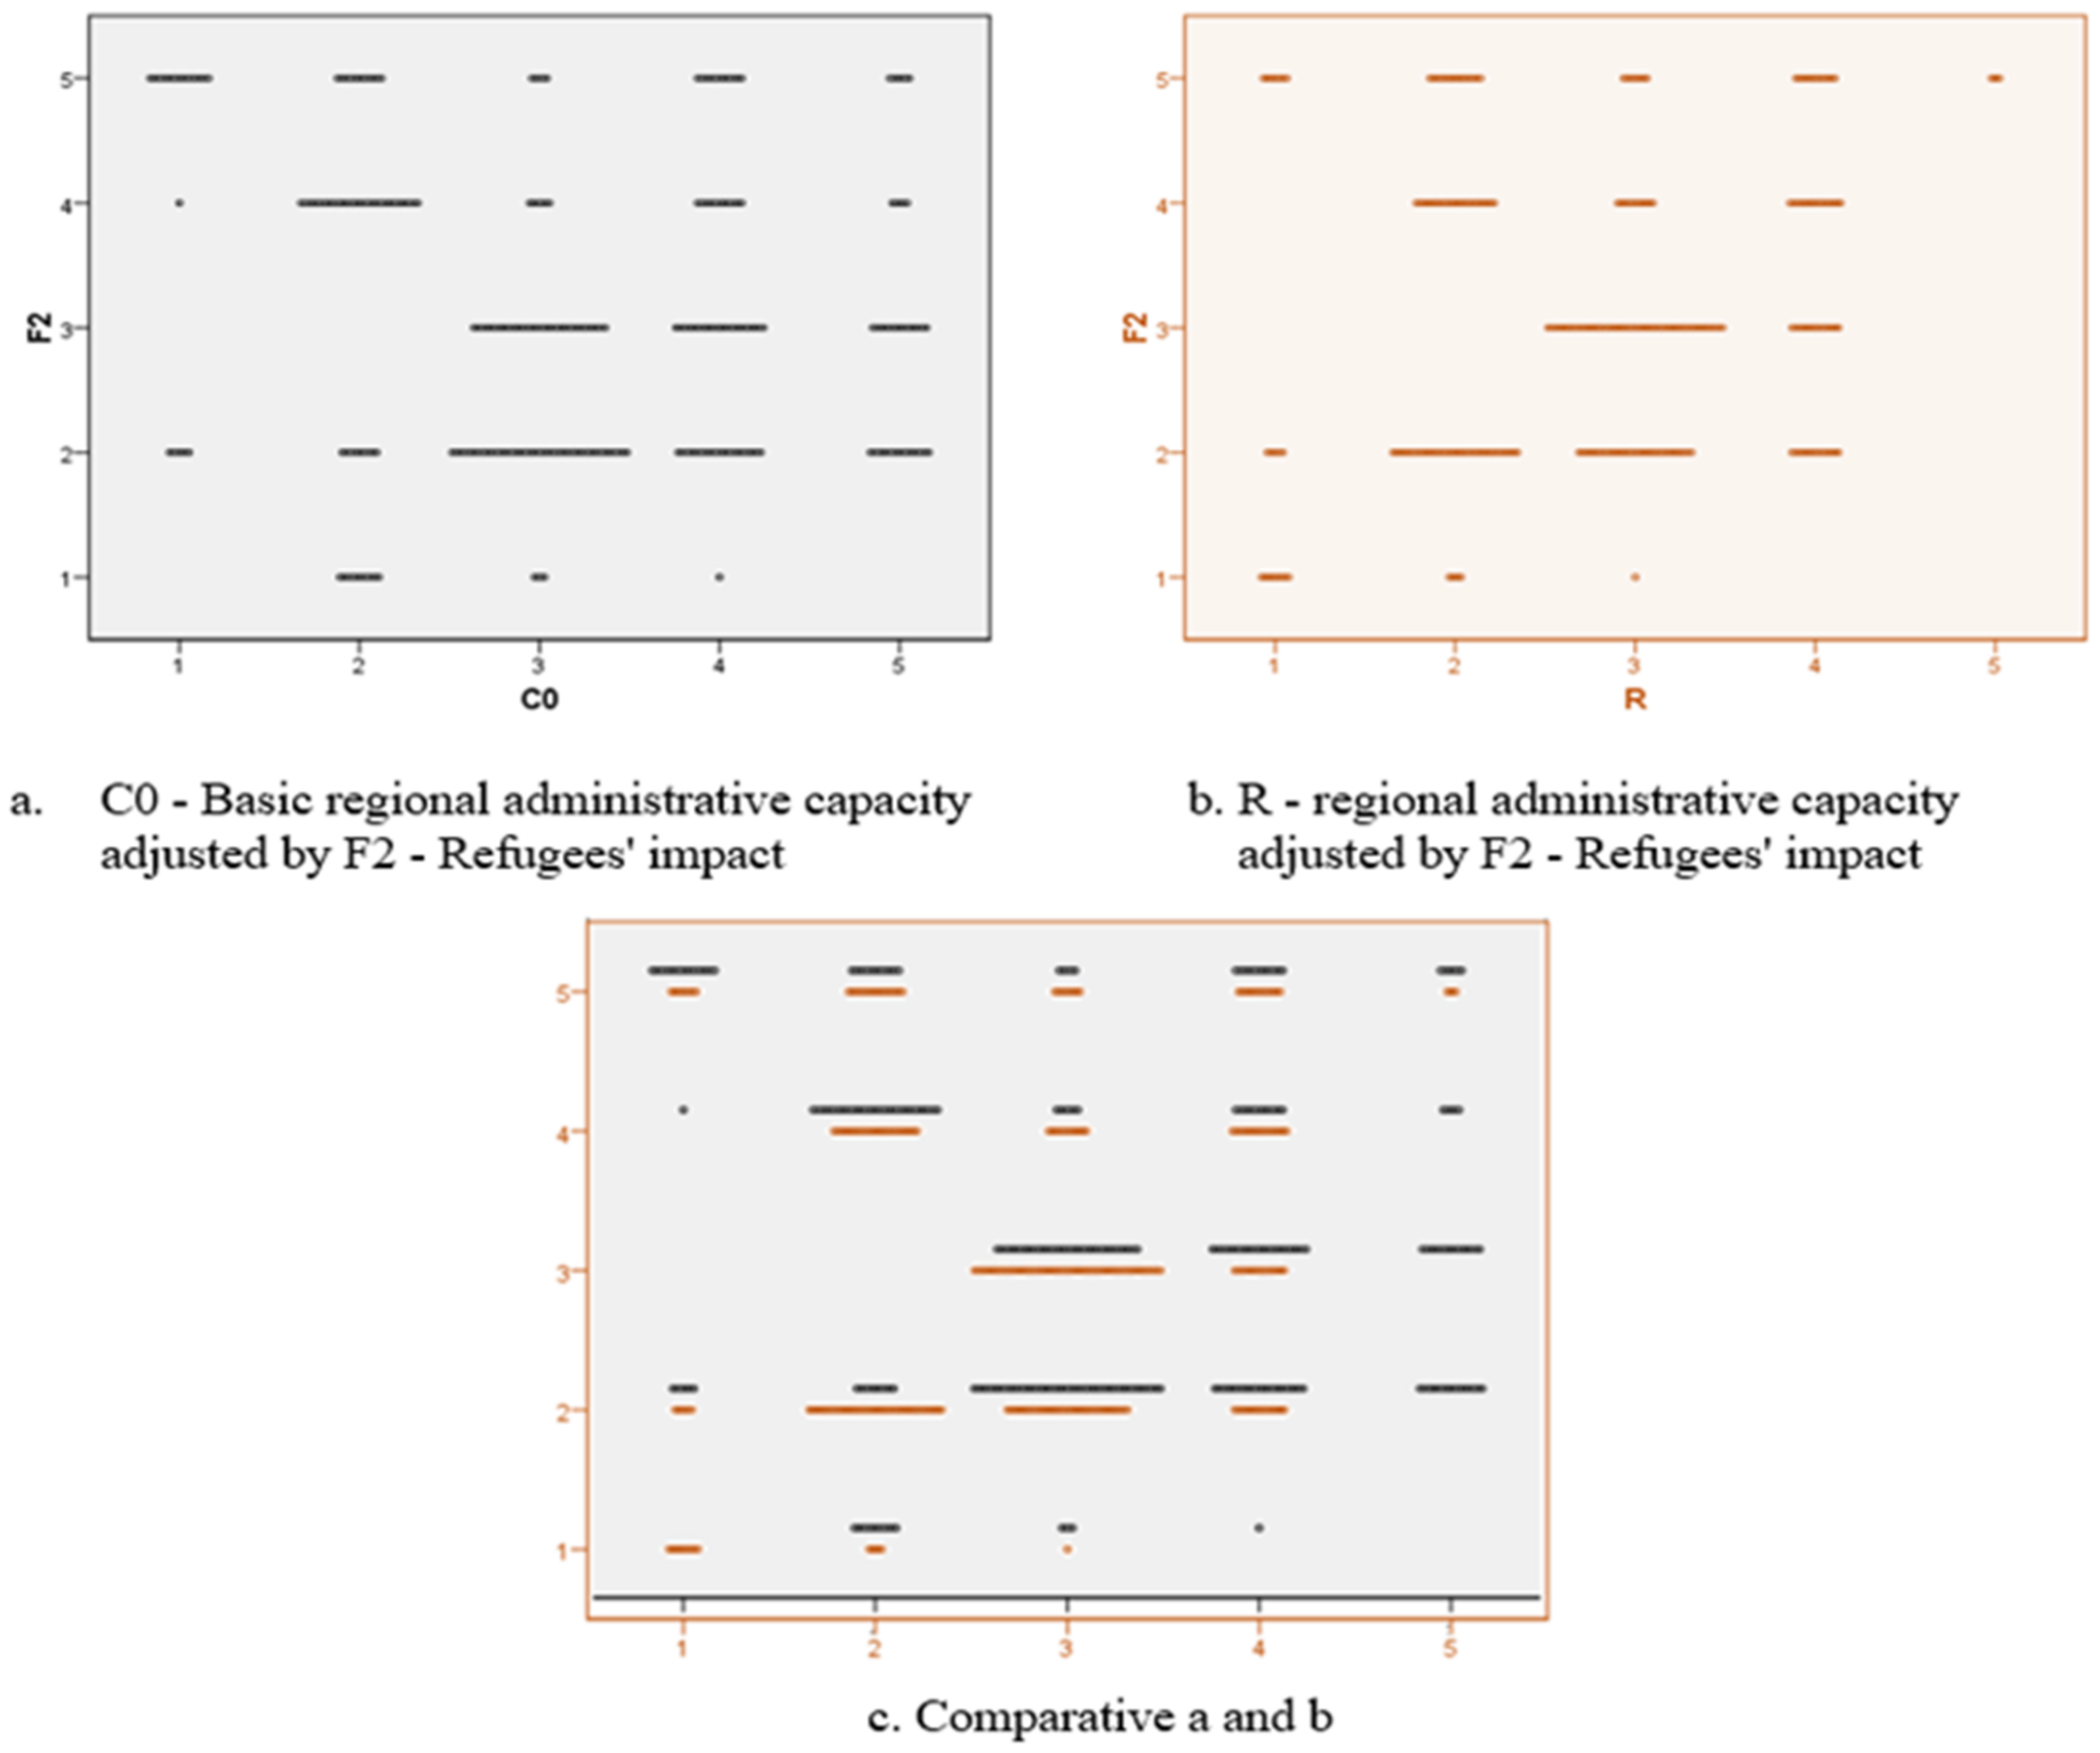
In the case of factor F2 (the impact of refugees), there is a major impairment of administrative capacity for those regional units whose basic administrative capacity C0 registers scalar values in the critical interval (1–2). It can be seen from the figure below (Figure 10) that the administrative capacities that had higher positions in the scalar ranking preceded by the crisis will not be significantly affected by the phenomenon, except the declassification from the maximum category to category.
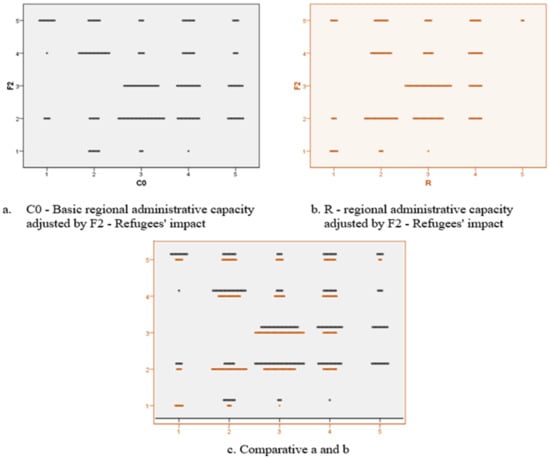
Figure 10.
Two-dimensional plot diagram for analysing the C0-R variables in relation to F2.
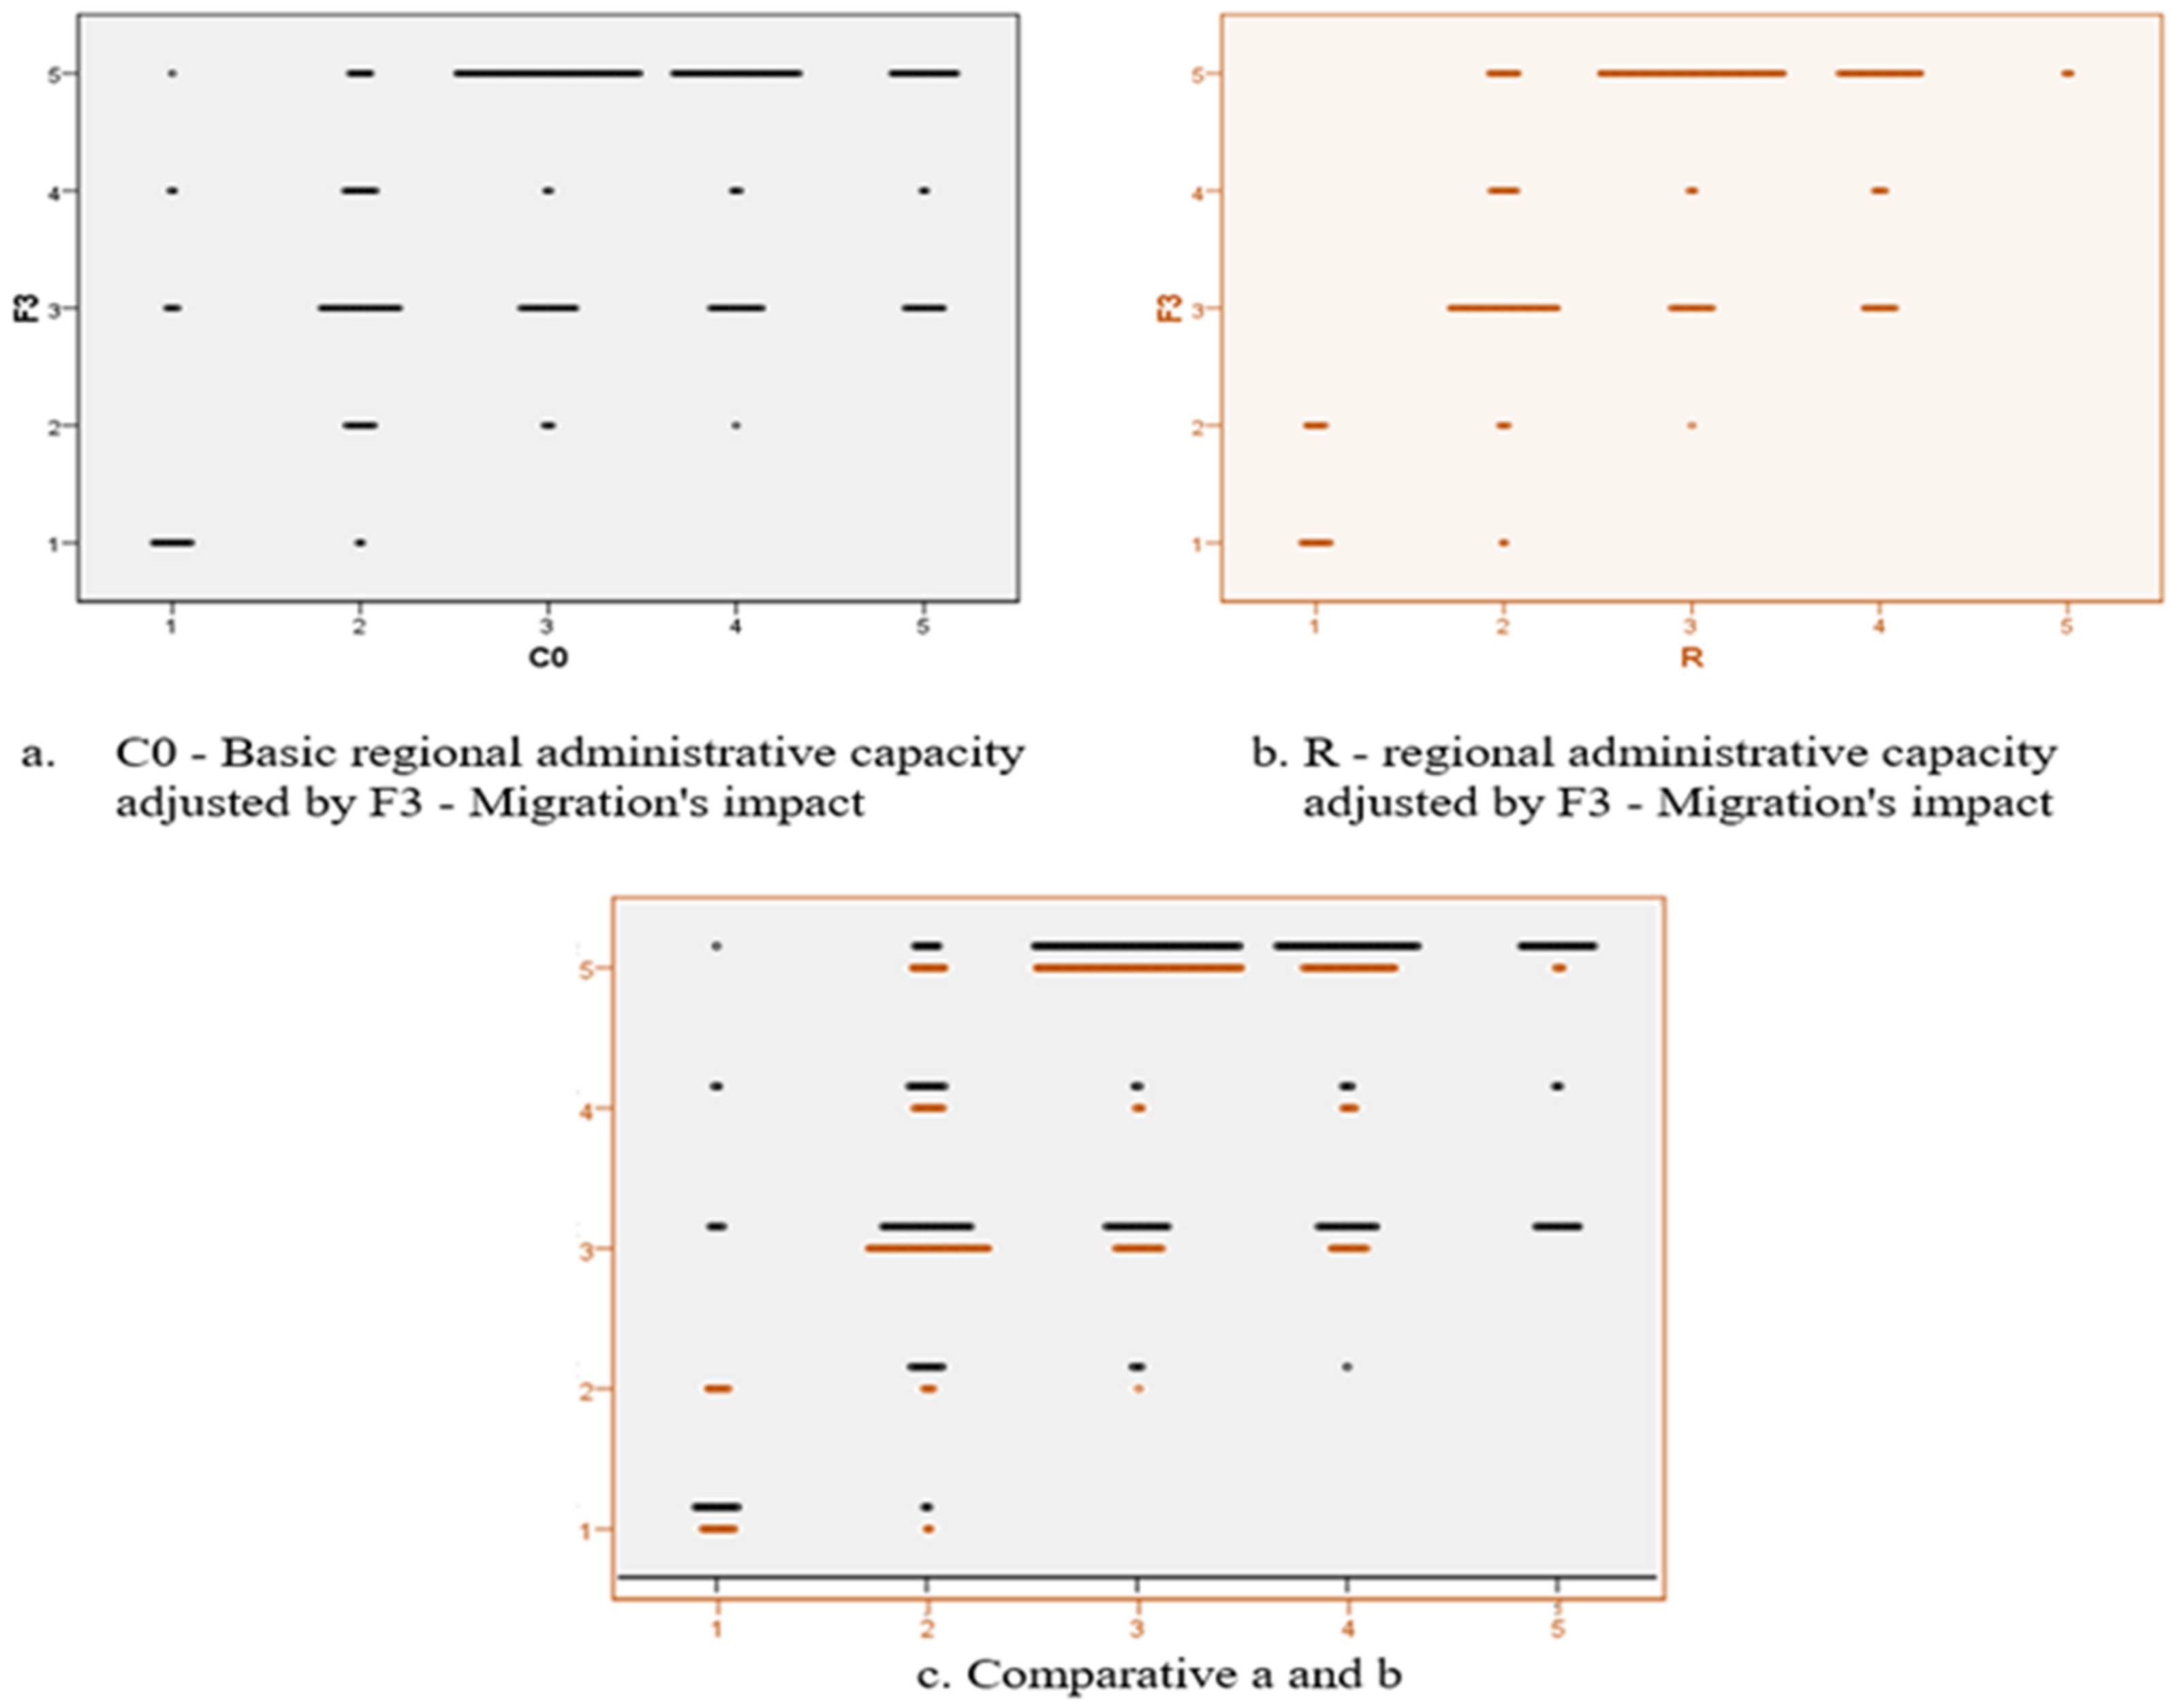
A situation similar to the F2 phenomenon, but with a high impact in the area of the average declassification of the regional administrative capacities, is the phenomenon of the migration of European citizens inside the community space. On the upper segment, the analysis does not involve significant disturbances (see Figure 11).
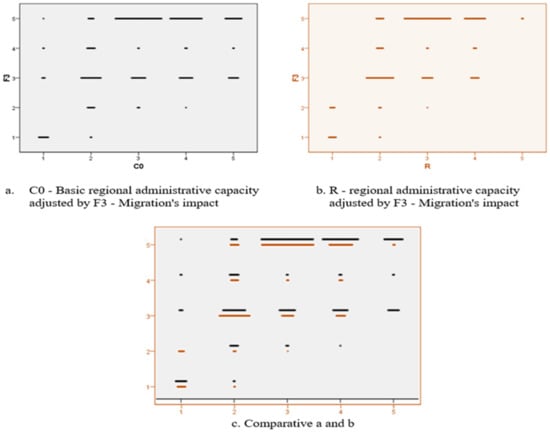
Figure 11.
Two-dimensional plot diagram for analysing the C0-R variables in relation to F3.
The F4 and F1 factors are the real challenges for the current European context. In the case of F4, there is an increase in the vulnerabilities of the regional administrative capacity both for the regions in the upper echelon and for those in administrative difficulty, because the COVID-19 pandemic socially affects the regions in which it is triggered and requires economic support measures for liquidation of its propagation. According to Figure 12, a translation of the adjusted scalar value F4 of the administrative capacity against the background of the pandemic in the upper echelon is observed, and a maximization of the reduced values for the administrative capacities already in difficulty, according to C0.
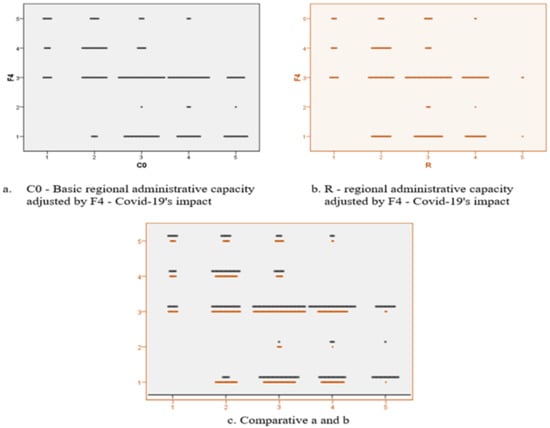
Figure 12.
Two-dimensional plot diagram for analysing the C0-R variables in relation to F4.
The second objective of the study aims to evaluate the reaction of the administrative units according to their capacity in the economic problems in the region, in the sense of improving the performance of the regional economies.
The aspects discussed in the case of the F1 impact (economic crisis) are likely to recommend for the crisis period the implementation of specific measures to increase the regional administrative capacity through proactive methods of supporting the economy, including the improvement of the administrative apparatus relationship with the business environment, creating some databases for connecting small producers with communities that can generate demand for goods and services, setting up e-commerce platforms managed by economic levers to help SMEs, creating a mechanism of decision-making transparency through online portals to help the economic entities affected by the crisis and the improvement and intensification of the activity of the unemployment offices in order to redistribute the surplus of labour on the market affected by the crisis.
Following the regression of correlation analysis of the administrative capacity variable in relation to the impact factor F2, the need to adopt at the EU level some measures to help the affected regions by primary migration was identified, in order to provide technical and financial assistance for weighting the migration phenomenon in the affected areas and to provide superior management of the situation. In this regard, some projects of social insertion and the elimination of any kind of discrimination can be primarily directed to the areas identified as having difficulties, these areas being represented graphically and in the Figure A1 in the Appendix A.
From the analysis of the community migration impact, we found that there is an impairment of the administrative capacity of the reduced impact model (as shown by the model presented in Section 4), on which it was determined that F3 has a low impact in relation to the other factors (p-value having the highest coefficient according to the statistical tests performed by modelling). In practice, there is a latent labour demand in the developed regional economies for the primary and secondary sectors; however, community migration is not represented only by the active labour, and there is a population that, due to conjugate factors, fails to reach the developed region and to integrate into the labour market, becoming a social burden for the new region. This population segment represents a real challenge for the regional economies, which will have to identify, in times of economic crisis, real possibilities of engaging them in economic activity, based on the fact that this segment of population that is uninsured and unable to contribute to the regional economy will be at the forefront of potential social conflicts.
The COVID-19 pandemic represents an unprecedented global challenge that has led to a major rate of disease and death among the population, especially the aging population. The cumulative administrative burden cannot be managed in this regional context, with many Member States adopting national strategies and declaring a state of national emergency to prevent the spread of the disease.
The first major effect of the pandemic is the short-circuiting of the health system, given that it was not designed to cope with such a pandemic. At the same time, a food and disinfectant crisis can be induced successively, which raises challenges for the big regional units in order to ensure the optimal conditions of hygiene and health for the regional population in public areas, public transport and in spaces destined for commercial activities.
Some of the regions with low C0 values (the NE region of Romania, for example) encountered, at the outbreak of the pandemic, major problems in the management of the three disruptive factors, which required the institutionalized intervention of the armed forces, and of the ministry of internal affairs to manage the situation, which had escaped control in the region and was resolved with a far greater number of victims than the national average.
6. Conclusions
The study carried out in this paper constitutes, by the amplitude of the analysed phenomenon and by the proposed model, a step forward for forecasting the need to strengthen the regional administrative capacity in European space, and it is intended to be a useful tool for competent bodies in the management of the territorial level.
The authors intend to use the results of this research to conduct a further regional impact study, which offers concrete solutions to regional decision makers, in order to efficiently manage the current crisis and its consequences in the short and medium term.
Following the study, it was found that it is necessary to implement immediate economic recovery measures according to the ones presented in the Discussion section, measures that should be integrated into regional plans with economic–administrative specificity.
The results of the present study can be implemented in order to increase the effectiveness of public policies at the regional and local level in the fight against the negative impact of the pandemic on society.
From our point of view, the local and regional public administrations should establish best-practice models in the fight against the effects of COVID-19, and should increase administrative capacity. A starting point in this approach can be the monitoring of the indicators proposed in this paper, and the adoption of an adaptive policy such as the one we have formulated.
The limitations of the study include the introduction of a restricted number of disturbing factors, but the proposed model allows us to remedy this disadvantage by introducing other variables into the analysis.
Author Contributions
Conceptualization, R.-V.I. and V.M.A.; methodology, R.-V.I. and M.L.Z.; validation, R.-V.I., M.L.Z. and V.M.A.; formal analysis, V.M.A.; investigation, R.-V.I. and M.L.Z.; resources, V.M.A.; data curation, M.L.Z.; writing—original draft preparation, R.-V.I. and M.L.Z.; writing—review and editing, M.L.Z. and V.M.A.; visualization, V.M.A.; supervision, R.-V.I. All authors have read and agreed to the published version of the manuscript.
Funding
This research received no external funding.
Institutional Review Board Statement
Not applicable.
Informed Consent Statement
Not applicable.
Data Availability Statement
We used public data from Eurostat and the World Health Organization.
Conflicts of Interest
The authors declare no conflict of interest.
Appendix A
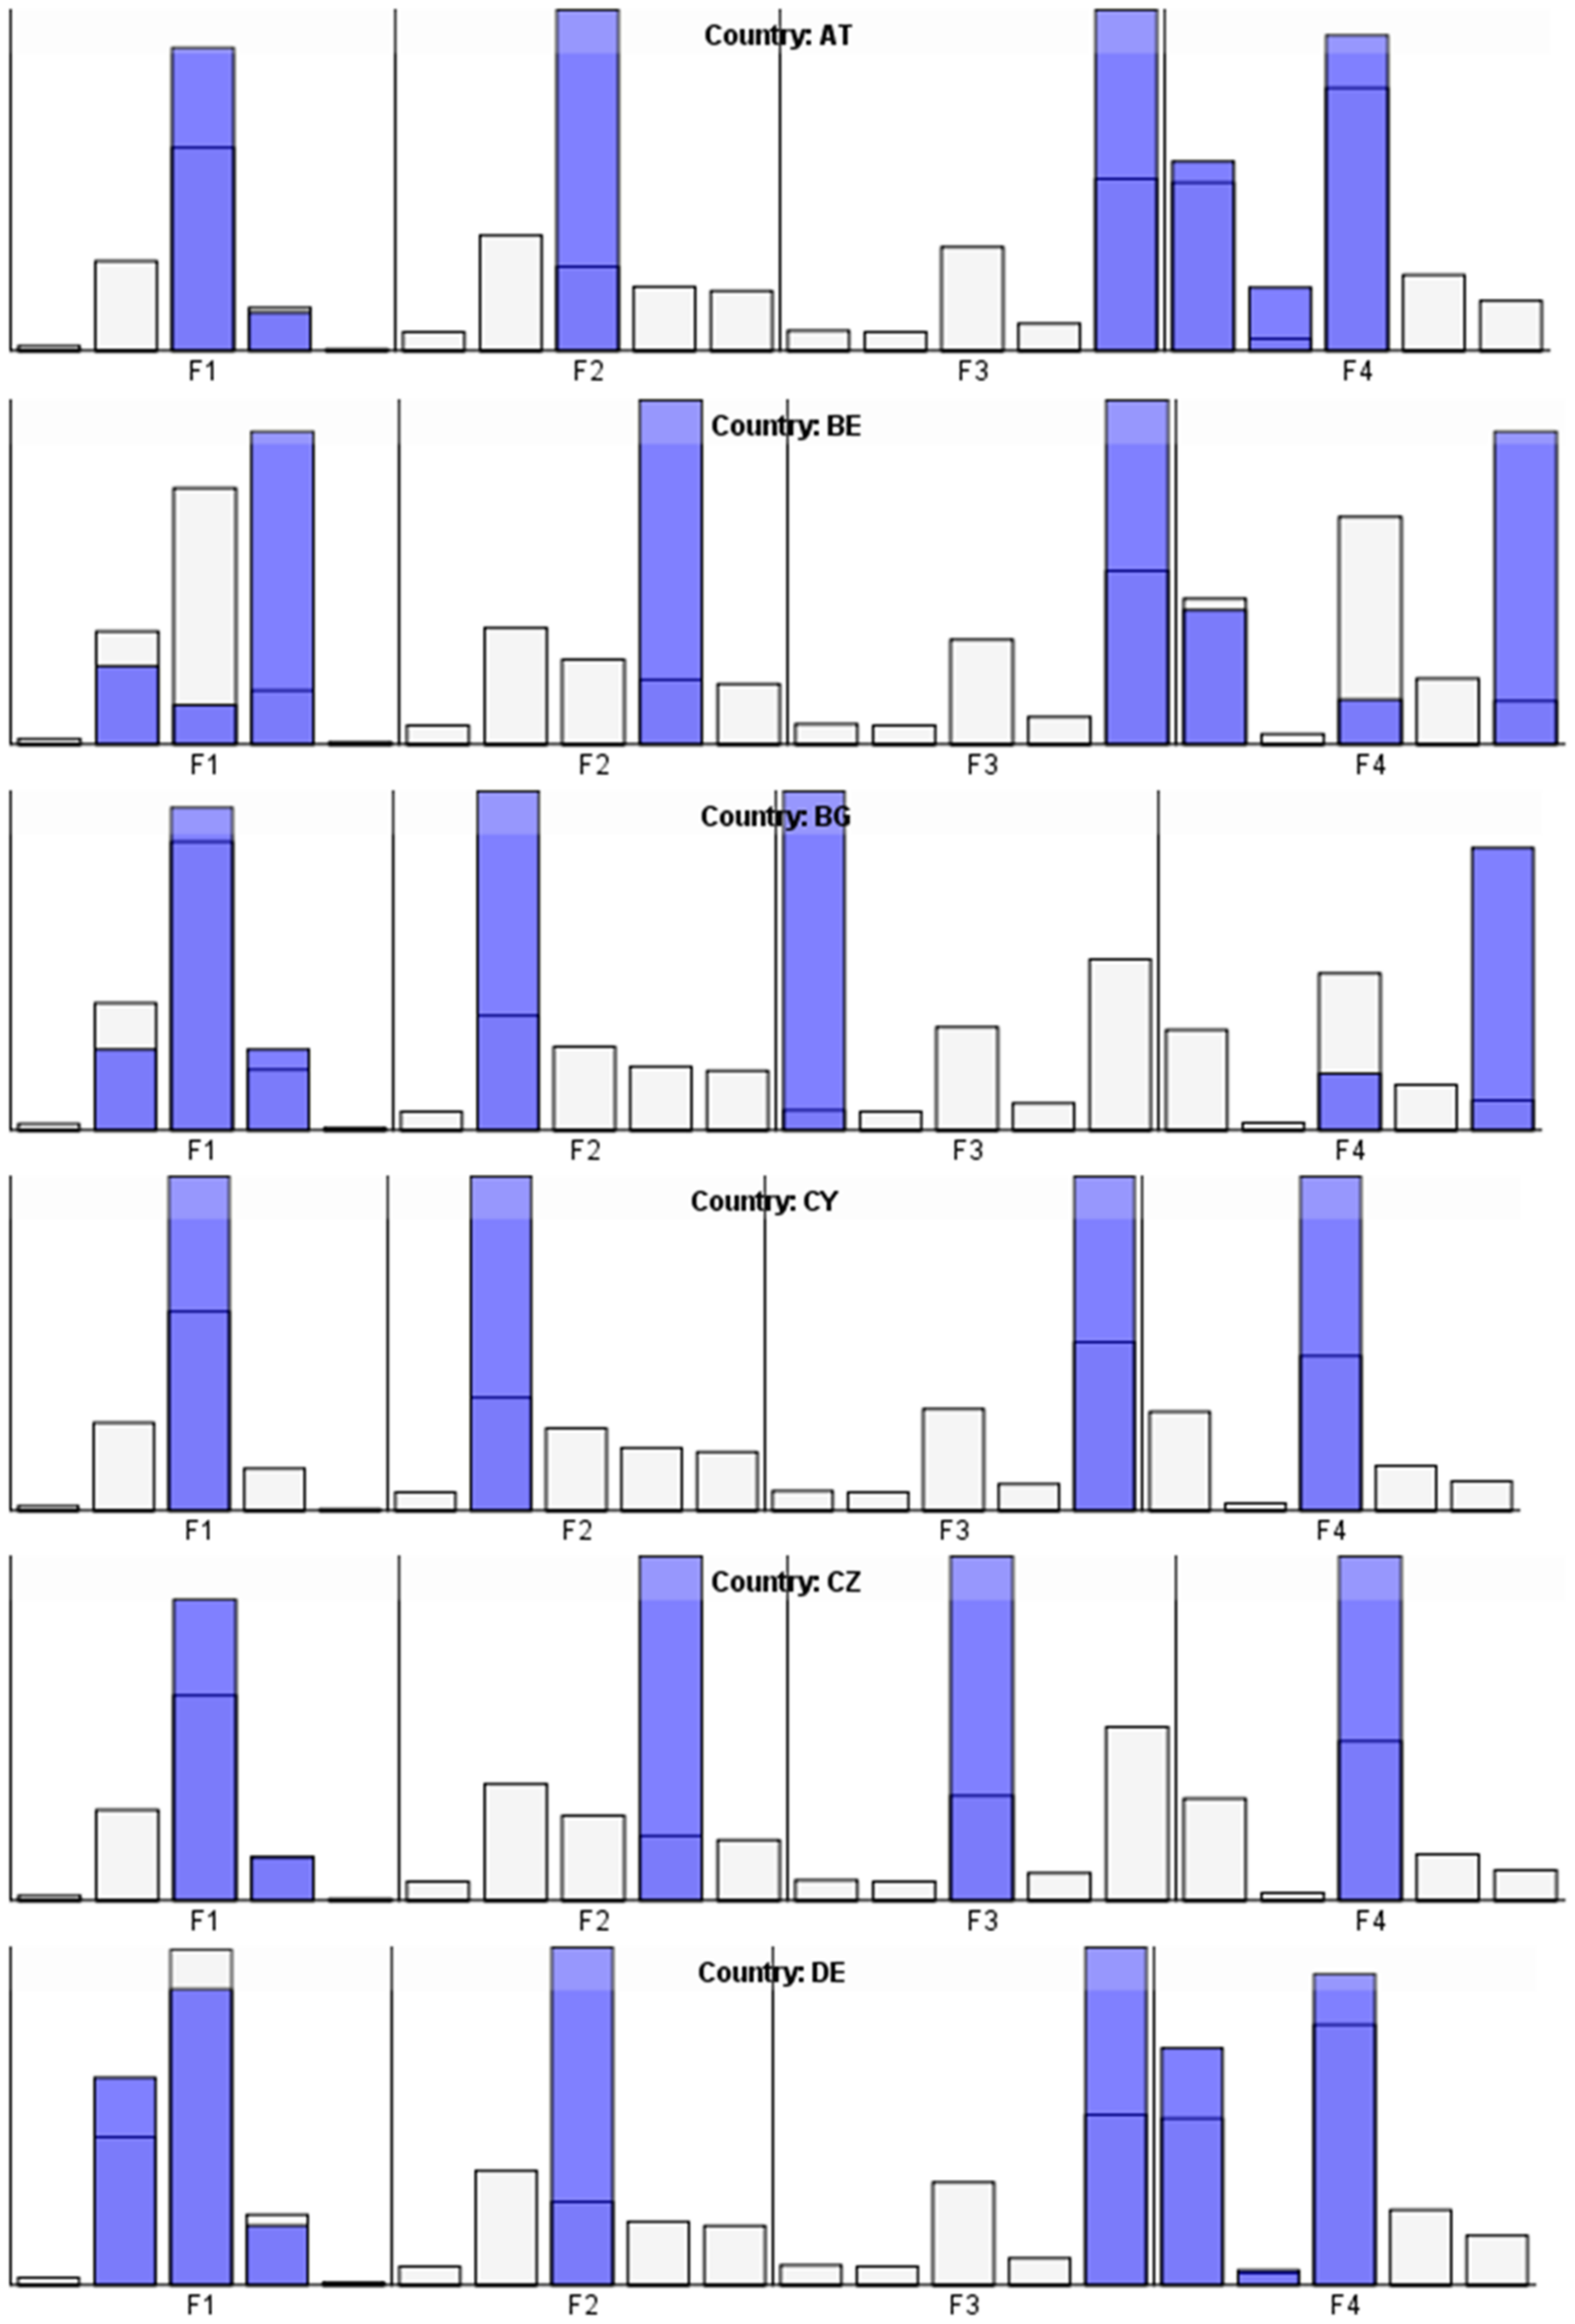
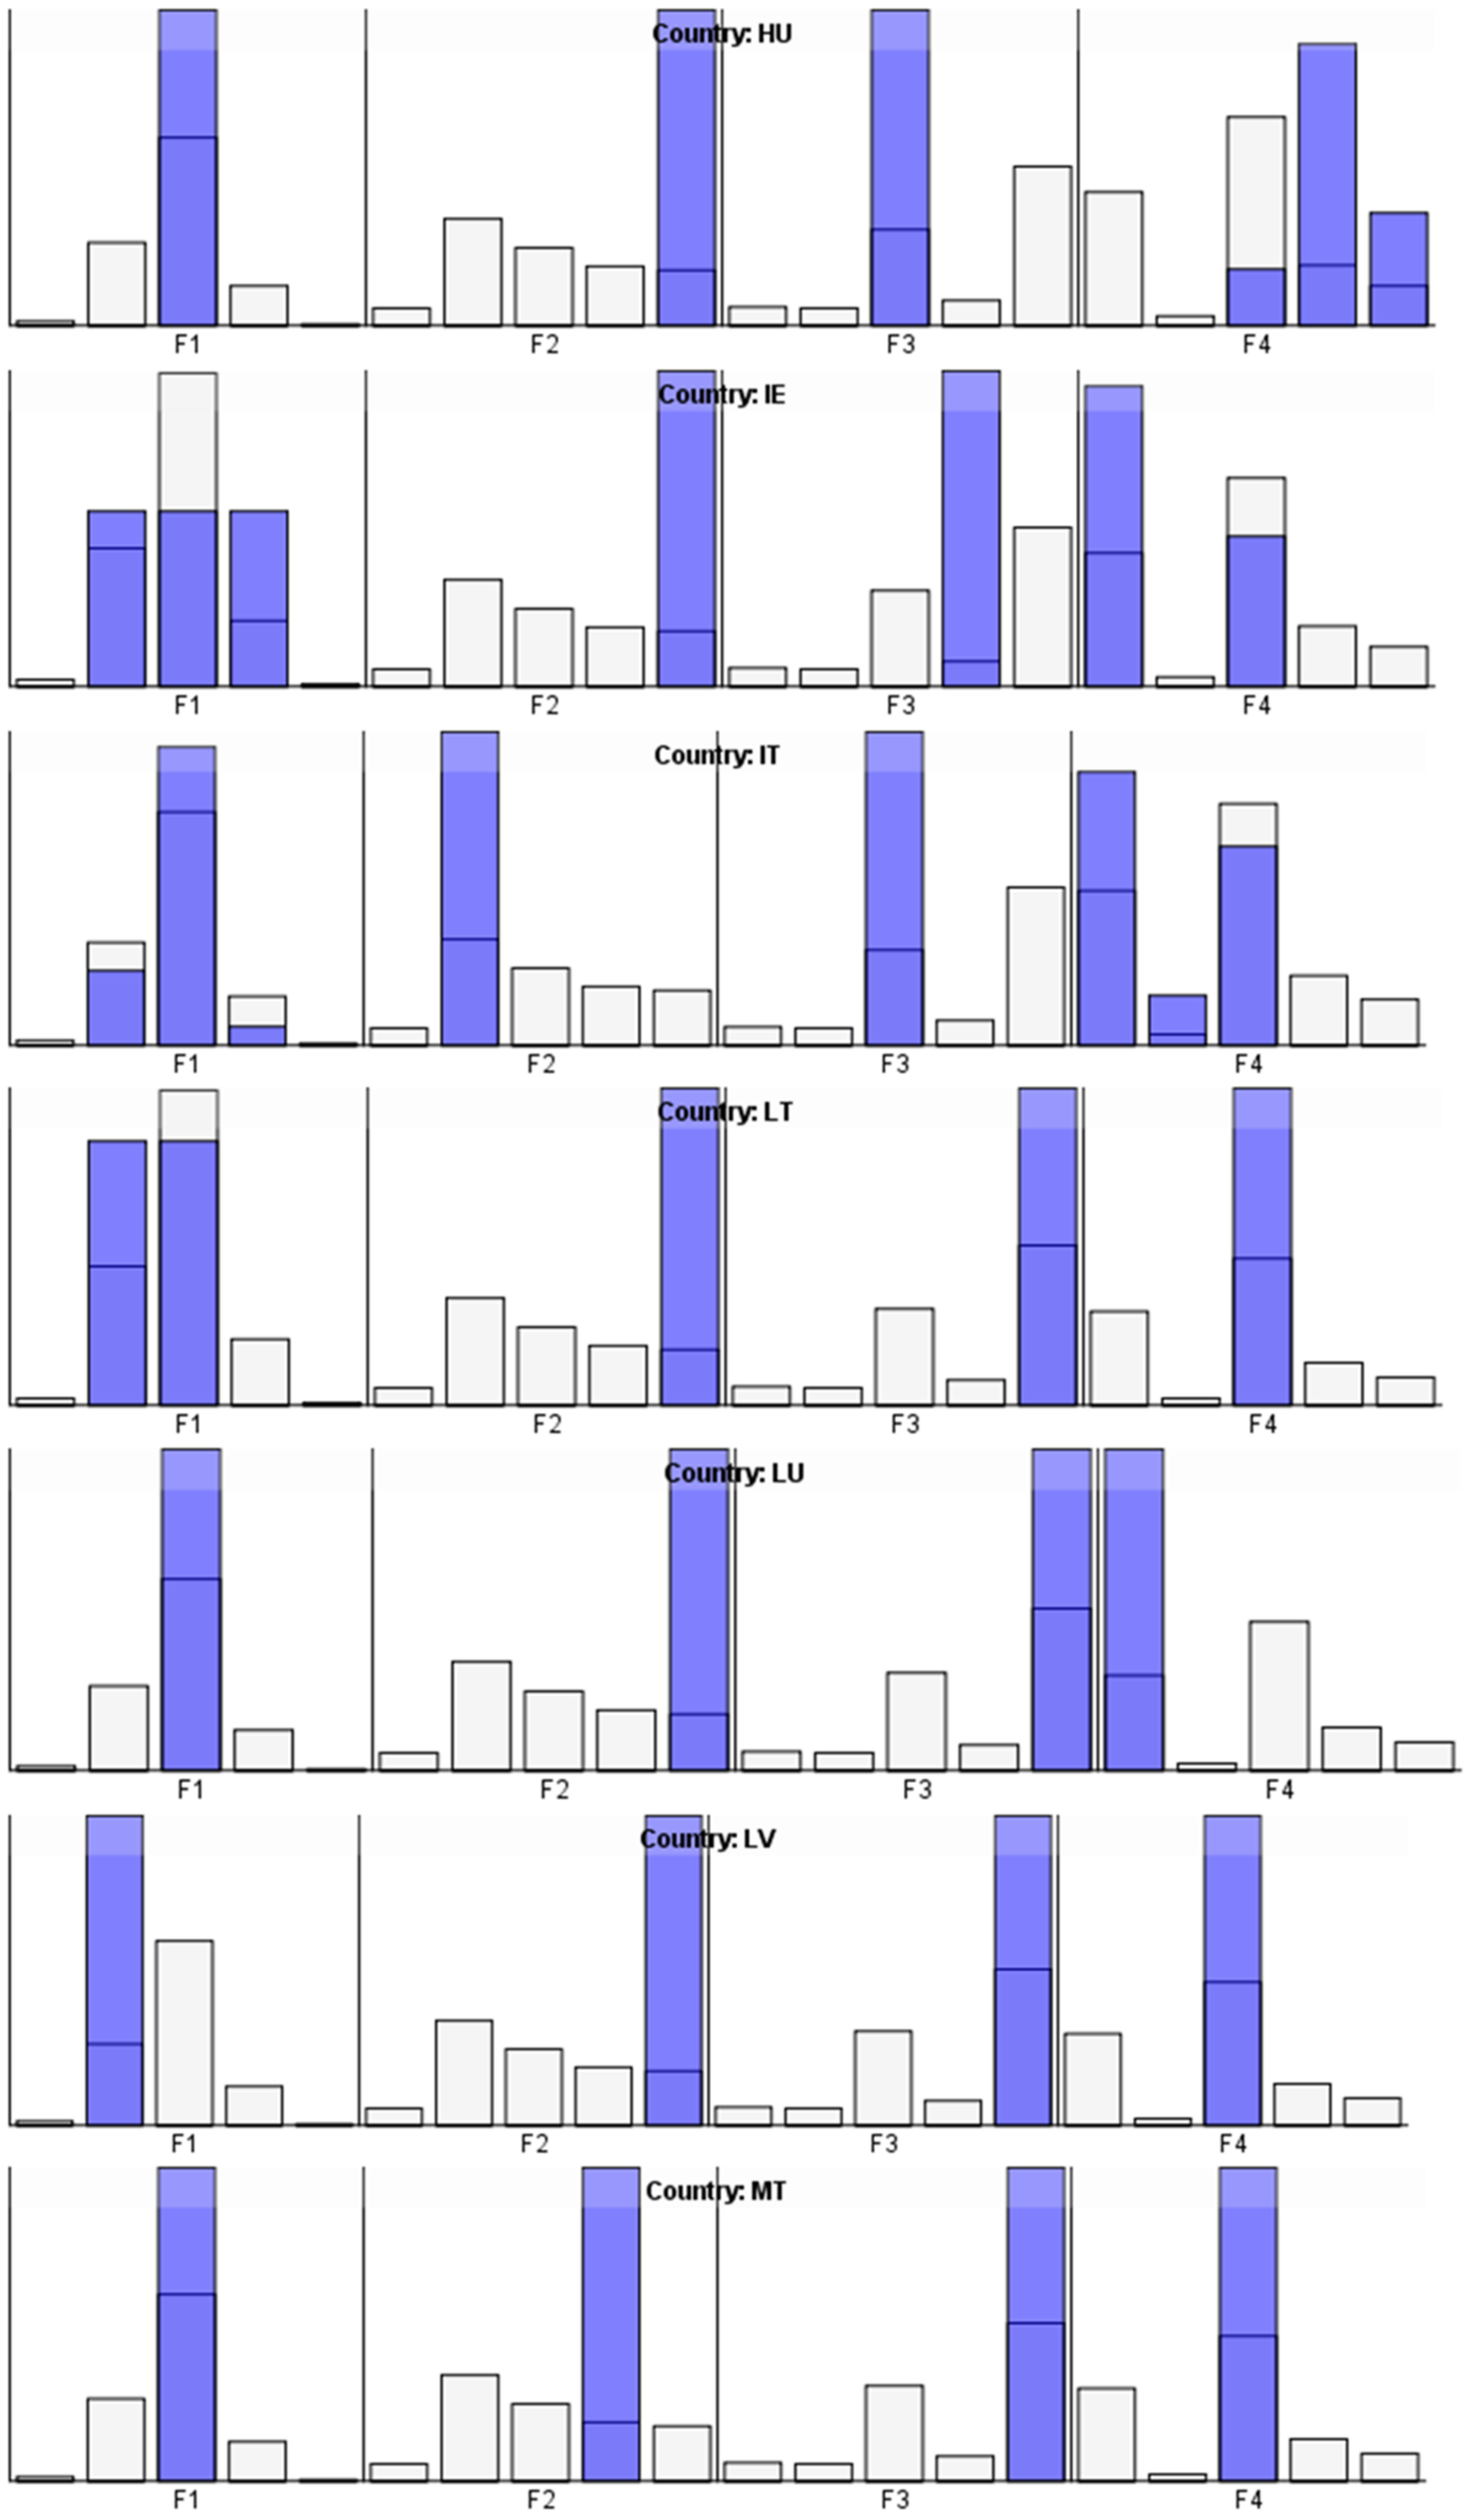
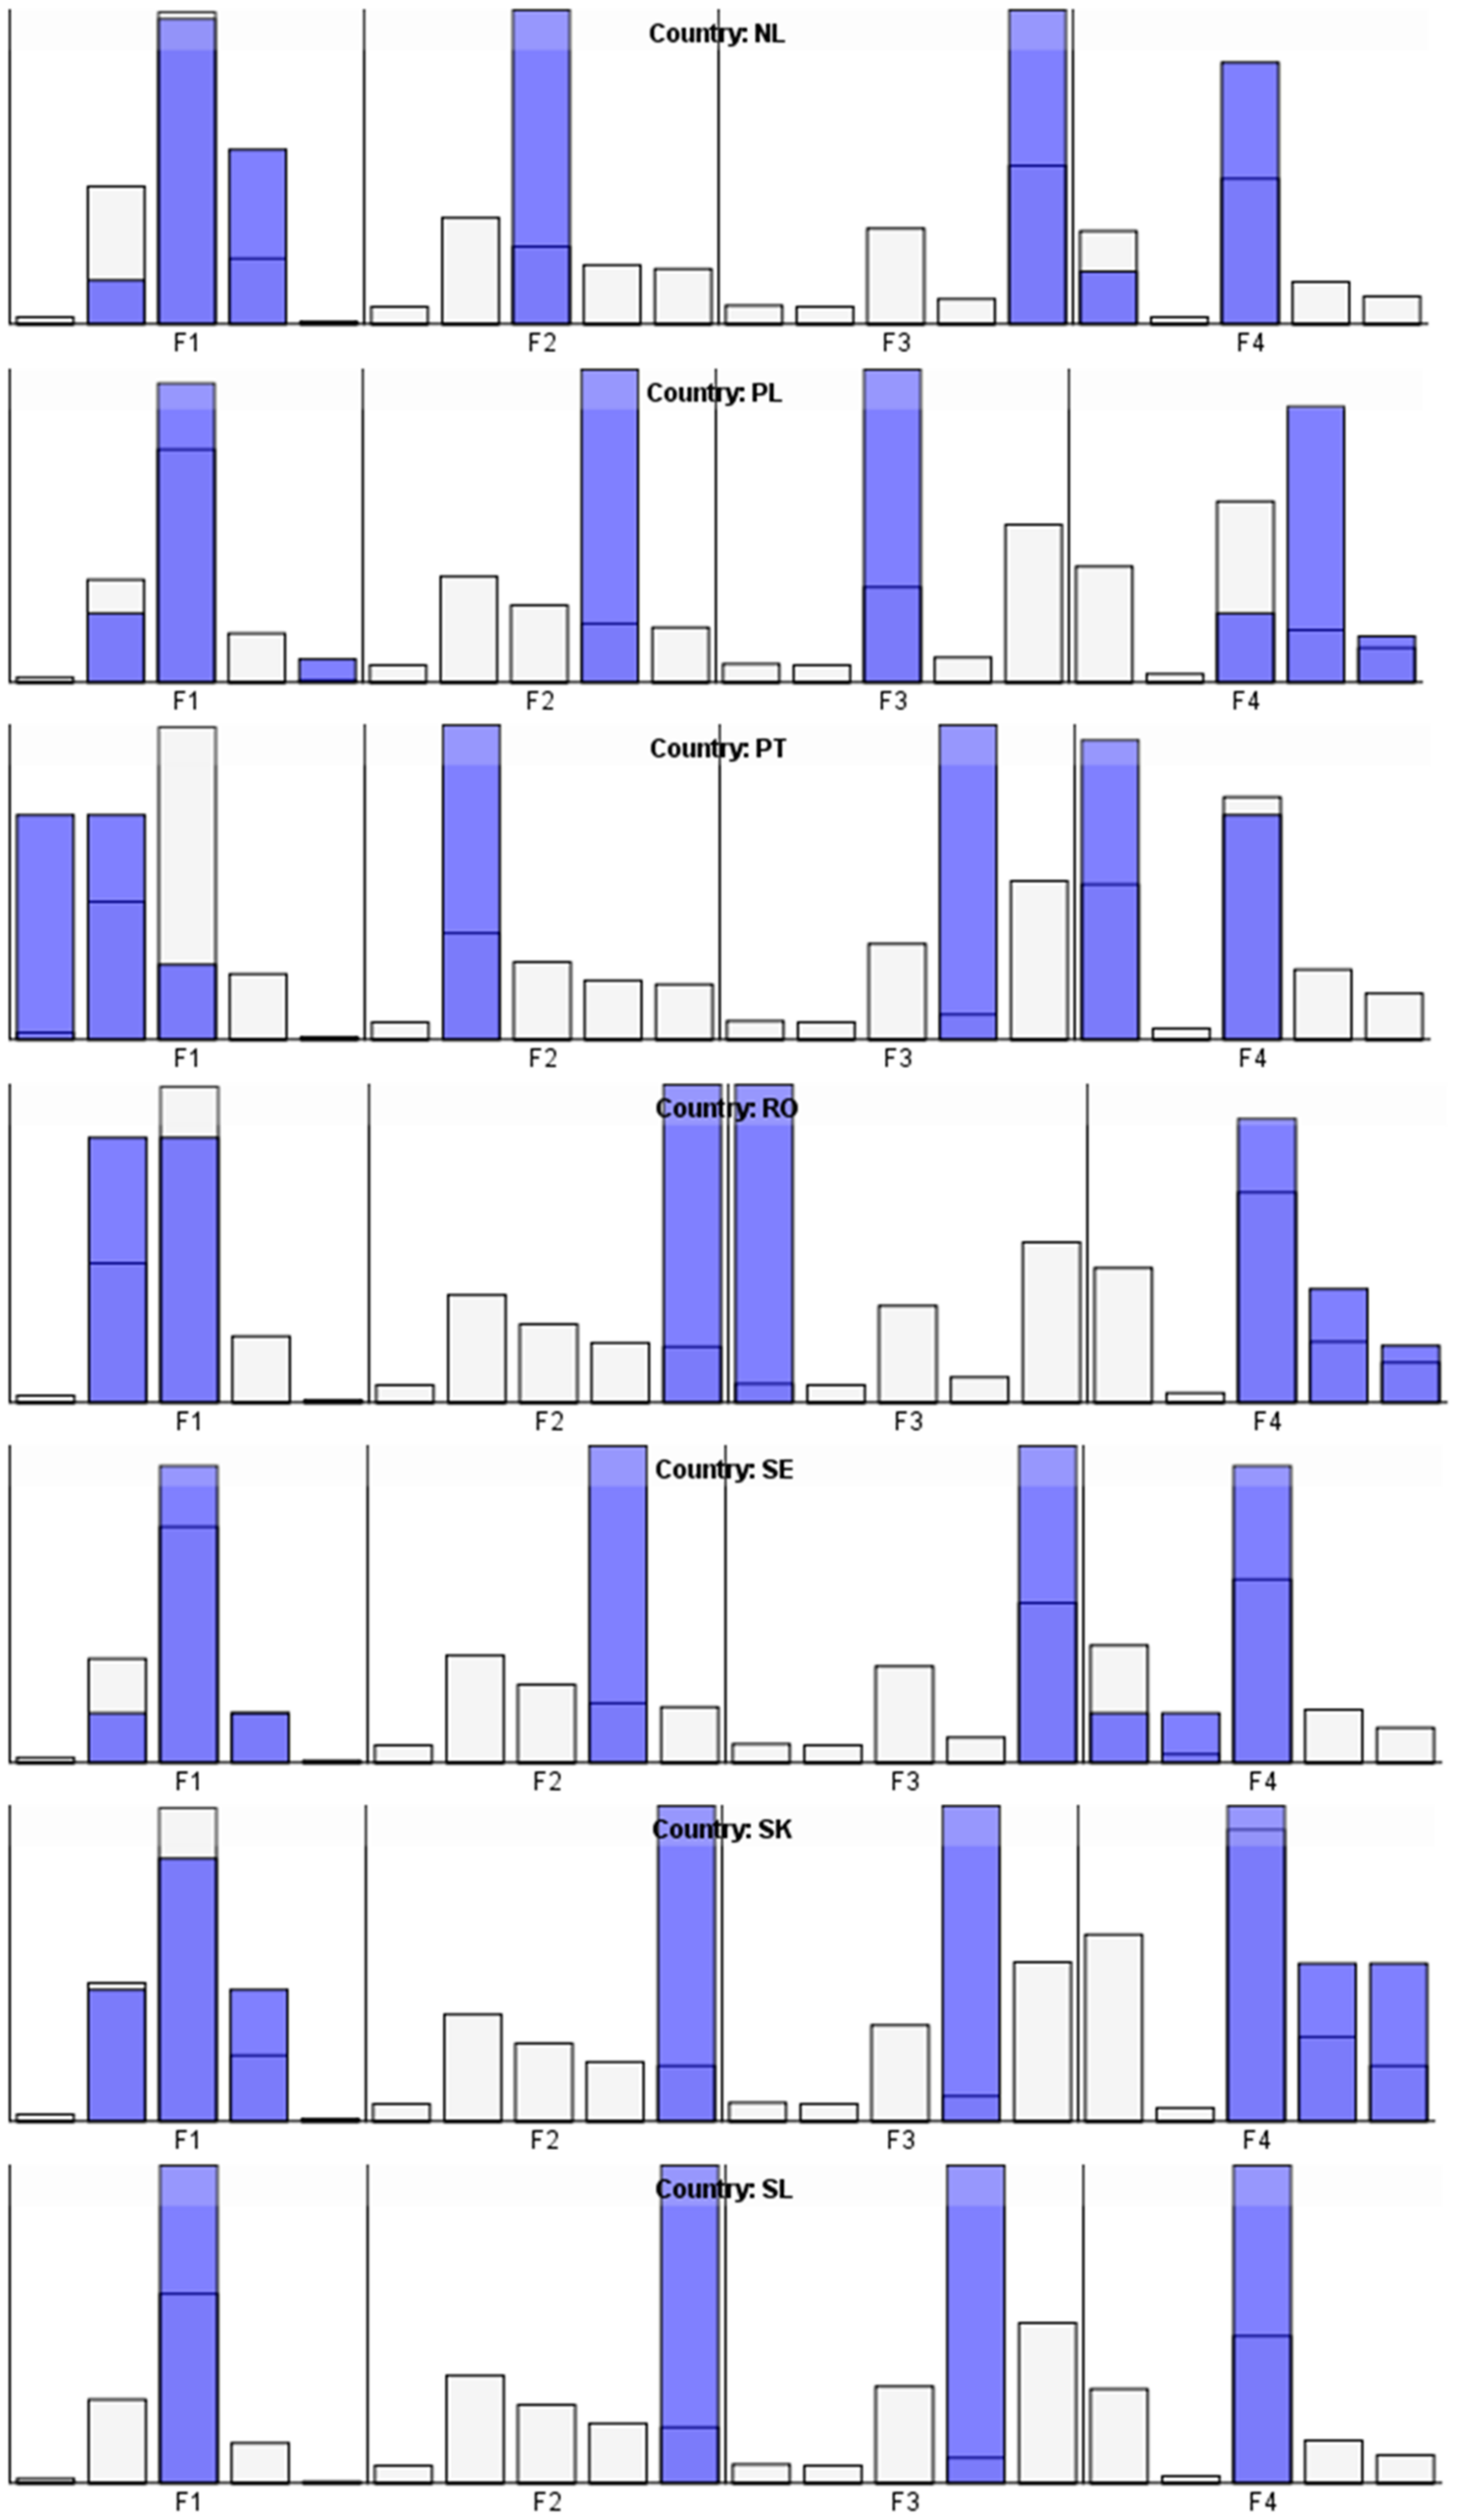
Distribution of the scalar values of the disturbing factors across the Member States, and their impact on regional administrative capacity.
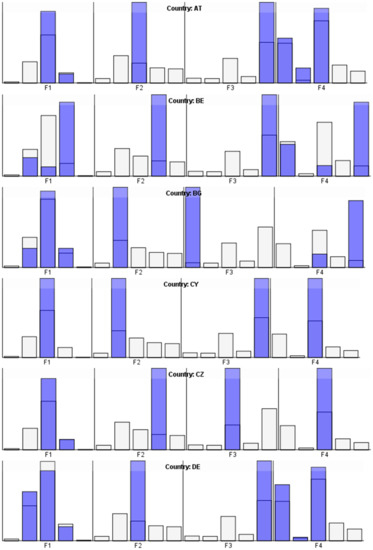
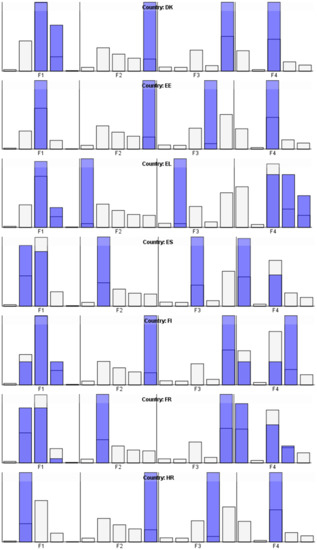
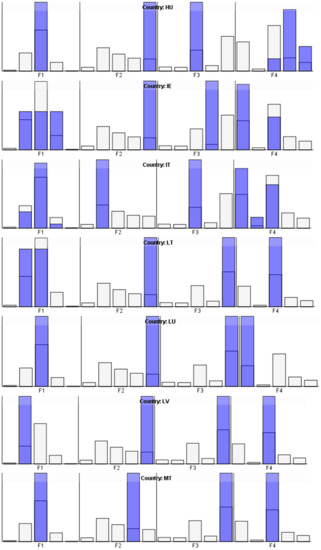
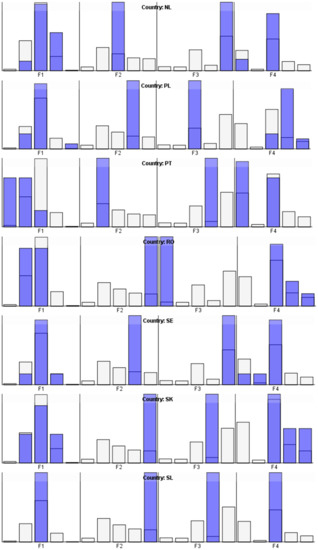
Figure A1.
F1—Economic crisis’ impact; F2—Refugees’ impact; F3—Migration’s impact; F4—COVID-19’s impact.
Figure A1.
F1—Economic crisis’ impact; F2—Refugees’ impact; F3—Migration’s impact; F4—COVID-19’s impact.

Appendix B
Table A1.
COVID-19’s impact on NUTS 2 regions.
Table A1.
COVID-19’s impact on NUTS 2 regions.
| Regions | COVID-19 Region Cases | Population on 1 January 2019 by NUTS 2 Region | COVID-19 Rate | COVID-19 Scalar | Regions | COVID-19 Region Cases | Population on 1 January 2019 by NUTS 2 Region | COVID-19 Rate | COVID-19 Scalar |
|---|---|---|---|---|---|---|---|---|---|
| Région de Bruxelles/Brussels | 2352 | 1,215,290 | 0.19% | 1 | Languedoc-Roussillon | 4150 | 2,838,966 | 0.15% | 1 |
| Antwerpen | 363 | 1,860,470 | 0.02% | 3 | Midi-Pyrénées | 4480 | 3,060,243 | 0.15% | 1 |
| Limburg | 0 | 875,842 | 0.00% | 5 | Auvergne | 1990 | 1,362,576 | 0.15% | 1 |
| Oost-Vlaanderen | 0 | 1,516,283 | 0.00% | 5 | Rhône-Alpes | 5720 | 6,643,306 | 0.09% | 3 |
| Vlaams-Brabant | 0 | 1,146,643 | 0.00% | 5 | Provence-Alpes-Côte d’Azur | 7380 | 5,048,405 | 0.15% | 1 |
| West-Vlaanderen | 0 | 1,196,995 | 0.00% | 5 | Corse | 225 | 341,554 | 0.07% | 3 |
| Brabant wallon | 5809 | 404,270 | 1.44% | 1 | Guadeloupe | 76 | 416,474 | 0.02% | 3 |
| Hainaut | 0 | 1,346,082 | 0.00% | 5 | Martinique | 66 | 363,484 | 0.02% | 3 |
| Liège | 12,289 | 1,110,068 | 1.11% | 1 | Guyane | 28 | 283,539 | 0.01% | 4 |
| Luxembourg | 0 | 286,685 | 0.00% | 5 | La Réunion | 94 | 857,961 | 0.01% | 4 |
| Namur | 0 | 496,891 | 0.00% | 5 | Mayotte | 35 | 269,471 | 0.01% | 4 |
| Severozapaden | 588 | 742,304 | 0.08% | 3 | Jadranska Hrvatska | 611 | 1,374,071 | 0.04% | 3 |
| Severen tsentralen | 0 | 784,168 | 0.00% | 5 | Kontinentalna Hrvatska | 671 | 2,702,175 | 0.02% | 3 |
| Severoiztochen | 0 | 929,035 | 0.00% | 5 | Piemonte | 13,343 | 4,356,406 | 0.31% | 1 |
| Yugoiztochen | 0 | 1,032,079 | 0.00% | 5 | Valle d’Aosta | 835 | 125,666 | 0.66% | 1 |
| Yugozapaden | 0 | 2,102,205 | 0.00% | 5 | Liguria | 4757 | 1,550,640 | 0.31% | 1 |
| Yuzhen tsentralen | 0 | 1,410,248 | 0.00% | 5 | Lombardia | 52,325 | 10,060,574 | 0.52% | 1 |
| Praha | 1234 | 1,308,632 | 0.09% | 3 | Provincia Autonoma di Bolzano | 1811 | 531,178 | 0.34% | 1 |
| Strední Cechy | 606 | 1,369,332 | 0.04% | 3 | Provincia Autonoma di Trento | 2476 | 541,098 | 0.46% | 1 |
| Jihozápad | 298 | 1,226,805 | 0.02% | 3 | Veneto | 11,925 | 4,905,854 | 0.24% | 1 |
| Severozápad | 278 | 1,115,685 | 0.02% | 3 | Friuli-Venezia Giulia | 2153 | 1,215,220 | 0.18% | 1 |
| Severovýchod | 1300 | 1,513,693 | 0.09% | 3 | Emilia-Romagna | 17,825 | 4,459,477 | 0.40% | 1 |
| Jihovýchod | 334 | 1,696,941 | 0.02% | 3 | Toscana | 6173 | 3,729,641 | 0.17% | 1 |
| Strední Morava | 450 | 1,215,413 | 0.04% | 3 | Umbria | 1263 | 882,015 | 0.14% | 2 |
| Moravskoslezsko | 506 | 1,203,299 | 0.04% | 3 | Marche | 4710 | 1,525,271 | 0.31% | 1 |
| Hovedstaden | 1901 | 1,835,562 | 0.10% | 3 | Lazio | 4149 | 5,879,082 | 0.07% | 3 |
| Sjælland | 203 | 836,738 | 0.02% | 3 | Abruzzo | 1799 | 1,311,580 | 0.14% | 2 |
| Syddanmark | 472 | 1,223,348 | 0.04% | 3 | Molise | 224 | 305,617 | 0.07% | 3 |
| Midtjylland | 584 | 1,320,678 | 0.04% | 3 | Campania | 3148 | 5,801,692 | 0.05% | 3 |
| Nordjylland | 501 | 589,755 | 0.08% | 3 | Puglia | 2514 | 4,029,053 | 0.06% | 3 |
| Stuttgart | 3189 | 4,143,418 | 0.08% | 3 | Basilicata | 291 | 562,869 | 0.05% | 3 |
| Karlsruhe | 2234 | 2,805,129 | 0.08% | 3 | Calabria | 833 | 1,947,131 | 0.04% | 3 |
| Freiburg | 2084 | 2,264,469 | 0.09% | 3 | Sicilia | 2097 | 4,999,891 | 0.04% | 3 |
| Tübingen | 7432 | 1,856,517 | 0.40% | 1 | Sardegna | 935 | 1,639,591 | 0.06% | 3 |
| Oberbayern | 2123 | 4,686,163 | 0.05% | 3 | Kypros | 494 | 875,899 | 0.06% | 3 |
| Niederbayern | 3112 | 1,238,528 | 0.25% | 1 | Latvija | 548 | 1,919,968 | 0.03% | 3 |
| Oberpfalz | 4311 | 1,109,269 | 0.39% | 1 | Sostines regionas | 412 | 810,538 | 0.05% | 3 |
| Oberfranken | 2120 | 1,067,482 | 0.20% | 1 | Vidurio ir vakaru Lietuvos regionas | 468 | 1,983,646 | 0.02% | 3 |
| Mittelfranken | 1234 | 1,770,401 | 0.07% | 3 | Luxembourg | 2970 | 613,894 | 0.48% | 1 |
| Unterfranken | 3214 | 1,317,124 | 0.24% | 1 | Budapest | 345 | 1,752,286 | 0.02% | 3 |
| Schwaben | 1245 | 1,887,754 | 0.07% | 3 | Pest | 153 | 1,278,874 | 0.01% | 4 |
| Berlin | 3670 | 3,644,826 | 0.10% | 3 | Közép-Dunántúl | 139 | 1,058,236 | 0.01% | 4 |
| Brandenburg | 2345 | 2,511,917 | 0.09% | 3 | Nyugat-Dunántúl | 86 | 989,343 | 0.01% | 4 |
| Bremen | 2811 | 682,986 | 0.41% | 1 | Dél-Dunántúl | 4 | 879,596 | 0.00% | 5 |
| Hamburg | 2993 | 1,841,179 | 0.16% | 1 | Észak-Magyarország | 82 | 1,126,360 | 0.01% | 4 |
| Darmstadt | 1121 | 3,998,724 | 0.03% | 3 | Észak-Alföld | 33 | 1,450,960 | 0.00% | 5 |
| Gießen | 1125 | 1,047,262 | 0.11% | 3 | Dél-Alföld | 70 | 1,237,101 | 0.01% | 4 |
| Kassel | 1889 | 1,219,823 | 0.15% | 1 | Malta | 293 | 493,559 | 0.06% | 3 |
| Mecklenburg-Vorpommern | 2346 | 1,609,675 | 0.15% | 1 | Groningen | 207 | 583,990 | 0.04% | 3 |
| Braunschweig | 1256 | 1,596,396 | 0.08% | 3 | Friesland | 215 | 647,672 | 0.03% | 3 |
| Hannover | 1084 | 2,149,805 | 0.05% | 3 | Drenthe | 222 | 492,167 | 0.05% | 3 |
| Lüneburg | 1111 | 1,710,914 | 0.06% | 3 | Overijssel | 1211 | 1,156,431 | 0.10% | 3 |
| Weser-Ems | 3456 | 2,525,333 | 0.14% | 2 | Gelderland | 2210 | 2,071,972 | 0.11% | 3 |
| Düsseldorf | 2412 | 5,202,321 | 0.05% | 3 | Flevoland | 264 | 416,546 | 0.06% | 3 |
| Köln | 1525 | 4,468,904 | 0.03% | 3 | Utrecht | 1476 | 1,306,912 | 0.11% | 3 |
| Münster | 3500 | 2,623,619 | 0.13% | 3 | Noord-Holland | 2891 | 2,853,359 | 0.10% | 3 |
| Detmold | 2235 | 2,055,310 | 0.11% | 3 | Zuid-Holland | 3361 | 3,709,139 | 0.09% | 3 |
| Arnsberg | 2768 | 3,582,497 | 0.08% | 3 | Zeeland | 279 | 383,032 | 0.07% | 3 |
| Koblenz | 2987 | 1,495,885 | 0.20% | 1 | Noord-Brabant | 4456 | 2,544,806 | 0.18% | 1 |
| Trier | 3456 | 531,007 | 0.65% | 1 | Limburg | 2011 | 1,116,137 | 0.18% | 1 |
| Rheinhessen-Pfalz | 1567 | 2,057,952 | 0.08% | 3 | Burgenland | 234 | 293,433 | 0.08% | 3 |
| Saarland | 4321 | 990,509 | 0.44% | 1 | Niederösterreich | 1978 | 1,677,542 | 0.12% | 3 |
| Dresden | 3189 | 1,598,199 | 0.20% | 1 | Wien | 1777 | 1,897,491 | 0.09% | 3 |
| Chemnitz | 4567 | 1,436,445 | 0.32% | 1 | Kärnten | 333 | 560,939 | 0.06% | 3 |
| Leipzig | 3111 | 1,043,293 | 0.30% | 1 | Steiermark | 1354 | 1,243,052 | 0.11% | 3 |
| Sachsen-Anhalt | 2345 | 2,208,321 | 0.11% | 3 | Oberösterreich | 2061 | 1,482,095 | 0.14% | 2 |
| Schleswig-Holstein | 2723 | 2,896,712 | 0.09% | 3 | Salzburg | 1085 | 555,221 | 0.20% | 1 |
| Thüringen | 3456 | 2,143,145 | 0.16% | 1 | Tirol | 2804 | 754,705 | 0.37% | 1 |
| Eesti | 1149 | 1,324,820 | 0.09% | 3 | Vorarlberg | 764 | 394,297 | 0.19% | 1 |
| Northern and Western | 1389 | 867,947 | 0.16% | 1 | Malopolskie | 1247 | 3,360,545 | 0.04% | 3 |
| Southern | 2510 | 1,624,381 | 0.15% | 1 | Slaskie | 601 | 4,488,998 | 0.01% | 4 |
| Eastern and Midland | 1810 | 2,411,912 | 0.08% | 3 | Wielkopolskie | 349 | 3,473,172 | 0.01% | 4 |
| Anatoliki Makedonia, Thraki | 367 | 599,723 | 0.06% | 3 | Zachodniopomorskie | 133 | 1,675,502 | 0.01% | 4 |
| Kentriki Makedonia | 215 | 1,873,777 | 0.01% | 4 | Lubuskie | 127 | 1,003,310 | 0.01% | 4 |
| Dytiki Makedonia | 314 | 267,008 | 0.12% | 3 | Dolnoslaskie | 527 | 2,865,072 | 0.02% | 3 |
| Ipeiros | 98 | 333,696 | 0.03% | 3 | Opolskie | 107 | 946,038 | 0.01% | 4 |
| Thessalia | 412 | 718,640 | 0.06% | 3 | Kujawsko-Pomorskie | 264 | 2,055,433 | 0.01% | 4 |
| Ionia Nisia | 190 | 203,869 | 0.09% | 3 | Warminsko-Mazurskie | 87 | 1,404,441 | 0.01% | 4 |
| Dytiki Ellada | 78 | 655,189 | 0.01% | 4 | Pomorskie | 135 | 2,305,077 | 0.01% | 4 |
| Sterea Ellada | 58 | 555,960 | 0.01% | 4 | Lódzkie | 358 | 2,453,167 | 0.01% | 4 |
| Peloponnisos | 70 | 574,447 | 0.01% | 4 | Swietokrzyskie | 120 | 1,226,243 | 0.01% | 4 |
| Attiki | 12 | 3,742,235 | 0.00% | 5 | Lubelskie | 192 | 2,097,294 | 0.01% | 4 |
| Voreio Aigaio | 15 | 221,098 | 0.01% | 4 | Podkarpackie | 371 | 2,086,135 | 0.02% | 3 |
| Notio Aigaio | 0 | 344,027 | 0.00% | 5 | Podlaskie | 168 | 1,152,074 | 0.01% | 4 |
| Kriti | 3 | 634,930 | 0.00% | 5 | Warszawski stoleczny | 62 | 3,053,104 | 0.00% | 5 |
| Galicia | 6331 | 2,700,441 | 0.23% | 1 | Mazowiecki regionalny | 0 | 2,327,207 | 0.00% | 5 |
| Principado de Asturias | 1679 | 1,022,205 | 0.16% | 1 | Norte | 1777 | 3,572,583 | 0.05% | 3 |
| Cantabria | 1501 | 581,641 | 0.26% | 1 | Algarve | 1561 | 438,864 | 0.36% | 1 |
| País Vasco | 9021 | 2,177,880 | 0.41% | 1 | Centro | 1823 | 2,216,569 | 0.08% | 3 |
| Navarra | 3355 | 649,946 | 0.52% | 1 | Lisboa | 1789 | 2,846,332 | 0.06% | 3 |
| La Rioja | 2846 | 313,571 | 0.91% | 1 | Alentejo | 1813 | 705,478 | 0.26% | 1 |
| Aragón | 3449 | 1,320,586 | 0.26% | 1 | Região Autónoma dos Açores | 1800 | 242,846 | 0.74% | 1 |
| Madrid | 40,469 | 6,641,649 | 0.61% | 1 | Madeira | 1879 | 253,945 | 0.74% | 1 |
| Castilla y León | 9581 | 2,407,733 | 0.40% | 1 | Nord-Vest | 276 | 2,552,112 | 0.01% | 4 |
| Castilla-la Mancha | 11,077 | 2,034,877 | 0.54% | 1 | Centru | 425 | 2,318,272 | 0.02% | 3 |
| Extremadura | 2116 | 1,065,424 | 0.20% | 1 | Nord-Est | 1743 | 3,198,564 | 0.05% | 3 |
| Cataluña | 28,323 | 7,566,431 | 0.37% | 1 | Sud-Est | 362 | 2,396,171 | 0.02% | 3 |
| Comunidad Valenciana | 7443 | 4,974,969 | 0.15% | 1 | Sud-Muntenia | 282 | 2,929,832 | 0.01% | 4 |
| Illes Balears | 1369 | 1,188,220 | 0.12% | 3 | Bucuresti-Ilfov | 697 | 2,315,173 | 0.03% | 3 |
| Andalucía | 8767 | 8,427,405 | 0.10% | 3 | Sud-Vest Oltenia | 72 | 1,926,860 | 0.00% | 5 |
| Región de Murcia | 1283 | 1,487,663 | 0.09% | 3 | Vest | 565 | 1,777,474 | 0.03% | 3 |
| Ciudad Autónoma de Ceuta | 83 | 84,829 | 0.10% | 3 | Vzhodna Slovenija | 501 | 1,094,435 | 0.05% | 3 |
| Ciudad Autónoma de Melilla | 92 | 84,689 | 0.11% | 3 | Zahodna Slovenija | 558 | 986,473 | 0.06% | 3 |
| Canarias | 1725 | 2,206,901 | 0.08% | 3 | Bratislavský kraj | 147 | 659,598 | 0.02% | 3 |
| Île de France | 17,910 | 12,244,807 | 0.15% | 1 | Západné Slovensko | 76 | 1,826,145 | 0.00% | 5 |
| Centre-Val de Loire | 3750 | 2,565,258 | 0.15% | 1 | Stredné Slovensko | 72 | 1,339,242 | 0.01% | 4 |
| Bourgogne | 1569 | 1,619,728 | 0.10% | 3 | Východné Slovensko | 286 | 1,625,436 | 0.02% | 3 |
| Franche-Comté | 24,920 | 1,173,605 | 2.12% | 1 | Länsi-Suomi | 90 | 1,379,749 | 0.01% | 4 |
| Basse-Normandie | 688 | 1,464,500 | 0.05% | 3 | Helsinki | 1438 | 1,671,024 | 0.09% | 3 |
| Haute-Normandie | 1753 | 1,848,840 | 0.09% | 3 | Etelä-Suomi | 154 | 1,152,719 | 0.01% | 4 |
| Nord-Pas-de-Calais | 5930 | 4,052,299 | 0.15% | 1 | Pohjois- ja Itä-Suomi | 118 | 1,284,638 | 0.01% | 4 |
| Picardie | 2820 | 1,925,138 | 0.15% | 1 | Åland | 508 | 29,789 | 1.71% | 1 |
| Alsace | 2770 | 1,894,144 | 0.15% | 1 | Stockholm | 3279 | 2,344,124 | 0.14% | 2 |
| Champagne-Ardenne | 1920 | 1,314,964 | 0.15% | 1 | Östra Mellansverige | 1133 | 1,708,813 | 0.07% | 3 |
| Lorraine | 3390 | 2,316,183 | 0.15% | 1 | Småland med öarna | 632 | 864,630 | 0.07% | 3 |
| Pays-de-la-Loire | 368 | 3,787,400 | 0.01% | 4 | Sydsverige | 366 | 1,521,848 | 0.02% | 3 |
| Bretagne | 603 | 3,333,720 | 0.02% | 3 | Västsverige | 674 | 2,039,166 | 0.03% | 3 |
| Aquitaine | 1082 | 3,450,045 | 0.03% | 3 | Norra Mellansverige | 554 | 855,220 | 0.06% | 3 |
| Limousin | 1070 | 729,981 | 0.15% | 1 | Mellersta Norrland | 576 | 375,733 | 0.15% | 1 |
| Poitou-Charentes | 2640 | 1,806,292 | 0.15% | 1 | Övre Norrland | 478 | 520,651 | 0.09% | 3 |
References
- Eurostat. SDG INDICATORS: GOAL BY GOAL. Eurostat Datbase. 2021. Available online: https://ec.europa.eu/eurostat/web/sdi/indicators (accessed on 2 March 2021).
- World Health Organization. WHO Health Emergency Dashboard. WHO (COVID-19) Homepage. 2021. Available online: https://covid19.who.int/ (accessed on 15 March 2021).
- Iamsiraroj, S. The Foreign direct investment–economic growth nexus. Int. Rev. Econ. Financ. 2016, 42, 116–133. [Google Scholar] [CrossRef]
- Meyer, D.; Shera, A. The impact of remittances on economic growth: An econometric model. EconomiA 2017, 18, 147–155. [Google Scholar] [CrossRef] [Green Version]
- Pradhan, R.P.; Arvin, M.B.; Hall, J.H.; Nair, M. Innovation, financial development and economic growth in Eurozone countries. Appl. Econ. Lett. 2016, 23, 1141–1144. [Google Scholar] [CrossRef]
- Bloom, J.J.; Canning, D.E.; Kotschy, D.; Prettner, R.; Schunemann, K. Health and Economic Growth. Handb. Econ. Growth 2014, 2, 623–682. [Google Scholar]
- Atkeson, A. What Will Be the Economic Impact of COVID-19 in the US? Rough Estimates of Disease Scenarios. Natl. Bur. Econ. Res. Work. Pap. Ser. 2020, 26867, 1–27. [Google Scholar]
- Gilchrist, S.; Schoenle, R.; Sim, J.; Zakrajšek, E. Inflation Dynamics during the Financial Crisis. Am. Econ. Rev. 2017, 107, 785–823. [Google Scholar] [CrossRef] [Green Version]
- Adrian, T.; Fleming, M.; Shachar, O.; Vogt, E. Market Liquidity After the Financial Crisis. Annu. Rev. Financ. Econ. 2017, 9, 43–83. [Google Scholar] [CrossRef] [Green Version]
- Kreichauf, R. From forced migration to forced arrival: The campization of refugee accommodation in European cities. Comp. Migr. Stud. 2018, 6, 7. [Google Scholar] [CrossRef] [PubMed]
- Hangartner, D.; Dinas, E.; Marbach, M.; Matakos, K.; Xefteris, D. Does Exposure to the Refugee Crisis Make Natives More Hostile? Am. Polit. Sci. Rev. 2019, 113, 442–455. [Google Scholar] [CrossRef] [Green Version]
- Harteveld, E.; Schaper, J.; De Lange, S.L.; Van Der Brug, W. Blaming Brussels? The Impact of (News about) the Refugee Crisis on Attitudes towards the EU and National Politics. JCMS J. Common Mark. Stud. 2018, 56, 157–177. [Google Scholar] [CrossRef]
- Danielli, S.; Patria, R.; Donnelly, P.; Ashrafian, H.; Darzi, A. Economic interventions to ameliorate the impact of COVID-19 on the economy and health: An international comparison. J. Public Health 2020, 43, 42–46. [Google Scholar] [CrossRef] [PubMed]
- Umar, M.; Xu, Y.; Mirza, S.S. The impact of COVID-19 on Gig economy. Econ. Res. Istraživanja 2021, 34, 2284–2296. [Google Scholar] [CrossRef]
- Asahi, K.; Undurraga, E.A.; Valdés, R.; Wagner, R. The effect of COVID-19 on the economy: Evidence from an early adopter of localized lockdowns. J. Glob. Health 2021, 11, 5002. [Google Scholar] [CrossRef] [PubMed]
- Vitenu-Sackey, P.; Barfi, R. The Impact of COVID-19 Pandemic on the Global Economy: Emphasis on Poverty Alleviation and Economic Growth. Financ. Res. Lett. 2021, 8, 32–43. [Google Scholar] [CrossRef]
- Khurshid, A.; Khan, K. How COVID-19 shock will drive the economy and climate? A data-driven approach to model and forecast. Environ. Sci. Pollut. Res. 2021, 28, 2948–2958. [Google Scholar] [CrossRef] [PubMed]


Publisher’s Note: MDPI stays neutral with regard to jurisdictional claims in published maps and institutional affiliations. |
© 2021 by the authors. Licensee MDPI, Basel, Switzerland. This article is an open access article distributed under the terms and conditions of the Creative Commons Attribution (CC BY) license (https://creativecommons.org/licenses/by/4.0/).