
Effect of Opposite Tooth Condition on Marginal Bone Loss around Submerged Dental Implants: A Retrospective Study with a 3-Year Follow-Up

 ,
, 
Abstract
:1. Introduction
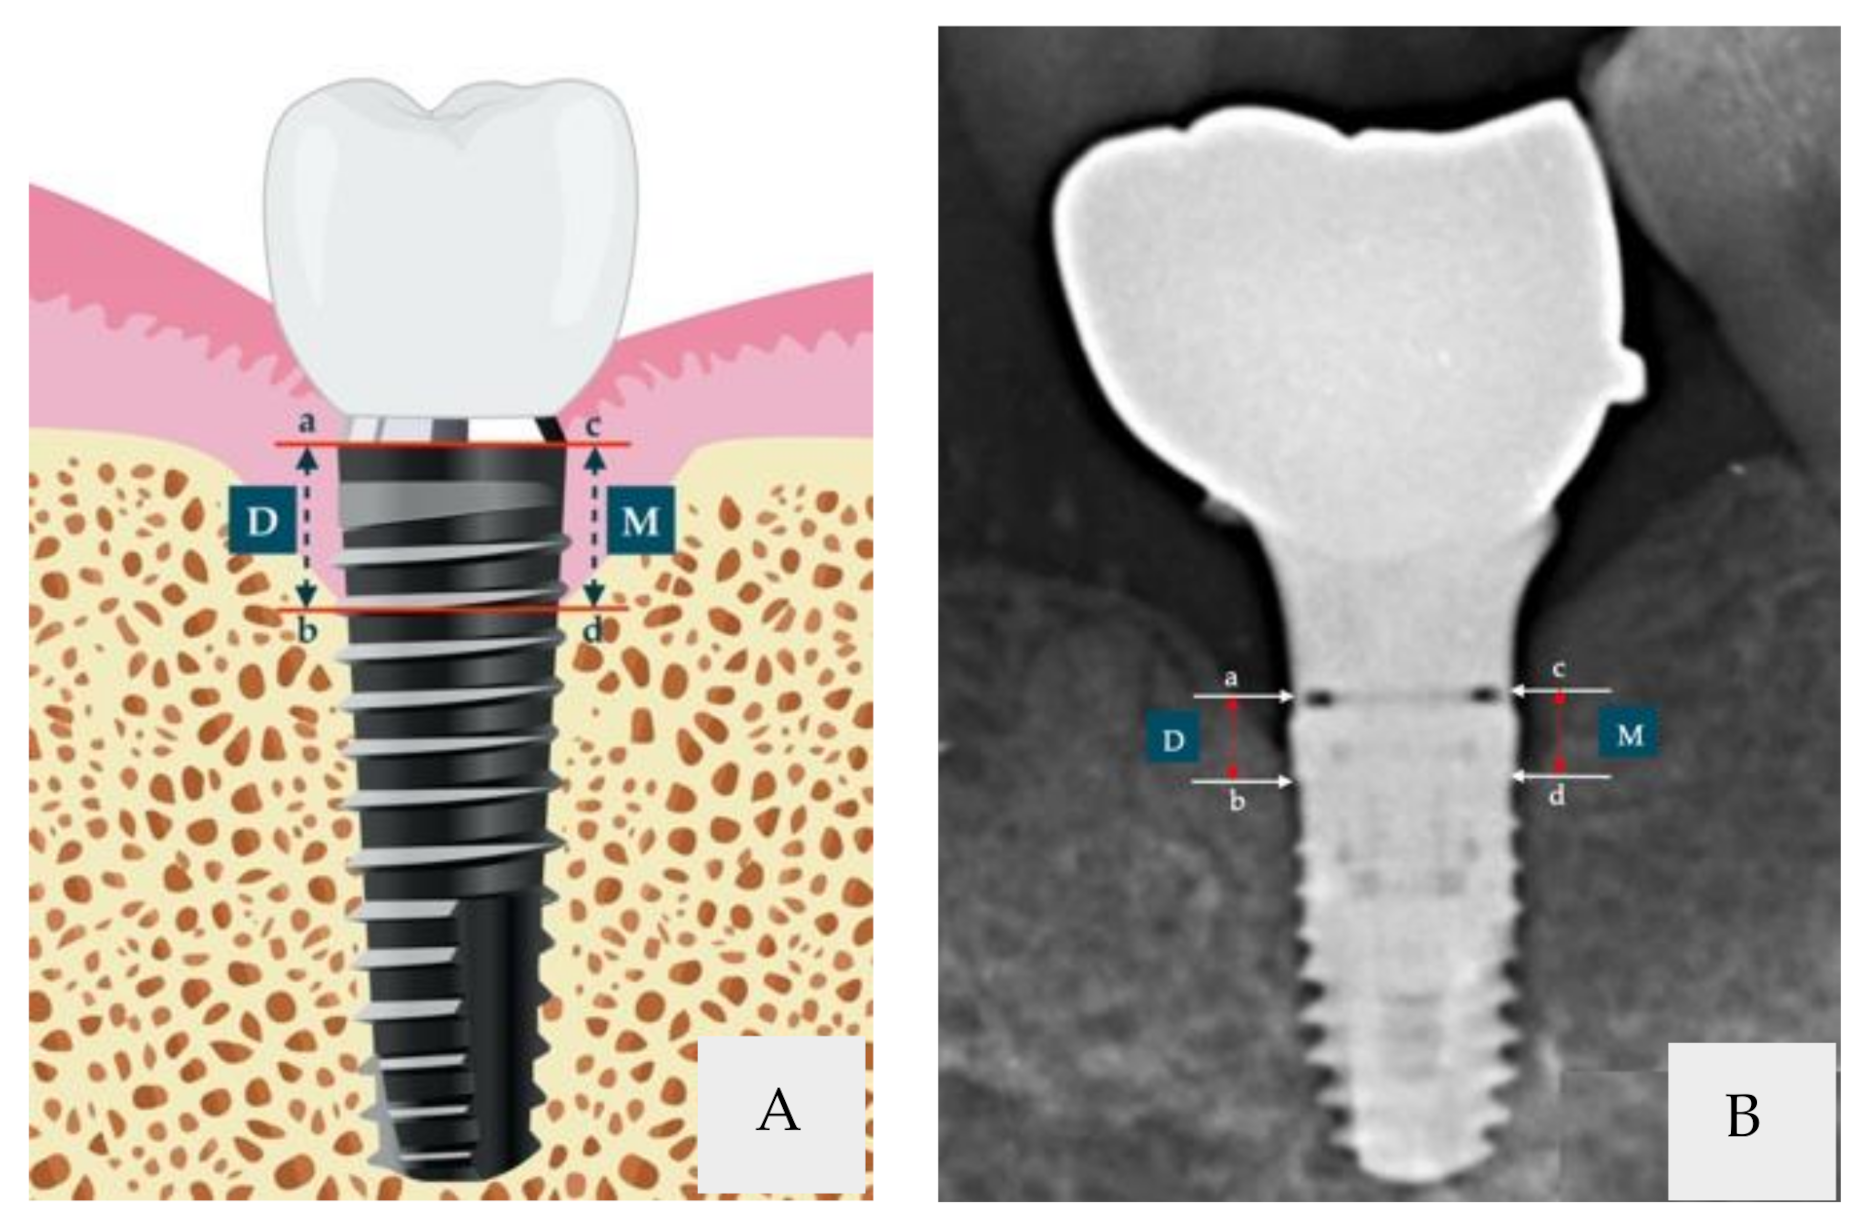
2. Materials and Methods
Statistical Methods
3. Results
3.1. Patient Characteristics at Baseline
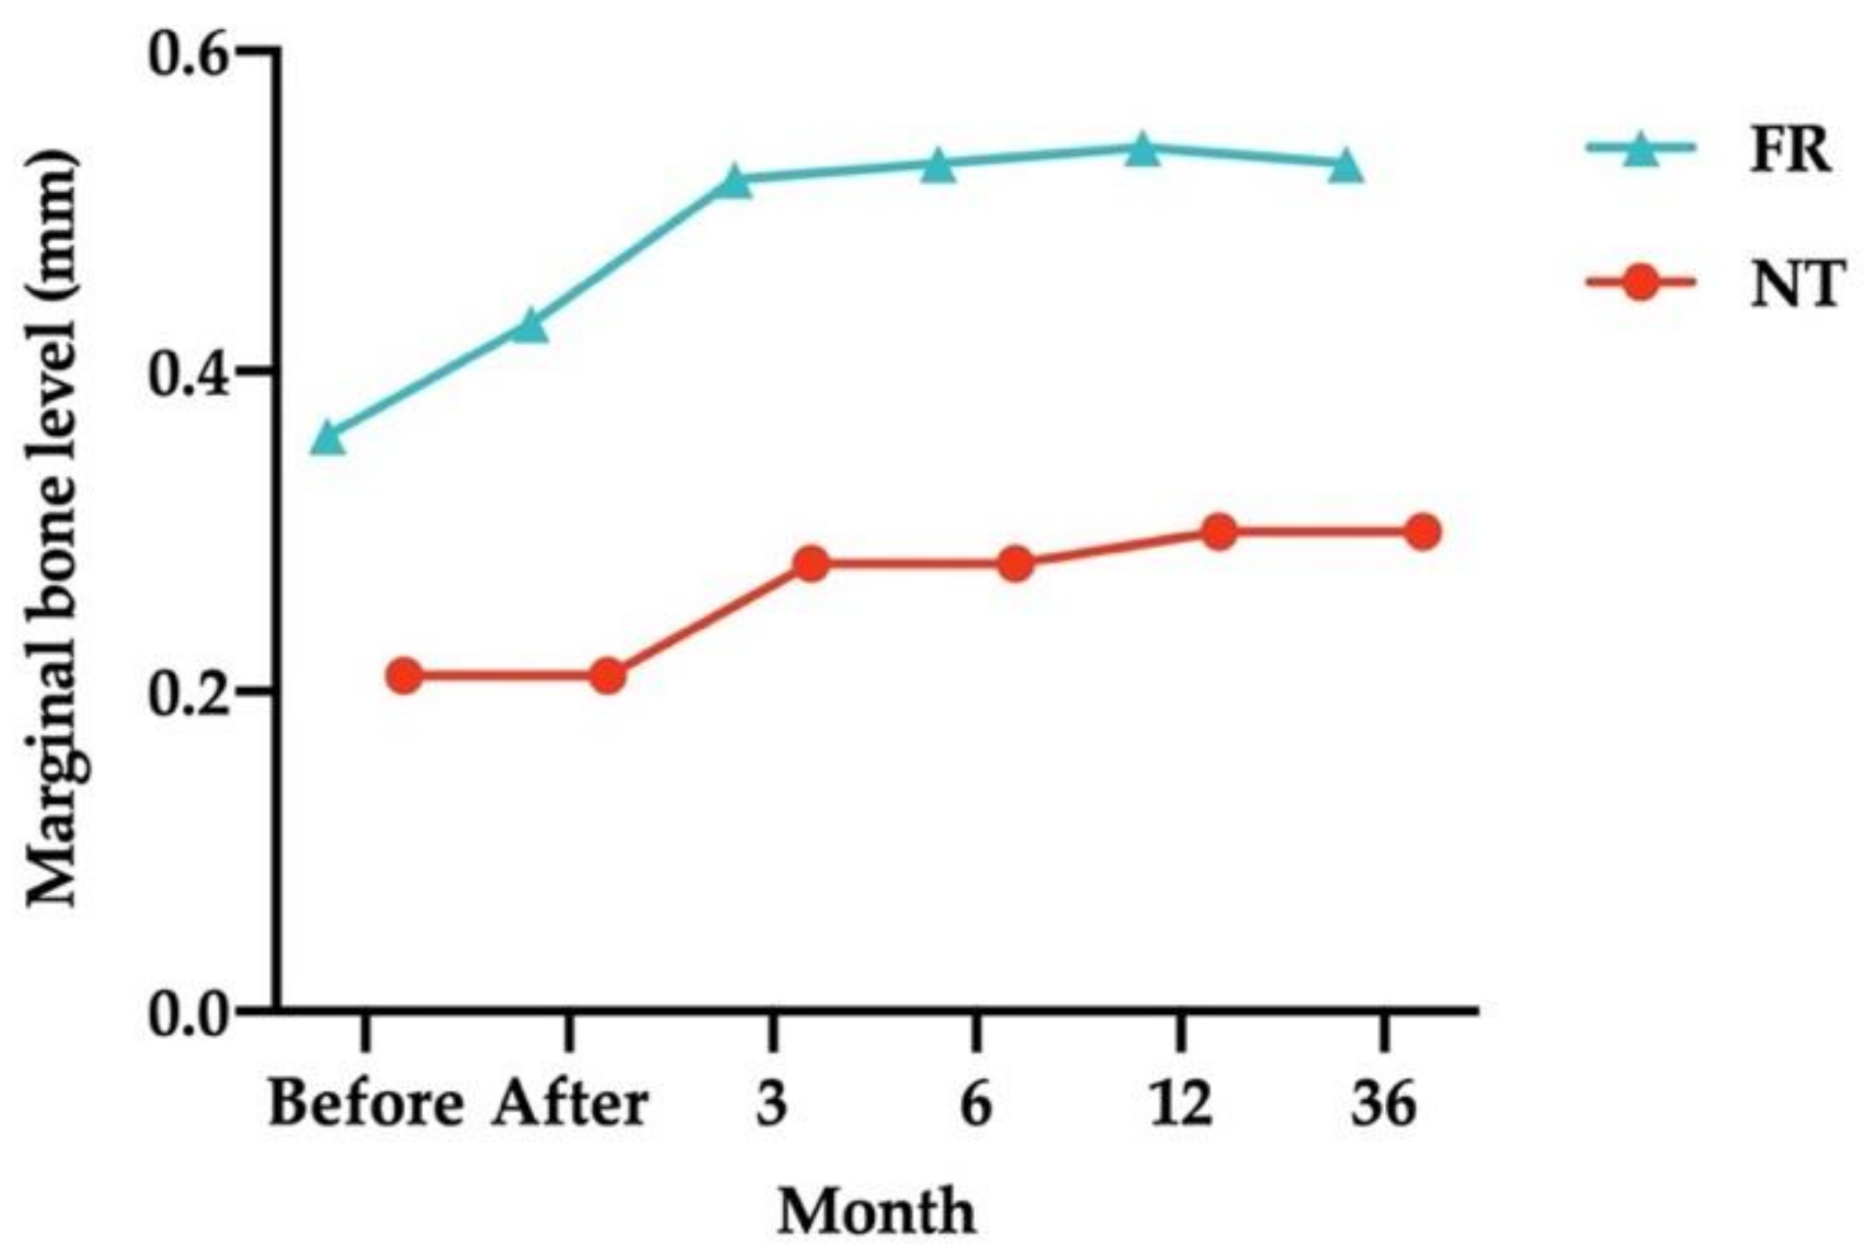
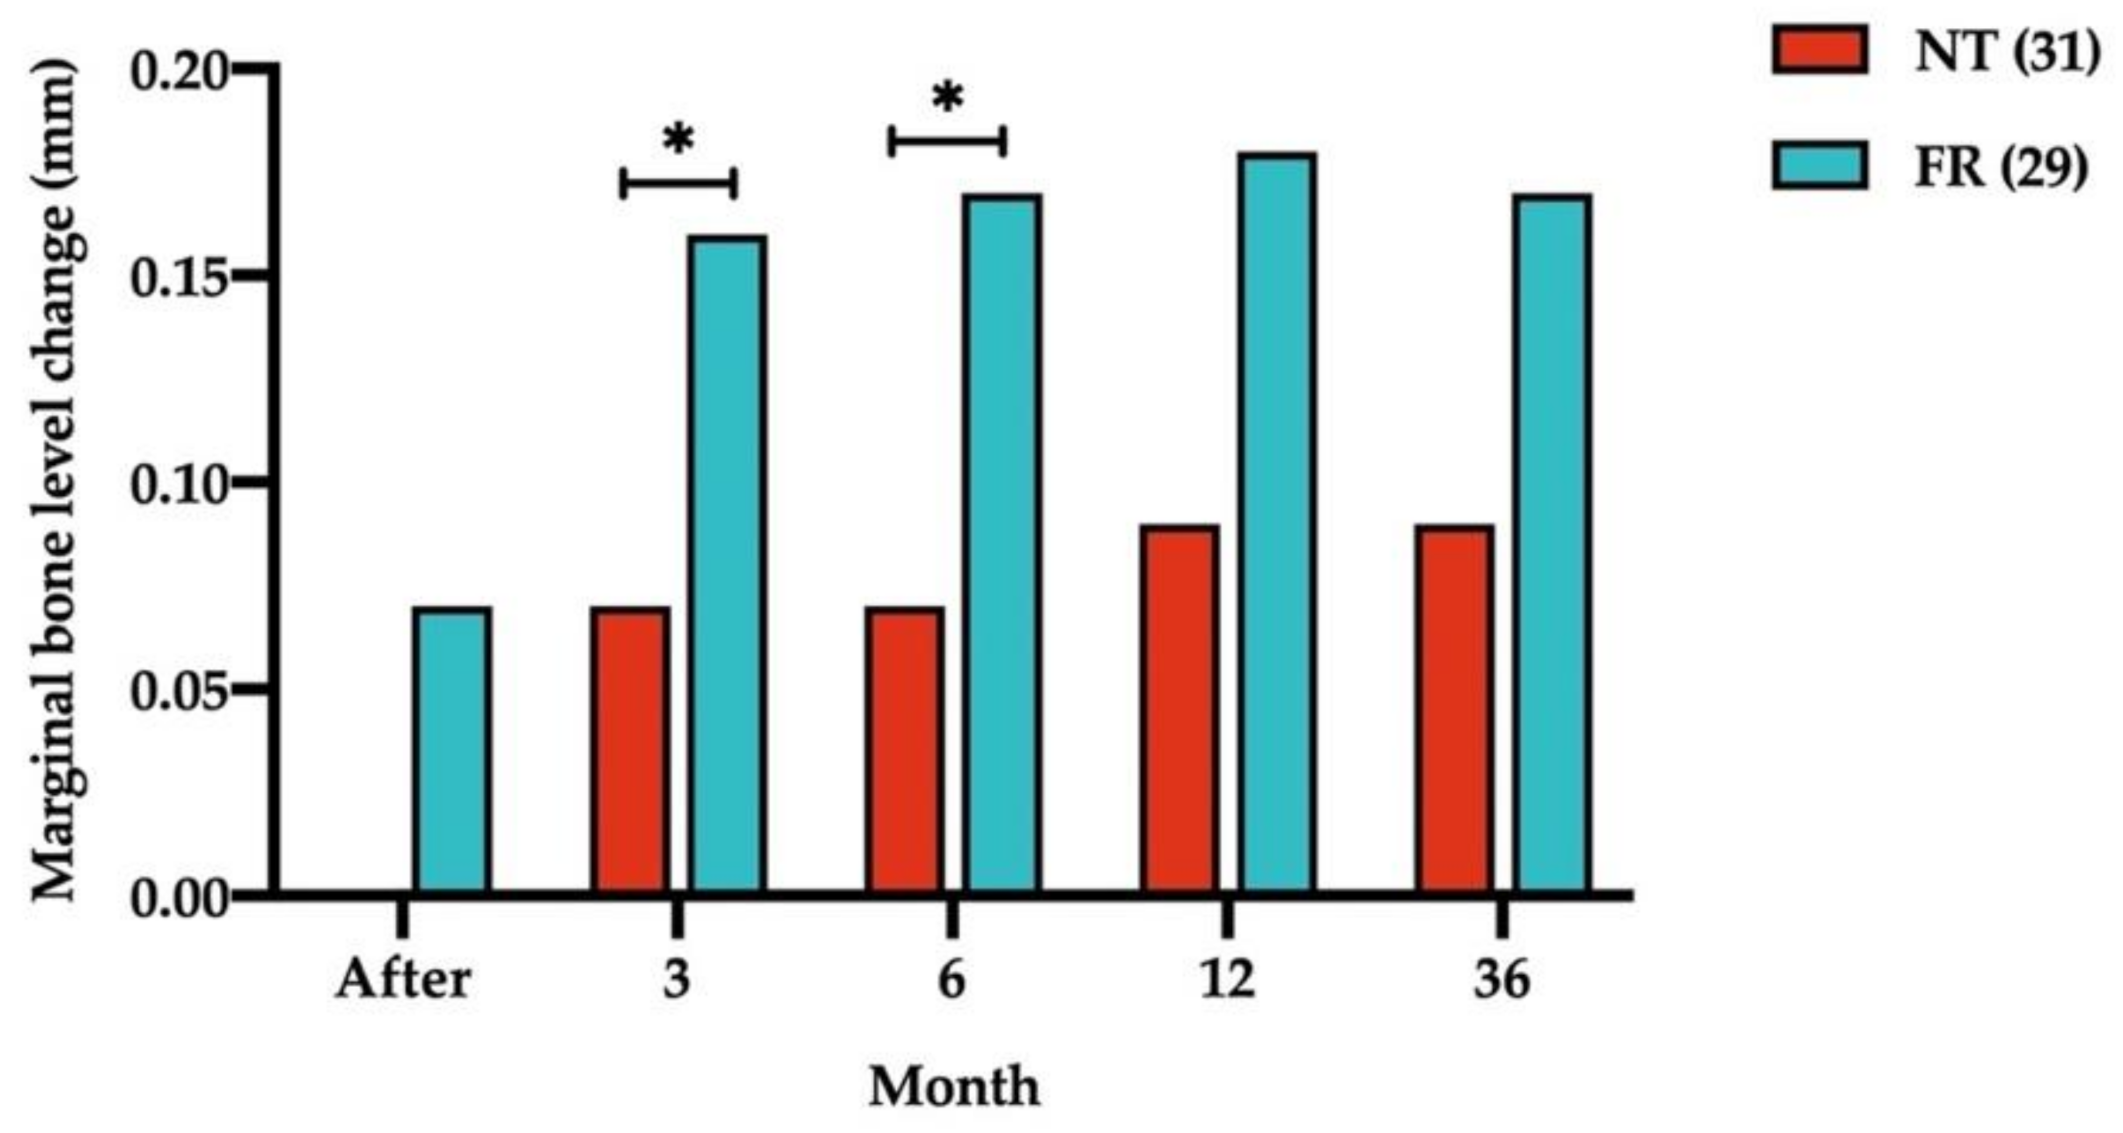
3.2. Opposing Structures and Marginal Bone Level Analysis
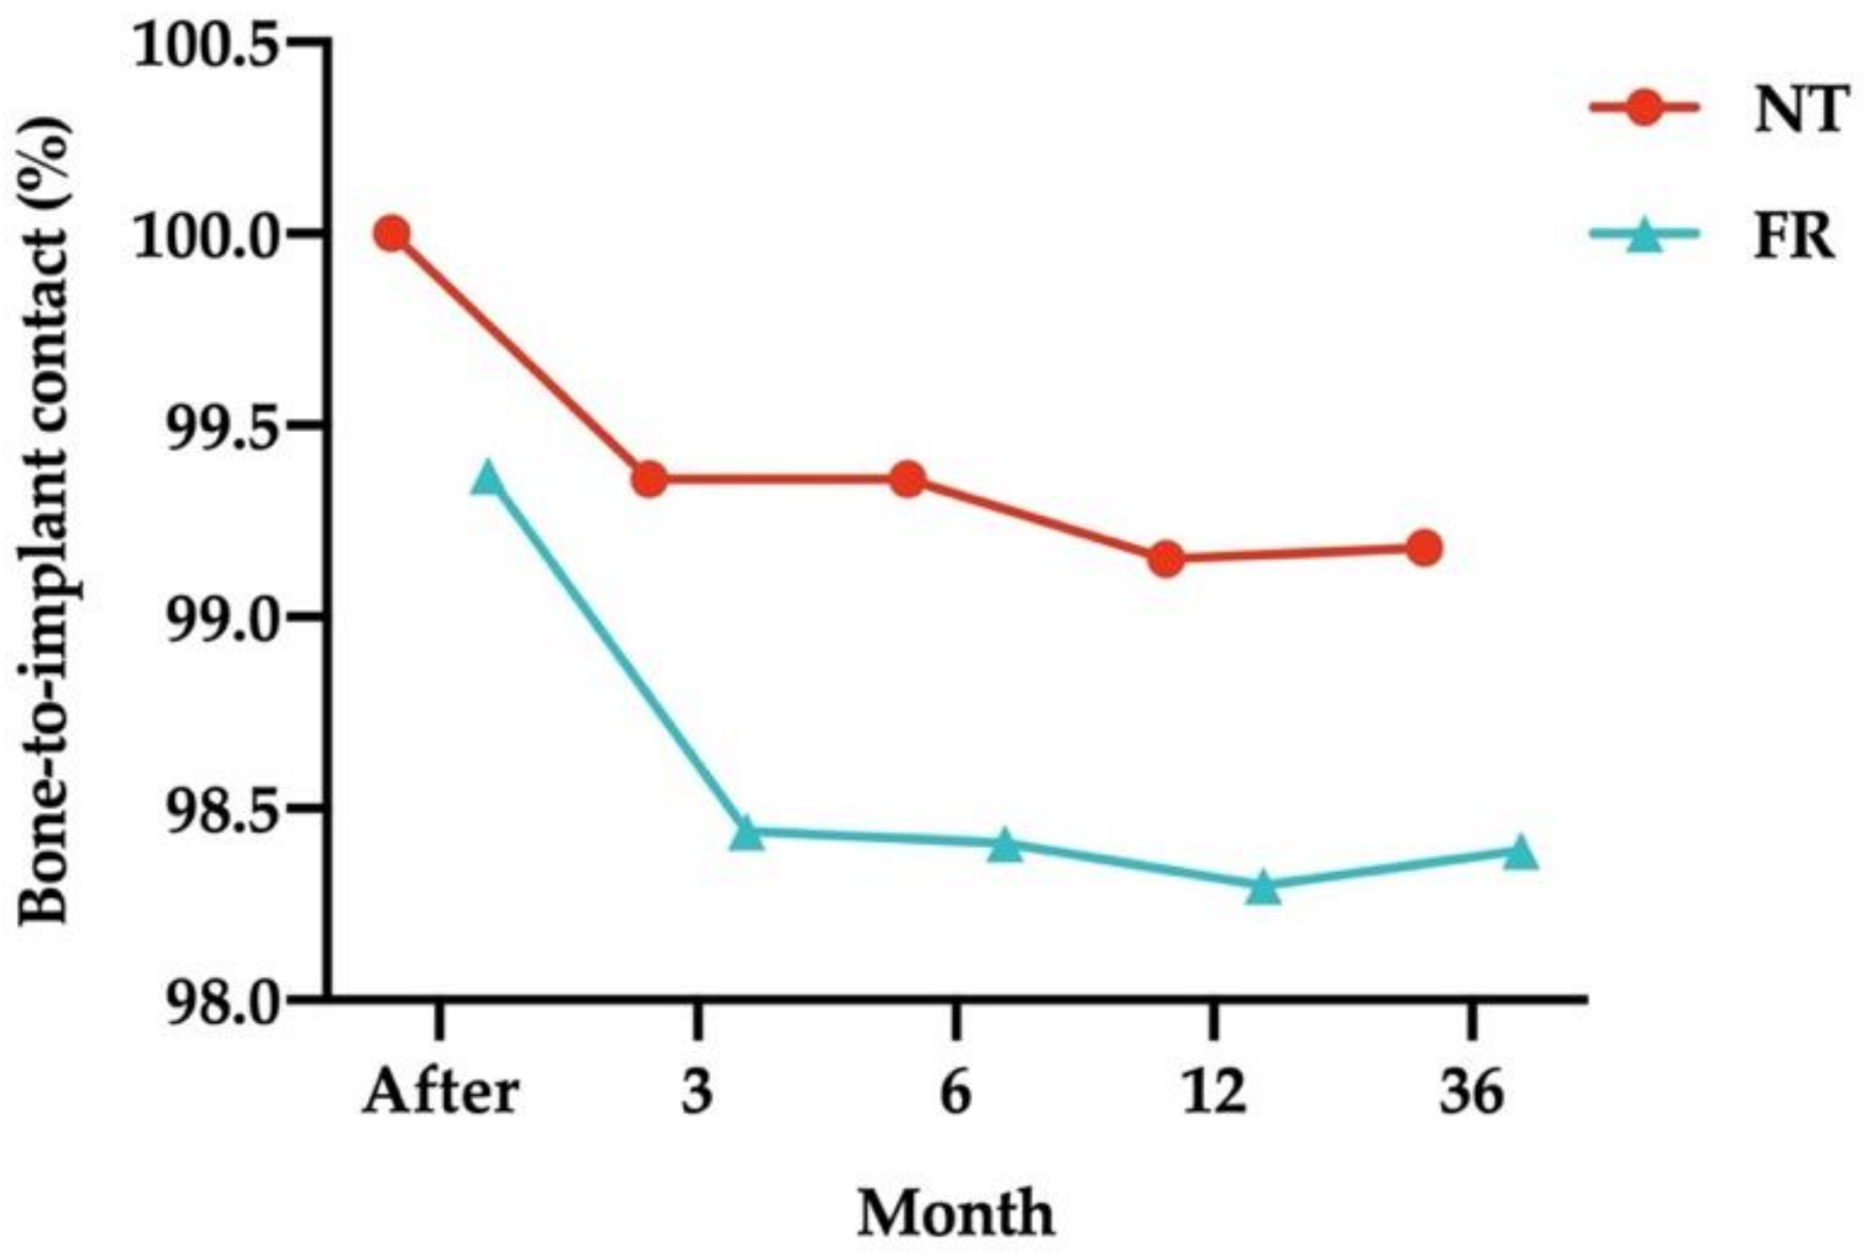
3.3. Opposing Structures and Osseointegration Analysis
4. Discussion
5. Conclusions
- Bone loss with submerged dental implants was more likely to occur if the implants were opposed by FRs (such as IT and FPPs).
- MBL around submerged dental implants is still changing 3 years after loading if the implants are opposed by NT.
Author Contributions
Funding
Institutional Review Board Statement
Informed Consent Statement
Data Availability Statement
Conflicts of Interest
References
- Abrahamsson, I.; Berglundh, T. Effects of different implant surfaces and designs on marginal bone-level alterations: A review. Clin. Oral Implant. Res. 2009, 20, 207–215. [Google Scholar] [CrossRef]
- Albrektsson, T.; Isidor, F. Consensus report: Implant therapy. In Proceedings of the 1st European Workshop on Periodontology. Quintessence International, Thurgau, Switzerland, 1–4 February 1993; pp. 365–369. [Google Scholar]
- Schwartz-Arad, D.; Herzberg, R.; Levin, L. Evaluation of Long-Term Implant Success. J. Periodontol. 2005, 76, 1623–1628. [Google Scholar] [CrossRef] [PubMed]
- Astrand, P.; Engquist, B.; Dahlgren, S.; Grondahl, K.; Engquist, E.; Feldmann, H. Astra Tech and Branemark system implants: A 5-year prospective study of marginal bone reactions. Clin. Oral Implant. Res. 2004, 15, 413–420. [Google Scholar] [CrossRef] [PubMed]
- Berglundh, T.; Abrahamsson, I.; Lindhe, J. Bone reactions to longstanding functional load at implants: An experimental study in dogs. J. Clin. Periodontol. 2005, 32, 925–932. [Google Scholar] [CrossRef] [PubMed]
- Hermann, J.S.; Cochran, D.L.; Nummikoski, P.V.; Buser, D. Crestal Bone Changes Around Titanium Implants. A Radiographic Evaluation of Unloaded Nonsubmerged and Submerged Implants in the Canine Mandible. J. Periodontol. 1997, 68, 1117–1130. [Google Scholar] [CrossRef] [PubMed]
- Cochran, D.L.; Nummikoski, P.V.; Schoolfield, J.D.; Jones, A.A.; Oates, T.W. A Prospective Multicenter 5-Year Radiographic Evaluation of Crestal Bone Levels Over Time in 596 Dental Implants Placed in 192 Patients. J. Periodontol. 2009, 80, 725–733. [Google Scholar] [CrossRef] [PubMed]
- Naert, I.; Duyck, J.; Vandamme, K. Occlusal overload and bone/implant loss. Clin. Oral Implant. Res. 2012, 23, 95–107. [Google Scholar] [CrossRef] [PubMed]
- Tiwari, B.; Ladha, K.; Lalit, A.; Naik, B.D. Occlusal concepts in full mouth rehabilitation: An overview. J. Indian Prosthodont. Soc. 2014, 14, 344–351. [Google Scholar] [CrossRef]
- Chang, M.; Chronopoulos, V.; Mattheos, N. Impact of excessive occlusal load on successfully-osseointegrated dental implants: A literature review. J. Investig. Clin. Dent. 2013, 4, 142–150. [Google Scholar] [CrossRef]
- Rilo, B.; Da Silva, J.L.; Mora, M.J.; Santana, U. Guidelines for occlusion strategy in implant-borne prostheses. A review. Int. Dent. J. 2008, 58, 139–145. [Google Scholar] [CrossRef]
- Duyck, J.; Naert, I. Failure of oral implants: Aetiology, symptoms and influencing factors. Clin. Oral Investig. 1998, 2, 102–114. [Google Scholar] [CrossRef]
- Berglundh, T.; Persson, L.; Klinge, B. A systematic review of the incidence of biological and technical complications in implant dentistry reported in prospective longitudinal studies of at least 5 years. J. Clin. Periodontol. 2002, 29, 197–212. [Google Scholar] [CrossRef]
- Merin, R.L. Repair of peri-implant bone loss after occlusal adjustment: A case report. J. Am. Dent. Assoc. 2014, 145, 1058–1062. [Google Scholar] [CrossRef]
- Isidor, F. Influence of forces on peri-implant bone. Clin. Oral Implant. Res. 2006, 17, 8–18. [Google Scholar] [CrossRef]
- Leucht, P.; Kim, J.-B.; Wazen, R.; Currey, J.A.; Nanci, A.; Brunski, J.B.; Helms, J.A. Effect of mechanical stimuli on skeletal regeneration around implants. Bone 2007, 40, 919–930. [Google Scholar] [CrossRef] [Green Version]
- Li, J.; Jansen, J.A.; Walboomers, X.F.; van den Beucken, J.J. Mechanical aspects of dental implants and osseointegration: A narrative review. J. Mech. Behav. Biomed. Mater. 2020, 103, 103574. [Google Scholar] [CrossRef]
- Akpinar, I.; Anil, N.; Parnas, L. A natural tooth’s stress distribution in occlusion with a dental implant. J. Oral Rehabil. 2000, 27, 538–545. [Google Scholar] [CrossRef] [PubMed]
- Hekimoglu, C.; Anıl, N.; Cehreli, M.C. Analysis of strain around endosseous dental implants opposing natural teeth or implants. J. Prosthet. Dent. 2004, 92, 441–446. [Google Scholar] [CrossRef]
- Urdaneta, R.A.; Daher, S.; Lery, J.; Emanuel, K.; Chuang, S.K. Factors associated with crestal bone gain on single-tooth locking-taper implants: The effect of nonsteroidal anti-inflammatory drugs. Int. J. Oral. Maxillofac. Implant. 2011, 26, 1063–1078. [Google Scholar]
- Boronat, A.; Peñarrocha, M.; Carrillo, C.; Marti, E. Marginal Bone Loss in Dental Implants Subjected to Early Loading (6 to 8 Weeks Postplacement) With a Retrospective Short-Term Follow-Up. J. Oral Maxillofac. Surg. 2008, 66, 246–250. [Google Scholar] [CrossRef]
- Laurell, L.; Lundgren, D. Marginal Bone Level Changes at Dental Implants after 5 Years in Function: A Meta-Analysis. Clin. Implant Dent. Relat. Res. 2011, 13, 19–28. [Google Scholar] [CrossRef] [PubMed]
- Ho, K.N. Marginal bone level evaluation after functional loading around two different dental implant designs. BioMed Res. Int. 2016, 2016, 1472090. [Google Scholar] [CrossRef] [PubMed]
- Urdaneta, R.A.; Leary, J.; Panetta, K.M.; Chuang, S.-K. The effect of opposing structures, natural teeth vs. implants on crestal bone levels surrounding single-tooth implants. Clin. Oral Implant. Res. 2014, 25, e179–e188. [Google Scholar] [CrossRef] [PubMed]
- Carlsson, G.E.; Lindquist, L.W.; Jemt, T. Long-term marginal periimplant bone loss in edentulous patients. Int. J. Prosthodont. 2000, 13, 295–302. [Google Scholar]
- Wang, T.M.; Leu, L.J.; Wang, J.; Lin, L.D. Effects of prosthesis materials and prosthesis splinting on peri-implant bone stress around implants in poor-quality bone: A numeric analysis. Int. J. Oral Maxillofac. Implant. 2002, 17, 231–237. [Google Scholar]
- Guichet, D.L.; Yoshinobu, D.; Caputo, A.A. Effect of splinting and interproximal contact tightness on load transfer by implant restorations. J. Prosthet. Dent. 2002, 87, 528–535. [Google Scholar] [CrossRef]
- Haroun, F.; Ozan, O. Evaluation of Stresses on Implant, Bone, and Restorative Materials Caused by Different Opposing Arch Materials in Hybrid Prosthetic Restorations Using the All-on-4 Technique. Materials 2021, 14, 4308. [Google Scholar] [CrossRef]
- Mericske-Stern, R.; Assal, P.; Mericske, E.; Burgin, W. Occlusal force and oral tactile sensibility measured in partially edentulous patients with ITI implants. Int. J. Oral Maxillofac. Implant. 1995, 10, 345–353. [Google Scholar] [CrossRef]
- Urdaneta, R.A.; Rodriguez, S.; McNeil, D.C.; Weed, M.; Chuang, S.K. The effect of increased crown-to-implant ratio on single-tooth locking-taper implants. Int. J. Oral Maxillofac. Implant. 2010, 25, 729–743. [Google Scholar]
- Blanes, R.J.; Bernard, J.P.; Blanes, Z.M.; Belser, U.C. A 10-year prospective study of ITI dental implants placed in the posterior region. II: Influence of the crown-to-implant ratio and different prosthetic treatment modalities on crestal bone loss. Clin. Oral Implant. Res. 2007, 18, 707–714. [Google Scholar] [CrossRef]
- Urdaneta, R.A.; Leary, J.; Lubelski, W.; Emanuel, K.M.; Chuang, S.-K. The Effect of Implant Size 5 × 8 mm on Crestal Bone Levels Around Single-Tooth Implants. J. Periodontol. 2012, 83, 1235–1244. [Google Scholar] [CrossRef]
- Morita, J.; Wada, M.; Mameno, T.; Maeda, Y.; Ikebe, K. Ideal placement of an implant considering the positional relationship to an opposing tooth in the first molar region: A three-dimensional finite element analysis. Int. J. Implant. Dent. 2020, 6, 31. [Google Scholar] [CrossRef]
- Cecchinato, D.; Olsson, C.; Lindhe, J. Submerged or non-submerged healing of endosseous implants to be used in the rehabilitation of partially dentate patients. A multicenter, randomized controlled clinical trial. J. Clin. Periodontol. 2004, 31, 299–308. [Google Scholar] [CrossRef]
- Wu, S.; Wu, X.; Shrestha, R.; Lin, J.; Feng, Z.; Liu, Y.; Shi, Y.; Huang, B.; Li, Z.; Liu, Q.; et al. Clinical and Radiologic Outcomes of Submerged and Nonsubmerged Bone-Level Implants with Internal Hexagonal Connections in Immediate Implantation: A 5-Year Retrospective Study. J. Prosthodont. 2018, 27, 101–107. [Google Scholar] [CrossRef]


| Parameters | Natural Teeth (n = 31) | Fixed Restorations (n = 29) | p-Value | ||
|---|---|---|---|---|---|
| Age (mean ± standard deviation) | 49.2 ± 10.46 | 52.1 ± 6.49 | 0.252 | ||
| Gender | 0.685 | ||||
| Male | 14 | 51.9% | 11 | 57.9% | |
| Female | 13 | 48.1% | 8 | 42.1% | |
| Location | 0.993 | ||||
| Upper jaw | 15 | 48.4% | 14 | 48.3% | |
| Lower jaw | 16 | 51.6% | 15 | 51.7% | |
| Diameter | 0.769 | ||||
| 3.8 mm | 16 | 51.6% | 11 | 37.9% | |
| 4.5 mm | 15 | 48.4% | 18 | 62.1% | |
| Length | 0.998 | ||||
| 9.5 mm | 11 | 35.5% | 11 | 37.9% | |
| 11 mm | 20 | 64.5% | 18 | 62.1% | |
| (a) | ||||||
| Opposing Structure | Time (Relative to Loading) | Mean (mm) | p-Value | |||
| Before Loading | 3 M | 6 M | 12 M | |||
| Natural tooth (n = 31) | Before | 0.21 ± 0.33 | ||||
| Immediately after | 0.21 ± 0.33 | NA | ||||
| 3 months after | 0.28 ± 0.39 | 0.001 | ||||
| 6 months after | 0.28 ± 0.39 | 0.001 | NA | |||
| 12 months after | 0.30 ± 0.40 | 0.001 | 0.003 | 0.003 | ||
| 36 months after | 0.30 ± 0.41 | 0.001 | 0.005 | 0.005 | 0.325 | |
| (b) | ||||||
| Opposing Structure | Time (Relative to Loading) | Mean (mm) | p-Value | |||
| Before Loading | 3 M | 6 M | 12 M | |||
| Fixed restoration (n = 29) | Before | 0.36 ± 0.45 | ||||
| Immediately after | 0.43 ± 0.48 | 0.072 | ||||
| 3 months after | 0.52 ± 0.50 | 0.001 | ||||
| 6 months after | 0.53 ± 0.50 | 0.001 | 0.325 | |||
| 12 months after | 0.54 ± 0.52 | <0.001 | 0.029 | 0.161 | ||
| 36 months after | 0.53 ± 0.51 | <0.001 | 0.752 | 1.000 | 0.325 | |
| Opposing Structure | Time (Relative to Loading) | Mean (mm) | p-Value | |||
|---|---|---|---|---|---|---|
| Before Loading | 3 M | 6 M | 12 M | |||
| Natural tooth (n = 31) | Immediately after | 0.00 ± 0.00 | ||||
| 3 months after | 0.07 ± 0.11 | 0.001 | ||||
| 6 months after | 0.07 ± 0.11 | 0.001 | NA | |||
| 12 months after | 0.09 ± 0.14 | 0.001 | 0.003 | 0.003 | ||
| 36 months after | 0.09 ± 0.13 | 0.001 | 0.005 | 0.005 | 0.325 | |
| Fixed restoration (n = 29) | Immediately after | 0.07 ± 0.20 | ||||
| 3 months after | 0.16 ± 0.23 | 0.002 | ||||
| 6 months after | 0.17 ± 0.23 | 0.002 | 0.325 | |||
| 12 months after | 0.18 ± 0.24 | 0.001 | 0.029 | 0.161 | ||
| 36 months after | 0.17 ± 0.22 | 0.001 | 0.752 | 1.000 | 0.325 | |
| Parameters | Time (Relative to Loading) | Mean (mm) | p-Value | |
|---|---|---|---|---|
| FPP (n = 15) | IT (n = 14) | |||
| MBL | Before | 0.26 ± 0.32 | 0.48 ± 0.55 | 0.209 |
| Immediately after | 0.35 ± 0.36 | 0.52 ± 0.58 | 0.365 | |
| 3 months after | 0.43 ± 0.38 | 0.63 ± 0.61 | 0.298 | |
| 6 months after | 0.43 ± 0.38 | 0.64 ± 0.61 | 0.280 | |
| 12 months after | 0.44 ± 0.38 | 0.64 ± 0.63 | 0.311 | |
| 36 months after | 0.43 ± 0.37 | 0.63 ± 0.62 | 0.318 | |
| Change in MBL | Immediately after | 0.09 ± 0.26 | 0.04 ± 0.11 | 0.496 |
| 3 months after | 0.17 ± 0.28 | 0.15 ± 0.17 | 0.849 | |
| 6 months after | 0.17 ± 0.28 | 0.16 ± 0.19 | 0.916 | |
| 12 months after | 0.18 ± 0.28 | 0.17 ± 0.18 | 0.862 | |
| 36 months after | 0.18 ± 0.28 | 0.15 ± 0.14 | 0.782 | |
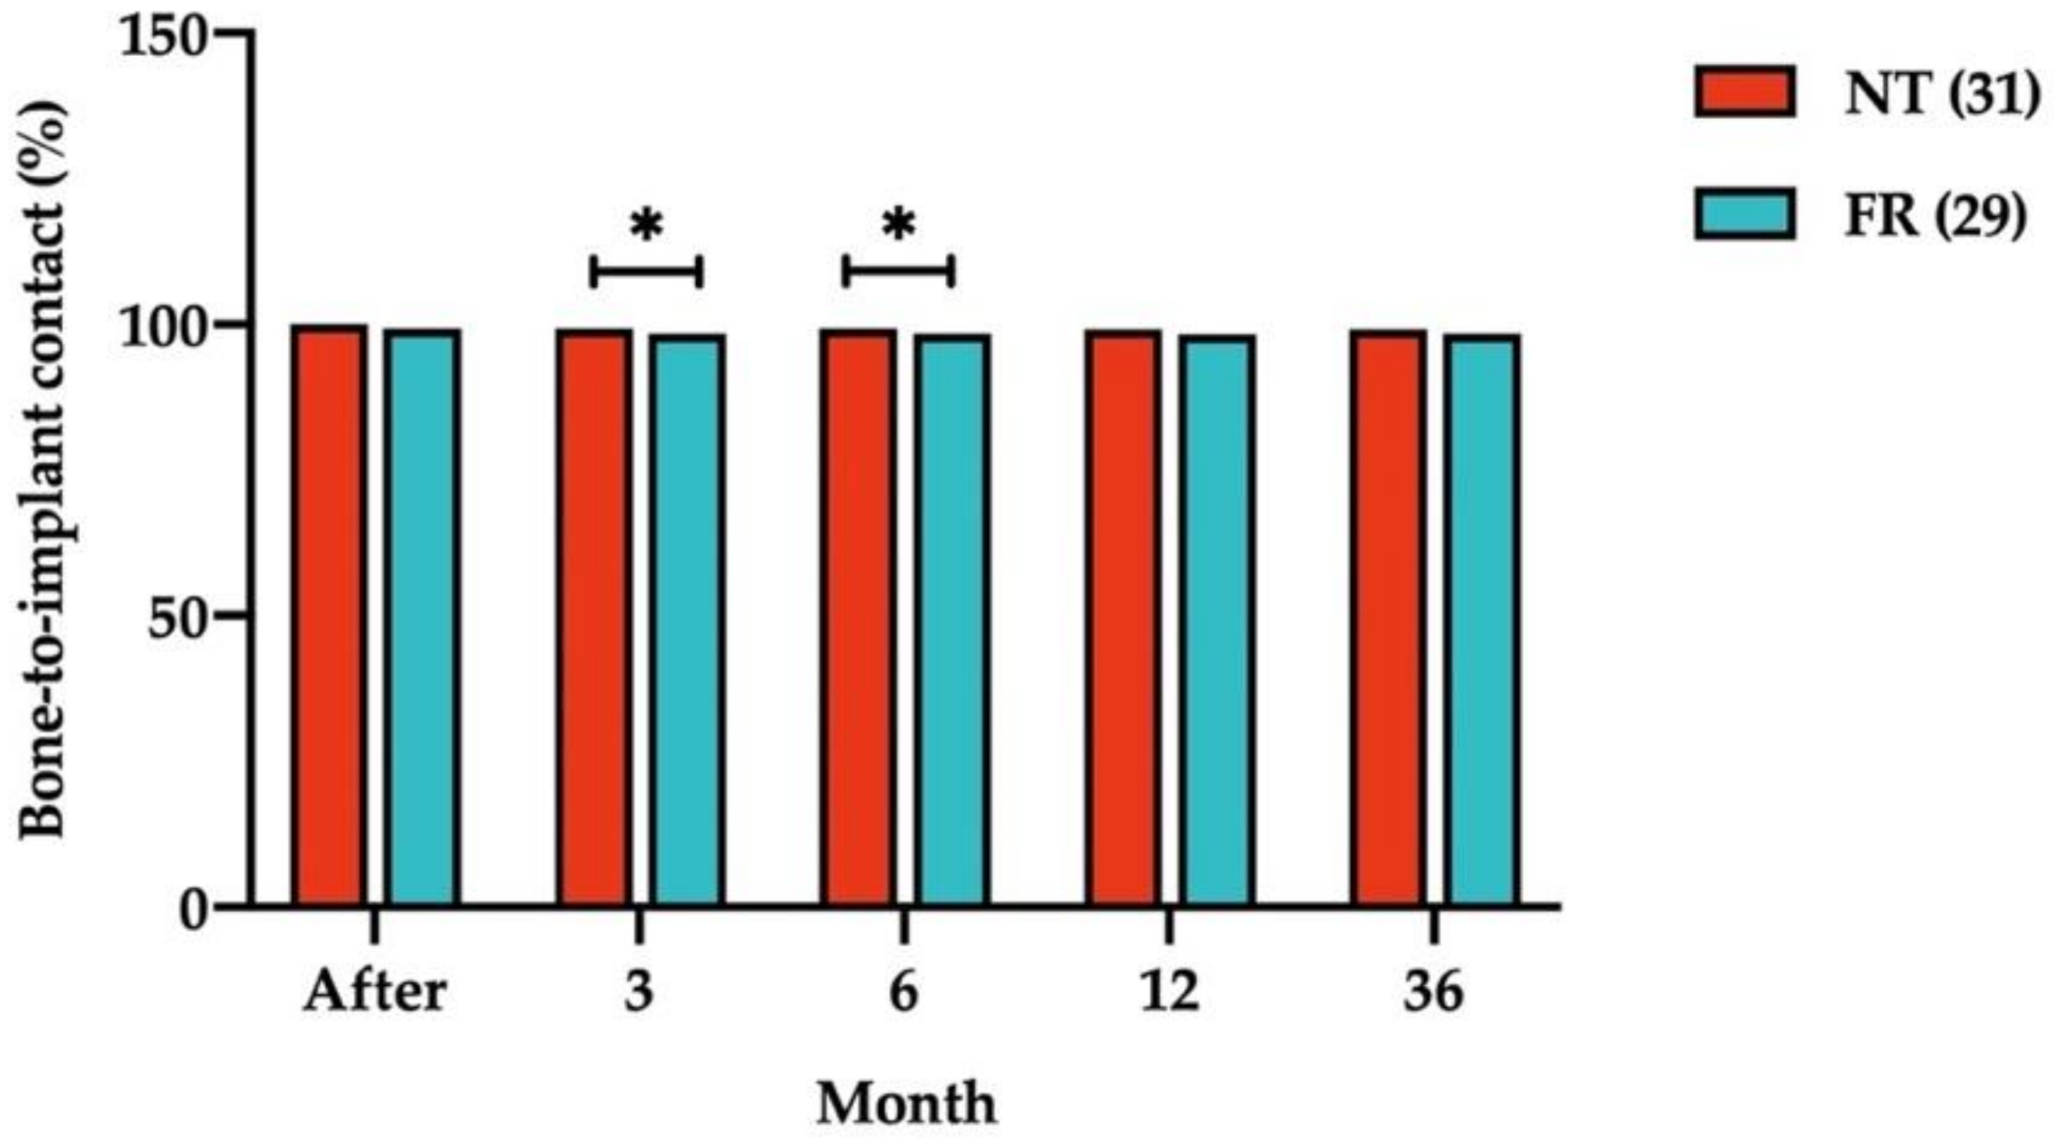
| Opposing Structure | Time (Relative to Loading) | Mean (%) | p-Value | |||
|---|---|---|---|---|---|---|
| Before Loading | 3 M | 6 M | 12 M | |||
| Natural tooth (n = 31) | Immediately after | 100.00 ± 0.00 | ||||
| 3 months after | 99.36 ± 1.01 | 0.001 | ||||
| 6 months after | 99.36 ± 1.01 | 0.001 | NA | |||
| 12 months after | 99.15 ± 1.29 | 0.001 | 0.003 | 0.003 | ||
| 36 months after | 99.18 ± 1.28 | 0.001 | 0.005 | 0.005 | 0.325 | |
| Fixed restoration (n = 29) | Immediately after | 99.37 ± 1.81 | ||||
| 3 months after | 98.44 ± 2.15 | 0.002 | ||||
| 6 months after | 98.41 ± 2.19 | 0.002 | 0.325 | |||
| 12 months after | 98.30 ± 2.22 | 0.001 | 0.029 | 0.134 | ||
| 36 months after | 98.39 ± 2.12 | 0.001 | 0.752 | 0.880 | 0.386 | |
Publisher’s Note: MDPI stays neutral with regard to jurisdictional claims in published maps and institutional affiliations. |
© 2021 by the authors. Licensee MDPI, Basel, Switzerland. This article is an open access article distributed under the terms and conditions of the Creative Commons Attribution (CC BY) license (https://creativecommons.org/licenses/by/4.0/).
Share and Cite
Dorj, O.; Lin, H.-K.; Salamanca, E.; Pan, Y.-H.; Wu, Y.-F.; Hsu, Y.-S.; Lin, J.C.-Y.; Lin, C.-K.; Chang, W.-J. Effect of Opposite Tooth Condition on Marginal Bone Loss around Submerged Dental Implants: A Retrospective Study with a 3-Year Follow-Up. Int. J. Environ. Res. Public Health 2021, 18, 10715. https://doi.org/10.3390/ijerph182010715
Dorj O, Lin H-K, Salamanca E, Pan Y-H, Wu Y-F, Hsu Y-S, Lin JC-Y, Lin C-K, Chang W-J. Effect of Opposite Tooth Condition on Marginal Bone Loss around Submerged Dental Implants: A Retrospective Study with a 3-Year Follow-Up. International Journal of Environmental Research and Public Health. 2021; 18(20):10715. https://doi.org/10.3390/ijerph182010715
Chicago/Turabian StyleDorj, Odontuya, Hsi-Kuei Lin, Eisner Salamanca, Yu-Hwa Pan, Yi-Fan Wu, Yung-Szu Hsu, Jerry C-Y Lin, Chin-Kai Lin, and Wei-Jen Chang. 2021. "Effect of Opposite Tooth Condition on Marginal Bone Loss around Submerged Dental Implants: A Retrospective Study with a 3-Year Follow-Up" International Journal of Environmental Research and Public Health 18, no. 20: 10715. https://doi.org/10.3390/ijerph182010715
APA StyleDorj, O., Lin, H.-K., Salamanca, E., Pan, Y.-H., Wu, Y.-F., Hsu, Y.-S., Lin, J. C.-Y., Lin, C.-K., & Chang, W.-J. (2021). Effect of Opposite Tooth Condition on Marginal Bone Loss around Submerged Dental Implants: A Retrospective Study with a 3-Year Follow-Up. International Journal of Environmental Research and Public Health, 18(20), 10715. https://doi.org/10.3390/ijerph182010715