Abstract
Nitrate is usually the main pollution factor in the river water and groundwater environment because it has the characteristics of stable properties, high solubility and easy migration. In order to ensure the safety of water supply and effectively control nitrate pollution, it is very important to accurately identify the pollution sources of nitrate in freshwater environment. At present, as the most accurate source analysis method, isotope technology is widely used to identify the pollution sources of nitrate in water environment. However, the complexity of nitrate pollution sources and nitrogen migration and transformation in the water environment, coupled with the isotopic fractionation, has changed the nitrogen and oxygen isotopic values of nitrate in the initial water body, resulting in certain limitations in the application of this technology. This review systematically summarized the typical δ15N and δ18O-NO3− ranges of NO3− sources, described the progress in the application of isotope technique to identify nitrate pollution sources in water environment, analyzed the application of isotope technique in identifying the migration and transformation of nitrogen in water environment, and introduced the method of quantitative source apportionment. Lastly, we discussed the deficiency of isotope technique in nitrate pollution source identification and described the future development direction of the pollution source apportionment of nitrate in water environment.
1. Introduction
Nitrate in the water environment has the characteristics of stable properties, high solubility and easy migration. Therefore, it is usually the main pollution factor in groundwater [1]. In recent years, with the acceleration of urbanization, industrialization, and the rapid growth of population, the impact of human activities (such as excessive application of agricultural chemical fertilizer, substandard discharge of sewage, landfill leakage, chemical fuel leakage, and so on) on the river and groundwater environment has increased, resulting in an increase in the nitrate concentration in freshwater annually. It has become a freshwater environment problem of common concern all over the world and has attracted extensive attention of global scholars [2,3,4].
Nitrate in drinking water is closely related to human health. Studies have found that an excessive nitrate concentration in drinking water can induce a variety of diseases, such as esophageal cancer, gastric cancer, blue baby syndrome, and methemoglobinemia, among other diseases [5,6]. In addition, high concentrations of nitrate in a water environment also have a significant impact on the ecological environment. Research shows that high concentrations of nitrate in surface water can lead to water eutrophication and algal bloom [7], which seriously affect the use value of water body. Therefore, it is particularly important to control nitrate pollution in a freshwater environment.
On the premise of controlling nitrate pollution in water, it is necessary to accurately identify the nitrate pollution sources [8,9]. The traditional method of judging the nitrate pollution sources in a river and groundwater environment is to investigate the land use type of the polluted area and combine the local hydrochemical characteristics [10]. This method is simple, but the results can be inaccurate [11]. In recent years, scholars have found that nitrate from different sources has different nitrogen and oxygen isotope ratios. Therefore, nitrate pollution sources can be better identified according to the δ15N and δ18O-NO3− values [12], which can make up for the shortcomings of traditional methods and provide a means to directly identify pollution sources.
This study summarizes the research progress of identifying nitrate pollution sources in water by stable isotope technology. This paper mainly includes the following aspects: (1) the isotopic value ranges of δ15N and δ18O of nitrates from different sources are summarized; (2) research progress in identifying the nitrate pollution sources in a freshwater environment by isotope technology; (3) research advances in isotope technology to identify the migration and transformation of nitrogen in freshwater environment; (4) quantitative analysis of nitrate pollution sources by combining with the stable isotope and model in a freshwater environment; and (5) research deficiency and prospect.
2. Methods
2.1. Search Strategy and Data Sources
The goal of this scoping review is to understand the current advances of pollution sources of nitrate in a freshwater environment. A review protocol was designed in advance to address the research questions, search strategy, data extraction, and analysis. The protocol was not registered.
We reviewed more than 600 published papers searched from Web of Science and China National Knowledge Infrastructure (CNKI) (1990–2021) (based on the keywords “nitrate”, “isotope”, “pollution sources” and “water environment”) and chose 106 of them for this review based on the following criteria: (1) publications are about freshwater (river and groundwater); (2) the δ15N-NO3− and δ18O-NO3− values of the potential pollution sources were determined; (3) the contribution proportion of pollution sources was quantified by the stable isotope mixing model; and (4) the pollution sources of nitrate were identified using the multiple isotopes method. The search was not limited by spatial restrictions. The collected literature mainly included articles published from 1990 to 2021. The language of the literature is mainly English or the articles with an English abstract, while papers with the main text written in another language were also included.
2.2. Peer-Reviewed Literature Screening
Titles and abstracts of all records were independently screened for eligibility by two authors (C.N. and Q.Q.Z.). Disagreements were solved by consensus or arbitration by a third reviewer (T.L.Z. or H.W.W.).
2.3. Data Extraction and Analysis
Data extracted included the following: the δ15N-NO3− and δ18O-NO3− values of the potential pollution sources, the kinds of pretreatment technology, and the kinds of isotope and model. Data extraction was conducted by two independent reviewers (C.N. and L.L.X.). The authors (C.N. and T.L.Z.) counted the data of author, year of publication, and study country, and analyzed the δ15N-NO3− and δ18O-NO3− values of the potential pollution sources. Disagreements were solved by consensus or arbitrated by a third reviewer (Q.Q.Z. or H.W.W.).
3. Determination of Nitrate Isotopes in a Water Environment
The stable isotope ratios for NO3− isotopic composition are expressed in delta (δ) units and expressed as a permil (‰) notation relative to an international standard:
where Rsample and Rstandard are the15N/14N for δ15N and 18O/16O for δ18O, respectively. The isotopic values are reported relative to N2 in atmospheric air (AIR) and Vienna standard mean ocean water (VSMOW) for δ15N and δ18O, respectively.
3.1. Pretreatment Technology
The pretreatment methods of δ15N and δ18O of nitrate mainly include the distillation method, the diffusion method, the ion-exchange resin method, bacterial denitrification, and the hydrazoic acid method.
3.1.1. Distillation Method
Distillation is the most traditional method, which includes three steps: (1) reduction of nitrate nitrogen; (2) distillation enrichment; and (3) adsorption of ammonium nitrogen. Firstly, a reducing agent (Devarda) is added to the water sample to reduce nitrate nitrogen to ammonium nitrogen. Then, it is distilled by the Kjeldahl method and adsorbed by acidified filter paper. NH4+ is converted to N2 by means of high-temperature burning, then the nitrogen isotope value is determined by the isotope mass spectrometer [13]. This method is relatively mature, but the sample processing takes a long time, the test work requires special equipment and skilled operators, and it is easy to cause cross contamination.
3.1.2. Diffusion Method
The method involves adding sulfamic acid to the sample to remove nitrite, and then adding Devarda to reduce NO3− to NH4+. Collect the diffused NH4+ with acid-washed zeolite or acidified suspension, and put the sample into a glass digestion tube for heating and diffusion to convert the collected NH4+ into N2. Finally, nitrogen isotopes are determined by the mass spectrometer [14]. The method is simple and can handle a large number of samples. However, the diffusion period is long (one week or even longer), and incomplete diffusion will cause isotopic fractionation, causing the test results to deviate from the actual value.
3.1.3. Ion-Exchange Resin
The method mainly include four steps: (1) NO3− is collected on the ion-exchange columns with an anion resin afterwards and it is eluted from the resins using 15 mL of 3 M HCl. (2) SO42– and PO43– are removed by precipitation with excess BaCl2. The sample is then passed through a cation-exchange resin. (3) Excessive Ag2O is used to remove Cl− and neutralize the solution to achieve a pH of about 6. (4) The AgNO3 solution was freeze-dried for isotopic analysis [7].
This method has little isotope fractionation and high analysis accuracy. However, this method needs to collect a large amount of water samples, the pretreatment procedure is cumbersome, and the treatment cost is high.
3.1.4. Bacterial Denitrification
Bacterial denitrification is a new pretreatment method for simultaneous analysis of nitrogen and oxygen isotopes. In this method, denitrifying bacteria are added to water samples to convert all nitrates into N2O. After separation and purification, the generated N2O is sent to the isotope ratio mass spectrometer to determine the δ15N and δ18O value [15,16]. This method requires fewer water samples. At present, it is the mainstream nitrate isotope test method with a simple treatment process, low cost, and high analytical accuracy. However, the bacterial culture cycle is long, and the bacterial culture may be interfered by the toxicity of the samples, causing the test results to deviate from the actual value.
3.1.5. Hydrazoic Acid Method
The treatment process of this method is to add cadmium to the water sample to reduce NO3− to NO2−, and then add azide to reduce NO2− to N2O. After separation, enrichment, and purification, the generated N2O is used to determine the δ15N and δ18O value [17]. The method has the advantages of a simple pretreatment process, low treatment cost, and fewer water samples, and can realize the automatic injection of a large number of samples. However, the method involves toxic and explosive reagents, which is dangerous during testing. NO2− in the water sample will offset the measured δ15N and δ18O value, and the results need to be corrected.
3.2. Isotope Determination Technique
Mass spectrometer is mainly used to determine nitrogen and oxygen isotopes of nitrate in water. With the development of isotope mass spectrometry technology, the joint test of isotope ratio mass spectrometer and element analysis was realized. The element analyzer is connected in series with the mass spectrometer through a continuous flow device. The test process is to wrap the pretreated samples in a silver cup and put them into the automatic sampler of the element analyzer. The subsequent sample pyrolysis, gas injection, and mass spectrometry analysis are completed under the computer control. The test method improves the work efficiency and reduces the sample demand.
4. Research Progress in Identifying Nitrate Pollution Sources in a Water Environment by Isotope Technology
Owing to the diversity of nitrate sources in water, as well as physical, chemical, and biological effects, it is impossible to identify the nitrate sources in a water body by traditional measurement of nitrogen content and morphological changes [18]. At present, as an important research means, the theory and method of stable nitrogen isotope (δ15N) geochemistry have been widely used in the source identification, migration, and transformation of nitrate in various water environments [19,20,21,22].
The research on nitrate pollution source identification by isotope technology has a history of more than 40 years. In the early stage of the study, owing to the limitation of the technology, scholars can only determine the δ15N value of nitrate, and qualitatively identify the main sources of nitrate pollution in water by comparing the δ15N values of several potential nitrate pollution sources.
Generally speaking, the characteristic value of δ15N-NO3− generated from animal excreta or sewage is usually between +7‰ and +20‰ [23,24,25]. The nitrate content in precipitation is low (mostly less than 0‰), and the δ15N value is negative owing to volatilization and elution. The δ15N value of chemical synthetic nitrate fertilizer is about 0‰ [26]. The range of δ15N-NO3− value of organic nitrogen in natural soil is −3~+8‰. Domestic sewage has higher δ15N-NO3−values, ranging from +4 to +19‰. The range of δ15N-NO3− value of organic fertilizer is +5~+25‰ [3,7,27,28].
Although different nitrate sources have different characteristic values of δ15N-NO3− end elements, there are still many overlapping ranges. In addition, the universality of nitrate sources and the influence of nitrogen biogeochemical processes (such as nitrification and denitrification) will change the composition of δ15N-NO3−. The application of δ15N alone in identifying the source of nitrate and the law of migration and transformation is limited.
With continuous progress of research methods, oxygen isotope (δ18O) began to be applied to the source analysis in a water body. δ15N and δ18O isotope methods were used to identify and trace the nitrate source in a water environment and its migration and transformation process [4,29,30,31]. Because different nitrate sources (such as precipitation, nitrate fertilizer, and nitrate from nitrification) have different δ18O-NO3− isotopic characteristics, generally speaking, the range of δ18O-NO3− from nitrate nitrogen fertilizer, precipitation, and nitrification is 17~25‰, 25~75‰, and −10~10‰, respectively [11,32,33]. Therefore, δ18O-NO3− can provide additional information for identifying the sources of nitrate.
Previous studies found that the stable isotope tracing technology of δ15N and δ18O could provide an effective research basis and means [34,35]. However, the complex nitrate pollution sources and nitrogen cycle process in the freshwater environment lead to isotopic fractionation, which changes the initial δ15N and δ18O values in nitrate. This has an impact on the accurate identification of nitrate pollution sources [35]. In order to improve the accuracy of pollution source analysis and obtain effective information on the migration and transformation of nitrogen in the water environment, nitrogen and oxygen isotopes can be combined with hydrochemical data or other isotopic data to trace nitrate pollution sources and nitrogen biogeochemical processes in more detail. The researchers found that NO3− and boron (B) migrate together in the water body, and boron is not affected by the transformation process. In addition, boron isotopes in chemical fertilizer and sewage have different ratios. Therefore, δ11B can be combined with nitrate δ15N and δ18O to identify the pollution source of nitrate accurately [36]. Furthermore, researchers found that the combined use of δ15N-NO3− and δ18O-NO3−, and δ2H-H2O and δ18O-H2O isotope, could increase the accuracy of source resolution results [37]. In addition, the attenuation of dissolved organic carbon (DOC) and the increase in NO3− in the watershed may be closely related to the degradation of organic matter [38]. Therefore, the collaborative study of carbon isotopes can provide more important information in this regard. The δ2H and δ18O of water can identify the recharge source of groundwater, which can provide evidence for identifying the source of nitrate.
It can be seen that the combination of multiple isotope tracing methods and the above control information is an effective method to reduce the research uncertainty. Because the multi-isotope traceability technology is still in the exploratory stage, the multi-isotope traceability mechanism and the multi-isotope and hydrochemical data joint traceability mechanism need to be deeply studied to ensure the accuracy of nitrate pollution source analysis results in a water environment.
5. Definition of Nitrogen and Oxygen Isotope Range of Nitrates from Different Sources
5.1. Range of δ15N-NO3− Values from Different Sources
In recent years, a large number of studies on the application of isotope technology to trace nitrate pollution sources in freshwater environment have emerged, and the nitrogen isotope range of nitrate from different pollution sources changed to a certain extent. Therefore, based on nitrate nitrogen isotope ratios data of different pollution sources in nearly 40 peer-reviewed manuscripts, we reaggregated the range of δ15N-NO3− from different pollution sources (Figure 1).
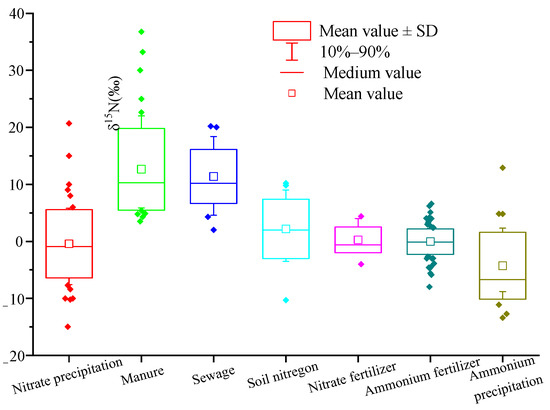
Figure 1.
The box plots of δ15N values of NO3− from different sources. Note: (1) data source: literature [39,40,41,42,43,44,45,46,47,48,49,50,51,52,53,54,55,56,57,58,59,60,61,62,63,64,65,66,67,68,69,70,71]; number of samples: atmospheric deposition NO3−: n = 61; manure: n = 58; sewage: n = 24; soil nitrogen: n = 23; NO3− chemical fertilizer: n = 18; NH4+ chemical fertilizer: n = 117; atmospheric deposition NH4+: n = 31.
The δ15N value of atmospheric nitrogen deposition is affected by complex chemical reactions in the atmosphere and various human activities, such as combustion of fossil fuels [72]. Therefore, the δ15N value range of atmospheric nitrogen deposition in different countries and regions is wide. It can be seen from Figure 1 that the typical δ15N range of atmospheric deposition (NO3−) is −7.7~+5.8‰, with an average of −0.4‰, and the typical δ15N range of atmospheric deposition (NH4+) is −11.1~+ 2.3‰, with an average of −4.3‰.
The organic nitrogen in manure is mainly urea, which is different from synthetic fertilizer urea. The biggest feature is the strong volatilization of ammonia, which leads to the enrichment of 15N in NH4+ in the solution, and causes the formation of NO3− extremely rich 15N [73]. The ammonia content in sewage is very high, which is prone to ammonia volatilization, resulting in the enrichment of δ15N in NO3− from sewage. The typical range of δ15N is similar to that from manure. It can be seen from Figure 1 that the typical range of δ15N in manure and sewage is +5.9~+22.0‰ and +4.6~+18.4‰, respectively, and the average values are +12.7‰ and +11.4‰, respectively.
Soil organic nitrogen mineralization and nitrification form soil natural nitrate. Therefore, the soil δ15N value is mainly affected by soil mineralization and nitrification. In addition, it is also related to soil depth [74], vegetation, climate, and site-specific conditions [64]. From Figure 1, the typical δ15N range of soil nitrogen is −3.5~+9.0‰, with an average of 2.2‰.
Chemical fertilizer is the synthesis of N2 in the atmosphere through artificial nitrogen fixation, with small nitrogen fixation fractionation [75]. Therefore, the typical ranges of δ15N in ammonia nitrogen fertilizer and nitrate nitrogen fertilizer change little, which are −2.7~+2.3‰ and −2.0~+4.0‰, respectively. The average values are 0‰ and +0.3‰, respectively, which is close to 0‰.
5.2. Range of the δ18O-NO3− Value from Different Sources
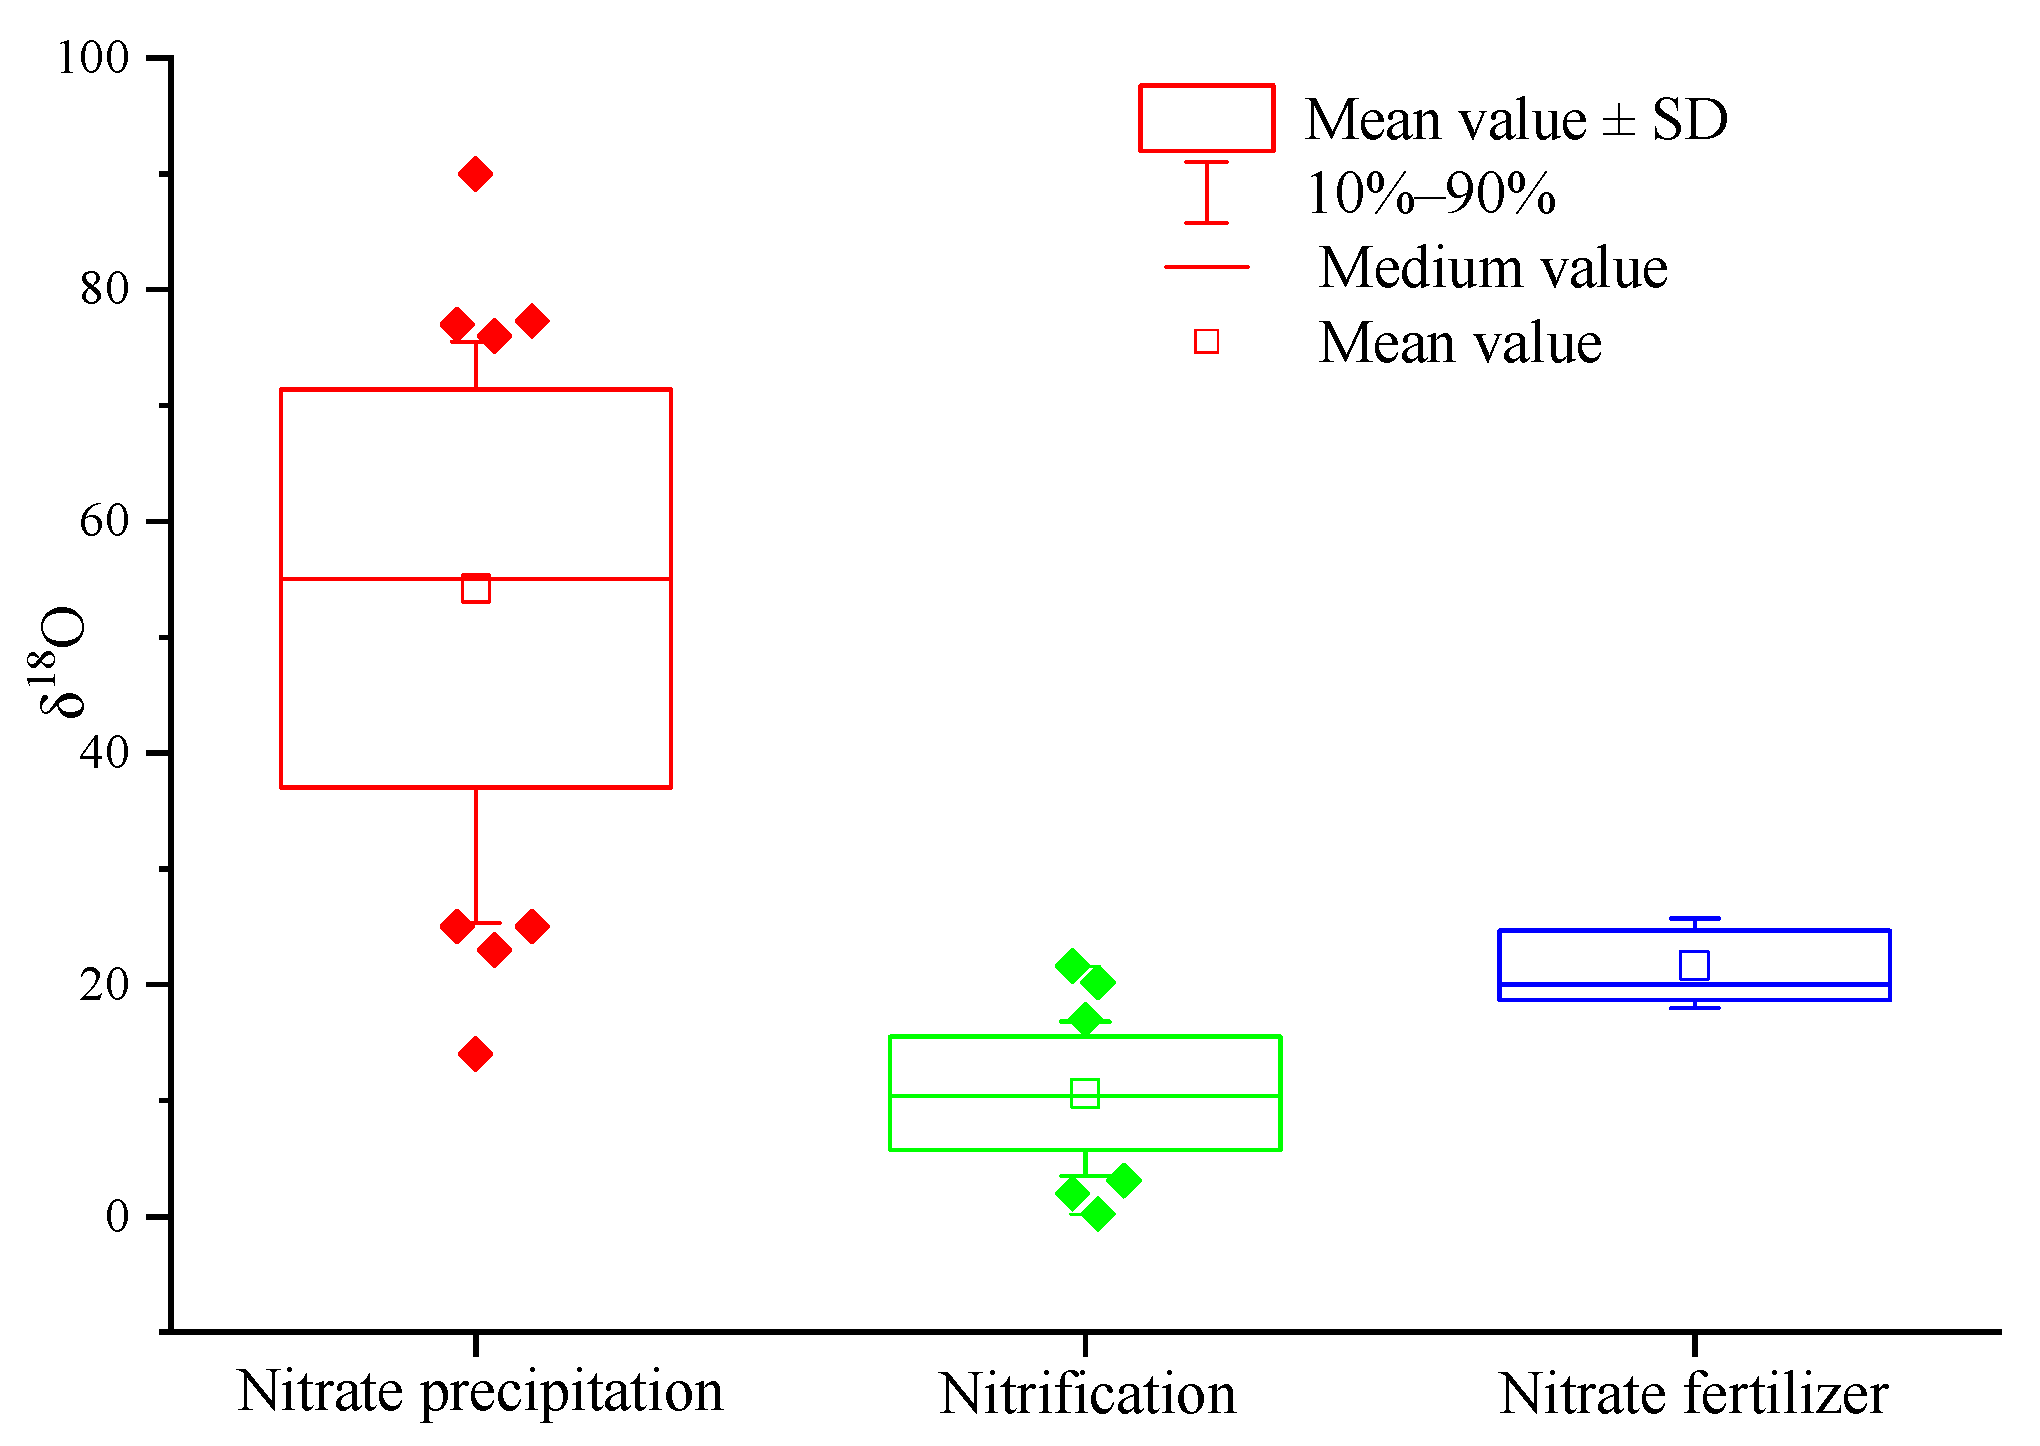
Compared with δ15N-NO3−, δ18O-NO3− is more conducive to distinguishing atmospheric nitrogen deposition (the value range of δ18O is +52.5~+60.9‰) and soil nitrogen (the value range is +0.8~+5.8‰) [67]. Since then, scholars began to use δ18O-NO3−to identify the pollution source of nitrate in a freshwater environment [59,62,68,69]. Previous studies preliminarily determined the value range of δ18O in nitrate from different pollution sources. The value range of δ18O in atmospheric deposition is +23~+75‰, the value range of δ18O of nitrate fertilizer is +18~+24‰, and the value range of δ18O formed by nitrification is −5~+7‰ [56,76]. The author collected the data of nitrate oxygen isotope ratio from different pollution sources in nearly 20 literature sources, and further summarized the range of δ18O-NO3− from different pollution sources (Figure 2).

Figure 2.
The box plots of δ18O values of NO3− from different sources. Note: (1) data source: literature [59,60,61,62,63,64,65,66,67,68,69,70,71,77,78,79,80,81], sample number: atmospheric deposition NO3−: n = 40; nitrification: n = 36; NO3− fertilizer: n = 15.
According to the δ18O values of different nitrate pollution sources, we divide the nitrate pollution sources into three categories: (1) atmospheric deposition; (2) nitrates from nitrification (mainly include soil nitrogen, ammonia nitrogen fertilizer, ammonia in rainfall, and nitrates from sewage and manure); and (3) nitrate nitrogen fertilizer. In Figure 2, 10–90% of the box whisker plots represent the typical range of δ18O-NO3−.
Similar to δ15N in atmospheric nitrogen deposition, the δ18O value of atmospheric nitrogen deposition is affected by complex chemical reactions in the atmosphere [72], resulting in a wide range of δ18O values of atmospheric nitrogen deposition and enrichment of 18O compared with oxygen in the atmosphere (δ18O is 23.5‰) [57]. The reason for the change in δ18O value in atmospheric NO3− is not clear, which may be caused by different degrees of isotopic fractionation during the formation of NO3− in lightning, incomplete combustion of fossil materials in power plants, automobile exhaust, or photochemical reaction [82]. As can be seen from Figure 2, the typical δ18O range of atmospheric nitrogen deposition is +25.0~+75.0‰, and the average value is +54.2‰.
Because one oxygen atom in nitrate comes from oxygen and two oxygen atoms come from water molecules [83], the δ18O of soil water is usually negative. As a result, the NO3− formed by nitrification in soil is significantly lower in 18O than that from the atmosphere, and its δ18O value range is −10~+10‰. However, the δ18O-NO3− values measured in the field are obviously greater than the test value in actual work, and it often further exceeds this range. Scholars have put forward various explanations for this. For example, Wassenaar (1995) believes that the higher value is due to that nitrification occurs in summer and a small amount of denitrification may occur [60]. Kendall et al. (2000) consider that there may be more than one nitrification pathway, and different intermediates have different isotopic components, resulting in a large range of δ18O values [84]. From Figure 2, the typical range of δ18O-NO3− produced by nitrification is +3.5~+16.8‰, and the average value is +10.6‰.
The δ18O-NO3− value of chemical fertilizer is also relatively enriched, because the oxygen atom mainly comes from atmospheric O2 (δ18O = +23.5‰). As shown in Figure 2, the typical range of δ18O in nitrate nitrogen fertilizer is +18.0~+25.7‰, and the average value is +21.7‰.
6. Identification of Nitrogen Migration and Transformation in a Freshwater Environment by Isotope Technology
The migration and transformation of nitrogen in a freshwater environment mainly include assimilation, nitrogen fixation, nitrification, denitrification, and so on. The migration and transformation of nitrogen will lead to the fractionation of nitrate isotopes. Therefore, the principle of isotopic fractionation can be used to identify the process of nitrogen migration and transformation in a freshwater environment. In recent years, researchers have carried out in-depth research on the migration and transformation process of nitrogen in a freshwater environment by jointly using a variety of isotopic methods [85,86,87]. This provides a new research idea for identifying the migration and transformation of nitrogen in a freshwater environment.
In the freshwater environment, if nitrification occurs, the δ18O-NO3− value will be between −10‰–+10‰ [88]. Theoretically, the δ18O-NO3− value produced by microbial nitrification can be approximately equal to 1/3 of that in the atmosphere plus 2/3 of that in groundwater [89]. Assuming that the value of δ18O -O2 in the atmosphere is +23.5‰, combined with the measured value of δ18O in water, the theoretical value of δ18O-NO3− produced by microbial nitrification is calculated. Comparing the theoretical value of δ18O-NO3− with the measured value, we can judge whether nitrification occurs in water [90]. Fadhullah et al. (2020) carried out research on the nitrogen source, migration, and transformation of Bukit Merah reservoir in Malaysia, and jointly applied δ15N and δ18O isotopes of nitrate and δ2H and δ18O isotopes of water to identify that the main migration and transformation process of nitrogen in the reservoir is nitrification and mixing [87].
The identification of nitrogen denitrification in the freshwater environment by the isotope technique has also been studied extensively. Scholars have found that microbial denitrification will increase the δ15N and δ18O values of nitrate, reduce the concentration of nitrate in water, and cause the ratio of δ15N and δ18O to fluctuate between 1.3 and 2.1:1 [91,92]. Therefore, the denitrification of nitrogen in the freshwater environment can be identified according to the ratio of δ15N and δ18O of nitrate. Yi et al. carried out high-frequency monitoring for two tributaries of the Huai River Basin, and jointly applied the δ15N and δ18O isotopes of nitrate to identify that the important process of nitrogen migration and transformation in the river is denitrification [93]. Li et al. (2020) conducted research on nitrogen pollution in Xiangjiang River. Based on the method of combined application of the δ15N and δ18O and NO3−/Cl− ratio diagram of nitrate, they found that denitrification has an important impact on the reduction of nitrate concentration in Xiangjiang River [91].
In addition, some scholars found that the main nitrogen migration and transformation processes in the freshwater environment can be analyzed by calculating the ratio of ∆δ15N/∆δ18O [94,95]. The calculation formula is as follows:
∆δ15N: ∆δ18O = (δ15N − δ15Nm) − (15ε/18ε) × (δ18O − δ18Om)
In the formula, δ15N and δ18O represent the δ15N and δ18O values of nitrate in the upstream input section; δ15Nm and δ18Om represent the δ15N and δ18O values in the selected site; and 15ε/18ε is 1. When ∆δ15N/∆δ18O > 0, this indicates that strong assimilation or denitrification may occur in water, while when ∆δ15N/∆δ18O ≤ 0, this indicates that strong nitrogen fixation and nitrification may occur in water.
7. Quantitative Analysis of Nitrate Pollution Sources in a Freshwater Environment
With the deepening of research, scholars have tried to develop an isotope source analysis model to promote the transition from qualitative research to quantitative research in the identification of nitrate pollution sources. In recent years, researchers have proposed a model based on mass balance to evaluate the contribution rate of different sources to the final sink [96]. They believe that, if there are no more than three nitrate pollution sources in the water body, the contribution rate of each pollution source to nitrate pollution can be quantified by the mixed model based on mass balance in theory. The model can be expressed as follows:
where δ15N and δ18O represent the isotope values in the sample and f1, f2, and f3 represent the proportion of contributions from three pollution sources.
δ15N = f1δ15N1 + f2δ15N2 + f3δ15N3
δ18O = f1δ18O1 + f2δ18O2 + f3δ18O3
1 = f1 + f2 + f3
Deutsch et al. (2006) identified nitrate pollution sources in Mecklenburg River, Germany, and quantitatively analyzed the contribution rate of each pollution source using this model. The results showed that the contribution rates of irrigation water, groundwater, and atmospheric sedimentation to nitrate pollution in river water are 86%, 11%, and 3%, respectively [63].
However, the researchers found that the mass balance model did not take into account some important uncertain factors. The first uncertain factor is the temporal and spatial variability of nitrate δ15N and δ18O values, the second uncertainty is isotope fractionation in denitrification reaction, and the third uncertainty is that the model has no solution when the final sink contains multiple pollution sources [97]. On account of this, Parnell et al. (2010) developed a stable isotope mixing model (SIAR) based on R statistical software (https://www.r-project.org/, 1 February 2011). Based on the Dirichlet distribution, the model constructs a logical prior distribution under the Bayesian framework, taking into account the above three uncertainties [98].
The SIAR model can be expressed as follows:
where Xij is the δ value of isotope j of mixture i, where i = 1, 2, 3, …, N, j = 1, 2, 3, …, J; Pk is the proportion of source k, which needs to be estimated by the model; Sjk is the δ value of isotope j from source k, which follows the normal distribution with mean ωjk and variance μjk; Cjk is the fractionation coefficient of isotope j from source k, which follows the normal distribution with mean τjk and variance λjk; and εjk is the residual error, which represents the variance between other mixtures that cannot be quantified, and its mean value is 0 and standard deviation are σj.
Sjk~N(qjk, ω2jk)
Cjk~ N(λjk, τ2jk)
The SIAR model has broad application prospects. In recent years, it has been applied and achieved good recognition results [99]. Xue et al. (2012) used nitrate δ15N and δ18O values to identify the main sources of nitrate in surface water, and successfully used the SIAR model to quantitatively study the contribution rate of each pollution source. The results showed that the contribution rate of manure and sewage is the highest, followed by soil nitrogen, nitrate nitrogen, and ammonium nitrogen. The contribution rate of rainfall is the lowest [21]. Xue et al. (2013) applied nitrate δ15N, δ18O, and δ11B values to identify the main sources of nitrate in the surface water of Flanders, Belgium, and quantitatively studied the seasonal differences in the contribution rate of potential pollution sources using the SIAR model. The results showed that manure is the main pollution source of nitrate in water (the contribution rate is 9–85%), and the pollution contribution rate of atmospheric sedimentation is the lowest (0.1–24%) in winter. In summer, the main pollution source of nitrate in water is still manure, but the contribution rate decreases (the contribution rate is 8–59%), and the contribution rate of atmospheric sedimentation increases (the contribution rate is 14–47%) [100].
8. Research Deficiency and Prospect
Nitrate pollution has become a worldwide water pollution problem, which has attracted extensive attention of scholars all over the world. In recent years, researchers have applied nitrate δ15N and δ18O isotope technology to carry out many studies on nitrate pollution sources in a freshwater environment [25,26]. However, the accuracy of traceability results needs to be improved. Through summary and analysis, we believe that there are mainly the following deficiencies. Firstly, the determination of the end-member value of nitrate potential pollution source in previous studies is mostly based on the data in the literature, and the end-member values of potential pollution sources in the study area are not measured, which has an impact on the accuracy of the traceability results. Second, although some studies have applied the multi-isotopes traceability method, it is not clear how the multi-isotopes are coupled and used. Third, previous studies focused on identifying the impact of agricultural non-point source pollution (fertilizer and manure) on groundwater nitrate pollution, and did not explore the contribution of urban non-point source pollution to groundwater nitrate pollution. The fourth is that there are many technical methods for identifying nitrate pollution sources and they are messy, and an effective traceability technical system has not been formed.
The stable isotope method has become an important means to identify the source of nitrate pollution in the water environment. The application prospect is broad, and its development direction deserves more attention. In view of the research status in recent years, the author considers that the following aspects should be investigated in-depth in research in the future. First, because there are some differences in the δ15N-NO3− and δ18O-NO3− values of nitrate pollution sources in various regions, more accurate source analysis results are obtained by collecting samples of potential nitrate pollution sources in the study area and by measuring the δ15N-NO3− and δ18O-NO3− values of potential nitrate pollution sources before traceability. Second, the complexity of nitrate pollution sources and a polluted environment in the freshwater environment, coupled with the existence of isotope fractionation in the process of nitrogen migration and transformation, makes it difficult to identify nitrate pollution sources using δ15N-NO3− and δ18O-NO3− alone. Therefore, the nitrogen and oxygen isotopes of nitrate should be combined with other isotopes (such as B, Cl, Sr, H, O, and so on) to further accurately identify the source, migration, and transformation process of nitrogen, which can make up for the shortcomings and improve the accuracy of traceability [33,101]. The identification of nitrate pollution sources in water by multiple isotope techniques is an important direction in the future. Third, the current research on nitrate pollution source analysis in the freshwater environment mostly focuses on the qualitative research level, and there are relatively few studies on quantifying the contribution rate of each pollution source. Therefore, it is necessary to actively introduce and develop advanced quantitative source analysis models (such as the SIAR model), so as to provide a basis for water environment managers to formulate priority control strategies for nitrate pollution. Therefore, the combination of isotope technology and the mathematical model to quantitatively identify the source of nitrate pollution in water and analyze the contribution rate of the source is the focus of future research.
9. Conclusions
Nitrate pollution in freshwater environments is a worldwide water quality problem. In order to prevent the continuous increase in nitrate concentration in freshwater environments, it is necessary to accurately analyze the pollution source of nitrate. At present, the most accurate source analysis method of nitrate in freshwater environments is isotope technology. Because there are certain differences in the stable isotopic composition of nitrate nitrogen and oxygen from different sources, δ15N and δ18O in nitrate can be used to identify the source of nitrate pollution. However, using δ15N-NO3− and δ18O-NO3− can not accurately identify the pollution sources of nitrate owing to the complexity of nitrate pollution sources and nitrogen migration and the transformation process in the freshwater environment, as well as the influence of isotope fractionation. Therefore, it is necessary to use a variety of isotope technologies (such as N, O, B, and Sr isotope) to improve the accuracy of source identification. In recent years, the source analysis model has been applied and developed, which makes it possible to quantitatively analyze the contribution rate of nitrate pollution sources in water. Therefore, the future research direction should be the joint application of multiple isotope technologies to accurately identify the pollution sources of nitrate, and bring the results into the source analysis model to quantitatively analyze the contribution rate of nitrate pollution sources in the freshwater environment, so as to provide a basis for water environment managers to formulate priority control strategies of nitrate pollution.
Author Contributions
Conceptualization, Q.Z. and C.N.; methodology, Q.Z.; software, T.Z. and H.W.; validation, C.N. and Q.Z.; formal analysis, T.Z. and L.X.; investigation, T.Z., L.X., C.N. and H.W.; resources, H.W.; data curation, L.X.; writing—original draft preparation, C.N. and T.Z.; writing—review and editing, H.W. and Q.Z.; visualization, C.N. and T.Z.; supervision, H.W. and Q.Z.; project administration, Q.Z.; funding acquisition, Q.Z. All authors have read and agreed to the published version of the manuscript.
Funding
This work was supported by the projects of the National Natural Science Foundation of China, grant number 41807190; the National Natural Science Foundation of Shanxi Province, grant number 2019JQ-794; and Education Department Foundation of Shanxi Province, grant number 19JK0535.
Institutional Review Board Statement
Not applicable.
Informed Consent Statement
Not applicable.
Data Availability Statement
Not applicable.
Conflicts of Interest
The authors declare no conflict of interest.
References
- Zhang, Q.Q.; Sun, J.C.; Liu, J.T.; Huang, G.X.; Lu, C.; Zhang, Y. Driving mechanism and sources of groundwater nitrate contamination in the rapidly urbanized region of south China. J. Contam. Hydrol. 2015, 182, 221–230. [Google Scholar] [CrossRef]
- Jin, Z.; Qin, X.; Chen, L.; Jin, M.; Li, F. Using dual isotopes to evaluate sources and transformations of nitrate in the West Lake watershed, eastern China. J. Contam. Hydrol. 2015, 177, 64–75. [Google Scholar] [CrossRef]
- Meghdadi, A.; Javar, N. Quantification of spatial and seasonal variations in the proportional contribution of nitrate sources using a multi-isotope approach and Bayesian isotope mixing model. Environ. Pollut. 2018, 235, 207–222. [Google Scholar] [CrossRef]
- Onodera, T.; Komatsu, K.; Kohzu, A.; Kanaya, G.; Mizuochi, M.; Syutsubo, K. Evaluation of stable isotope ratios (δ15N and δ18O) of nitrate in advanced sewage treatment processes: Isotopic signature in four process types. Sci. Total Environ. 2020, 762, 144120. [Google Scholar] [CrossRef] [PubMed]
- Hord, N.G. Dietary Nitrates, Nitrites, and Cardiovascular Disease. Curr. Atheroscler. Rep. 2011, 13, 484–492. [Google Scholar] [CrossRef] [PubMed]
- Pasten-Zapata, E.; Ledesma-Ruiz, R.; Harter, T.; Ramirez, A.I.; Mahlknecht, J. Assessment of sources and fate of nitrate in shallow groundwater of an agricultural area by using a multi-tracer approach. Sci. Total Environ. 2014, 470, 855–864. [Google Scholar] [CrossRef] [Green Version]
- Zhang, Q.; Wang, H.; Wang, L. Tracing nitrate pollution sources and transformations in the over-exploited groundwater region of north China using stable isotopes. J. Contam. Hydrol. 2018, 218, 1–9. [Google Scholar] [CrossRef]
- Ma, B.; Huang, T.; Li, J.; Li, Z.; Long, Y.; Zhang, F.; Pang, Z. Tracing nitrate source and transformation in a semiarid loess aquifer with the thick unsaturated zone. Catena 2021, 198, 105045. [Google Scholar] [CrossRef]
- Wang, Y.J.; Peng, J.F.; Cao, X.F.; Xu, Y.; Qu, J.H. Isotopic and chemical evidence for nitrate sources and transformation processes in a plateau lake basin in Southwest China–ScienceDirect. Sci. Total Environ. 2020, 711, 134856. [Google Scholar] [CrossRef]
- Lockhart, K.M.; King, A.M.; Harter, T. Identifying sources of groundwater nitrate contamination in a large alluvial groundwater basin with highly diversified intensive agricultural production. J. Contam. Hydrol. 2013, 151, 140–154. [Google Scholar] [CrossRef] [PubMed]
- Xue, D.; Botte, J.; Baets, B.D.; Accoe, F.; Nestler, A.; Taylor, P.; Cleemput, O.V.; Berglund, M.; Boeckx, P. Present limitations and future prospects of stable isotope methods for nitrate source identification in surface and groundwater. Water Res. 2009, 43, 1159–1170. [Google Scholar] [CrossRef]
- Granger, J.; Sigman, D.M.; Rohde, M.M.; Maldonado, M.T.; Tortell, P.D. N and O isotope effects during nitrate assimilation by unicellular prokaryotic and eukaryotic plankton cultures. Geochim. Cosmochim. Acta 2010, 74, 1030–1040. [Google Scholar] [CrossRef]
- Feast, N.A.; Hiscock, K.M.; Dennis, P.F.; Andrews, J.N. Nitrogen isotope hydrochemistry and denitrification within the Chalk aquifer system of north Norfolk, UK. J. Hydrol. 1998, 211, 233–252. [Google Scholar] [CrossRef]
- Mao, W.; Liang, Z.W.; Li, W.; Zhu, Y.; Yang, M.Y.; Jia, C.J. Research advances in identifying nitrate pollution sources of water environment by using nitrogen and oxygen stable isotopes. Chin. J. Appl. Ecol. 2013, 24, 1146–1152. (In Chinese) [Google Scholar]
- Sigman, D.M.; Casciotti, K.L.; Andreani, M.; Barford, C.; Galanter, M.; Bohlke, J.K. A bacterial method for the nitrogen isotopic analysis of nitrate inseawater and freshwater. Anal. Chem. 2001, 73, 4145–4153. [Google Scholar] [CrossRef] [PubMed]
- Casciotti, K.L.; Sigman, D.M.; Hastings, M.G.; Bohlke, J.K.; Hilkert, A. Measurement of the oxygen isotopic composition of nitrate inseawater and freshwater using the denitrifier method. Anal. Chem. 2002, 74, 4905–4912. [Google Scholar] [CrossRef] [PubMed]
- Mcilvin, M.R.; Altabet, M.A. Chemical conversion of ni-trate and nitrite to nitrous oxide for nitrogen and oxygenisotopic analysis in freshwater and seawater. Anal. Chem. 2005, 77, 5589–5595. [Google Scholar] [CrossRef] [PubMed]
- Zhang, Q.Q.; Xiao, K.; Wang, F.X.; Sun, J.C.; Jing, T.; Liu, Z.Y. Assessment of temporal and spatial differences of source apportionment of nitrate in an urban river in China, using δ(15)N and δ(18)O values and an isotope mixing model. Environ. Sci. Pollut. Res. Int. 2015, 22, 20226–20233. [Google Scholar] [CrossRef]
- Li, S.; Liu, C.; Li, J.; Liu, X.; Chetelat, B.; Wang, B.; Wang, F. Assessment of the sources of nitrate in the Changjiang River, China using a nitrogen and oxygen isotopic approach. Environ. Sci. Technol. 2010, 44, 1573–1578. [Google Scholar] [CrossRef]
- William, A.B.; Kendall, C.; Cecily, C.Y.; Steven, R.C.; Silva, D.H. Chemical and isotopic evidence of nitrogen transformation in the Mississippi River, 1997–98. Hydrol. Process. 2001, 15, 1285–1300. [Google Scholar]
- Xue, D.; Baets, B.D.; Cleemput, O.V.; Hennessy, C.; Berglund, M.; Boeckx, P. Use of a Bayesian isotope mixing model to estimate proportional contributions of multiple nitrate sources in surface water. Environ. Pollut. 2012, 161, 43–49. [Google Scholar] [CrossRef]
- Yu, Q.; Wang, F.; Li, X.; Yan, W.; Li, Y.; Lv, S. Tracking nitrate sources in the Chaohu Lake, China, using the nitrogen and oxygen isotopic approach. Environ. Sci. Pollut. Res. 2018, 25, 19518–19529. [Google Scholar] [CrossRef]
- Ming, X.; Groves, C.; Wu, X.; Chang, L.; Zheng, Y.; Yang, P. Nitrate migration and transformations in groundwater revealed by dual nitrate isotopes and hydrochemistry in a karst World Heritage site. Sci. Total Environ. 2020, 735, 138907. [Google Scholar] [CrossRef]
- Aravena, R.; Robertson, W.D. Use of Multiple Isotope Tracers to Evaluate Denitrification in Ground Water: Study of Nitrate from a Large-Flux Septic System Plume. Groundwater 2010, 36, 975–982. [Google Scholar] [CrossRef]
- Jiang, H.; Lan, W.; Li, T.; Xu, Z.; Liu, W.; Pan, K. Isotopic Composition Reveals the Impact of Oyster Aquaculture on Pelagic Nitrogen Cycling in a Subtropical Estuary. Water Res. 2020, 187, 116431. [Google Scholar] [CrossRef]
- Yu, L.; Zheng, T.; Zheng, X.; Hao, Y.; Yuan, R. Nitrate source apportionment in groundwater using Bayesian isotope mixing model based on nitrogen isotope fractionation. Sci. Total Environ. 2020, 718, 137242. [Google Scholar] [CrossRef] [PubMed]
- Koh, D.C.; Kim, E.Y.; Ryu, J.S.; Ko, K.S. Factors controlling groundwater chemistry in an agricultural area with complex topographic and land use patterns in mid-western South Korea. Hydrol. Process. 2010, 23, 2915–2928. [Google Scholar] [CrossRef]
- Chen, X.; Jiang, C.; Zheng, L.; Dong, X.; Chen, Y.; Li, C. Identification of nitrate sources and transformations in basin using dual isotopes and hydrochemistry combined with a Bayesian mixing model: Application in a typical mining city. Environ. Pollut. 2020, 267, 115651. [Google Scholar] [CrossRef] [PubMed]
- Gooddy, D.C.; Macdonald, D.; Lapworth, D.J.; Bennett, S.A.; Griffiths, K.J. Nitrogen sources, transport and processing in peri-urban floodplains. Sci. Total Environ. 2014, 494, 28–38. [Google Scholar] [CrossRef] [PubMed] [Green Version]
- Jiang, H.; Liu, W.; Zhang, J.; Zhou, L.; Xu, Z. Spatiotemporal variations of nitrate sources and dynamics in a typical agricultural riverine system under monsoon climate. J. Environ. Sci. 2020, 93, 98–108. [Google Scholar] [CrossRef] [PubMed]
- Yin, C.; Yang, H.A.; Wang, J.F.; Guo, J.Y.; Tang, X.Y.; Chen, J.G. Combined use of stable nitrogen and oxygen isotopes to constrain the nitrate sources in a karst lake. Agric. Ecosyst. Environ. 2020, 303, 107089. [Google Scholar] [CrossRef]
- Matiatos, I. Nitrate source identification in groundwater of multiple land-use areas by combining isotopes and multivariate statistical analysis: A case study of Asopos basin (Central Greece). Sci. Total Environ. 2016, 541, 802–814. [Google Scholar] [CrossRef] [PubMed]
- Zhang, Q.Q.; Wang, H.W. Assessment of sources and transformation of nitrate in the alluvial-pluvial fan region of north China using a multi-isotope approach. J. Environ. Sci. 2020, 89, 9–22. [Google Scholar] [CrossRef]
- Sui, Y.; Ou, Y.; Yan, B.; Rousseau, A.N.; Fang, Y.; Geng, R.; Wang, L.; Ye, N. A dual isotopic framework for identifying nitrate sources in surface runoff in a small agricultural watershed, northeast China. J. Clean. Prod. 2020, 246, 119074. [Google Scholar] [CrossRef]
- Re, V.; Kammoun, S.; Sacchi, E.; Trabelsi, R.; Zouari, K.; Matiatos, I.; Allais, E.; Daniele, S. A critical assessment of widely used techniques for nitrate source apportionment in arid and semi-arid regions. Sci. Total Environ. 2021, 775, 145688. [Google Scholar] [CrossRef] [PubMed]
- Widory, D.; Petelet-Giraud, E.; Negrel, P.; Ladouche, B. Tracking the sources of nitrate in groundwater using coupled nitrogen and boron isotopes: A synthesis. Environ. Sci. Technol. 2005, 39, 539. [Google Scholar] [CrossRef]
- Heaton, T.; Stuart, M.E.; Sapiano, M.; Sultana, M.M. An isotope study of the sources of nitrate in Malta’s groundwater. J. Hydrol. 2012, 414, 244–254. [Google Scholar] [CrossRef]
- Valiente, N.; Carrey, R.; Otero, N.; Soler, A.; Sanz, D.; Muñoz-Martín, A.; Jirsa, F.; Wanek, W.; Gómez-Alday, J.J. A multi-isotopic approach to investigate the influence of land use on nitrate removal in a highly saline lake-aquifer system. Sci. Total Environ. 2018, 631, 649–659. [Google Scholar] [CrossRef]
- Cao, Y.C.; Sun, G.Q.; Xing, G.X.; Xu, H. Natural abundance of 15N in main N-containing chemical fertilizers of China. Pedosphere 1991, 1, 377–382. [Google Scholar]
- Li, X.D.; Masuda, H.; Koba, K.; Zeng, H. Nitrogen isotope study on nitrate-contaminated groundwater in the Sichuan Basin, China. Water Air Soil Pollut. 2007, 178, 145–156. [Google Scholar] [CrossRef]
- Zhang, Y. Nitrogen inputs and isotopes in precipitation in the North China Plain. Atmos. Environ. 2008, 42, 1436–1448. [Google Scholar] [CrossRef]
- Townsend-Small, A.; McCarthy, M.J.; Brandes, J.A.; Yang, L.; Gardner, W.S. Stable isotopic composition of nitrate in Lake Taihu, China, and major inflow rivers. Hydrobiologia 2007, 581, 135–140. [Google Scholar] [CrossRef]
- Elliott, E.M.; Kendall, C.; Wankel, S.D.; Burns, D.A.; Boyer, E.W.; Harlin, K.; Bain, D.J.; Butler, T.J. Nitrogen isotopes as indicators of NOx source contributions to atmospheric nitrate deposition across the Midwestern and Northeastern United States. Environ. Sci. Technol. 2007, 41, 7661–7667. [Google Scholar] [CrossRef] [PubMed]
- Heaton, T.H.E. Isotopic studies of nitrogen pollution in the hydrosphere and atmosphere: A review. Chem. Geol. Isot. Geosci. Sect. 1986, 59, 87–102. [Google Scholar] [CrossRef]
- Fogg, G.E.; Rolston, D.E.; Decker, D.L.; Louie, D.T.; Grismer, M.E. Spatial variation in nitrogen isotope values beneath nitrate contamination sources. Groundwater 1998, 36, 418–426. [Google Scholar] [CrossRef]
- Iqbal, M.Z.; Krothe, N.C.; Spalding, R.F. Nitrogen isotope indicators of seasonal source variability to ground water. Environ. Geol. 1997, 32, 210–218. [Google Scholar] [CrossRef]
- Choi, W.J.; Han, G.H.; Lee, S.M.; Lee, G.T.; Yoon, K.S.; Choi, S.M.; Ro, H.M. Impact of land-use types on nitrate concentration and δ15N in unconfined ground water in rural areas of Korea. Agric. Ecosyst. Environ. 2007, 120, 259–268. [Google Scholar] [CrossRef]
- Choi, W.J.; Lee, S.M.; Ro, H.M.; Cheol, K.; Yoo, K.H. Natural 15N abundances of maize and soil amended with urea and composted pig manure. Plant Soil. 2002, 245, 223–232. [Google Scholar] [CrossRef]
- Choi, W.J.; Ro, H.M.; Lee, S.M. Natural 15N abundances of inorganic nitrogen in soil treated with fertilizer and compost under changing soil moisture regimes. Soil Biol. Biochem. 2003, 35, 1289–1298. [Google Scholar] [CrossRef]
- Curt, M.D.; Aguado, P.; Sánchez, G.; Bigeriego, M.; Fernandez, J. Nitrogen isotope ratios of synthetic and organic sources of nitrate water contamination in Spain. Water Air Soil Pollut. 2004, 151, 135–142. [Google Scholar] [CrossRef]
- Widory, D.; Kloppmann, W.; Chery, L.; Bonnin, J.; Rochdi, H.; Guinamant, J.L. Nitrate in groundwater, an isotope multi-tracer approach. J. Contam. Hydrol. 2004, 72, 165–188. [Google Scholar] [CrossRef]
- Bateman, A.S.; Kelly, S.D. Fertilizer nitrogen isotope signatures. Isot. Environ. Health Stud. 2007, 43, 237–247. [Google Scholar] [CrossRef] [PubMed]
- Xing, G.X.; Cao, Y.C.; Shi, S.L.; Sun, G.Q.; Du, L.J.; Zhu, J.G. Pollution Sources and denitrification of nitrogen in Tai Lake basin. Sci. China. 2001, 31, 130–137. (In Chinese) [Google Scholar]
- Roadcap, G.S.; Hackley, K.C.; Hwang, H.H. Application of Nitrogen and Oxygen Isotopes to Identify Sources of Nitrate. In Proceedings of the 12th Annual Illinois Groundwater Consortium Conference, Makanda, IL, USA, 22 April 2002; Available online: https://www.ideals.illinois.edu/handle/2142/55259. (accessed on 17 September 2021).
- Karr, J.D.; Showers, W.J.; Wendell, G.J.; Scott, A.A. Tracing nitrate transport and environmental impact from intensive swine farming using delta nitrogen. J. Environ. Qual. 2001, 30, 1163–1175. [Google Scholar] [CrossRef]
- Mariotti, A.; Landreau, A.; Simon, B. 15N isotope biogeochemistry and natural denitrification process in ground water: Application to the chalk aquifer in northern France. Geochim. Cosmochim. Acta. 1988, 52, 1869–1878. [Google Scholar] [CrossRef]
- McClelland, J.W.; Valiela, I. Linking nitrogen in estuarine producers to land-derived sources. Limnol. Oceanogr. 1998, 43, 577–585. [Google Scholar] [CrossRef] [Green Version]
- Bedard-Haughn, A.; Groenigen, J.; Kessel, C.V. Tracing 15N through landscapes: Potential uses and precautions. J. Hydrol. 2003, 272, 175–190. [Google Scholar] [CrossRef]
- Li, S.L.; Liu, C.Q. The character and application of δ18O-NO3− in the groundwater of Guiyang. Carsologica Sin. 2006, 25, 108–111. (In Chinese) [Google Scholar]
- Wassenaar, L.I. Evaluation of the origin and fate of nitrate in the Abbotsford Aquifer using the isotopes of 15N and 18O in NO3−. Appl. Geochem. 1995, 10, 391–405. [Google Scholar] [CrossRef]
- Rock, L.; Mayer, B. Isotopic assessment of sources and processes affecting sulfate and nitrate in surface water and ground water of Luxembourg. Isot. Environ. Health Stud. 2002, 38, 191–206. [Google Scholar] [CrossRef] [PubMed]
- Mayer, B.; Bollwerk, S.M.; Mansfeldt, T.; Hütter, B.; Veizer, J. The oxygen isotope composition of nitrate generated by nitrification in acid forest floors. Geochim. Cosmochim. Acta 2001, 65, 2743–2756. [Google Scholar] [CrossRef]
- Deutsch, B.; Mewes, M.; Liskow, I.; Voss, M. Quantification of diffuse nitrate inputs into a small river system using stable isotopes of oxygen and nitrogen in nitrate. Org. Geochem. 2006, 37, 1333–1342. [Google Scholar] [CrossRef]
- Spoelstra, J.; Schiff, S.L.; Hazlett, P.W.; Jeffries, D.S.; Semkin, R.G. The isotopic composition of nitrate produced from nitrification in a hardwood forest floor. Geochim. Cosmochim. Acta 2007, 71, 3757–3771. [Google Scholar] [CrossRef]
- Kendall, C. Tracing nitrogen sources and cycling in catchments. In Isotope Tracers in Catchment Hydrology; Elsevier: Amsterdam, The Netherlands, 1998; pp. 519–576. Available online: https://www.sciencedirect.com/science/article/pii/B9780444815460500239. (accessed on 17 September 2021).
- Durka, W.; Schulze, E.D.; Gebauer, G.; Susanne, V. Effects of forest decline on uptake and leaching of deposited nitrate determined from 15N and 18O measurements. Nature 1994, 372, 765–767. [Google Scholar] [CrossRef]
- Piatek, K.B.; Mitchell, M.J.; Silva, S.R.; Kendall, C. Sources of nitrate in snowmelt discharge: Evidence from water chemistry and stable isotopes of nitrate. Water Air Soil Pollut. 2005, 165, 13–35. [Google Scholar] [CrossRef]
- Hales, H.C.; Ross, D.S.; Lini, A. Isotopic signature of nitrate in two contrasting watersheds of Brush Brook, Vermont, USA. Biogeochemistry 2007, 84, 51–66. [Google Scholar] [CrossRef]
- Lee, K.S.; Bong, Y.S.; Lee, D.; Kim, Y. Tracing the sources of nitrate in the Han River watersheds in Korea, using δ15N-NO3− and δ18O- NO3− values. Sci. Total Environ. 2008, 395, 117–124. [Google Scholar] [CrossRef]
- Pardo, L.H.; Kendall, C.; Pett-Ridge, J.; Chang, C.C.Y. Evaluating the source of stream water nitrate using 15N and 18O in nitrate in two watersheds in New Hampshire, USA. Hydrol. Process. 2004, 18, 2699–2712. [Google Scholar] [CrossRef]
- Finlay, J.C.; Sterner, R.W.; Kumar, S. Isotopic evidence for in-lake production of accumulating nitrate in Lake Superior. Ecol. Appl. 2007, 17, 2323–2332. [Google Scholar] [CrossRef]
- Hübner, H. Isotope Effects of Nitrogen in the Soil and Biosphere; Elsevier: Amsterdam, The Netherlands, 1986; pp. 361–425. [Google Scholar]
- Rivers, C.N.; Barrett, M.H.; Hiscock, K.M.; Dennis, P.F.; Feast, N.A.; Lerner, D.N. Use of nitrogen isotopes to identify nitrogen contamination of the Sherwood sandstone aquifer beneath the city of Nottingham, United Kingdom. Hydrogeol. J. 1996, 4, 90–102. [Google Scholar] [CrossRef]
- Mariotti, A.; Letolle, R. Application de l’etudeisotopique de l’azote en hydrologie et en hydrogeology-analyse desresultatsobtenussur un exempleprecis: Le Bassin de Melarchez (Seine-et-Marne, France). J. Hydrol. 1977, 33, 157–172. [Google Scholar] [CrossRef]
- Flipse, W.J.; Bonner, F.T. Nitrogen-isotope ratios of nitrate in ground water under fertilized fields, Long Island, New York. Groundwater 1985, 23, 59–67. [Google Scholar] [CrossRef]
- Kendall, C.; Campbell, D.H.; Burns, D.A.; Shanley, J.B.; Chang, C.Y. Tracing sources of nitrate in snowmelt runoff using the oxygen and nitrogen isotopic compositions of nitrate. Biogeochem. Seas. Snow-Cover. Catchments Proc. Boulder Symp. 1995, 228, 339–347. [Google Scholar]
- Aravena, R.; Evans, M.L.; Cherry, J.A. Stable Isotopes of Oxygen and Nitrogen in Source Identification of Nitrate from Septic Systems. Groundwater 1993, 31, 180–186. [Google Scholar] [CrossRef]
- Williard, K.; Dewalle, D.R.; Edwards, P.J.; Sharpe, W.E. 18O isotopic separation of stream nitrate sources in mid-Appalachian forested watersheds. J. Hydrol. 2001, 252, 174–188. [Google Scholar] [CrossRef]
- Kendall, C.; Elliott, E.M.; Wankel, S.D. Tracing Anthropogenic Inputs of Nitrogen to Ecosystems. Blackwell Publ. 2007, 2, 375–449. [Google Scholar]
- Amberger, A.; Schmidt, H.L. Natural isotope contents of nitrate as indicators for its origin. Geochim. Cosmochim. Acta 1987, 51, 2699–2705. [Google Scholar] [CrossRef]
- Fukada, T.; Hiscock, K.M.; Dennis, P.F. A dual isotope approach to the nitrogen hydrochemistry of an urban aquifer. Appl. Geochem. 2004, 19, 709–719. [Google Scholar] [CrossRef]
- Zhang, H.; Kang, X.; Wang, X.; Zhang, J.; Chen, G. Quantitative identification of nitrate sources in the surface runoff of three dominant forest types in subtropical China based on Bayesian model. Sci. Total Environ. 2019, 703, 135074. [Google Scholar] [CrossRef]
- Hollocher, T.C. Source of the oxygen atoms of nitrate in the oxidation of nitrate by nitrocacteragilis and evidence against a P-O-N anhydride mechanism in oxidative phosphorylation. Arch. Biochem. Biophys. 1984, 233, 721–727. [Google Scholar] [CrossRef]
- Kendall, C.; Aravena, R. Nitrate isotopes in groundwater systems. In Environmental Tracers in Subsurface Hydrology; Springer: New York, NY, USA, 2000; pp. 261–297. [Google Scholar]
- Jiang, H.; Ma, J.; Xu, H.; Xu, Z.; Liu, W.; Pan, K. Multiple isotopic compositions reveal complex nitrogen cycling in a subtropical estuary. Environ. Pollut. 2021, 272, 116410. [Google Scholar] [CrossRef] [PubMed]
- Zhao, Y.; Zheng, B.; Jia, H.; Chen, Z. Determination sources of nitrates into the Three Gorges Reservoir using nitrogen and oxygen isotopes. Sci. Total Environ. 2019, 687, 128–136. [Google Scholar] [CrossRef]
- Fadhullah, W.; Yaccob, N.S.; Syakir, M.I.; Muhammad, S.A.; Li, S.L. Nitrate sources and processes in the surface water of a tropical reservoir by stable isotopes and mixing model. Sci. Total Environ. 2020, 700, 134517. [Google Scholar] [CrossRef]
- Jiang, H.; Zhang, Q.Q.; Liu, W.J.; Zhang, J.Y.; Pan, K.; Zhao, T.; Xu, Z.F. Isotopic compositions reveal the driving forces of high nitrate level in an urban river: Implications for pollution control. J. Clean. Prod. 2021, 298, 126693. [Google Scholar] [CrossRef]
- Jiang, H.; Zhang, Q.Q.; Liu, W.J.; Zhang, J.Y.; Zhao, T.; Xu, Z.F. Climatic and anthropogenic driving forces of the nitrogen cycling in a subtropical river basin. Environ. Res. 2021, 194, 110721. [Google Scholar] [CrossRef] [PubMed]
- Narsimha, A.; Hui, Q. Groundwater chemistry, distribution and potential health risk appraisal of nitrate enriched groundwater: A case study from the semi-urban region of South India. Ecotoxicol. Environ. Saf. 2021, 207, 111277. [Google Scholar]
- Li, C.; Li, S.L.; Yue, F.J.; Liu, J.; Zhong, J.; Yan, Z.F.; Zhang, R.C.; Wang, Z.J.; Xu, S. Identification of sources and transformations of nitrate in the Xijiang River using nitrate isotopes and Bayesian model. Sci. Total Environ. 2019, 646, 801–810. [Google Scholar] [CrossRef]
- Panno, S.V.; Hackley, K.C.; Kelly, W.R.; Hwang, H.H. Isotopic evidence of nitrate sources and denitrification in the Mississippi River, Illinois. J. Environ. Qual. 2006, 35, 495–504. [Google Scholar] [CrossRef]
- Yi, Q.; Zhang, Y.; Xie, K.; Chen, Q.W.; Zheng, F.F.; Tonina, D.; Shi, W.Q.; Chen, C. Tracking nitrogen pollution sources in plain watersheds by combining high-frequency water quality monitoring with tracing dual nitrate isotopes. J. Hydrol. 2020, 581, 124439. [Google Scholar] [CrossRef]
- Yang, Z.; Chen, J.; Li, H.; Jin, H.; Gao, S.; Ji, Z.; Zhu, Y.; Ran, L.; Zhang, J.; Liao, Y. Sources of nitrate in Xiangshan Bay (China), as identified using nitrogen and oxygen isotopes. Estuar. Coast. Shelf Sci. 2018, 207, 109–118. [Google Scholar] [CrossRef]
- Humborg, C.; Conley, D.J.; Rahm, L.; Wulff, F.; Ittekkot, V. Silicon retention in river basins: Far-reaching effects on biogeochemistry and aquatic food webs in coastal marine environments. AMBIO J. Hum. Environ. 2000, 29, 45–50. [Google Scholar] [CrossRef]
- Phillips, D.L.; Koch, P.L. Incorporating concentration dependence in stable isotope mixing models. Oecologia 2002, 130, 114–125. [Google Scholar] [CrossRef] [PubMed]
- Moore, J.W.; Semmens, B.X. Incorporating uncertainty and prior information into stable isotope mixing models. Ecol. Lett. 2008, 11, 470–480. [Google Scholar] [CrossRef] [PubMed]
- Parnell, A.C.; Inger, R.; Bearhop, S.; Jackson, A.L.; Rands, S. Source partitioning using stable isotopes: Coping with too much variation. PLoS ONE 2010, 5, e9672. [Google Scholar] [CrossRef] [PubMed]
- Zhang, H.; Xu, Y.; Cheng, S.; Li, Q.; Yu, H. Application of the dual-isotope approach and Bayesian isotope mixing model to identify nitrate in groundwater of a multiple land-use area in Chengdu Plain, China. Sci. Total Environ. 2020, 717, 137134. [Google Scholar] [CrossRef] [PubMed]
- Xue, D.; Baets, B.D.; Cleemput, O.V.; Hennessy, C.; Berglund, M.; Boeckx, P. Classification of Nitrate Polluting Activities through Clustering of Isotope Mixing Model Outputs. J. Environ. Qual. 2013, 42, 1486–1497. [Google Scholar] [CrossRef] [PubMed]
- Kruk, M.K.; Mayer, B.; Nightingale, M.; Laceby, J.P. Tracing nitrate sources with a combined isotope approach (δ15N-NO3, δ18O-NO3 and δ11B) in a large mixed-use watershed in southern Alberta, Canada. Sci. Total Environ. 2019, 703, 135043. [Google Scholar] [CrossRef] [PubMed]

Publisher’s Note: MDPI stays neutral with regard to jurisdictional claims in published maps and institutional affiliations. |
© 2021 by the authors. Licensee MDPI, Basel, Switzerland. This article is an open access article distributed under the terms and conditions of the Creative Commons Attribution (CC BY) license (https://creativecommons.org/licenses/by/4.0/).