Abstract
Mixed findings in the literature on the effects of older adult employment on well-being and the reciprocal influence of well-being on employment suggest the need for more careful methodology in teasing out this relationship. Moreover, as previous research has shown that different domains of well-being relate to constructs differently, more nuanced definitions of well-being may be appropriate. The present study examined the longitudinal bidirectional associations of employment and different domains of well-being, controlling for stable within-person variables. The present study sampled older adults from the Midlife Development in the US study at three timepoints on employment status and well-being, specifically psychological, social, and subjective well-being. A Random-Intercept Cross-lagged Panel Model (RI-CLPM) approach was employed to determine the longitudinal bidirectional influence of employment and domains of well-being. Results showed that employment status was not associated with various well-being domains at a later time point. Results also showed that greater well-being, specifically in meaningfulness of society and personal growth, was associated with being employed at a later time point.
1. Introduction
The proportion of older persons aged 55 and above is increasing at an unprecedented rate. This observed trend may be in part explained by improvements in the current standard of living and modern medicine [1,2]. In fact, life expectancy has increased by more than 6 years within the span of the last two decades (2000–2019; [3]). Despite an increase in life expectancy, this does not equate to a corresponding increase in quality of life. Indeed, an increase in life expectancy has been associated with increased risk of diseases such as cardiovascular diseases, osteoporosis, hyperlipidemia, cancer, disability, and dementia [4,5,6]. Preventive and nonpharmacological approaches to tackle these issues and improve the quality of life among older adults have consequently garnered significant attention in recent years [7,8,9]. The concept of active ageing embodies the spirit of these nonpharmacological approaches.
The basic tenets that underpin the concept of active ageing have been longstanding in gerontological theories. One such example is the Activity Theory of Ageing [10,11]. In the seminal work by Havighurst and colleagues [10,11], the Activity Theory of Ageing examines the experience of an elderly person when he/she encounters biopsychosocial decline in one’s later years (e.g., retirement, role loss, and death). Cavan and colleagues [10] posited that reduction in well-being was largely due to maladaptive adjustments to said decline. In other words, in a world where activity-oriented, work-related lifestyle serves as a standard of well-being, an important issue of life in one’s later years is the dissociation caused when one’s present state of living no longer conforms to this standard [12]. Hence, a solution to this problem is to adjust one’s life to reflect this standard again, taking on a number and variety of “productive” roles. The theory asserts a positive relationship between older adult’s participation in social activities and life satisfaction, stemming from the underlying notion that beyond from physical decline, psychosocial needs remain [13]. Consequently, older adults would thrive in group and community affairs, which are unfortunately often blocked by social norms such as forced retirement [14].
1.1. Older Adult Employment and Well-Being
Older adult employment has been posited to carry a host of benefits, beyond productivity, and economic gain [15,16]. Using a sample of close to 8000 mid-to-older adults, growth curve models assessing the effects of productive activities on mental health trajectories revealed protective effects [17]. Specifically, full-time employment and low-level volunteering had an independent protective effect against decline in psychological well-being, with the joint participation of both resulting an in even stronger protective effect [17]. Similarly, research on older adult employment and well-being have suggested that working beyond traditional retirement ages may yield mental health benefits. In a systematic literature review by Maimaris and Lock [18], five of the seven cross-sectional studies examined reported improved mental health among individuals who had engaged in work beyond retirement age; the other two studies reported non-significant benefits. Of the three longitudinal studies reviewed, all had reported significant benefits of work on mental health [18]. Despite these promising findings, more recent literature has been mixed. In a recent systematic literature review by Baxter and colleagues [19] examining the effects of employment beyond traditional working age on mental health, of the five studies examined: one had reported positive effects, three a neutral effect, and two an adverse effect. These mixed findings may be a result of confounding variables such as individual lifestyle, socioeconomic status, and personality factors [18], with different studies having controlled for a different set of confounds. Further, individual domains of well-being may be associated with employment differently [20,21]. Examining the effects of employment on well-being as a singular construct may fail to capture a potentially more nuanced relationship.
Research has also suggested a reserve direction in the employment–well-being relationship; that is, well-being influences employment. The reverse causal or selection hypothesis presupposes that unemployment may be a consequence of poor mental health and well-being. In a meta-analysis involving 49 independent samples, poor mental health was shown to have a significant negative effect on re-employment [22]. Similarly, poor well-being has been associated with poorer job performance and increased likelihood of future unemployment [23,24]. Indeed, poorer well-being may lead to unsatisfactory job behaviors such as absenteeism, leading to dismissal [25]. Contrary to these findings, however, several studies have suggested the opposite effect of poorer well-being predicting employment [26,27]. Results indicated that a greater loss in well-being motivated efforts towards re-employment so as to reinstate one’s sense of well-being [26]. In line with this observation, when the unemployment rate among an individual’s reference group was higher, there was a smaller drop in well-being among the unemployed, and a reduction in job search intensity [27]. That is, for the unemployed, when relevant others were also jobless, there was a smaller drop in well-being and a reduced intensity in job search, in comparison to when relevant others were employed.
The current body of literature examining the effects of older adult employment on well-being has been mixed. Literature on the reverse effect of well-being on employment have also been mixed. In order to better understand the relationship between older adult employment and well-being, and considering potential policy and intervention implications, this necessitates further examination.
1.2. The Current Study
Three key challenges in the current body of literature have prompted this study. First, the mixed findings on the effects of older adult employment on well-being suggests the need for more careful methodology in teasing out this relationship. Well-being is a result of a host of factors, such as lifestyle, personality, and socioeconomic status. Accurately examining the impact of employment on well-being poses a challenge, given the number of potential factors involved and the individual differences in these factors. While studies have attempted to control for socioeconomic variables, demographic factors, and pre-existing medical conditions [28,29,30,31,32], no gerontology study to our knowledge had controlled for multiple trait-like constructs such as personality, temperament, childhood socioeconomic status, etc. These variables may very well confound said relationship, contributing to the mixed results in the literature. Second, among studies that explored the reverse direction of well-being on employment, these findings have also been mixed. Once again, these studies had not controlled for multiple trait-like constructs. These variables may likewise confound the effects of well-being on employment. Thus, a robust methodology using more stringent controls for potential confounds of this reverse relationship is warranted. Third, as the subdomains of well-being may relate to employment differently, exploring the association between employment and well-being as a single construct may fail to capture these nuances. Hence, in order to understand the relationship between older adult employment and well-being in its entirety, investigating how employment may be related to different subdomains of well-being is imperative.
2. Materials and Methods
2.1. Participants
The current study comprises of older adults from the first [33], second [34], and third [35] wave of the Midlife in the United States (MIDUS) survey study. The MIDUS study was conducted on a random-digit-dial sample of non-institutionalized, English-speaking adults. The survey portion of MIDUS 1 (Timepoint 1; T1), MIDUS 2 (Timepoint 2; T2), and MIDUS 3 (Timepoint 3; T3) were conducted between 1995 and 1997; 2004 and 2006; and 2013 and 2015, respectively. In accordance with studies on older adults, individuals below the age of 55 were excluded from the study [36,37]. Individuals who were reported to be full-time students were also excluded from the study. The resultant sample consisted of 695 individuals. A sample size of more than 200 participants has been suggested to be necessary for complex structural equation modelling [38], of which RI-CLPM is a specification of. Given that more complex models such as the model examined in the current study would require a larger sample, the current sample size of 695 participants was judged to be appropriate, similar to past research employing a three-wave RI-CLPM approach [39,40,41]. Table 1 summarizes the descriptive statistics of our sample. Data and materials of the current study may be accessed via the Inter-University Consortium for Political and Social Research website.

Table 1.
Descriptive statistics of study sample.
2.2. Measures
Employment status. Employment status was recorded at three timepoints—MIDUS 1, MIDUS 2, and MIDUS 3—and was coded as unemployed (0) or employed (1).
Social well-being. Social well- being was assessed using a 15-item inventory [42], at three timepoints. The 15-item scale measures social well-being through five domains: social coherence (e.g., “I cannot make sense of what’s going on in the world”), social integration (e.g., “I don’t feel I belong to anything I’d call a community”), social acceptance (e.g., “People do not care about other people’s problems”), social contribution (e.g., “I have something valuable to give to the world”), and social actualization (e.g., “Society has stopped making progress”. Response was captured by a 7-point Likert scale (1 = Strongly agree to 7 = Strongly disagree). Higher scores indicated greater social well-being.
Psychological well-being. Psychological wellbeing was assessed using an 18-item scale [43], at three timepoints. The scale captures psychological well-being across six domains: positive relations with others (e.g., “Maintaining close relationships has been difficult and frustrating for me”), self-acceptance (e.g., “I like most parts of my personality”), autonomy (e.g., “I have confidence in my own opinions, even if they are different from the way most other people think”), personal growth (e.g., “For me, life has been a continuous process of learning, changing, and growth”), environmental mastery (e.g., “The demands of everyday life often get me down”), and purpose in life (e.g., “Some people wander aimlessly through life, but I am not one of them”). Response was captured by a 7-point Likert scale (1 = Strongly agree to 7 = Strongly disagree). Higher scores indicated greater psychological well-being.
Subjective well-being. Subjective well-being was assessed through positive and negative affect. Positive affect was assessed using a 6-item inventory [44], at three timepoints. The six items measure frequency of experienced positive affect over the past 30 days (e.g., “During the past 30 days, how much of the time did you feel cheerful?”). Response was captured on a 5-point Likert scale (1 = All of the time to 5 None of the time). Lower scores indicated greater positive affect. Negative affect was assessed using a 6-item inventory [44], at three timepoints. The six items measure frequency of experienced negative affect over the past 30 days (e.g., “During the past 30 days, how much of the time did you feel so sad nothing could cheer you up?”). Response was captured on a 5-point Likert scale (1 = All of the time to 5 None of the time). Lower scores indicated greater negative affect.
Covariates. Covariates included in this study were sex, age, education, ethnicity, and health. Sex and ethnicity were coded as a dichotomous variable (male vs. female; white vs. non-white). Education was rated on a scale of 1 (No school) to 12 (Ph.D, ED. D, MD, LLB, LLD, JD, or other professional degree). Health was assessed using a self-reported measure on physical health (i.e., “In general, would you say your physical health is...”), with response being capture on a 5-point Likert scale (1= poor to 5 = Excellent). Demographic covariates used were assessed at baseline. Health was assessed at each of the three timepoints.
2.3. Statistical Analysis
The present study aimed to examine longitudinal bidirectional associations between employment and well-being—specifically psychological, social, and subjective well-being—controlling for within-person trait-like constructs. In order to achieve this, we employed a Random-Intercept Cross-Lagged Panel Model (RI-CLPM) approach in our analyses. The standard Cross-Lagged Panel Model (CLPM) is a popular method used to analyze interactions and bidirectional associations between longitudinally assessed variables, estimating autoregressive and cross-lagged effects within and between variables of interest, respectively [45]. RI-CLPM is an alternative specification to the CLPM, accounting for within-person autoregressive and cross-lagged effects [45,46]. We conducted our analyses in R version 3.6.3 [47] using three-wave random-intercept cross-lagged panel model (RI-CLPM). Correlations were computed using Hmisc version 4.5-0 [48] and RI-CLPM was computed using lavaan version 0.6-7 [49]. The RI-CLPM included both autoregressive and cross-lagged paths between employment and well-being, as well as reciprocal paths between well-being and employment. Each domain of well-being and its relation to employment was separately examined. First, associations between employment and five domains of social well-being were examined: meaningfulness of society, social integration, social actualization, social contribution, and acceptance of others. Next, associations between employment and the six domains of psychological well-being were examined: positive relations with others, self-acceptance, autonomy, personal growth, environmental mastery, and purpose in life. Last, associations between employment and subjective well-being were examined: positive affect, negative affect. The RI-CLPM used in the current investigation can be found in Figure 1.
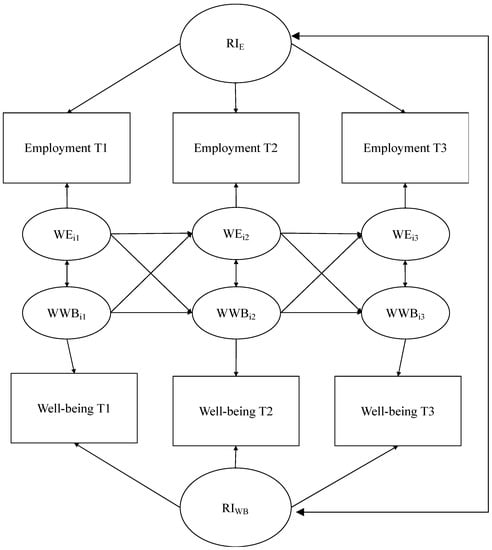
Figure 1.
Graphic representations of the random intercept cross-lagged panel model (RI-CLPM) examined in the study. Squares represent observed variables (i.e., employment status, well-being scores), circles denote latent variables. WEit denotes within-person employment status and WWBit denotes within-person well-being domain, of unit i at timepoint t. RIE denotes the random intercept of employment and RIWB denotes the random intercept of well-being.
We ran the unconstrained RI-CLPM controlling for time-invariant covariates (TICs) and time-varying covariates (TVCs). Although autoregressive and cross-lagged paths may be constrained to be equal across time, this is not a general precondition for the model to be applied; changes in the magnitude or either autoregressive or cross-lagged path suggests shifts in the developmental system [45]. Lifespan theories suggest changing psychosocial developmental needs from age 55 and beyond [50,51,52]. Hence, in line with existing theories, it was assumed that the reciprocal influence between employment and well-being differed between timepoints, and cross-lagged paths were not constrained. Similarly, owing to the social convention of forced retirement beyond a certain age [14,53,54], and rapid changes relating to physical deterioration may result in sudden changes in well-being [55,56,57], we did not constrain autoregressive paths. TICs specified in the model were sex, age, education, and ethnicity; the TVC specified in the model was health. Although statistical methods like the RI-CLPM control for the influence of any implicit/unobserved third variable that does not change across time (e.g., personality, demographics, lifestyle, etc.), some TICs, while still maintaining their value, may assert a different influence across time. For example, sex, while generally remaining unchanged, may exert a different influence on employment and well-being across time [58,59]. Consequently, by introducing TICs such as sex, age, education, and ethnicity as observed third variables in our models, we avoid assuming that these TICs have a uniformed influence on variables of interest across time [60]. As opposed to TICs, TVCs change across time and have different values at each timepoint. As health was expected to differ across lifespan, it was introduced into our models as a TVC, reflected by separate health measures at each timepoint. To test the various model, we adopted the most frequently reported model indices of Comparative Fit Index (CFI) and root-mean-square error of approximation (RMSEA), with criterion values of around 0.95 and up to 0.08, respectively [61].
3. Results
Means, standard deviations, and zero-order correlations for social well-being, psychological well-being, and subjective well-being may be found in Appendix A (Table A1, Table A2 and Table A3). Zero-order correlations revealed small to medium correlations between the various domains of social well-being and across timepoints (r = 0.06 to 0.58). A similar pattern was observed among psychological (r = 0.05 to 0.62) and subjective well-being domains (r = 0.34 to 0.64).
3.1. Employment and Social Well-Being
Meaningfulness of Society (Social Coherence). The RI-CLPM with employment and meaningfulness of society was found to be of good fit (χ2(31) = 80.681, p < 0.05; CFI = 0.963, TLI = 0.906, RMSEA = 0.048, 90% CI (0.035, 0.061)). Results indicate a significant autoregressive influence of employment between timepoint 1 and 2 (βT1T2 = 0.32, p < 0.001) and timepoint 2 and 3 (βT2T3 = 0.28, p <0.001). Results also indicated a significant cross-lagged influence. Meaningfulness of society at timepoint 2 was found to predict employment at timepoint 3 (βT2T3 = 0.03, p = 0.015). No other paths were significant.
Social integration. The RI-CLPM with employment and social integration was found to be of good fit (χ2(31) = 81.536, p < 0.05; CFI = 0.961, TLI = 0.902, RMSEA = 0.048, 90% CI (0.036, 0.061)). Results indicate a significant autoregressive influence of employment across timepoints (βT1T2 = 0.33, βT2T3 = 0.29, p < 0.001). Results also indicated a significant autoregressive influence of social integration across timepoints (βT1T2 = 0.18, p = 0.015; βT2T3 = 0.19, p = 0.044). No other paths were significant.
Social actualization. The RI-CLPM with employment and social actualization was found to be of good fit (χ2(31) = 81.173, p < 0.05; CFI = 0.955, TLI = 0.886, RMSEA = 0.048, 90% CI (0.036, 0.061)). Results indicate a significant autoregressive influence of employment across timepoints (βT1T2 = 0.34, βT2T3 = 0.29, p < 0.001). Results also indicated a significant autoregressive influence of social actualization between timepoint 1 and 2 (βT1T2 = 0.25, p < 0.001). No other paths were significant.
Social contribution. The RI-CLPM with employment and social contribution was found to be of good fit (χ2(31) = 82.324, p < 0.05; CFI = 0.962, TLI = 0.905, RMSEA = 0.049, 90% CI (0.036, 0.062)). Results indicate a significant autoregressive influence of employment across timepoints (βT1T2 = 0.33, βT2T3 = 0.28, p < 0.001). Results also indicated a significant autoregressive influence of social contribution across timepoints (βT1T2 = 0.25, βT2T3 = 0.25, p < 0.01). No other paths were significant.
Acceptance of Others (Social Acceptance). The RI-CLPM with employment and acceptance of others was found to be of good fit (χ2(31) = 78.216, p < 0.05; CFI = 0.957, TLI = 0.891, RMSEA = 0.047, 90% CI (0.034, 0.060)). Results indicate a significant autoregressive influence of employment across timepoints (βT1T2 = 0.33, βT2T3 = 0.29, p < 0.001). Results also indicated an autoregressive influence of acceptance of others between timepoint 1 and 2 (βT1T2 = 0.19, p < 0.01). No other paths were significant.
Results from RI-CLPM analyses of employment and social well-being maybe found in Appendix B (Table A4).
3.2. Employment and Psychological Well-Being
Positive relations with others. The RI-CLPM with employment and positive relations with others was found to be of good fit. (χ2(31) = 92.540, p < 0.05; CFI = 0.956, TLI = 0.889, RMSEA =0.053, 90% CI (0.041, 0.066)). Results indicate a significant autoregressive influence of employment (βT1T2 = 0.33, βT2T3 = 0.29, p < 0.001). No other paths were significant.
Self-acceptance. The RI-CLPM with employment and self-acceptance was found to be of good fit. (χ2(31) = 97.316, p < 0.05; CFI = 0.950, TLI = 0.875, RMSEA = 0.055, 90% CI (0.043, 0.068)). Results indicate a significant autoregressive influence of employment (βT1T2 = 0.32, βT2T3 = 0.29, p < 0.001). Results also indicated a significant autoregressive influence of self-acceptance between timepoint 2 and 3 (βT2T3 = 0.21, p < 0.01). No other paths were significant.
Autonomy. The RI-CLPM with employment and autonomy was found to be of good fit. (χ2(31) = 75.044, p < 0.05; CFI = 0.959, TLI = 0.897, RMSEA = 0.045, 90% CI (0.032, 0.058)). Results indicate a significant autoregressive influence of employment (βT1T2 = 0.33, βT2T3 = 0.28, p < 0.001). No other paths were significant.
Personal growth. The RI-CLPM with employment and personal growth was found to be of good fit. (χ2(31) = 86.057, p < 0.05; CFI = 0.956, TLI = 0.890, RMSEA = 0.051, 90% CI (0.038, 0.063)). Results indicate a significant autoregressive influence of employment (βT1T2 = 0.32, βT2T3 = 0.28, p < 0.001) across timepoints, and a significant autoregressive influence of personal growth between timepoint 2 and 3 (βT2T3 = 0.20, p < 0.01). Results also indicated a significant cross-lagged influence. Personal growth at timepoint 1 was found to predict employment at timepoint 2 (βT1T2 = 0.04, p < 0.01), and personal growth at timepoint 2 was found to predict employment at timepoint 3 (βT2T3 = 0.02, p = 0.035). No other paths were significant.
Environmental mastery. The RI-CLPM with employment and environmental mastery was found to be of acceptable fit. (χ2(31) = 95.268, p < 0.05; CFI = 0.944, TLI = 0.860, RMSEA = 0.055, 90% CI (0.042, 0.067)). Results indicate a significant autoregressive influence of employment (βT1T2 = 0.33, βT2T3 = 0.29, p < 0.001). Result also indicate a significant autoregressive influence of environmental master from timepoint 1 to timepoint 2 (βT1T2 =0.17, p =0.009). No other paths were significant.
Purpose in life. The RI-CLPM with employment and purpose in life was found to be of good fit. (χ2(31) = 79.635, p < 0.05; CFI = 0.955, TLI = 0.888, RMSEA = 0.048, 90% CI (0.035, 0.061)). Results indicate a significant autoregressive influence of employment (βT1T2 = 0.33, βT2T3 = 0.29, p < 0.001). Results also indicate a significant autoregressive influence of purpose in life from timepoint 2 to timepoint 3 (βT2T3 = 0.21, p = 0.002). No other paths were significant.
Results from RI-CLPM analyses of employment and psychological well-being are presented in Appendix C (Table A5).
3.3. Employment and Subjective Well-Being
Positive Affect. The RI-CLPM with employment and positive affect was found to be of acceptable fit. (χ2(31) = 106.079, p < 0.05; CFI = 0.945, TLI = 0.861, RMSEA = 0.059, 90% CI (0.047, 0.072)). Results indicate a significant autoregressive influence of employment (βT1T2 = 0.33, βT2T3 = 0.30, p < 0.001). Results also indicated a significant autoregressive influence of positive affect between timepoint 2 and 3 (βT2T3 = 0.43, p < 0.001). No other paths were significant.
Negative Affect. The RI-CLPM with employment and negative affect was found to be of adequate fit. (χ2(31) = 109.253, p < 0.05; CFI = 0.938, TLI = 0.844, RMSEA = 0.060, 90% CI (0.048, 0.072)). Results indicate a significant autoregressive influence of employment (βT1T2 = 0.33, βT2T3 = 0.29, p < 0.001). No other paths were significant.
Results from RI-CLPM analyses of employment and subjective well-being are presented in Appendix D (Table A6).
4. Discussion
The present study sought to shed light on the inconsistent findings on employment and well-being in the literature. First, given how various within-person factors may influence associations between the variables of interest, the present study attempted to control for within-person trait-like constructs by employing a RI-CLPM approach in our analyses. The standard CLPM has been subject to criticism in recent years, prompting the improved extension to the method that is the RI-CLPM. The central issue with the CLPM is its failure to examine within-person effects; it assumes individuals vary around a common group mean in the examined variable over time [45,46,62,63]. The RI-CLPM has hence been presented as an alternative specification to the CLPM, addressing this concern by taking into account within-person autoregressive and cross-lagged effects, allowing each individual to vary around their individual, stable, trait-like levels over time (see [45,46]). Second, as domains of well-being may relate to employment differently, the present study explored the associations between employment and domains of psychological, social, and subjective well-being, rather than well-being as a single construct. Our findings are discussed below in three sections.
4.1. Preliminary Analyses and Autoregressive Influence
Preliminary correlational analyses revealed weak to moderate correlation between domains of well-being. This supports the notion of well-being domain uniqueness, and how the different domains of well-being may relate to constructs differently [20,21]. Regarding autoregressive influences, a lack of uniform influence between the various well-being domains across time was observed. This suggests that different domains of well-being develop differently across older adulthood, in line with previous research on well-being developmental changes [55,56,57]. Contrary to well-being domains, autoregressive influence was observed consistently for employment across timepoints. This suggests that employment in the past is likely to predict employment in the future. While this appears to be in opposition to the social convention of forced retirement [14,53,54], it may not necessarily be the case. The normative retirement age may vary between occupations and job characteristics. For example, level of physically strain imposed by the occupation [64], autonomy in job task [64], and organization structure [65,66,67] have been found to influence retirement age. Forced retirement may also relate to full-time employment rather than part-time employment. Indeed, government policies have sort to support older adult part-time employment [68]. The variability in retirement age, together with support for part-time employment among older adults, may have resulted in the autoregressive influence of employment observed.
4.2. Significant Cross-Lagged Influence
Bidirectional cross-lagged findings from our study suggest greater social and psychological well-being to predict older adult employment, specifically, meaningfulness of society and personal growth respectively. These significant cross-lagged influences seem to lend support to previous studies positing well-being to predict employment [22,23,24,25], at least among older adults.
Meaningfulness of society is the perception that life is generally sensible, understandable, and controllable [42]. Individuals high on meaningfulness of society are concerned about the kind of world they live in, and maintain the desire to make sense of life [42]. Hence, older adults who struggle to understand or adapt to current society may feel disheartened and experience reduced levels of well-being in this domain [67,69,70]. Consequently, they may choose to withdraw socially and in terms of employment [65,66,67]. Of note, however, this influence was only observed between timepoint 2 and timepoint 3. Observation of the descriptive statistics suggest that a steeper decline in meaningfulness of society in later life, between timepoint 2 and timepoint 3 (compared to the decline between timepoint 1 and 2), might have allowed for this relationship to become more pronounced.
Personal growth relates to well-being from the sense that one is able to continually develop, grow and expand as a person [43]. Results from this study suggest personal growth to predict future employment. Indeed, personal growth has been found to predict feelings to interest and commitment [71]. This notion has also been supported by literature on other similar psychological constructs such as personal expressiveness [72] and flow [73]. As such, older adults who have experienced greater personal growth may express more interest in activities, extending to gainful employment.
4.3. Non-Significant Cross-Lagged Influence
Bidirectional cross-lagged results from our study suggest older adult employment to have a neutral influence on domains of well-being. That is, when controlling for within-person cross-time stabilities and correcting for potentially inflated observations, older adult employment did not significantly influence well-being in either direction. These findings are in line with a recent growing body of literature supporting a neutral influence of older adult employment on well-being, across various well-being indicators such as depression [30], current and life-as-a-whole life satisfaction [28], quality of life [30], and affect relating to common mental disorders [32]. Our findings suggest that previously observed effects of employment on well-being may be a result of the influence of individual differences in within-person stable factors. An equally plausible explanation could be differences in sample characteristics—with the current study focusing exclusively on employment among older adults—and the way well-being had been previously operationalized.
Null findings were also observed from investigations on the reciprocal relationship of other well-being domains (i.e., social integration, social actualization, social contribution, acceptance of others, positive relations with others, self-acceptance, autonomy, environmental mastery, purpose in life, positive affect, and negative affect), apart from meaningfulness of society and personal growth, on older adult employment. That is, when controlling for within-person cross-time stabilities, these domains of well-being did not significantly influence older adult employment in either direction. Our findings suggest that previously observed influence of poorer well-being predicting subsequent employment may be a result of the influence of within-person stable factors, such as locus of control [74] and temperament [75]. Again, an equally plausible explanation could be differences in sample characteristics and the way well-being had been previously operationalized.
In summary, the present study’s findings shed new light on the discourse surrounding the relative influence of older adult employment on well-being and the reciprocal relationship. On face value, the idea of older adult employment seems promising; in a world where activity-oriented and work-related lifestyle serves as a standard of well-being, older adult employment may be a potentially mechanism to improved well-being among seniors.
However, recent literature reporting null findings across various well-being indicators, together with this study’s null findings across various domains of well-being, suggest otherwise. The health and well-being trajectory of older adults vary greatly between persons. As such, in gerontology research, many within-person factors have been studied as potential predictors of successful ageing, such as personality, attitudes, dispositions, and lifestyles [76,77,78]. When taking these factors into account, results from this study suggest any influence of employment on well-being negated. While this negated influence appears to extend to the reciprocal influence of well-being on employment, there were two notable exceptions: meaningfulness of society and personal growth was found to predict employment. Previous literature suggest that a reduced meaningfulness of society may indicate one’s struggle to adapt to changes to the environment, which may lead to greater social withdrawal, extending to employment. Previous literature also suggests that a reduced personal growth may lead to a reduction in activity interest, which may similarly lead to greater withdrawal socially and in terms of employment.
5. Study Strengths and Limitations
To our best knowledge, the present study is one of the first studies to explore the longitudinal association of employment and well-being among older adults. Because we used a RI-CLPM, we were able to study associations in a bi-directional manner, while controlling for stable within-person factors. This study also explored a more nuanced relationship between employment and the different well-being domains.
The study has several limitations. First, this study does not distinguish between the type of occupation held. It may be possible for the reported findings to different across different types of occupations. For example, older adults working in jobs that help the less fortunate may report greater sense of well-being at a later timepoint, an observation similar to the effects of volunteerism [79]. In the same vein, it may be possible that increased meaningfulness of society and personal growth lead to employment in specific types of occupation. Second, this study does not distinguish between job characteristics. It may be possible that different job characteristics, even within the same occupation, may exert different influences on well-being, and vice versa. For example, occupations with exposure to trauma (e.g., bullying at work, or handling corpses) may result in poorer well-being at a later timepoint [80]. Third, although this study looked at employment in relation to various well-being domains, these domains are by no means exhaustive. For example, another domain of well-being not considered in this study is spirituality and religiosity well-being [81]. It may be possible that employment exerts a certain influence over other domains of well-being, and vice versa. An interaction between type of occupation, job characteristics, and other domains of well-being may also be possible. Forth, the present study examined employment and well-being among predominantly white older adults living in the United States. This relationship may differ cross-culturally [82,83].
6. Conclusions
As stressed by several researchers (e.g., [17,19]), knowledge about the temporal relationship between employment and well-being has important implications. Understanding this relationship can inform policymakers looking to introduce programs and legislation aimed at facilitating better mental health outcomes and quality of life among older adults. Our findings suggests that when within-person factors are accounted for, employment did not result in significantly greater or lesser well-being. Introducing older adult employment as an intervention to improve well-being among seniors may not be an effective strategy. While it may be that conventional employment arrangements are not structured to elicit the benefits illustrated by previous theories (e.g., [10]), and that a modified employment structure may yield theorized benefits, these questions are beyond the current research. Our findings, however, do suggest that well-being, specifically meaningfulness of society and personal growth, leads to employment among older adults. Nevertheless, caution should be taken in assuming the universality of these influence across occupation types, job characteristics, and culture. This research highlights the importance of controlling for within-person stable variables when examining temporal influence of predictors of interest on ageing outcomes. Future research examining the ageing process may wish to consider variables of interest within within-person contexts.
Author Contributions
Conceptualization, J.L.C. and A.H.; methodology, A.H.; formal analysis, J.L.C.; writing—original draft preparation, J.L.C.; writing—review and editing, J.L.C. and A.H.; supervision, A.H.; funding acquisition, A.H. All authors have read and agreed to the published version of the manuscript.
Funding
This research was supported by the Lee Kong Chian Fund for Research Excellence awarded to A.H. The MIDUS I study was supported by a grant from the John D. Catherine T. MacArthur Foundation Research Network on Successful Midlife Development. The MIDUS II and MIDUS III was supported by the National Institute on Aging (P01−AG020166, U19−AG051426, T32−AG000204) to conduct a longitudinal follow−up of the MIDUS I study.
Institutional Review Board Statement
Not applicable.
Informed Consent Statement
Not applicable.
Data Availability Statement
Data and materials of the current study may be accessed via the Inter-University Consortium for Political and Social Research website, https://www.icpsr.umich.edu/web/pages/NACDA/midus.html (accessed on 31 August 2021).
Conflicts of Interest
The authors declare no conflict of interest. The funders had no role in the design of the study; in the collection, analyses, or interpretation of data; in the writing of the manuscript, or in the decision to publish the results.
Ethics Statement
All participants in the MIDUS project had provided informed consent and data collection was approved by the Institutional Review Board at the University of Wisconsin-Madison.
Appendix A
Table A1.
Means, Standard Deviation, and Zero-order Correlations among Social Well-Being Domains.
Table A1.
Means, Standard Deviation, and Zero-order Correlations among Social Well-Being Domains.
| M (SD) | 1 | 2 | 3 | 4 | 5 | 6 | 7 | 8 | 9 | 10 | 11 | 12 | 13 | 14 | 15 | ||
|---|---|---|---|---|---|---|---|---|---|---|---|---|---|---|---|---|---|
| Timepoint 1 | |||||||||||||||||
| 1 | Meaningfulness of society | 8.95 (3.2) | - | 0.18 | 0.23 | 0.28 | 0.36 | 0.54 | 0.23 | 0.15 | 0.28 | 0.31 | 0.49 | 0.18 | 0.16 | 0.28 | 0.22 |
| 2 | Social integration | 15.50 (4.24) | 0.18 | - | 0.35 | 0.43 | 0.29 | 0.06 | 0.56 | 0.25 | 0.31 | 0.21 | 0.13 | 0.48 | 0.24 | 0.23 | 0.16 |
| 3 | Acceptance of others | 14.17 (3.39) | 0.23 | 0.35 | - | 0.24 | 0.47 | 0.15 | 0.28 | 0.46 | 0.19 | 0.31 | 0.14 | 0.24 | 0.38 | 0.14 | 0.23 |
| 4 | Social contribution | 15.81 (3.74) | 0.28 | 0.43 | 0.24 | - | 0.29 | 0.25 | 0.36 | 0.25 | 0.55 | 0.26 | 0.19 | 0.37 | 0.19 | 0.46 | 0.17 |
| 5 | Social actualization | 12.43 (4.20) | 0.36 | 0.29 | 0.47 | 0.29 | -- | 0.22 | 0.21 | 0.29 | 0.17 | 0.47 | 0.25 | 0.22 | 0.20 | 0.18 | 0.36 |
| Timepoint 2 | |||||||||||||||||
| 6 | Meaningfulness of society | 9.11 (3.11) | 0.54 | 0.06 | 0.25 | 0.25 | 0.22 | - | 0.20 | 0.21 | 0.35 | 0.47 | 0.51 | 0.21 | 0.17 | 0.33 | 0.24 |
| 7 | Social integration | 15.75 (3.82) | 0.23 | 0.56 | 0.28 | 0.36 | 0.21 | 0.20 | - | 0.35 | 0.51 | 0.27 | 0.19 | 0.57 | 0.24 | 0.38 | 0.17 |
| 8 | Acceptance of others | 14.85 (3.10) | 0.15 | 0.25 | 0.46 | 0.25 | 0.29 | 0.21 | 0.35 | - | 0.27 | 0.44 | 0.16 | 0.26 | 0.44 | 0.16 | 0.24 |
| 9 | Social contribution | 15.64 (3.74) | 0.28 | 0.31 | 0.19 | 0.55 | 0.17 | 0.35 | 0.51 | 0.27 | - | 0.27 | 0.26 | 0.42 | 0.16 | 0.58 | 0.13 |
| 10 | Social actualization | 12.88 (3.99) | 0.31 | 0.21 | 0.31 | 0.26 | 0.47 | 0.47 | 0.27 | 0.44 | 0.27 | - | 0.26 | 0.22 | 0.27 | 0.18 | 0.40 |
| Timepoint 3 | |||||||||||||||||
| 11 | Meaningfulness of society | 8.27 (3.05) | 0.49 | 0.13 | 0.14 | 0.19 | 0.25 | 0.51 | 0.19 | 0.16 | 0.26 | 0.26 | - | 0.26 | 0.26 | 0.38 | 0.44 |
| 12 | Social integration | 15.29 (3.94) | 0.18 | 0.48 | 0.24 | 0.37 | 0.22 | 0.21 | 0.57 | 0.26 | 0.42 | 0.22 | 0.26 | - | 0.34 | 0.47 | 0.25 |
| 13 | Acceptance of others | 14.43 (3.02) | 0.16 | 0.24 | 0.38 | 0.19 | 0.20 | 0.17 | 0.24 | 0.44 | 0.16 | 0.27 | 0.26 | 0.34 | - | 0.23 | 0.37 |
| 14 | Social contribution | 14.59 (3.76) | 0.28 | 0.23 | 0.14 | 0.46 | 0.18 | 0.33 | 0.38 | 0.16 | 0.58 | 0.18 | 0.38 | 0.47 | 0.23 | - | 0.26 |
| 15 | Social actualization | 11.42 (3.91) | 0.22 | 0.16 | 0.23 | 0.17 | 0.36 | 0.24 | 0.17 | 0.24 | 0.13 | 0.40 | 0.44 | 0.25 | 0.37 | 0.26 | - |
All correlations were significant (p < 0.01) except between integration at timepoint 1 and meaningfulness at timepoint 2 (p = 0.15), in bold.
Table A2.
Means, Standard Deviation, and Zero-order Correlations among Psychological Well-Being Domains.
Table A2.
Means, Standard Deviation, and Zero-order Correlations among Psychological Well-Being Domains.
| M (SD) | 1 | 2 | 3 | 4 | 5 | 6 | 7 | 8 | 9 | 10 | 11 | 12 | 13 | 14 | 15 | 16 | 17 | 18 | ||
|---|---|---|---|---|---|---|---|---|---|---|---|---|---|---|---|---|---|---|---|---|
| Timepoint 1 | ||||||||||||||||||||
| 1 | Positive Relations with Others | 17.00 (3.88) | - | 0.39 | 0.17 | 0.41 | 0.36 | 0.31 | 0.62 | 0.37 | 0.22 | 0.32 | 0.30 | 0.25 | 0.52 | 0.32 | 0.07 | 0.27 | 0.17 | 0.23 |
| 2 | Self-acceptance | 17.07 (3.18) | 0.39 | - | 0.23 | 0.29 | 0.55 | 0.23 | 0.30 | 0.54 | 0.15 | 0.24 | 0.30 | 0.16 | 0.31 | 0.53 | 0.13 | 0.24 | 0.32 | 0.18 |
| 3 | Autonomy | 16.79 (3.16) | 0.17 | 0.23 | - | 0.18 | 0.25 | 0.05 | 0.09 | 0.24 | 0.46 | 0.18 | 0.13 | 0.06 | 0.11 | 0.26 | 0.41 | 0.25 | 0.17 | 0.06 |
| 4 | Personal growth | 18.03 (2.99) | 0.41 | 0.29 | 0.18 | - | 0.27 | 0.29 | 0.35 | 0.33 | 0.22 | 0.48 | 0.19 | 0.27 | 0.32 | 0.31 | 0.17 | 0.46 | 0.20 | 0.30 |
| 5 | Environmental mastery | 17.05 (3.21) | 0.36 | 0.55 | 0.25 | 0.27 | -- | 0.23 | 0.28 | 0.37 | 0.20 | 0.19 | 0.46 | 0.14 | 0.25 | 0.37 | 0.20 | 0.19 | 0.37 | 0.13 |
| 6 | Purpose in Life | 16.75 (3.53) | 0.31 | 0.23 | 0.05 | 0.29 | 0.23 | - | 0.23 | 0.16 | 0.11 | 0.20 | 0.17 | 0.40 | 0.24 | 0.20 | 0.15 | 0.21 | 0.16 | 0.36 |
| Timepoint 2 | ||||||||||||||||||||
| 7 | Positive Relations with Others | 17.71 (3.52) | 0.62 | 0.30 | 0.09 | 0.35 | 0.28 | 0.23 | - | 0.46 | 0.22 | 0.47 | 0.42 | 0.33 | 0.58 | 0.38 | 0.08 | 0.33 | 0.21 | 0.25 |
| 8 | Self-acceptance | 16.97 (3.37) | 0.37 | 0.54 | 0.24 | 0.33 | 0.37 | 0.16 | 0.46 | - | 0.32 | 0.41 | 0.48 | 0.24 | 0.40 | 0.57 | 0.18 | 0.39 | 0.37 | 0.21 |
| 9 | Autonomy | 16.98 (2.88) | 0.22 | 0.15 | 0.46 | 0.22 | 0.20 | 0.11 | 0.22 | 0.32 | - | 0.25 | 0.38 | 0.12 | 0.20 | 0.30 | 0.45 | 0.23 | 0.21 | 0.11 |
| 10 | Personal growth | 17.51 (3.03) | 0.32 | 0.24 | 0.18 | 0.48 | 0.19 | 0.20 | 0.47 | 0.41 | 0.25 | - | 0.34 | 0.31 | 0.34 | 0.34 | 0.20 | 0.54 | 0.25 | 0.29 |
| 11 | Environmental mastery | 17.84 (2.83) | 0.30 | 0.30 | 0.13 | 0.19 | 0.46 | 0.17 | 0.42 | 0.48 | 0.38 | 0.34 | - | 0.22 | 0.33 | 0.37 | 0.16 | 0.28 | 0.43 | 0.20 |
| 12 | Purpose in Life | 16.18 (3.45) | 0.25 | 0.16 | 0.06 | 0.27 | 0.14 | 0.40 | 0.33 | 0.24 | 0.12 | 0.31 | 0.22 | - | 0.29 | 0.24 | 0.11 | 0.32 | 0.23 | 0.50 |
| Timepoint 3 | ||||||||||||||||||||
| 13 | Positive Relations with Others | 16.99 (3.63) | 0.52 | 0.31 | 0.11 | 0.32 | 0.25 | 0.24 | 0.58 | 0.40 | 0.20 | 0.34 | 0.33 | 0.29 | - | 0.51 | 0.21 | 0.48 | 0.35 | 0.36 |
| 14 | Self-acceptance | 16.60 (3.41) | 0.32 | 0.53 | 0.26 | 0.31 | 0.37 | 0.20 | 0.38 | 0.57 | 0.30 | 0.34 | 0.37 | 0.24 | 0.51 | - | 0.30 | 0.44 | 0.48 | 0.25 |
| 15 | Autonomy | 16.47 (2.93) | 0.07 | 0.13 | 0.41 | 0.17 | 0.20 | 0.15 | 0.08 | 0.18 | 0.45 | 0.20 | 0.16 | 0.11 | 0.21 | 0.30 | - | 0.26 | 0.34 | 0.17 |
| 16 | Personal growth | 17.20 (3.06) | 0.27 | 0.24 | 0.25 | 0.46 | 0.19 | 0.21 | 0.33 | 0.39 | 0.23 | 0.54 | 0.28 | 0.32 | 0.48 | 0.44 | 0.26 | - | 0.32 | 0.38 |
| 17 | Environmental mastery | 16.96 (3.15) | 0.17 | 0.32 | 0.17 | 0.20 | 0.37 | 0.16 | 0.21 | 0.37 | 0.21 | 0.25 | 0.43 | 0.23 | 0.35 | 0.48 | 0.34 | 0.32 | - | 0.29 |
| 18 | Purpose in Life | 15.24 (3.43) | 0.23 | 0.18 | 0.06 | 0.30 | 0.13 | 0.36 | 0.25 | 0.21 | 0.11 | 0.29 | 0.20 | 0.50 | 0.36 | 0.25 | 0.17 | 0.38 | 0.29 | - |
All correlations were significant (p < 0.01) except between Autonomy and Purpose in Life at timepoint 1 (p = 0.16), Autonomy timepoint 1 and Purpose in Life at timepoint 2 (p = 0.14), Positive Relations with Others at timepoint 1 and Autonomy at timepoint 3 (p = 0.07), Autonomy at timepoint 1and Purpose in Life at timepoint 3 (p = 0.12), in bold.
Table A3.
Means, Standard Deviation, and Zero-order Correlations among Subjective Well-being Domains.
Table A3.
Means, Standard Deviation, and Zero-order Correlations among Subjective Well-being Domains.
| M (SD) | 1 | 2 | 3 | 4 | 5 | 6 | ||
|---|---|---|---|---|---|---|---|---|
| Timepoint 1 | ||||||||
| 1 | Positive Affect | 3.54 (0.64) | - | −0.64 | 0.50 | −0.38 | 0.47 | −0.34 |
| 2 | Negative Affect | 1.40 (0.49) | −0.64 | - | −0.38 | 0.48 | −0.37 | 0.46 |
| Timepoint 2 | ||||||||
| 3 | Positive Affect | 3.62 (0.61) | 0.50 | −0.38 | - | −0.55 | 0.61 | −0.34 |
| 4 | Negative Affect | 1.36 (0.45) | −0.38 | 0.48 | −0.55 | - | −0.40 | 0.51 |
| Timepoint 3 | ||||||||
| 5 | Positive Affect | 3.50 (0.71) | 0.47 | −0.37 | 0.61 | −0.40 | - | −0.55 |
| 6 | Negative Affect | 1.44 (0.54) | −0.34 | 0.46 | −0.34 | 0.51 | −0.55 | - |
All correlations were significant (p < 0.01).
Appendix B
Table A4.
Results from Random-Intercept Cross-Lagged Panel Analysis Modelling Employment and Social Well-Being Domains.
Table A4.
Results from Random-Intercept Cross-Lagged Panel Analysis Modelling Employment and Social Well-Being Domains.
| Meaningfulness of Society | Social Integration | Social Actualization | Social Contribution | Acceptance of Others | ||||||||||||
|---|---|---|---|---|---|---|---|---|---|---|---|---|---|---|---|---|
| β | p | 95% CI | β | p | 95% CI | β | p | 95% CI | β | p | 95% CI | β | p | 95% CI | ||
| Employment → ScWB | ||||||||||||||||
| T1 Em → T2 ScWB | −0.23 | 0.475 | −0.88; 0.41 | -0.44 | 0.316 | −1.29; 0.42 | −0.77 | 0.080 | −1.64; 0.09 | −0.46 | 0.271 | −1.27; 0.36 | −0.24 | 0.492 | −0.935; 0.45 | |
| T2 Em → T3 ScWB | 0.47 | 0.201 | −0.25; 1.19 | 0.42 | 0.354 | −0.46; 1.30 | 0.09 | 0.841 | −0.83; 1.02 | 0.01 | 0.978 | −0.78; 0.80 | −0.04 | 0.920 | −0.73; 0.66 | |
| SWB → Employment | ||||||||||||||||
| T1 ScWB → T2 Em | −0.00 | 0.862 | −0.03; 0.02 | 0.01 | 0.620 | −0.01; 0.02 | −0.01 | 0.396 | −0.02; 0.01 | 0.01 | 0.374 | −0.01; 0.03 | −0.00 | 0.936 | −0.02; 0.02 | |
| T2 ScWB → T3 Em | 0.03 | 0.015 | 0.01; 0.05 | 0.01 | 0.392 | −0.01; 0.03 | −0.00 | 0.766 | −0.02; 0.01 | 0.01 | 0.204 | −0.01; 0.03 | −0.01 | 0.519 | −0.03; 0.01 | |
| Autoregressive Influence | ||||||||||||||||
| T1 Em → T2 Em | 0.32 | 0.000 | 0.17; 0.47 | 0.33 | 0.000 | 0.19; 0.48 | 0.34 | 0.000 | 0.19; 0.49 | 0.33 | 0.000 | 0.18; 0.47 | 0.33 | 0.000 | 0.19; 0.48 | |
| T2 Em → T3 Em | 0.28 | 0.000 | 0.16; 0.39 | 0.29 | 0.000 | 0.18; 0.40 | 0.29 | 0.000 | 0.18; 0.41 | 0.28 | 0.000 | 0.16; 0.39 | 0.29 | 0.000 | 0.18; 0.41 | |
| T1 ScWB → T2 ScWB | 0.09 | 0.196 | −0.05; 0.22 | 0.18 | 0.015 | 0.04; 0.33 | 0.25 | 0.000 | 0.13; 0.38 | 0.25 | 0.002 | 0.09; 0.41 | 0.19 | 0.002 | 0.07; 0.31 | |
| T2 ScWB → T3 ScWB | 0.01 | 0.914 | −0.15; 0.17 | 0.19 | 0.044 | 0.01; 0.38 | 0.10 | 0.205 | −0.05; 0.25 | 0.25 | 0.001 | 0.10; 0.40 | 0.12 | 0.137 | −0.04; 0.27 | |
Em = employment, ScWB = social well-being, T1 = timepoint 1, T2 = timepoint 2, T3 = timepoint 3.
Appendix C
Table A5.
Results from Random-Intercept Cross-Lagged Panel Analysis Modelling Employment and Psychological Well-Being Domains.
Table A5.
Results from Random-Intercept Cross-Lagged Panel Analysis Modelling Employment and Psychological Well-Being Domains.
| Positive Relations | Self-Acceptance | Autonomy | Personal Growth | Environmental Mastery | Purpose in Life | ||||||||||||||
|---|---|---|---|---|---|---|---|---|---|---|---|---|---|---|---|---|---|---|---|
| β | p | 95% CI | β | p | 95% CI | β | p | 95% CI | β | p | 95% CI | β | p | 95% CI | β | p | 95% CI | ||
| Employment → PWB | |||||||||||||||||||
| T1 Em → T2 PWB | 0.33 | 0.334 | −0.34; 1.00 | −0.12 | 0.752 | −0.86; 0.62 | 0.30 | 0.346 | −0.32; 0.93 | 0.09 | 0.798 | −0.61; 0.80 | 0.34 | 0.324 | −0.34; 10.01 | 0.18 | 0.681 | −0.67; 1.02 | |
| T2 Em → T3 PWB | 0.14 | 0.753 | −0.74; 10.03 | −0.17 | 0.638 | −0.89; 0.55 | 0.68 | 0.080 | −0.08; 10.43 | 0.36 | 0.269 | −0.28; 10.00 | 0.01 | 0.981 | −0.71; 0.73 | −0.06 | 0.890 | −0.83; 0.72 | |
| PWB → Employment | |||||||||||||||||||
| T1 PWB → T2 Em | 0.01 | 0.289 | −0.01; 0.04 | −0.02 | 0.217 | −0.05; 0.01 | 0.01 | 0.683 | −0.02; 0.03 | 0.04 | 0.006 | 0.01; 0.06 | −0.01 | 0.546 | −0.03; 0.01 | −0.01 | 0.505 | −0.03, 0.01 | |
| T2 PWB → T3 Em | 0.00 | 0.839 | −0.02; 0.03 | −0.00 | 0.913 | −0.02; 0.02 | 0.02 | 0.204 | −0.01; 0.04 | 0.02 | 0.035 | 0.00 *; 0.04 | −0.01 | 0.564 | −0.03; 0.02 | 0.00 | 0.751 | −0.01; 0.02 | |
| Autoregressive Influence | |||||||||||||||||||
| T1 Em → T2 Em | 0.33 | 0.000 | 0.18; 0.48 | 0.32 | 0.000 | 0.17; 0.47 | 0.33 | 0.000 | 0.18; 0.47 | 0.32 | 0.000 | 0.17; 0.46 | 0.33 | 0.000 | 0.18; 0.48 | 0.33 | 0.000 | 0.18; 0.48 | |
| T2 Em → T3 Em | 0.29 | 0.000 | 0.18; 0.40 | 0.29 | 0.000 | 0.17; 0.40 | 0.28 | 0.000 | 0.16; 0.40 | 0.28 | 0.000 | 0.17; 0.39 | 0.29 | 0.000 | 0.18; 0.40 | 0.29 | 0.000 | 0.18; 0.40 | |
| T1 PWB → T2 PWB | 0.18 | 0.010 | 0.04; 0.32 | 0.14 | 0.164 | −0.06; 0.33 | 0.08 | 0.202 | −0.04; 0.20 | 0.10 | 0.258 | −0.07; 0.26 | 0.17 | 0.009 | 0.04; 0.30 | 0.12 | 0.093 | −0.02; 0.26 | |
| T2 PWB → T3 PWB | 0.04 | 0.726 | −0.19; 0.28 | 0.21 | 0.002 | 0.08; 0.34 | −0.03 | 0.726 | −0.22; 0.15 | 0.20 | 0.004 | 0.06; 0.34 | 0.14 | 0.119 | −0.04; 0.31 | 0.21 | 0.002 | 0.08; 0.35 | |
Em = employment, PWB = psychological well-being, T1 = timepoint 1, T2 = timepoint 2, T3 = timepoint 3; *- Lower limit for the 95% confidence interval of Personal Growth was 0.001.
Appendix D
Table A6.
Results from Random-Intercept Cross-Lagged Panel Analysis Modelling Employment and Subjective Well-being Domains.
Table A6.
Results from Random-Intercept Cross-Lagged Panel Analysis Modelling Employment and Subjective Well-being Domains.
| Positive Affect | Negative Affect | ||||||
|---|---|---|---|---|---|---|---|
| β | p | 95% CI | β | p | 95% CI | ||
| Employment → SjWB | |||||||
| T1 Em → T2 SjWB | −0.01 | 0.920 | −0.17; 0.15 | −0.03 | 0.578 | −0.15; 0.08 | |
| T2 Em → T3 SjWB | 0.08 | 0.214 | −0.05; 0.22 | −0.03 | 0.649 | −0.15; 0.09 | |
| SjWB → Employment | |||||||
| T1 SjWB → T2 Em | 0.05 | 0.468 | −0.08; 0.18 | −0.05 | 0.591 | −0.22; 0.12 | |
| T2 SjWB → T3 Em | −0.02 | 0.727 | −0.13; 0.09 | 0.02 | 0.818 | −0.14; 0.17 | |
| Autoregressive Influence | |||||||
| T1 Em → T2 Em | 0.33 | 0.000 | 0.19; 0.48 | 0.33 | 0.000 | 0.18; 0.48 | |
| T2 Em → T3 Em | 0.30 | 0.000 | 0.18; 0.41 | 0.29 | 0.000 | 0.18; 0.41 | |
| T1 SjWB → T2 SjWB | 0.10 | 0.348 | −0.11; 0.31 | 0.04 | 0.624 | −0.13; 0.21 | |
| T2 SjWB → T3 SjWB | 0.43 | 0.000 | 0.26; 0.59 | 0.17 | 0.093 | −0.03; 0.36 | |
Em = employment, SjWB = subjective well-being, T1 = timepoint 1, T2 = timepoint 2, T3 = timepoint 3.
References
- Bloom, D.E.; Canning, D. Commentary: The Preston Curve 30 Years on: Still Sparking Fires. Int. J. Epidemiol. 2007, 36, 498–499. [Google Scholar] [CrossRef] [PubMed] [Green Version]
- Manton, K.G. Life expectancy. In Encyclopedia of Gerontology, 2nd ed.; Birren, J.E., Ed.; Elsevier: Amsterdam, The Netherlands, 2007; pp. 61–67. [Google Scholar] [CrossRef]
- GHE: Life Expectancy and Healthy Life Expectancy. Available online: https://www.who.int/data/gho/data/themes/mortality-and-global-health-estimates/ghe-life-expectancy-and-healthy-life-expectancy (accessed on 8 November 2021).
- Chang, A.Y.; Skirbekk, V.F.; Tyrovolas, S.; Kassebaum, N.J.; Dieleman, J.L. Measuring population ageing: An analysis of the Global Burden of Disease Study 2017. Lancet Public Health 2019, 4, e159–e167. [Google Scholar] [CrossRef] [Green Version]
- Fontana, L.; Kennedy, B.K.; Longo, V.D.; Seals, D.; Melov, S. Medical research: Treat ageing. Nature 2014, 511, 405–407. [Google Scholar] [CrossRef] [PubMed]
- Jaul, E.; Barron, J. Age-Related Diseases and Clinical and Public Health Implications for the 85 Years Old and Over Population. Front. Public Health 2017, 5, 335. [Google Scholar] [CrossRef] [Green Version]
- Alves, J.; Magalhães, R.; Machado, Á.; Gonçalves, Ó.F.; Sampaio, A.; Petrosyan, A. Non-pharmacological cognitive intervention for aging and dementia: Current perspectives. World J. Clin. Cases WJCC 2013, 1, 233. [Google Scholar] [CrossRef] [PubMed]
- Ho, L.Y.W.; Ng, S.S.M. Non-pharmacological interventions for fatigue in older adults: A systematic review and meta-analysis. Age Ageing 2020, 49, 341–351. [Google Scholar] [CrossRef] [PubMed]
- Tang, S.K.; Tse, M.M.Y.; Leung, S.F.; Fotis, T. The effectiveness, suitability, and sustainability of non-pharmacological methods of managing pain in community-dwelling older adults: A systematic review. BMC Public Health 2019, 19, 1–10. [Google Scholar] [CrossRef] [PubMed]
- Cavan, R.S.; Burgess, E.W.; Havighurst, R.J.; Coldhamer, H. Personal Adjustment in Old Age; Science Research Associates: Chicago, IL, USA, 1949. [Google Scholar]
- Havighurst, R.J.; Albrecht, R. Older people. ANNALS Am. Acad. Political Soc. Sci. 1953, 294, 205. [Google Scholar] [CrossRef]
- Lynott, R.J.; Lynott, P.P. Tracing the Course of Theoretical Development in the Sociology of Aging. Gerontologist 1996, 36, 749–760. [Google Scholar] [CrossRef] [Green Version]
- Havighurst, R.J. A social-psychological perspective on aging. Gerontologist 1968, 8, 67–71. [Google Scholar] [CrossRef]
- Knapp, M.R. The activity theory of aging an examination in the English context. Gerontologist 1977, 17, 553–559. [Google Scholar] [CrossRef] [PubMed]
- Sharpe, A. Is ageing a drag on productivity growth? A review article on ageing, health and productivity: The economics of increased life expectancy. Int. Product. Monit. 2011, 21, 82. [Google Scholar]
- Percy, S.; Ramaley, J.A.; Tapogna, J.; Neal, M.B.; Bloom, J.; Reece, A. Building a State for All Ages: Tapping the Potential of Older Oregonians. Inst. Aging Publ. 2016, 22, 1–11. [Google Scholar]
- Hao, Y. Productive activities and psychological well-being among older adults. J. Gerontol. Ser. B Psychol. Sci. Soc. Sci. 2008, 63, S64–S72. [Google Scholar] [CrossRef] [PubMed]
- Maimaris, W.; Hogan, H.; Lock, K. The impact of working beyond traditional retirement ages on mental health: Implications for public health and welfare policy. Public Health Rev. 2010, 32, 532–548. [Google Scholar] [CrossRef] [Green Version]
- Baxter, S.; Blank, L.; Cantrell, A.; Goyder, E. Is working in later life good for your health? A systematic review of health outcomes resulting from extended working lives. BMC Public Health 2021, 21, 1–11. [Google Scholar] [CrossRef]
- Sagone, E.; Caroli, M.E.D. Relationships between psychological well-being and resilience in middle and late adolescents. Procedia Soc. Behav. Sci. 2014, 141, 881–887. [Google Scholar] [CrossRef] [Green Version]
- Salehi, A.; Marzban, M.; Sourosh, M.; Sharif, F.; Nejabat, M.; Imanieh, M.H. Social well-being and related factors in students of school of nursing and midwifery. Int. J. Community Based Nurs. Midwifery 2017, 5, 82. [Google Scholar]
- Paul, K.I.; Moser, K. Unemployment impairs mental health: Meta-analyses. J. Vocat. Behav. 2009, 74, 264–282. [Google Scholar] [CrossRef]
- Huysse-Gaytandjieva, A.; Groot, W.; Pavlova, M.; Joling, C. Low self-esteem predicts future unemployment. J. Appl. Econ. 2015, 18, 325–346. [Google Scholar] [CrossRef]
- Kundi, Y.M.; Aboramadan, M.; Elhamalawi, E.M.; Shahid, S. Employee psychological well-being and job performance: Exploring mediating and moderating mechanisms. Int. J. Organ. Anal. 2020, 29, 736–754. [Google Scholar] [CrossRef]
- Mastekaasa, A. Unemployment and health: Selection effects. J. Community Appl. Soc. Psychol. 1996, 6, 189–205. [Google Scholar] [CrossRef]
- Winkelmann, R. Unemployment, social capital, and subjective well-being. J. Happiness Stud. 2009, 10, 421–430. [Google Scholar] [CrossRef] [Green Version]
- Mavridis, D. Can subjective well-being predict unemployment length? World Bank Policy Res. Work. Paper 2010, 5293, 1–44. [Google Scholar] [CrossRef]
- Anxo, D.; Ericson, T.; Miao, C. Impact of late and prolonged working life on subjective health: The Swedish experience. Eur. J. Health Econ. 2019, 20, 389–405. [Google Scholar] [CrossRef] [PubMed] [Green Version]
- Choi, N.G.; Bohman, T.M. Predicting the changes in depressive symptomatology in later life: How much do changes in health status, marital and caregiving status, work and volunteering, and health-related behaviors contribute? J. Aging Health 2007, 19, 152–177. [Google Scholar] [CrossRef]
- Di Gessa, G.; Corna, L.M.; Platts, L.G.; Worts, D.; McDonough, P.; Sacker, A.; Glaser, K. Is being in paid work beyond state pension age beneficial for health? Evidence from England using a life-course approach. J. Epidemiol. Community Health 2017, 71, 431–438. [Google Scholar] [CrossRef] [Green Version]
- Fujiwara, Y.; Shinkai, S.; Kobayashi, E.; Minami, U.; Suzuki, H.; Yoshida, H.; Suzuki, T. Engagement in paid work as a protective predictor of basic activities of daily living disability in Japanese urban and rural community-dwelling elderly residents: An 8-year prospective study. Geriatr. Gerontol. Int. 2016, 16, 126–134. [Google Scholar] [CrossRef]
- Welsh, J.; Strazdins, L.; Charlesworth, S.; Kulik, C.T.; Butterworth, P. Health or harm? A cohort study of the importance of job quality in extended workforce participation by older adults. BMC Public Health 2016, 16, 1–14. [Google Scholar] [CrossRef] [Green Version]
- Brim, O.G.; Baltes, P.B.; Bumpass, L.L.; Cleary, P.D.; Featherman, D.L.; Hazzard, W.R.; Kessler, R.C.; Lachman, M.E.; Markus, H.R.; Marmot, M.G.; et al. Midlife in the United States (MIDUS 1), 1995–1996; Inter-University Consortium for Political and Social Research: Ann Arbor, MI, USA, 2020. [Google Scholar] [CrossRef]
- Ryff, C.D.; Almeida, D.M.; Ayanian, J.Z.; Carr, D.S.; Cleary, P.D.; Coe, C.; Davidson, R.J.; Krueger, R.F.; Lachman, M.E.; Marks, N.F.; et al. Midlife in the United States (MIDUS 2), 2004–2006; Inter-University Consortium for Political and Social Research: Ann Arbor, MI, USA, 2021. [Google Scholar] [CrossRef]
- Ryff, C.; Almeida, D.; Ayanian, J.; Binkley, N.; Carr, D.S.; Coe, C.; Davidson, R.; Grzywacz, J.; Karlamangla, A.; Krueger, R.; et al. Midlife in the United States (MIDUS 3), 2013–2014; Inter-University Consortium for Political and Social Research: Ann Arbor, MI, USA, 2019. [Google Scholar] [CrossRef]
- Petry, N.M. A comparison of young, middle-aged, and older adult treatment-seeking pathological gamblers. Gerontologist 2002, 42, 92–99. [Google Scholar] [CrossRef] [Green Version]
- Schoenborn, C.A.; Heyman, K.M. Health characteristics of adults aged 55 years and over: United States, 2004–2007. Natl. Health Stat. Rep. 2009, 16, 1–31. [Google Scholar] [CrossRef]
- Kline, R.B. Principles and Practice of Structural Equation Modelling, 3rd ed.; Guilford Press: New York, NY, USA, 2011. [Google Scholar]
- Boer, M.; Stevens, G.; Finkenauer, C.; van den Eijnden, R. Attention deficit hyperactivity disorder-symptoms, social media use intensity, and social media use problems in adolescents: Investigating directionality. Child Dev. 2020, 91, e853–e865. [Google Scholar] [CrossRef] [Green Version]
- Cichocka, A.; Cislak, A.; Stronge, S.; Osborne, D.; Sibley, C.G. Does high self-esteem foster narcissism? Testing the bidirectional relationships between self-esteem, narcissistic admiration and rivalry. J. Res. Personal. 2019, 83, 103882. [Google Scholar] [CrossRef]
- Graupensperger, S.; Wilson, O.; Bopp, M.; Blair Evans, M. Longitudinal association between alcohol use and physical activity in US college students: Evidence for directionality. J. Am. Coll. Health 2020, 68, 155–162. [Google Scholar] [CrossRef]
- Keyes, C.L.M. Social well-being. Soc. Psychol. Q. 1998, 61, 121–140. [Google Scholar] [CrossRef]
- Ryff, C.D. Happiness is everything, or is it? Explorations on the meaning of psychological well- being. J. Personal. Soc. Psychol. 1989, 57, 1069–1081. [Google Scholar] [CrossRef]
- Mroczek, D.K.; Kolarz, C.M. The effect of age on positive and negative affect: A developmental perspective on happiness. J. Personal. Soc. Psychol. 1998, 75, 1333–1349. [Google Scholar] [CrossRef]
- Mund, M.; Nestler, S. Beyond the cross-lagged panel model: Next-generation statistical tools for analyzing interdependencies across the life course. Adv. Life Course Res. 2019, 41, 100249. [Google Scholar] [CrossRef] [Green Version]
- Hamaker, E.L.; Kuiper, R.M.; Grasman, R.P.P.P. A critique of the cross-lagged panel model. Psychol. Methods 2015, 20, 102–116. [Google Scholar] [CrossRef]
- R Core Team. R: A Language and Environment for Statistical Computing; R Foundation for Statistical Computing: Vienna, Austria, 2020; Available online: https://www.R-project.org/ (accessed on 8 November 2021).
- Harrell, F. Hmisc: Harrell Miscellaneous. R Package Version, 4-5-0. Available online: https://cran.r-project.org/web/packages/Hmisc/ (accessed on 8 November 2021).
- Rosseel, Y. Lavaan: An R Package for Structural Equation Modeling. J. Stat. Softw. 2012, 48, 1–36. [Google Scholar] [CrossRef] [Green Version]
- Backonja, U.; Hall, A.K.; Thielke, S. Older adults’ current and potential uses of information technologies in a changing world: A theoretical perspective. Int. J. Aging Human Dev. 2014, 80, 41–63. [Google Scholar] [CrossRef] [PubMed] [Green Version]
- Fisher, J.C. A framework for describing developmental change among older adults. Adult Educ. Q. 1993, 43, 76–89. [Google Scholar] [CrossRef]
- McAdams, D.P.; de St Aubin, E.D.; Logan, R.L. Generativity among young, midlife, and older adults. Psychol. Aging 1993, 8, 221. [Google Scholar] [CrossRef] [PubMed]
- Settersten, R.A., Jr. Time, age, and the transition to retirement: New evidence on life-course flexibility? Int. J. Aging Human Dev. 1998, 47, 177–203. [Google Scholar] [CrossRef] [PubMed]
- Settersten, R.A., Jr.; Hagestad, G.O. What’s the latest? II. Cultural age deadlines for educational and work transitions. Gerontologist 1996, 36, 602–613. [Google Scholar] [CrossRef]
- McClintock, M.K.; Dale, W.; Laumann, E.O.; Waite, L. Empirical redefinition of comprehensive health and well-being in the older adults of the United States. Proc. Natl. Acad. Sci. USA 2016, 113, E3071–E3080. [Google Scholar] [CrossRef] [Green Version]
- Ryff, C.D. Psychological well-being in adult life. Curr. Dir. Psychol. Sci. 1995, 4, 99–104. [Google Scholar] [CrossRef]
- Steptoe, A.; Deaton, A.; Stone, A.A. Subjective wellbeing, health, and ageing. Lancet 2015, 385, 640–648. [Google Scholar] [CrossRef] [Green Version]
- Artazcoz, L.; Benach, J.; Borrell, C.; Cortes, I. Unemployment and mental health: Understanding the interactions among gender, family roles, and social class. Am. J. Public Health 2004, 94, 82–88. [Google Scholar] [CrossRef]
- Van der Meer, P.H. Gender, unemployment and subjective well-being: Why being unemployed is worse for men than for women. Soc. Indic. Res. 2014, 115, 23–44. [Google Scholar] [CrossRef]
- Mund, M.; Johnson, M.D.; Nestler, S. Changes in Size and Interpretation of Parameter Estimates in Within-Person Models in the Presence of Time-Invariant and Time-Varying Covariates. Front. Psychol. 2021, 12, 3663. [Google Scholar] [CrossRef]
- Hu, L.T.; Bentler, P.M. Cutoff criteria for fit indexes in covariance structure analysis: Conventional criteria versus new alternatives. Struct. Equ. Model. Multidiscip. J. 1999, 6, 1–55. [Google Scholar] [CrossRef]
- Mulder, J.D.; Hamaker, E.L. Three extensions of the random intercept cross-lagged panel model. Struct. Equ. Model. Multidiscip. J. 2021, 28, 638–648. [Google Scholar] [CrossRef]
- Grimm, K.J.; Helm, J.; Rodgers, D.; O’Rourke, H. Analyzing cross-lag effects: A comparison of different cross-lag modeling approaches. New Dir. Child Adolesc. Dev. 2021, 2021, 11–33. [Google Scholar] [CrossRef] [PubMed]
- Blekesaune, M.; Solem, P.E. Working conditions and early retirement: A prospective study of retirement behavior. Res. Aging 2005, 27, 3–30. [Google Scholar] [CrossRef]
- Bartel, A.P.; Sicherman, N. Technological change and retirement decisions of older workers. J. Labor Econ. 1993, 11, 162–183. [Google Scholar] [CrossRef]
- Hirsch, B.T.; Macpherson, D.A.; Hardy, M.A. Occupational age structure and access for older workers. ILR Rev. 2000, 53, 401–418. [Google Scholar] [CrossRef]
- Yeats, D.; Folts, W.; Knapp, J. Older workers adaptation to a changing workplace: Employment issues for the 21st century. Educ. Gerontol. 2000, 6, 565–582. [Google Scholar] [CrossRef]
- Fagan, C.; Norman, H.; Smith, M.; Menéndez, M.G. In Search of Good Quality Part-time Employment, Conditions of Work and Employment Series No. 43; International Labour Office: Geneva, Switzerland, 2014. [Google Scholar]
- Shiovitz-Ezra, S.; Shemesh, J.; McDonnell, M. Pathways from ageism to loneliness. In Contemporary Perspectives on Ageism; Springer: Berlin/Heidelberg, Germany, 2018; pp. 131–147. [Google Scholar] [CrossRef] [Green Version]
- Swift, H.J.; Abrams, D.; Lamont, R.A.; Drury, L. The risks of ageism model: How ageism and negative attitudes toward age can be a barrier to active aging. Soc. Issues Policy Rev. 2017, 11, 195–231. [Google Scholar] [CrossRef] [Green Version]
- Vittersø, J.; Søholt, Y. Life satisfaction goes with pleasure and personal growth goes with interest: Further arguments for separating hedonic and eudaimonic well-being. J. Posit. Psychol. 2011, 6, 326–335. [Google Scholar] [CrossRef]
- Waterman, A.S.; Schwartz, S.J.; Conti, R. The implications of two conceptions of happiness (hedonic enjoyment and eudaimonia) for the understanding of intrinsic motivation. J. Happiness Stud. 2008, 9, 41–79. [Google Scholar] [CrossRef]
- Csikszentmihalyi, M. Beyond Boredom and Anxiety; Jossey-Bass: San Francisco, CA, USA, 1975. [Google Scholar]
- Kamdron, T. Work motivation: Relationships with job satisfaction, locus of control and motivation orientation. Int. J. Lib. Arts Soc. Sci. 2015, 3, 125–148. [Google Scholar]
- Rawlings, A.M.; Tapola, A.; Niemivirta, M. Predictive effects of temperament on motivation. Int. J. Educ. Psychol. 2017, 6, 148–182. [Google Scholar] [CrossRef]
- Bryant, C.; Bei, B.; Gilson, K.M.; Komiti, A.; Jackson, H.; Judd, F. Antecedents of attitudes to aging: A study of the roles of personality and well-being. Gerontologist 2016, 56, 256–265. [Google Scholar] [CrossRef]
- Etxeberria, I.; Etxebarria, I.; Urdaneta, E. Subjective well-being among the oldest old: The role of personality traits. Personal. Individ. Differ. 2019, 146, 209–216. [Google Scholar] [CrossRef]
- Hillerås, P.K.; Aguero-Torres, H.; Winblad, B. Factors influencing well-being in the elderly. Curr. Opin. Psychiatry 2001, 14, 361–365. [Google Scholar] [CrossRef]
- Tabassum, F.; Mohan, J.; Smith, P. Association of volunteering with mental well-being: A lifecourse analysis of a national population-based longitudinal study in the UK. BMJ Open 2016, 6, e011327. [Google Scholar] [CrossRef] [Green Version]
- Lee, W.; Lee, Y.R.; Yoon, J.H.; Lee, H.J.; Kang, M.Y. Occupational post-traumatic stress disorder: An updated systematic review. BMC Public Health 2020, 20, 1–12. [Google Scholar] [CrossRef] [PubMed]
- Wills, E. Spirituality and subjective well-being: Evidences for a new domain in the personal well-being index. J. Happiness Stud. 2009, 10, 49–69. [Google Scholar] [CrossRef]
- Feldmann, H. Protestantism, labor force participation, and employment across countries. Am. J. Econ. Sociol. 2007, 66, 795–816. [Google Scholar] [CrossRef] [Green Version]
- Peretz, H.; Fried, Y.; Levi, A. Flexible work arrangements, national culture, organisational characteristics, and organisational outcomes: A study across 21 countries. Hum. Resour. Manag. J. 2018, 28, 182–200. [Google Scholar] [CrossRef]
Publisher’s Note: MDPI stays neutral with regard to jurisdictional claims in published maps and institutional affiliations. |
© 2021 by the authors. Licensee MDPI, Basel, Switzerland. This article is an open access article distributed under the terms and conditions of the Creative Commons Attribution (CC BY) license (https://creativecommons.org/licenses/by/4.0/).