
The Effects of Lifestyle on the Risk of Lyme Disease in the United States: Evaluation of Market Segmentation Systems in Prevention and Control Strategies


Abstract
:
1. Introduction
2. Human Social Behaviors Affecting the Risk of Contracting Lyme Disease
3. Materials and Methods
3.1. Data
3.1.1. ESRI Tapestry Segmentation System
3.1.2. Lyme Disease Incidence Rates
3.2. Methods
Statistical Analysis
4. Results
4.1. National Analysis Results
4.2. Climate and Habitat Variables of High-Risk LifeModes
4.3. Regional Analysis Results
5. Discussion
6. Conclusions
Author Contributions
Funding
Institutional Review Board Statement
Informed Consent Statement
Data Availability Statement
Conflicts of Interest
Appendix A

| Demographics | ||||||||||
|---|---|---|---|---|---|---|---|---|---|---|
| LifeMode Name | Code | Counties | Households | Population | Household Type | Average Household Size | Diversity Index | Median Age | Median Income | Median Net Worth |
| Affluent Estates | 1 | 71 | 12,589,391 | 36,589,686 | Married couples | 2.88 | 46.2 | 43.1 | USD 129,800 | USD 715,900 |
| Upscale Avenues | 2 | 41 | 7,030,246 | 19,167,649 | Married couples | 2.69 | 67.7 | 40.9 | USD 105,000 | USD 268,400 |
| Uptown Individuals | 3 | 13 | 4,848,096 | 9,282,562 | Singles | 1.85 | 66.2 | 35.3 | USD 89,700 | USD 44,500 |
| Family Landscape | 4 | 159 | 9,571,331 | 27,460,541 | Married couples | 2.85 | 55.9 | 37.2 | USD 81,100 | USD 184,000 |
| GenXurban | 5 | 163 | 14,252,029 | 34,994,853 | Married couples | 2.41 | 43.3 | 43.9 | USD 66,800 | USD 157,800 |
| Cozy Country Living | 6 | 1261 | 15,175,430 | 38,619,224 | Married couples | 2.51 | 28.1 | 45.5 | USD 62,700 | USD 163,200 |
| Ethnic Enclaves | 7 | 106 | 9,019,686 | 30,363,455 | Married couples | 3.34 | 82.8 | 32.1 | USD 59,500 | USD 79,800 |
| Middle Ground | 8 | 80 | 13,638,949 | 33,367,170 | Mixed | 2.40 | 70.4 | 36.5 | USD 54,500 | USD 36,800 |
| Senior Styles | 9 | 69 | 7,315,711 | 14,828,033 | Mixed | 1.94 | 49.1 | 58.3 | USD 50,800 | USD 111,600 |
| Rustic Outposts | 10 | 965 | 10,431,913 | 27,770,247 | Married couples | 2.59 | 50.5 | 41.0 | USD 46,300 | USD 75,400 |
| Midtown Singles | 11 | 21 | 7,755,759 | 18,806,661 | Singles | 2.37 | 79.2 | 31.3 | USD 39,100 | USD 12,900 |
| Hometown | 12 | 141 | 7,628,789 | 19,341,859 | Mixed | 2.47 | 66.3 | 38.4 | USD 37,300 | USD 23,000 |
| Next Wave | 13 | 5 | 4,795,987 | 16,045,217 | Mixed | 3.30 | 89.6 | 30.0 | USD 39,900 | USD 13,300 |
| Scholars and Patriots | 14 | 45 | 2,028,867 | 6,609,014 | Mixed | 2.27 | 60.0 | 22.9 | USD 33,300 | USD 10,900 |
| Education | ||||||||||
| LifeMode Name | Code | No High-School Diploma | High-School Diploma/GED | Some College | Associate Degree | Bachelor’s Degree | Graduate Degree | |||
| Affluent Estates | 1 | 3.2% | 13.4% | 15.6% | 7.5% | 33.5% | 26.9% | |||
| Upscale Avenues | 2 | 6.3% | 18.4% | 17.0% | 8.0% | 29.0% | 21.3% | |||
| Uptown Individuals | 3 | 4.9% | 9.4% | 11.4% | 4.6% | 37.8% | 31.9% | |||
| Family Landscape | 4 | 7.2% | 25.1% | 22.8% | 10.6% | 22.4% | 11.7% | |||
| GenXurban | 5 | 7.0% | 27.2% | 21.4% | 10.0% | 21.3% | 13.1% | |||
| Cozy Country Living | 6 | 8.7% | 33.7% | 21.8% | 10.5% | 16.4% | 8.9% | |||
| Ethnic Enclaves | 7 | 21.8% | 27.9% | 20.9% | 8.3% | 14.6% | 6.4% | |||
| Middle Ground | 8 | 11.5% | 26.1% | 20.9% | 8.7% | 20.6% | 12.1% | |||
| Senior Styles | 9 | 9.4% | 26.2% | 20.6% | 7.9% | 20.8% | 15.2% | |||
| Rustic Outposts | 10 | 16.9% | 38.6% | 20.9% | 8.6% | 9.9% | 5.1% | |||
| Midtown Singles | 11 | 14.6% | 28.6% | 22.6% | 8.5% | 16.9% | 8.7% | |||
| Hometown | 12 | 15.9% | 36.7% | 23.0% | 8.5% | 10.6% | 5.3% | |||
| Next Wave | 13 | 32.6% | 28.9% | 16.7% | 5.8% | 11.3% | 4.7% | |||
| Scholars and Patriots | 14 | 6.2% | 16.9% | 21.2% | 8.2% | 26.4% | 21.1% | |||
Appendix B
| High-Risk | |||||||||
|---|---|---|---|---|---|---|---|---|---|
| LifeMode Name | Segment Name | Households | Population | Household Type | Average Household Size | Diversity Index | Median Age | Median Income | Median Net Worth |
| Affluent Estates | 1A—Top Tier | 2,111,573 | 6,050,994 | Married couples | 2.83 | 39.7 | 47.9 | USD 185,300 | USD 1,408,800 |
| 1B—Professional Pride | 2,055,809 | 6,433,030 | Married couples | 3.12 | 46.7 | 40.7 | USD 151,700 | USD 888,100 | |
| 1C—Boomburbs | 2,232,537 | 7,257,017 | Married couples | 3.24 | 65.0 | 34.1 | USD 123,900 | USD 383,300 | |
| 1D—Savvy Suburbanites | 3,746,675 | 10,678,017 | Married couples | 2.83 | 38.3 | 45.6 | USD 116,900 | USD 636,300 | |
| 1E—Ex Urbanites | 2,442,797 | 6,170,628 | Married couples | 2.48 | 37.0 | 51.6 | USD 110,300 | USD 632,300 | |
| Upscale Avenues | 2A—Urban Chic | 1,639,592 | 3,999,202 | Married couples | 2.39 | 49.9 | 43.6 | USD 120,600 | USD 352,900 |
| 2B—Pleasantville | 2,709,951 | 7,865,434 | Married couples | 2.87 | 62.5 | 43 | USD 103,500 | USD 375,800 | |
| 2C—Pacific Heights | 872,917 | 2,789,950 | Married couples | 3.16 | 74.4 | 43.1 | USD 104,300 | USD 302,400 | |
| 2D—Enterprising Professionals | 1,807,786 | 4,513,063 | Married couples | 2.48 | 74.1 | 35.7 | USD 97,300 | USD 110,100 | |
| GenXurban | 5A—Comfortable Empty Nesters | 3,087,193 | 7,809,376 | Married couples | 2.50 | 35.0 | 48.6 | USD 80,300 | USD 295,500 |
| 5B—In Style | 2,828,681 | 6,739,676 | Married couples with no kids | 2.34 | 41.9 | 42.4 | USD 79,800 | USD 162,100 | |
| 5C—Parks and Rec | 2,475,722 | 6,245,809 | Married couples | 2.50 | 53.0 | 41.4 | USD 66,600 | USD 124,000 | |
| 5D—Rustbelt Traditions | 2,748,758 | 6,817,742 | Married couples | 2.46 | 49.0 | 39.5 | USD 55,800 | USD 97,500 | |
| 5E—Midlife Constraints | 3,111,675 | 7,382,250 | Married couples with no kids | 2.29 | 37.9 | 47.3 | USD 57,300 | USD 135,400 | |
| Cozy Country Living | 6A—Green Acres | 4,086,329 | 11,064,683 | Married couples | 2.69 | 27.9 | 44.5 | USD 83,900 | USD 272,500 |
| 6B—Salt of the Earth | 3,611,849 | 9,375,498 | Married couples | 2.57 | 21.1 | 44.6 | USD 61,600 | USD 164,100 | |
| 6C—The Great Outdoors | 1,985,000 | 4,905,828 | Married couples | 2.43 | 37.0 | 47.9 | USD 62,100 | USD 155,600 | |
| 6D—Prairie Living | 1,339,996 | 3,407,393 | Married couples | 2.50 | 25.8 | 44.6 | USD 60,300 | USD 155,600 | |
| 6E—Rural Resort Dwellers | 1,280,816 | 2,873,228 | Married couples with no kids | 2.21 | 24.6 | 54.9 | USD 55,600 | USD 163,900 | |
| 6F—Heartland Communities | 2,871,438 | 6,992,594 | Married couples | 2.39 | 33.3 | 42.5 | USD 46,700 | USD 71,500 | |
| Low-Risk | |||||||||
| LifeMode Name | Segment Name | Households | Population | Household Type | Average Household Size | Diversity Index | Median Age | Median Income | Median Net Worth |
| Family Landscape | 4A—Soccer Moms | 3,719,727 | 11,053,960 | Married couples | 2.96 | 52.9 | 37.1 | USD 100,500 | USD 284,700 |
| 4B—Home Improvement | 2,145,166 | 6,166,197 | Married couples | 2.86 | 67.5 | 38.2 | USD 78,200 | USD 181,300 | |
| 4C—Middleburg | 3,706,438 | 10,240,384 | Married couples | 2.74 | 50.6 | 36.6 | USD 66,900 | USD 119,000 | |
| Ethnic Enclaves | 7A—Up and Coming Families | 3,211,195 | 10,051,661 | Married couples | 3.11 | 75.1 | 31.8 | USD 80,000 | USD 131,500 |
| 7B—Urban Villages | 1,311,784 | 5,002,060 | Married couples | 3.78 | 86.2 | 34.4 | USD 71,600 | USD 124,400 | |
| 7C—American Dreamers | 1,857,195 | 5,962,189 | Married couples | 3.19 | 84.7 | 32.9 | USD 55,200 | USD 64,200 | |
| 7D—Barrios Urbanos | 1,309,286 | 4,789,156 | Married couples | 3.62 | 80.8 | 29.2 | USD 43,200 | USD 31,300 | |
| 7E—Valley Growers | 304,463 | 1,232,632 | Married couples | 3.96 | 84.7 | 27.7 | USD 38,300 | USD 16,300 | |
| 7F—Southwestern Families | 1,025,763 | 3,325,757 | Married couples | 3.19 | 64.7 | 34.8 | USD 34,300 | USD 19,500 | |
| Rustic Outposts | 10A—Southern Satellites | 3,988,291 | 10,719,631 | Married couples | 2.66 | 42.0 | 40.7 | USD 52,900 | USD 99,100 |
| 10B—Rooted Rural | 2,488,566 | 6,283,674 | Married couples | 2.47 | 30.3 | 45.7 | USD 46,700 | USD 96,000 | |
| 10C—Diners and Miners | 821,345 | 2,142,316 | Married couples | 2.53 | 44.0 | 41.8 | USD 44,500 | USD 68,600 | |
| 10D—Down the Road | 1,457,886 | 4,080,295 | Married couples | 2.75 | 73.0 | 35.4 | USD 41,900 | USD 40,600 | |
| 10E—Rural Bypasses | 1,675,825 | 4,544,331 | Married couples | 2.54 | 61.1 | 40.8 | USD 35,900 | USD 34,400 | |
| Hometown | 12A—Family Foundations | 1,292,784 | 3,536,499 | Singles | 2.70 | 43.7 | 40 | USD 45,800 | USD 58,200 |
| 12B—Traditional Living | 2,405,568 | 6,102,717 | Married couples | 2.50 | 57.6 | 36 | USD 42,600 | USD 33,800 | |
| 12C—Small Town Simplicity | 2,314,916 | 5,451,181 | Singles | 2.25 | 52.6 | 41.1 | USD 35,200 | USD 18,900 | |
| 12D—Modest Income Homes | 1,615,521 | 4,251,462 | Singles | 2.55 | 34.3 | 37.5 | USD 26,700 | USD 13,300 | |
Appendix C
| Tapestry Segmentation for High Incidence of Lyme Disease | |||||||||
|---|---|---|---|---|---|---|---|---|---|
| LifeMode Name | Dominant Segment | Number of Counties with High Incidence | Population | Setting | Predominant Race | Interest in Gardening | Interest in Travelling | Interest in Indoor Recreation | Interest in Outdoor Recreation |
| Affluent Estates | 1A—Top Tier | 3 | 2,402,683 | Suburban | White | No | Yes | Yes | No |
| 1B—Professional Pride | 1 | 524,989 | Suburban | White | No | Yes | Yes | No | |
| 1C—Boomburbs | 2 | 562,551 | Suburban | White | No | No | Yes | No | |
| 1D—Savvy Suburbanites | 18 | 4,486,279 | Suburban | White | No | Yes | Yes | No | |
| 1E—Ex Urbanites | 2 | 191,412 | Suburban | White | No | Yes | Yes | No | |
| Upscale Avenues | 2A—Urban Chic | 1 | 11,399 | Suburban | White | About half and half | No | No | Yes |
| 2B—Pleasantville | 14 | 10,233,995 | Suburban | White | Yes | Yes | Yes | Yes | |
| 2C—Pacific Heights | 1 | 476,143 | Urban | Asian and Pacific Islander | No | No | Yes | Yes | |
| 2D—Enterprising Professionals | 5 | 2,754,881 | Suburban | White | Yes | Yes | Yes | Yes | |
| GenXurban | 5A—Comfortable Empty Nesters | 4 | 1,534,893 | Suburban | White | No | Yes | Yes | Yes |
| 5B—In Style | 13 | 3,644,811 | Metropolitan | White | No | No | Yes | No | |
| 5C—Parks and Rec | 21 | 7,661,155 | Suburban | White | No | No | Yes | No | |
| 5D—Rustbelt Traditions | 3 | 385,848 | Suburban | White | No | Yes | Yes | No | |
| 5E—Midlife Constants | 7 | 711,765 | Urban | White | No | No | Yes | No | |
| Cozy Country Living | 6A—Green Acres | 44 | 4,974,044 | Rural | White | No | No | Yes | No |
| 6B—Salt of the Earth | 53 | 3,644,805 | Rural | White | Yes | No | Yes | Yes | |
| 6C—The Great Outdoors | 34 | 1,706,308 | Rural | White | Yes | Yes | Yes | Yes | |
| 6D—Prairie Living | 22 | 437,400 | Rural | White | No | Yes | Yes | No | |
| 6E—Rural Resort Dwellers | 36 | 833,376 | Rural | White | Yes | No | Yes | No | |
| 6F—Heartland Communities | 31 | 1,585,535 | Rural | White | No | No | Yes | Yes | |
| Tapestry Segmentation for Low Incidence of Lyme Disease | |||||||||
| LifeMode Name | Segment Name | Number of Counties with High Incidence | Population | Setting | Predominant Race | Interest in Gardening | Interest in Travelling | Interest in Indoor Recreation | Interest in Outdoor Recreation |
| Family Landscape | 4A—Soccer Moms | 24 | 6,819,435 | Suburban | White | No | No | Yes | No |
| 4B—Home Improvement | 4 | 1,325,371 | Suburban | White | No | No | Yes | Yes | |
| 4C—Middleburg | 96 | 11,650,487 | Semi-rural | White | No | About half and half | Yes | No | |
| Ethnic Enclaves | 7A—Up and Coming Families | 36 | 24,899,099 | Suburban | White | No | No | No | No |
| 7B—Urban Villages | 3 | 5,418,585 | Urban | Hispanic | No | No | Yes | No | |
| 7C—American Dreamers | 5 | 5,566,295 | Urban | White, Hispanic | No | No | Yes | No | |
| 7D—Barrios Urbanos | 10 | 4,217,326 | Urban | Hispanic | No | No | Yes | No | |
| 7E—Valley Growers | 8 | 3,387,636 | Urban | Hispanic | No | No | Yes | No | |
| 7F—Southwestern Families | 20 | 8,235,115 | Urban, Suburban | Hispanic | Yes | No | Yes | Yes | |
| Rustic Outposts | 10A—Southern Satellites | 210 | 14,222,472 | Rural | White | No | No | Yes | Yes |
| 10B—Rooted Rural | 178 | 4,485,653 | Rural | White | Yes | No | Yes | Yes | |
| 10C—Diners and Miners | 62 | 1,504,617 | Rural | White | Yes | No | No | Yes | |
| 10D—Down the Road | 14 | 1,171,061 | Semi-rural | White | No | No | Yes | No | |
| 10E—Rural Bypasses | 103 | 2,885,518 | Rural | White, Black | No | No | Yes | No | |
| Hometown | 12A—Family Foundations | 4 | 2,175,757 | Metropolitan | Black | Yes | No | Yes | Yes |
| 12B—Traditional Living | 42 | 7,677,951 | Urban | White | No | No | Yes | Yes | |
| 12C—Small Town Simplicity | 32 | 1,106,914 | Semi-rural | White | No | No | Yes | No | |
| 12D—Modest Income Homes | 14 | 4,135,857 | Urban | Black | No | No | Yes | No | |
References
- Ozdenerol, E.; Seboly, J. Lifestyle Effects on the Risk of Transmission of COVID-19 in the United States: Evaluation of Market Segmentation Systems. Int. J. Environ. Res. Public Health 2021, 18, 4826. [Google Scholar] [CrossRef]
- Esri—Tapestry. Available online: http://www.esri.com/landing-pages/tapestry (accessed on 3 August 2017).
- Koplan, J.P. The small world of global health. Mt. Sinai J. Med. 2002, 69, 291–298. [Google Scholar] [PubMed]
- Transparency Market Research. Lyme Disease Therapeutics Market: Rise in the Rate of Incidence of Lyme Disease across the Globe to Drive the Market. Available online: https://www.biospace.com/article/lyme-disease-market-rise-in-the-rate-of-incidence-of-lyme-disease-across-the-globe-to-drive-the-market/ (accessed on 3 February 2021).
- Berger, K. The Application of Remote Sensing and GIS Tools in the Study of Lyme Disease Risk Prediction. 2008. Available online: http://www.edc.uri.edu/nrs/classes/NRS409509/509_2008/Berger.pdf (accessed on 4 August 2017).
- Centers for Disease Control and Prevention 2017. Tickborne Diseases of the United States. U.S. Department of Health and Human Services. Available online: https://www.cdc.gov/lyme/resources/TickborneDiseases.pdf (accessed on 15 July 2017).
- Bouchard, C.; Aenishaenslin, C.; Rees, E.E.; Koffi, J.K.; Pelcat, Y.; Ripoche, M.; Milord, F.; Lindsay, L.R.; Ogden, N.H.; Leighton, P.A. Integrated Social-Behavioral and Ecological Risk Maps to Prioritize Local Public Health Responses to Lyme Disease. Environ. Health Perspect. 2018, 126, 047008. [Google Scholar] [CrossRef]
- Fernandez, M.D.P.; Bron, G.M.; Pallavi AKache, P.A.; Larson SMaus, A.; David Gustafson, D., Jr.; Tsao, J.I.; Bartholomay, L.C.; Paskewitz, S.M.; Diuk-Wasser, M.A. The effects of human behavior on tick exposure and the risk of Lyme disease: Evaluation of the use and user demographic of The Tick App. JMIR MHealth UHealth 2019, 7, 2. Available online: https://mhealth.jmir.org/2019/10/e14769 (accessed on 23 November 2021).
- Ozdenerol, E. GIS and remote sensing use in the exploration of Lyme disease epidemiology. Int. J. Environ. Res. Public Health 2015, 12, 15181–15203. [Google Scholar] [CrossRef] [PubMed] [Green Version]
- Donohoe, H.; Pennington-Gray, L.; Omodior, O. Lyme disease: Current issues, implications, and recommendations for tourism management. Tour Manag. 2015, 46, 408–418. [Google Scholar] [CrossRef]
- Zeman, P.; Benes, C. Peri-urbanisation, counter-urbanisation, and an extension of residential exposure to ticks: A clue to the trends in Lyme borreliosis incidence in the Czech Republic? Ticks Tick-Borne Dis. 2014, 5, 907–916. [Google Scholar] [CrossRef]
- Linard, C.; Lamarque, P.; Heyman, P.; Ducoffre, G.; Luyasu, V.; Tersago, K.; Vanwambeke, S.O.; Lambin, E.F. Determinants of the geographic distribution of Puumala virus and Lyme Borreliosis infections in Belgium. Int. J. Health Geogr. 2007, 6, 1–14. [Google Scholar] [CrossRef] [PubMed] [Green Version]
- McKenna, D.F.; Fausini, Y.; Nowakowski, J.; Wormser, G.P. Factors influencing the utilization of Lyme disease-prevention behaviors in a high-risk population. J. Am. Acad. Nurse Pract. 2004, 16, 24–30. [Google Scholar] [CrossRef]
- Schwartz, B.S.L.; Goldstein, M.D. Lyme disease in outdoor workers: Risk factors, preventive measures, and tick removal methods. Am. J. Epidemiol. 1990, 131, 877–885. [Google Scholar] [CrossRef] [PubMed]
- Schwartz, B.S.; Goldstein, M.D.; Childs, J.E. Antibodies to Borrelia burgdorferi and tick salivary gland proteins in New Jersey outdoor workers. Am. J. Public Health 1993, 83, 1746–1748. [Google Scholar] [CrossRef] [Green Version]
- Bayles, B.R.; Evans, G.; Allan, B.F. Knowledge and prevention of tick-borne diseases vary across an urban-to-rural human land-use gradient. Ticks Tick-Borne Dis. 2013, 4, 352–358. [Google Scholar] [CrossRef] [PubMed]
- Blanton, J.D.; Manangan, A.; Manangan, J.; Hanlon, C.A.; Slate, D.; Rupprecht, C.E. Development of a GIS-based, real-time Internet mapping tool for rabies surveillance. Int. J. Health Geographics. 2006, 5, 47. [Google Scholar] [CrossRef] [Green Version]
- Experian. “Segmentation”. Available online: www.segmentationportal.com (accessed on 10 January 2017).
- Survey of the American Consumer®. Available online: https://www.mrisimmons.com/solutions/national-studies/survey-american-consumer/ (accessed on 5 June 2020).
- American Community Survey. Available online: https://www.census.gov/programs-surveys/acs (accessed on 10 July 2018).
- Mosaic USA Consumer Lifestyle Segmentation by Experian. Available online: http://www.experian.com/marketing-services/consumer-segmentation.html (accessed on 3 August 2017).
- Acorn—The Smarter Consumer Classification. CACI. Available online: http://acorn.caci.co.uk/ (accessed on 3 August 2017).
- Claritas MyBestSegments 2017. Available online: https://segmentationsolutions.nielsen.com/mybestsegments/Default.jsp?ID=7020&menuOption=learnmore&pageName=PRIZM%2BSocial%2BGroups&segSystem=CLA.PNE (accessed on 3 August 2017).
- Geodemographic Classification P2 People & Places 2017. Available online: http://www.p2peopleandplaces.co.uk/ (accessed on 3 August 2017).
- Harris, R.; Sleight, P.; Webber, R. Geodemographics, GIS and Neighborhood Targeting; Wiley: London, UK, 2005. [Google Scholar]
- Esri Data—Current Year Demographic & Business Data—Estimates & Projections. Available online: www.esri.com (accessed on 7 July 2019).
- CDC Wonder Database. Available online: https://www.cdc.gov/lyme/stats/survfaq.html (accessed on 24 June 2017).
- U.S. Census Bureau. Intercensal Estimates of Resident Population for Counties and States: 1 April 2000 to 1 July 2010. Population Division Internet Release Date: 22 October 2004. Available online: https://www.census.gov/programs-surveys/popest/data/data-sets.All.html (accessed on 10 July 2019).
- Amorim, R.C.; Mirkin, B. Minkowski Metric, Feature Weighting and Anomalous Cluster Initialisation in k-Means Clustering. Pattern Recognit. 2012, 45, 1061–1075. [Google Scholar] [CrossRef]
- Jones, C.G.; Ostfeld, R.S.; Richard, M.P.; Schauber, E.M.; Wolff, J.O. Chain reactions linking acorns to gypsy moth outbreaks and Lyme disease risk. Science 1998, 279, 1023–1026. [Google Scholar] [CrossRef] [Green Version]
- Kaufmann, J.; Schering, A.G. Analysis of Variance ANOVA. In Stats Reference: Statistics Reference Online; Wiley: Hoboken, NJ, USA, 2014; Available online: https://onlinelibrary.wiley.com/doi/abs/10.1002/9781118445112.stat06938 (accessed on 5 August 2020).
- Rao, C.V. Analysis of Means—A Review. J. Qual. Technol. 2005, 37, 308–315. [Google Scholar] [CrossRef]
- Linske, M.A.; Williams, S.C.; Stafford, K.C., 3rd; Lubelczyk, C.B.; Henderson, E.F.; Welch, M.; Teel, P.D. Determining Effects of Winter Weather Conditions on Adult Amblyomma americanum (Acari: Ixodidae) Survival in Connecticut and Maine, USA. Insects 2019, 11, 13. [Google Scholar] [CrossRef] [PubMed] [Green Version]
- Salkeld, D.J.; Leonhard, S.; Girard, Y.A.; Hahn, N.; Mun, J.; Padgett, K.A.; Lane, R.S. Identifying the reservoir hosts of the Lyme disease spirochete Borrelia burgdorferi in California: The role of the western gray squirrel (Sciurus griseus). Am. J. Trop. Med. Hyg. 2008, 79, 535–540. [Google Scholar] [CrossRef]
- Beckmann, S.; Freund, R.; Pehl, H.; Rodgers, A.; Venegas, T. Rodent species as possible reservoirs of Borrelia burgdorferi in a prairie ecosystem. Ticks Tick Borne Dis. 2019, 10, 1162–1167. [Google Scholar] [CrossRef]
- Guerra, M.; Walker, E.; Jones, C.; Paskewitz, S.; Cortinas, M.; Stancil, A.; Beck, L.; Bobo, M.; Kitron, U. Predicting the risk of Lyme disease: Habitat suitability for Ixodes scapularis in the north central United States. Available online: http://digitalcommons.unl.edu/entomologyfacpub/236 (accessed on 1 March 2002).
- Nicholson, M.C.; Mather, T.N. Methods for evaluating Lyme disease risks using geographic information systems and geospatial analysis. J. Med. Entomol. 1996, 33, 711–720. [Google Scholar] [CrossRef]
- Semenza, J.C.; Menne, B. Climate change and infectious diseases in Europe. Lancet Infect. Dis. 2009, 9, 365–375. [Google Scholar] [CrossRef]
- Ogden, N.H.; Maarouf, A.; Barker, I.K.; Bigras-Poulin, M.; Lindsay, L.R.; Morshed, M.G.; O’callaghan, C.J.; Ramay, F.; Waltner-Toews, D.; Charron, D.F. Climate change and the potential for range expansion of the Lyme disease vector Ixodes scapularis in Canada. Int. J. Parasitol. 2006, 36, 63–70. [Google Scholar] [CrossRef] [PubMed]
- Tsao, J.I.; Wootton, J.T.; Bunikis, J.; Luna, M.G.; Fish, D.; Barbour, A.G. An ecological approach to preventing human infection: Vaccinating wild mouse reservoirs intervenes in the Lyme disease cycle. Proc. Natl. Acad. Sci. USA 2004, 101, 18159–18164. [Google Scholar] [CrossRef] [Green Version]
- Richer, L.M.; Aroso, M.; Contente-Cuomo, T.; Ivanoa, L.; Gomes-Solecki, M. Reservoir targeted vaccine for Lyme Borreliosis induces a yearlong, neutralizing antibody response to OspA in white-footed mice. Clin. Vaccine Immunol. 2011, 209, 1809–1816. [Google Scholar] [CrossRef] [Green Version]
- Richer, L.M.; Brisson, D.; Melo, R.; Ostfeld, R.S.; Zeidner, N.; Gomes-Solecki, M. Reservoir targeted vaccine against Borrelia burgdorferi: A new strategy to prevent Lyme disease transmission. J. Infect. Dis. 2014, 209, 1972–1980. [Google Scholar] [CrossRef] [Green Version]
- Bhattacharya, D.; Bensaci, M.; Luker, K.E.; Luker, G.; Wisdom, S.; Telford, S.R.; Hu, L.T. Development of a baited oral vaccine for use in reservoir-targeted strategies against Lyme disease. Vaccine 2011, 29, 7818–7825. [Google Scholar] [CrossRef] [PubMed] [Green Version]
- Gomes-Solecki, M.; Arnaboldi, P.M.; Backenson, P.B.; Benach, J.L.; Cooper, C.L.; Dattwyler, R.J.; Diuk-Wasser, M.; Fikrig, E.; Hovius, J.W.; Laegreid, W.; et al. Protective immunity and new vaccines for Lyme disease. Clin. Infect. Dis. Viewp. 2020, 70, 1768–1773. [Google Scholar] [CrossRef]
- Sgroi, G.; Latta, R.; Lia, R.P.; Napoli, E.; Buono, F.; Bezerra-Santos, M.A.; Veneziano, V.; Otranto, D. Tick exposure and risk of tick-borne pathogens infection in hunters and hunting dogs: A citizen science approach. Transbound. Emerg. Dis. 2021, 1–8. [Google Scholar] [CrossRef] [PubMed]


| Source | DF | Adj SS | Adj MS | F-Value | p-Value |
|---|---|---|---|---|---|
| LifeMode | 13 | 144,073 | 11,082.5 | 13.79 | 0.000 |
| Error | 3121 | 2,508,283 | 803.7 | ||
| Total | 3134 | 2,652,356 |
| ANOVA | F-Value | p-Value *** | Significant? |
|---|---|---|---|
| Lyme disease incidence | 30.659 | <0.001 | Yes |
| Code | LifeMode | Risk Level | Lyme Disease Cases per 100,000 | % Suitable (Climate and Habitat) |
|---|---|---|---|---|
| N/A | Nationwide Average | N/A | 8.03 | 1.9 |
| 1 | Affluent Estates | High | 30.14 | 5.4 |
| 2 | Upscale Avenues | High | 36.10 | 4.2 |
| 3 | Uptown Individuals | Low | 3.87 | 2.8 |
| 4 | Family Landscapes | Low | 3.95 | 0.9 |
| 5 | GenXurban | High | 13.78 | 6.0 |
| 6 | Cozy Country Living | High | 12.15 | 2.5 |
| 7 | Ethnic Enclaves | Low | 0.44 | 0.2 |
| 8 | Middle Ground | Low | 3.94 | 1.2 |
| 9 | Senior Styles | Low | 5.23 | 0.1 |
| 10 | Rustic Outposts | Low | 2.14 | 0.8 |
| 11 | Midtown Singles | Low | 5.28 | 0.5 |
| 12 | Hometown | Low | 2.54 | 0.5 |
| 13 | Next Wave | Low | 12.92 | 1.6 |
| 14 | Scholars and Patriots | Low | 2.11 | 3.1 |
| ANOVA | F-Value | p-Value *** | Significant? |
|---|---|---|---|
| Setting | 3.366 | 0.005 | Yes |
| Married couples | 1.853 | 0.158 | No |
| Children | 1.104 | 0.332 | No |
| Household size | 3.888 | 0.049 | Yes |
| Median age | 6.687 | 0.010 | Yes |
| Median income | 18.19 | <0.001 | Yes |
| Median net worth | 64.67 | <0.001 | Yes |
| Diversity index | 2.725 | 0.099 | No |
| Predominant race | 1.301 | 0.247 | No |
| Predominant career field | 12.65 | <0.001 | Yes |
| Predominant spending category | 3.966 | <0.001 | Yes |
| DIY home improvement | 3.308 | 0.069 | No |
| Gardeners | 5.029 | 0.007 | Yes |
| Travelers | 19.44 | <0.001 | Yes |
| Indoor recreation | 5.18 | 0.023 | Yes |
| Outdoor recreation | 2.116 | 0.146 | No |
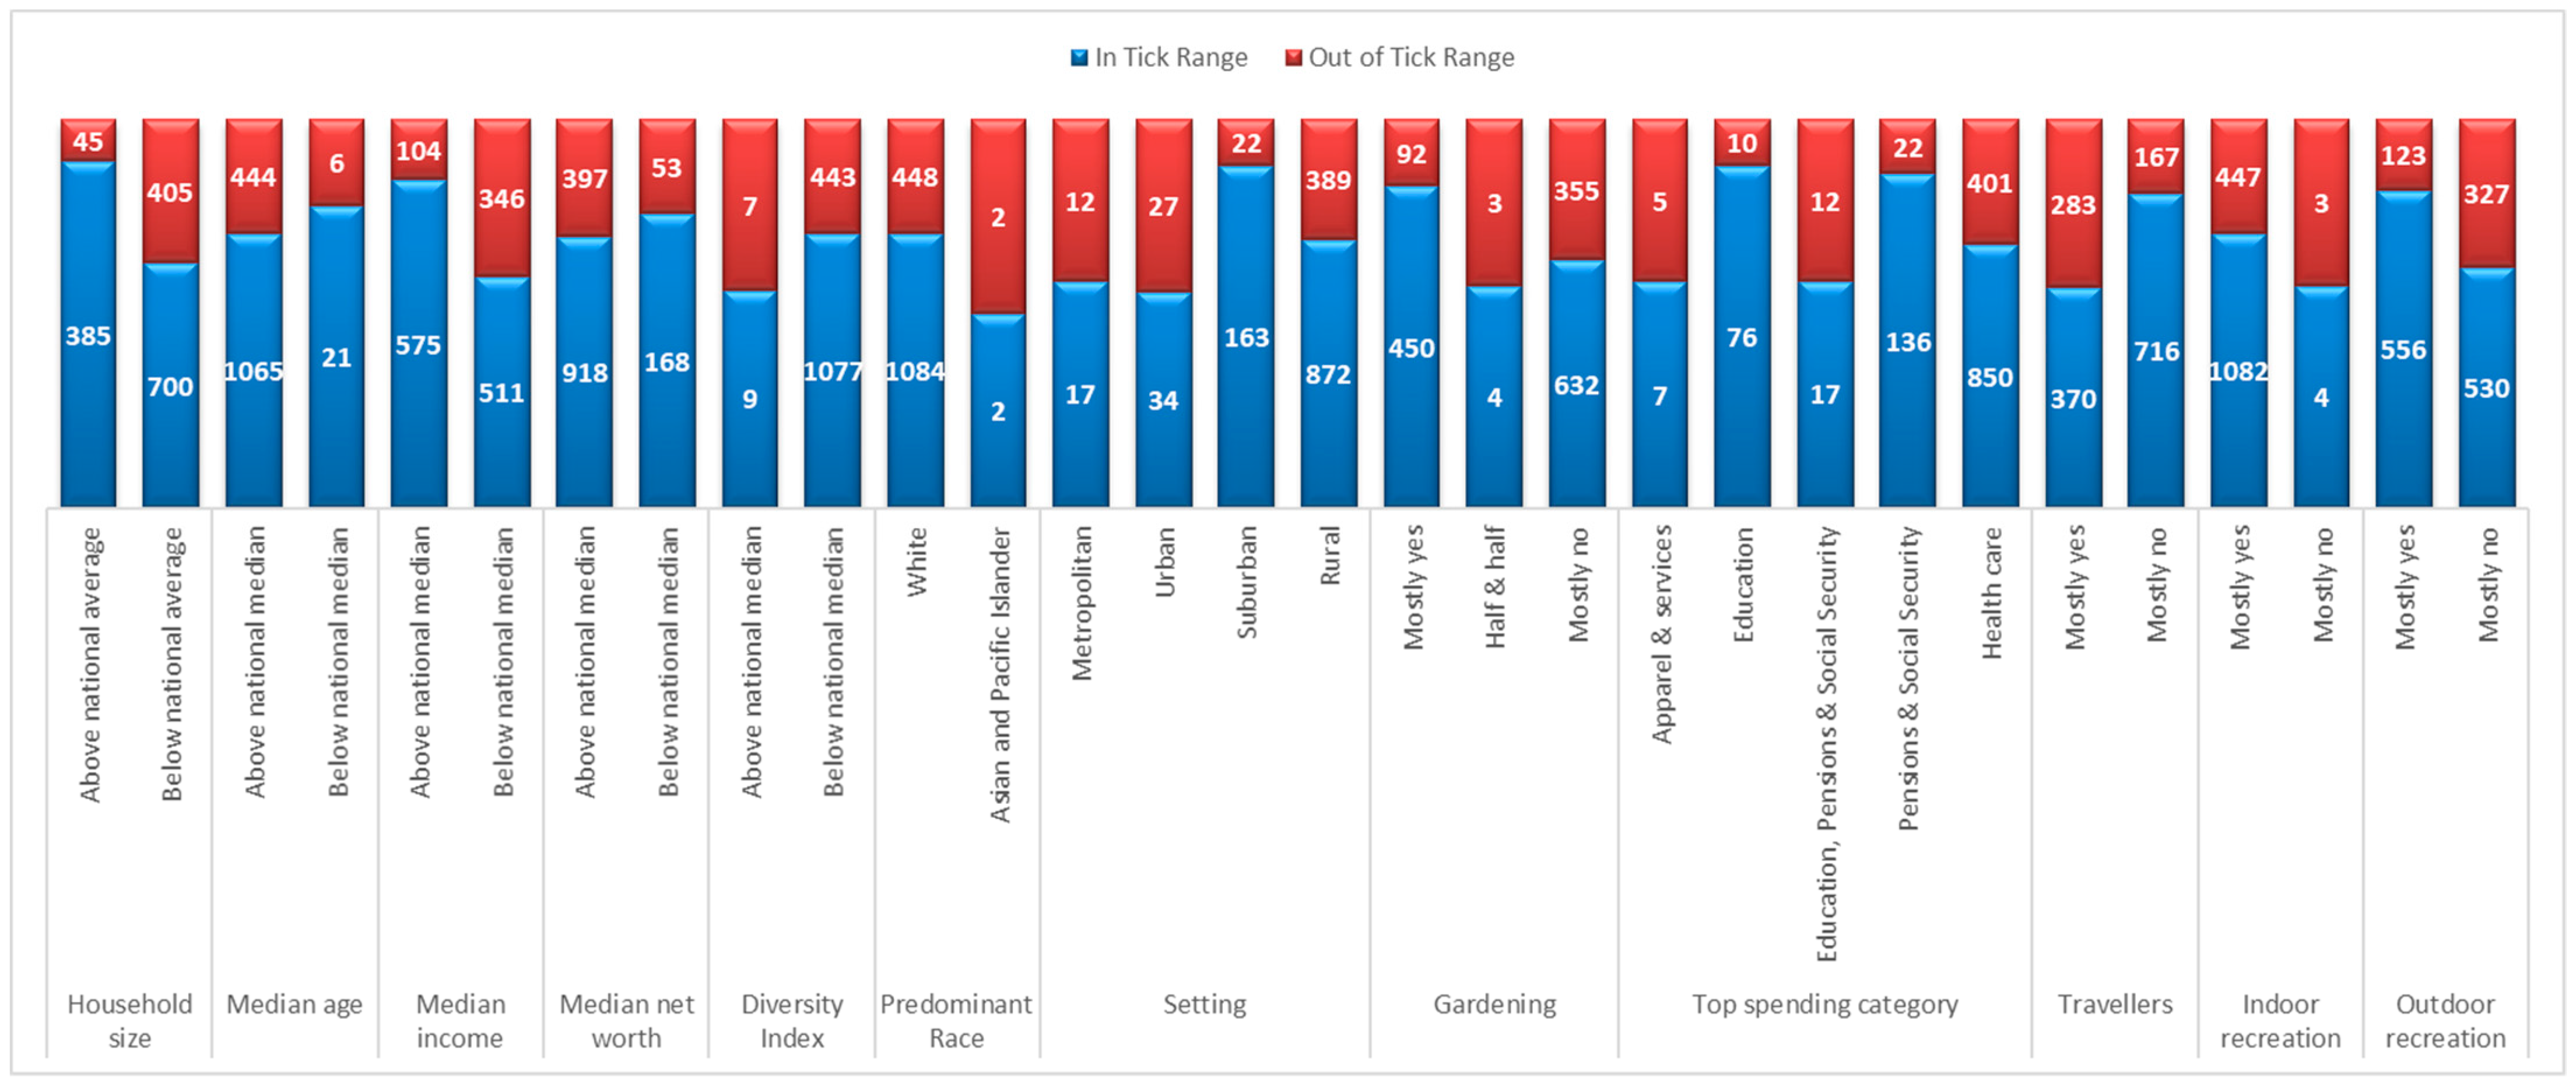
| Demographic Trait | Significant Comparison | Mean Difference | p-Value |
|---|---|---|---|
| Setting | Suburban vs. Semi-rural | 32.8 | 0.039 |
| Urban vs. Suburban | −33.0 | 0.026 | |
| Household size | Above national median vs. Below national median | 9.4 | 0.049 |
| Median age | Above national median vs. Below national median | 18.7 | 0.010 |
| Median income | Above national median vs. Below national median | 22.7 | <0.001 |
| Median net worth | Above national median vs. Below national median | 35.2 | <0.001 |
| Predominant career field | Office and administrative support and food preparation and serving vs. Office and administrative support only | 57.4 | 0.006 |
| Management, office and administrative support, and sales vs. Construction and extraction, and office and administrative support | 73.7 | <0.001 | |
| Production and office and administrative support vs. Management | −58.0 | 0.011 | |
| Management, office and administrative support, and sales vs. Management and office and administrative support | 59.6 | 0.001 | |
| Office and administrative support vs. Management, office and administrative support, and sales | −51.1 | <0.001 | |
| Production and office and administrative support vs. Management, office and administrative support, and sales | −74.3 | <0.001 | |
| Top spending category | Health care vs. Education | −24.9 | 0.002 |
| Gardeners | No vs. Mixed | −80.4 | 0.009 |
| Yes vs. Mixed | −74.3 | 0.017 | |
| Travelers | Yes vs. No | 43.5 | <0.001 |
| Interested in indoor recreation | Yes vs. No | 18.9 | 0.023 |
| Region | F-Value | p-Value | Significant? |
|---|---|---|---|
| Northeast | 13 | <0.001 | Yes |
| Southeast | 12.42 | <0.001 | Yes |
| Midcontinent | 2.695 | 0.002 | Yes |
| Rocky Mountains | 7.305 | <0.001 | Yes |
| Southwest | 3.175 | 0.001 | Yes |
| Northwest and Pacific | 1.197 | 0.307 | No |
| Alaska | 0.986 | 0.488 | No |
| Region | Mean Lyme Disease Incidence | High-Risk LifeModes | Low-Risk LifeModes |
|---|---|---|---|
| Northeast | 29.052 | 1 Affluent Estates, | 10 Rustic Outposts |
| 2 Upscale Avenues, | |||
| 6 Cozy Country Living | |||
| Southeast | 0.6918 | 6 Cozy Country Living | 4 Family Landscape |
| 7 Ethnic Enclaves | |||
| 12 Hometown | |||
| Midcontinent | 8.9868 | 6 Cozy Country Living | 12 Hometown |
| Rocky Mountains | 0.1235 | 2 Upscale Avenues, | 1 Affluent Estates, |
| 11 Midtown Singles | |||
| Southwest | 0.7373 | 6 Cozy Country Living | 7 Ethnic Enclaves |
Publisher’s Note: MDPI stays neutral with regard to jurisdictional claims in published maps and institutional affiliations. |
© 2021 by the authors. Licensee MDPI, Basel, Switzerland. This article is an open access article distributed under the terms and conditions of the Creative Commons Attribution (CC BY) license (https://creativecommons.org/licenses/by/4.0/).
Share and Cite
Ozdenerol, E.; Bingham-Byrne, R.M.; Seboly, J.D. The Effects of Lifestyle on the Risk of Lyme Disease in the United States: Evaluation of Market Segmentation Systems in Prevention and Control Strategies. Int. J. Environ. Res. Public Health 2021, 18, 12883. https://doi.org/10.3390/ijerph182412883
Ozdenerol E, Bingham-Byrne RM, Seboly JD. The Effects of Lifestyle on the Risk of Lyme Disease in the United States: Evaluation of Market Segmentation Systems in Prevention and Control Strategies. International Journal of Environmental Research and Public Health. 2021; 18(24):12883. https://doi.org/10.3390/ijerph182412883
Chicago/Turabian StyleOzdenerol, Esra, Rebecca Michelle Bingham-Byrne, and Jacob Daniel Seboly. 2021. "The Effects of Lifestyle on the Risk of Lyme Disease in the United States: Evaluation of Market Segmentation Systems in Prevention and Control Strategies" International Journal of Environmental Research and Public Health 18, no. 24: 12883. https://doi.org/10.3390/ijerph182412883