Article

Soil Lead (Pb) in New Orleans: A Spatiotemporal and Racial Analysis

by
Sara Perl Egendorf
1,*,†,
Howard W. Mielke
2,*,†,
Jorge A. Castorena-Gonzalez
2,
Eric T. Powell
3 and
Christopher R. Gonzales
2,3,†
1
Cornell Atkinson Center for Sustainability and School of Integrative Plant Science, Cornell University College of Agriculture and Life Sciences, Ithaca, NY 14853, USA
2
Department of Pharmacology, Tulane School of Medicine, New Orleans, LA 70112, USA
3
Lead Lab, Inc., New Orleans, LA 70119-3231, USA
*
Authors to whom correspondence should be addressed.
These authors contributed equally to this work.
Int. J. Environ. Res. Public Health 2021, 18(3), 1314; https://doi.org/10.3390/ijerph18031314
Submission received: 17 December 2020 / Revised: 27 January 2021 / Accepted: 28 January 2021 / Published: 1 February 2021

Abstract

:
Spatialized racial injustices drive morbidity and mortality inequalities. While many factors contribute to environmental injustices, Pb is particularly insidious, and is associated with cardio-vascular, kidney, and immune dysfunctions and is a leading cause of premature death worldwide. Here, we present a revised analysis from the New Orleans dataset of soil lead (SPb) and children’s blood Pb (BPb), which was systematically assembled for 2000–2005 and 2011–2016. We show the spatial–temporal inequities in SPb, children’s BPb, racial composition, and household income in New Orleans. Comparing medians for the inner city with outlying areas, soil Pb is 7.5 or 9.3 times greater, children’s blood Pb is ~2 times higher, and household income is lower. Between 2000–2005 and 2011–2016, a BPb decline occurred. Long-standing environmental and socioeconomic Pb exposure injustices have positioned Black populations at extreme risk of adverse health consequences. Given the overlapping health outcomes of Pb exposure with co-morbidities for conditions such as COVID-19, we suggest that further investigation be conducted on Pb exposure and pandemic-related mortality rates, particularly among Black populations. Mapping and remediating invisible environmental Pb provides a path forward for preventing future populations from developing a myriad of Pb-related health issues.

1. Introduction

Lead (Pb) exposure is responsible for more than one million deaths worldwide each year, and 24.4 million disability-adjusted life years [1]. According to a population-based cohort study by Lanphear et al. (2018), Pb is responsible for approximately 412,000 deaths in the US per year [2], which is “comparable to tobacco smoke as a leading cause of mortality” [3]. However, this exposure is often mediated by social factors, particularly race [4]. The disproportionate exposure and environmental injustice of Black and low-income communities to environmental Pb has long been recognized [5,6,7].
Exposure to Pb adversely impacts all bodily systems and is particularly associated with organ impairments to the heart, kidney, and nervous systems [8]. Pb is widely distributed throughout the body and the mechanisms of toxicity are common to all cell types, impacting organ systems over a wide range of blood Pb (BPb) (≤5–>50 µg/dL). Prior to the 1960s, the blood Pb guideline for acceptable exposure was 60 µg/dL. The guidelines of “acceptable” exposure decreased numerous times as analytical measurements improved and clinical studies indicated that adverse health effects appeared at lower levels of Pb exposure [9]. By 2012, researchers realized that “there is no known safe level of lead exposure” [10].
Tremendous advances have been made in reducing exposure to Pb, particularly by banning leaded gasoline, paint, and solder over the past few decades. However, the legacies of leaded gasoline, peeling paint, waste incineration and industrial activities are stored in environmental reservoirs, particularly in soil. Soil studies conducted in urban environments indicate that some communities, based on city size and location within the city, are disproportionately Pb contaminated. Urban studies found similar soil Pb patterns in Baltimore, cities in Minnesota, Louisiana, and UK cities [11,12,13]. The racial associations and environmental injustices of SPb have also been shown in Santa Ana, California, where census tracts with median household income <USD 50,000 had five times higher soil Pb concentrations than high-income census tracts [14]. Reducing the amount of Pb in the environments of communities also reduces blood Pb [15].
This study investigates temporal and spatial changes in environmental lead (Pb), children’s Pb exposure, and the ways in which this exposure are associated with social formations such as racial categories and socioeconomic status across the entire city of New Orleans. The data for this study were analyzed from a unique database compiled to measure the concurrent declines of soil Pb (SPb) and children’s blood Pb (BPb) over an interval of ~15 years in New Orleans [15]. Here we analyze the SPb and BPb data by several variables, including distance from the city center, residential racial population, and household income over two time periods. We hypothesize that Black communities in New Orleans are disproportionately exposed to environmental Pb in soil, causing increased BPb burdens. As we will discuss, the impacts of Pb exposure strongly overlap with immune dysfunctions, and many of the pre-existing health conditions that increase the severity of COVID-19, highlighting the need for further study of this topic. Our aim is to recognize specific and compounding environmental injustices in the midst of the global coronavirus pandemic—issues that can be remedied, particularly for the most vulnerable populations.

2. Methods

2.1. Soil Lead Data

In New Orleans, two soil Pb surveys were conducted that collected soil samples by census tracts (in 1998–2001 and 2013–2017). The two surveys were collected by the same personnel using the same extraction preparation methods and equipment and the same Spectro Inductively Coupled Plasma (ICP) analytical instrument [15]. The samples were collected in the same census tract locations using the 1990 boundaries [16]. The protocol was implemented consistently in both surveys and required the collection of nineteen surficial (2–3 cm depth) soil samples, as explained in detail in the following references [15,17]. After analysis, the median SPb results for each census tract were calculated. The datasets generated and analyzed for the current study are available in the Supplementary Materials Section (Table S2).

2.2. Children’s Blood Pb Data

Children’s blood Pb data were provided by the Louisiana Healthy Homes and Childhood Lead Poisoning Prevention Program (LHHCLPPP). There may have been a change in the sensitivity of the instruments used in the 2000–2005 BPb survey compared with the 2011–2016 BPb survey. The outcome was that the apparent lowest level of detection found in 2000–2005 was 3 µg/dL, while the lowest level of detection found in 2011–2016 was 1 µg/dL (see Figure 1 and Figure 2). Children’s BPb data for both New Orleans and the United States decreased during this time. Census tracts were included only if there were 5 or more BPb datapoints. The census tracts that included both SPb and BPb (n = 274) were matched. The BPb dataset collected by LHHCLPPP between 2000 and 2005 consists of 54,695 independent BPb results. The second LHHCLPPP BPb dataset was collected from 2011 to 2016 and consists of 27,249 BPb results from the same 274 census tracts [15].

2.3. Interpolated Soil Pb and Blood Pb Data

The median SPb or BPb levels were assigned to the center of mass of the corresponding 1990 census tracts [18]. Using these point values, continuous raster surfaces for the study area were created for SPb or BPb by Ordinary Point Kriging interpolation using Surfer 17 [19]. The surfaces had the following dimensions: 1821 columns and 1176 rows, with a cell size of 20 × 20 m2. The geodetic datum used was the North American Datum 1983 (NAD83), and the map projection was Universal Transverse Mercator, Zone 15 North (UTM 15N). The resulting surfaces were saved in Environmental Systems Research Institute (ESRI)Grid format. The interpolated values of SPb or BPb were extracted from corresponding Grids and joined to the corresponding center of mass of 2000 or 2010 US Census polygons. This was done using the Extract Values to Points Spatial Analyst Tool in ArcGIS 10.2 [20].

2.4. Spatial–Temporal Analysis

The New Orleans Main Post Office (MPO), 701 Loyola Ave, New Orleans, LA 70113, was selected as the central location of the city. Precedence for choosing the Main Post Office as the central location was established in a Baltimore urban garden study [11], particularly since the postal service was designed to maximize mail delivery efficiency in each city [21]. Distance analysis was conducted using the center of mass of census tracts as the distance from the MPO, estimated by the ArcGIS Point Distance Analysis tool [18]. The census tracts were divided according to distance by deciles. The raster cell values were appended to the tabular data associated with the census tract center of mass shape files. The census tract data on racial composition and socioeconomic data for the two surveys are from Integrated Public Use Microdata Series (IPUMS) [22].

2.5. Statistical Analyses

Statistical analyses were conducted using data-dependent permutation procedure models, such that outliers were not removed, nor were transformations of the dataset conducted [23,24]. The Multi-Response Permutation Procedure (MRPP) was used to calculate the exact moments of the underlying permutation distribution of all possible arrangements of the observed data (Table 1). This procedure produces statistical comparisons with distance function-based permutation tests and calculates statistical significance between treatments [25]. To measure the clinical, practical, or substantive significance of these statistical tests, we used the chance-corrected measure of effect size that is appropriate for MRPP, Mielke’s R. This measure of effect size provides a percentage of within-group agreement above what would be expected by chance [26]. Kendall’s tau-b rank correlation evaluates the strength of the associations between the variables. In this study, Kendall’s tau-b was calculated to evaluate pairs of observations to determine the overall strength of association based on the concordance and discordance of the ranked pairs (see Table S1 in the Supplementary Materials) [27].

3. Results

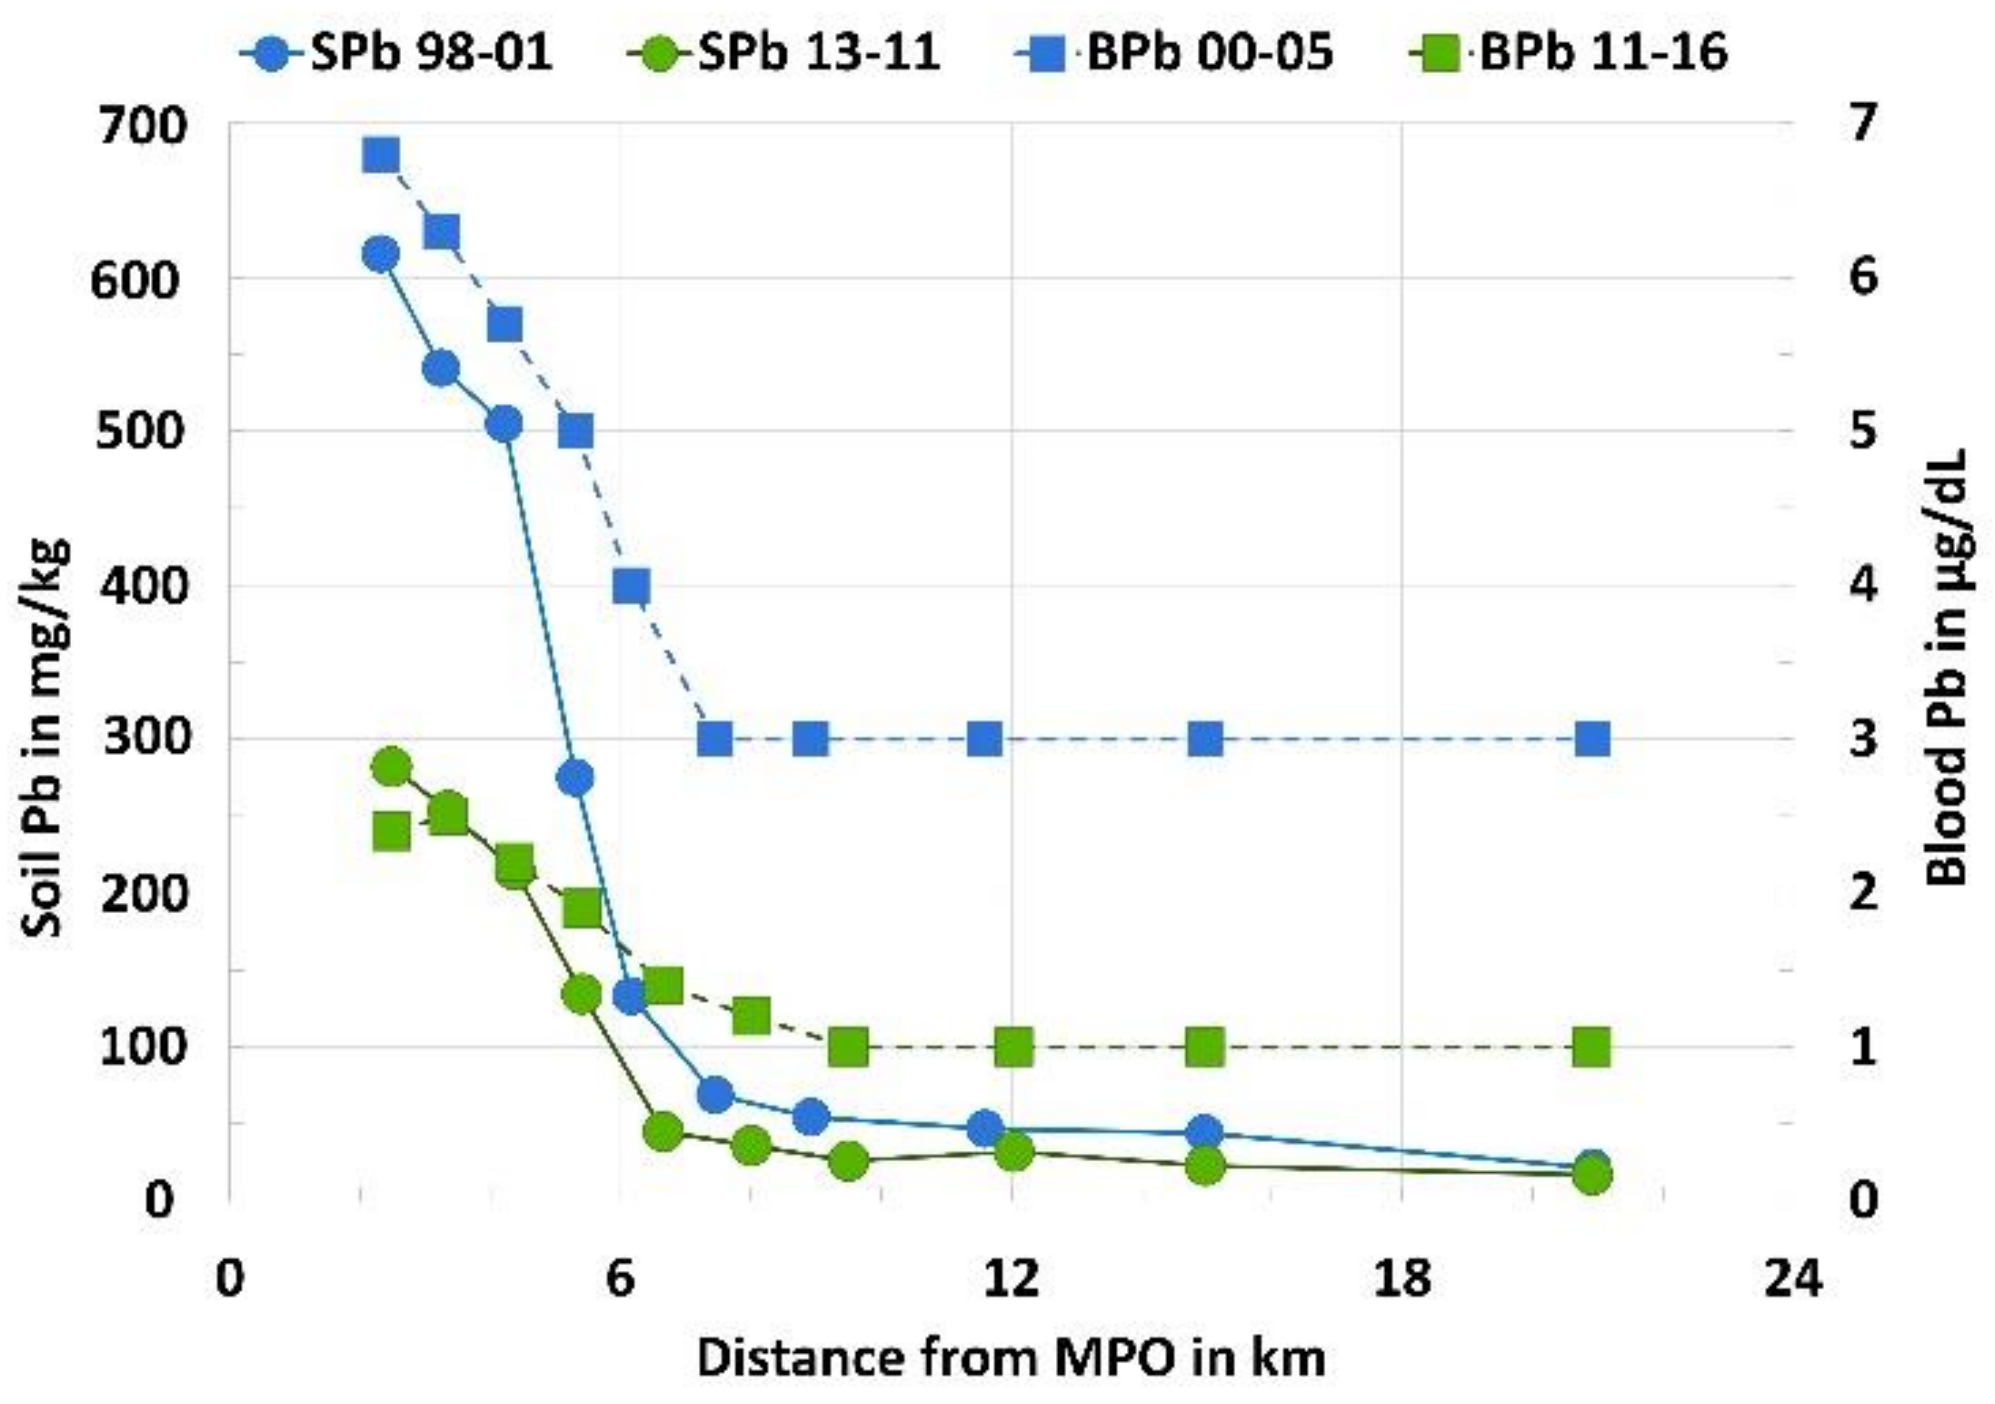
Environmental Signaling Over Time and Distance

Table 1 shows the census tract results divided into NEAR census tracts and FAR census tracts according to their distance from the Main Post Office (MPO). Table 1 lists the population density, percent racial composition, environmental Pb, children’s blood Pb, and household income characteristics. The differences between each of these characteristics for NEAR and FAR groups were analyzed with Multi-Response Permutation Procedure (MRPP) statistics [23]. The medians for soil Pb, children’s blood Pb, racial composition, and household income show that compared with FAR communities, NEAR communities have 9.3 or 7.5 times higher median SPb (p-values < 10−34), with a substantive Mielke’s R effect size of 35% in the 2000 survey and 30% in the 2015 survey. Children tested have higher median BPb concentrations by a factor of ~2 (p-values < 10−35), with an R effect size of 41% in 2000 and 34% in 2015. Annual median household income is lower by ~USD 16,000 or ~USD 13,000 (p-values < 10−6), with an R effect size of 15% in 2000 and 4% in 2015. With increasing distance from the city center, the percentage of White residents increases, and the percentage of Black residents decreases (p-values < 10−5), with R effect sizes of ~13% in 2000 and ~4% in 2015. As indicated by these results, White populations and income increase as SPb and BPb decrease with distance from the city center.
Comparing the two temporal surveys, children’s median BPb levels in NEAR and FAR communities between 2000–2005 and 2011–2016 exhibit the following Mielke’s R effect size and p-values, respectively (not shown in Table 2): all survey results for the two time periods—37% and 4.3 × 10−92; for NEAR vs. NEAR results—46% and 3.5 × 10−51; and for FAR vs. FAR results—76% and 1.3 × 10−61. We assume that the BPb results are representative of the total populations living in the NEAR and FAR groups of Metropolitan New Orleans. There were profound reductions in children’s BPb between 2000–2005 and 2011–2016 in NEAR and FAR groups.
Table 2 shows the New Orleans census tract sector characteristics as a function of distance sectors during two time periods. The spaciotemporal characteristics of race, SPb, BPb, and household income, along with other characteristics, are given. The top panel of Table 2 shows that, in 2000–2005, majority Black communities predominantly inhabited distance sectors 1–5, where the median SPb was 505 mg/kg. Majority White communities, distance sectors 6–10, inhabited communities where the median SPb for the sectors was 47 mg/kg. The bottom panel shows the characteristics of the distance sectors in 2011–2015. Especially noteworthy is the downward shift in both SPb and BPb. In sectors 1–5, the median SPb declined to 215 mg/kg (from 505 mg/kg) and in sectors 6–10 the SPb declined to 32 mg/kg (from 47 mg/kg). Black people were still more likely to inhabit high-Pb areas, but some changes are noted with black residents living in higher proportions in outlying sectors. Especially noteworthy is the decrease in children’s BPb. In 2011–2015, children’s median BPb in distance sectors 1–5 was 2.2 µg/dL (down from 5.7 µg/dL in 2000–2005). The decline in BPb was concurrent with the decrease in SPb, as described previously [15].
Figure 1 illustrates the findings listed in Table 2 by summarizing the SPb and BPb results and dividing them into 10 sectors by distance from the center of New Orleans (location of the Main Post Office or MPO). In 2000–2005, the median BPb at distances less than 6 km peaked at nearly 7 µg/dL and declined at distances >6 km from MPO to 3 µg/dL. For 2011–2016, the median BPb peaked at 3 µg/dL and declined to 1 µg/dL at 6 km. Children’s median BPb in New Orleans remains elevated closest to the center of the city and decreases with the distance from the MPO. These reductions are worthy of celebration, but there is no safe level of BPb in children [28].
Figure 2 was derived from data in Table 2 and shows the decrease in children’s median BPb by racial composition as a function of distance from the center of the city, where predominantly Black people live. The data display disproportionately high SPb in the NEAR vs. FAR groups of the city (Table 1 and Table 2, and Figure 2), largely representing Black vs. White populations.

4. Discussion

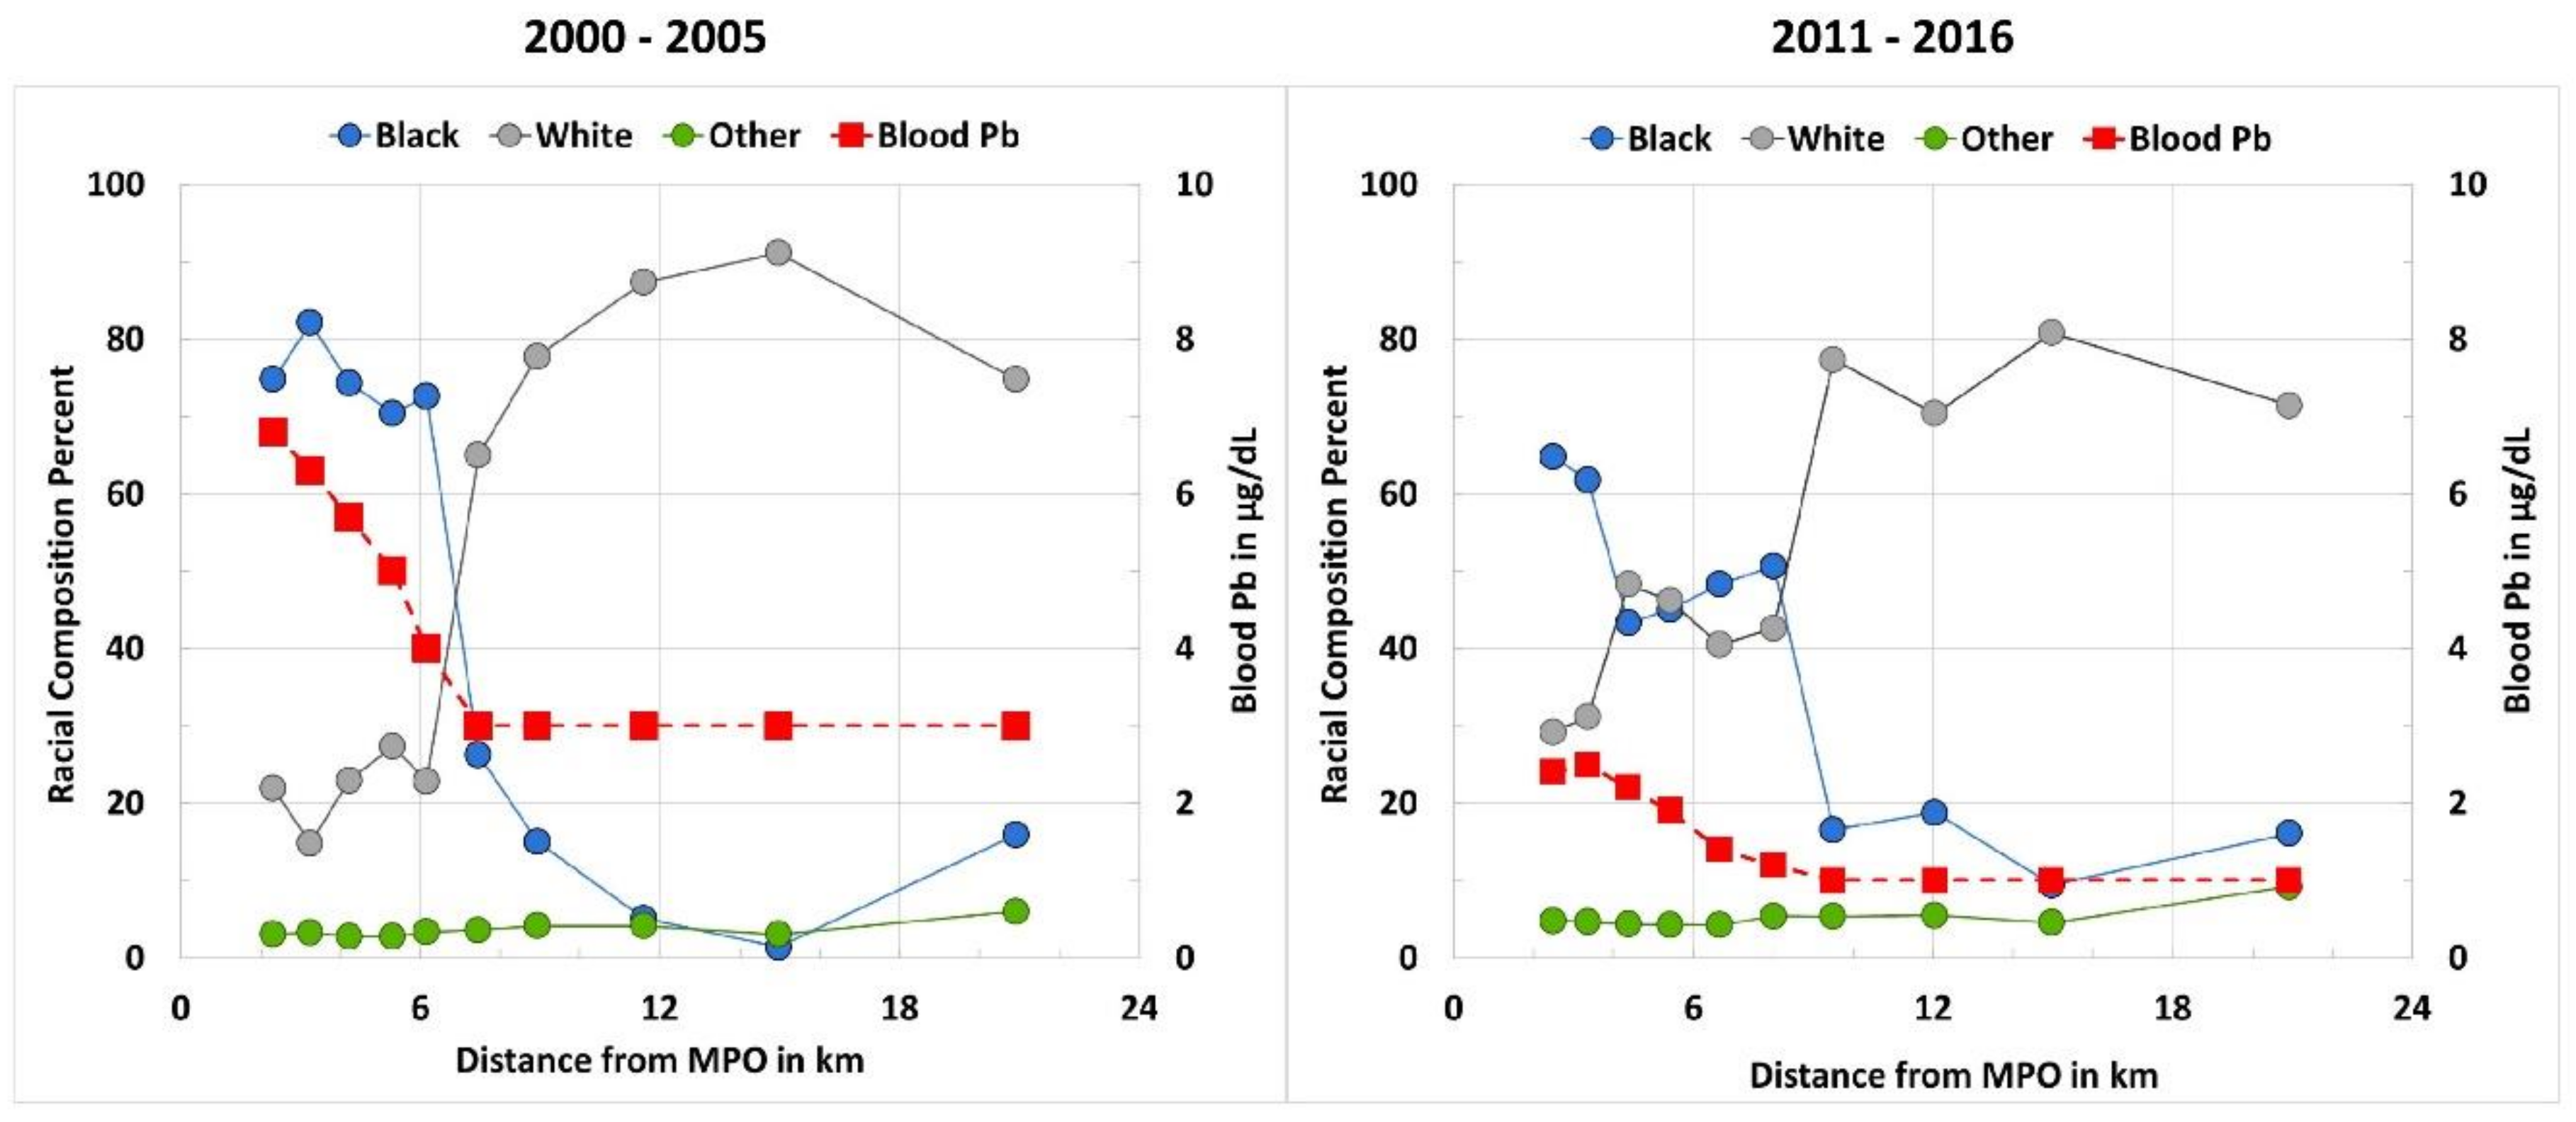
4.1. Spatial–Temporal Distribution of Soil Pb and Blood Pb: Environmental Injustice for Black Populations

In the present study, metropolitan New Orleans is observed through spatial–temporal dimensions. As shown in Table 1, children’s median BPb differences between NEAR and FAR groups in New Orleans are strongly associated with median SPb concentrations. This study notes that the predominantly Black populations living in the NEAR areas in 2000–2005 presented with a median BPb of 5.6 µg/dL. The BPb of children living in NEAR communities have consistently been higher than children living in FAR communities. Children living in high SPb communities perpetuate patterns of environmental racism, disproportionately burdening low-income communities of color [29,30].
Limited studies have documented the racial associations particular to SPb [14,31]. However, similar geographic SPb patterns have been found elsewhere [11,12], and all major cities contain historical Pb emissions from gasoline [32]. The findings presented here are in concordance with the inequitable health outcomes of vulnerable populations, which have long been associated with racial segregation and poverty [33,34,35], including as a result of Pb exposure [5]. For example, in the National Health and Nutrition Examination Survey III, conducted from 1999 to 2004, non-Hispanic Black children were nearly three times more likely than White children to have BPb > 10 ug/dL [36]. On the national scale, atmospheric Pb has been shown to positively correlate with percentages of Black children at the county level, while being inversely correlated to percentages of White youth [37]. The story of Flint, Michigan, has drawn attention to policies and practices that render Black, Brown and low-income communities disproportionately vulnerable to toxicant exposure [38,39]. While Pb exposure from these other environmental media have been widely acknowledged, our data show that environmental Pb, in the form of SPb, should be recognized as contributing to the racial disparities of BPb exposure.
Measuring SPb provides insights into adverse racial and socio-economic effects from an invisible source of urban inequity. Soil Pb is likely contributing to racialized health inequities in many more cities than are currently recognized. Despite knowledge about Pb exposure in various forms, societal institutions have been “slow to recognize the racial ecology of lead poisoning as a major form of health inequality” [4]. Childhood Pb poisoning has been identified as a “signature disease of poverty” [40], as evidenced in Table 1, which may, in part, explain the inertia from governing bodies and legislative authorities to address Pb poisoning. The lack of attention paid to the issue of environmental Pb can also be attributed to federal policies and corporate interests that approved the commercial addition of Pb in various products, notably gasoline and paint, in the first place [41].
Concurrent decreases in SPb and BPb exist between the two survey periods [15]. These reductions in BPb and the overall use of Pb as a result of major policy changes are encouraging. However, as observed in Table 1 and Figure 2, SPb results remain high (>190 mg/kg) closest to the center of the city, where Black and lower-income residents predominantly live, and SPb is consistently lower (<47 mg/kg) where White and wealthier populations reside. Empirically, this study shows that only communities where SPb is less than 47 mg/kg have an adequate margin of safety to curtail excessive Pb exposure in children.

4.2. Potential Implications for COVID-19

As mentioned in the introduction, the health impacts of childhood Pb exposure may be lifelong, and worldwide Pb is a leading cause of mortality [1,2,8]. In the midst of the global coronavirus pandemic, we would be remiss not to call attention to the overlap between the outcomes of Pb exposure and the pre-existing conditions that have contributed to COVID-19 severity and mortality. While the data presented above document children’s BPb, there is increasing evidence suggesting that childhood Pb exposure is linked with adult health outcomes [42]. The first column of Table 3 lists the dominant pre-existing health conditions associated with severe COVID-19 symptoms [43]. Each of these pre-existing conditions listed arises from Pb exposure, and relevant explanations and references are provided in the subsequent columns. Early reports in Italy demonstrated that 99% of those who died from COVID-19 had other illnesses, with 75% having high blood pressure (hypertension), 35% diabetes, and 33% heart disease [44]. In an autopsy report of Black people who died as a result of COVID-19 in Louisiana, all had at least one comorbidity, the most common conditions being hypertension and type 2 diabetes [45]. As Table 3 shows, Pb exposure is associated with each of these conditions. While associations are not necessarily causative, they necessitate further investigation.
We call attention to these overlaps and question the extent to which people with morbidities from Pb exposure are more susceptible to becoming severely ill with COVID-19. Testing such a hypothesis would require measuring the bodily burden of Pb, but such data were not available due to Health Insurance Portability and Accountability Act (HIPAA) restrictions. Even if such data were safely and anonymously available, Pb is stored in bone tissue and while noninvasive bone Pb analyses are available, they are not frequently performed. Hence, cumulative Pb impacts are commonly underrecognized [8]. Understanding the linkages between Pb-associated morbidities and other adverse health issues such as COVID-19 would enable effective public health decisions to address and prevent exposure. Outside of general data on COVID-19, actual information on spatial–temporal infections with the new coronavirus, SARS-CoV-2, in the NEAR and FAR groups of New Orleans is lacking. Such data would also enable the verification of this hypothesis.

4.3. Actions for Primary Prevention for Soil Pb

The city-wide datasets for soil Pb, blood Pb, racial and socioeconomic factors, analyzed by distance from the city center and over time, indicate that disproportionate burdens of Pb exposure are placed on already vulnerable—and specifically Black and low-income—populations in New Orleans. Action is needed to effectively prevent exposure to an invisible source of environmental Pb before health issues arise, and primary exposure prevention to SPb is surprisingly feasible. Contaminated soil can be affordably covered and, as long as the cover is maintained, primary prevention can be achieved [58]. The Norwegian parliament set a precedent in 2006 and established a national clean soil action program [59]. The New York City (NYC) Mayor’s Office of Environmental Remediation established a Clean Soil Bank, which is the first municipal program in the U.S. to attempt such an endeavor [60]. The goals of the NYC program are to eliminate transporting clean excavation soil to landfills, save costs on soil imports, and enhance urban ecosystem services, as these soils mitigate SPb exposure. In so doing, the program may also address the systemic inequities that have been rendered undeniable by environmental justice organizing and research, as well as the data presented here. Lead is invisible and thus requires systematic mapping to understand the multiple ways in which exposure exacerbates urban environmental injustices. In particular, amidst the coronavirus pandemic, we call for further investigation into the adverse effects of Pb morbidity with severe COVID-19 outcomes. Soil lead cleanup should be considered, along with other measures, as a path forward to address an urgent and racially unjust environmental factor—one that will not only promote overall health but may also mitigate current and future pandemics.

Supplementary Materials

The following are available online at https://www.mdpi.com/1660-4601/18/3/1314/s1, Table S1: Kendall’s tau-b correlation results and p-values. The potential for Pb exposure and comorbidity is highest among people living within the inner city of New Orleans; Table S2: The data file for the study.

Author Contributions

C.R.G. organized and analyzed the data for Table 1 and Table 2 and Figure 1 and Figure 2; E.T.P. performed field collections and, with C.R.G., conducted the final laboratory analyses; S.P.E. and J.A.C.-G. Developed Table 2; S.P.E., C.R.G. and H.W.M. wrote the manuscript; H.W.M. oversaw the project. All authors have read and agreed to the published version of the manuscript.

Funding

Agency for Toxic Substances and Disease Registry (ATSDR) and Housing and Urban Development (HUD) provided initial funding and further support was provided by The Ling and Ronald Cheng Fund, Al French, Mary An Godshall, Allen and Laura Carmen, and the Tulane Department of Pharmacology.

Institutional Review Board Statement

Individual children’s blood Pb results are unidentifiable and no formal IRB review was required.

Informed Consent Statement

The Children’s blood Pb datasets were obtained from the Louisiana Healthy Homes and Childhood Lead Poisoning Prevention Program (LHHCLPPP). The program follows CDC guidelines and protocols.

Data Availability Statement

The complete dataset for this study is available from the IJERPH website at www.mdpi.com/xxx/s1.

Acknowledgments

The authors thank John A. McLachlan, Tulane Department of Pharmacology, for his encouragement after reading an early draft. Kenneth Berry and Janis Johnson provided guidance with the statistical analyses. This manuscript is dedicated to the memory of Paul W. Mielke Jr., developer of MRPP statistics and Mielke’s R.

Conflicts of Interest

H.W.M. is the unremunerated president of Lead Lab, Inc. The other co-authors report that they have no conflicts of interest.

References

  1. Stanaway, J.D.; Afshin, A.; Gakidou, E.; Lim, S.S.; Abate, D.; Abate, K.H.; Abbafati, C.; Abbasi, N.; Abbastabar, H.; Abd-Allah, F.; et al. Global, Regional, and National Comparative Risk Assessment of 84 Behavioural, Environmental and Occupational, and Metabolic Risks or Clusters of Risks for 195 Countries and Territories, 1990–2017: A Systematic Analysis for the Global Burden of Disease Study 2017. Lancet 2018, 392, 1923–1994. [Google Scholar] [CrossRef] [Green Version]
  2. Lanphear, B.P.; Rauch, S.; Auinger, P.; Allen, R.W.; Hornung, R.W. Low-Level Lead Exposure and Mortality in US Adults: A Population-Based Cohort Study. Lancet Public Health 2018, 3, e177–e184. [Google Scholar] [CrossRef]
  3. O’Connor, D.; Hou, D.; Ok, Y.S.; Lanphear, B.P. The Effects of Iniquitous Lead Exposure on Health. Nat. Sustain. 2020, 3, 77–79. [Google Scholar] [CrossRef]
  4. Sampson, R.J.; Winter, A.S. The Racial Ecology of Lead Poisoning: Toxic Inequality in Chicago Neighborhoods, 1995–2013. Du Bois Rev. Soc. Sci. Res. Race 2016, 13, 261–283. [Google Scholar] [CrossRef] [Green Version]
  5. Lanphear, B.P.; Weitzman, M.; Eberly, S. Racial Differences in Urban Children’s Environmental Exposures to Lead. Am. J. Public Health 1996, 86, 1460–1463. [Google Scholar] [CrossRef]
  6. Leech, T.G.J.; Adams, E.A.; Weathers, T.D.; Staten, L.K.; Filippelli, G.M. Inequitable Chronic Lead Exposure: A Dual Legacy of Social and Environmental Injustice. Fam. Community Health 2016, 39, 151. [Google Scholar] [CrossRef]
  7. Whitehead, L.S.; Buchanan, S.D. Childhood Lead Poisoning: A Perpetual Environmental Justice Issue? J. Public Health Manag. Pract. 2019, 25, S115. [Google Scholar] [CrossRef]
  8. Abadin, H.; Ashizawa, A.; Llados, F.; Stevens, Y.W. Toxicological Profile for Lead; U.S. Department of Health and Human Services, Public Health Service: Atlanta, GA, USA, 2020; p. 583.
  9. Parsons, P.J.; McIntosh, K.G. Human Exposure to Lead and New Evidence of Adverse Health Effects: Implications for Analytical Measurements. Powder Diffr. 2010, 25, 175–181. [Google Scholar] [CrossRef]
  10. Centers for Disease Control and Prevention CDC—Lead—Blood Lead Levels in Children. Available online: https://www.cdc.gov/nceh/lead/prevention/blood-lead-levels.htm (accessed on 14 September 2019).
  11. Mielke, H.W.; Anderson, J.C.; Berry, K.J.; Mielke, P.W.; Chaney, R.L.; Leech, M. Lead Concentrations in Inner-City Soils As a Factor in the Child Lead Problem. Am. J. Public Health 1983, 73, 1366. [Google Scholar] [CrossRef] [Green Version]
  12. Mielke, H.W. Lead Dust Contaminated U.S.A. Communities: Comparison of Louisiana and Minnesota. Appl. Geochem. 1993, 8, 257–261. [Google Scholar] [CrossRef]
  13. Lark, R.M.; Scheib, C. Land Use and Lead Content in the Soils of London. Geoderma 2013, 209–210, 65–74. [Google Scholar] [CrossRef] [Green Version]
  14. Masri, S.; LeBrón, A.; Logue, M.; Valencia, E.; Ruiz, A.; Reyes, A.; Lawrence, J.M.; Wu, J. Social and Spatial Distribution of Soil Lead Concentrations in the City of Santa Ana, California: Implications for Health Inequities. Sci. Total Environ. 2020, 743, 140764. [Google Scholar] [CrossRef] [PubMed]
  15. Mielke, H.W.; Gonzales, C.R.; Powell, E.T.; Laidlaw, M.A.S.; Berry, K.J.; Mielke, P.W.; Egendorf, S.P. The Concurrent Decline of Soil Lead and Children’s Blood Lead in New Orleans. PNAS 2019, 116, 22058–22064. [Google Scholar] [CrossRef] [PubMed] [Green Version]
  16. NHGIS, N.H.G.I.S. Census Tract Boundary Files. Year 2000 and 2010 TIGER/Line Features for Jefferson, Orleans, and St. Bernard Parishes in Louisiana, USA; US Census Bureau: Sutherland, MD, USA, 2020. [Google Scholar]
  17. Mielke, H.W.; Gonzales, C.; Powell, E.; Mielke, P.W. Changes of Multiple Metal Accumulation (MMA) in New Orleans Soil: Preliminary Evaluation of Differences between Survey I (1992) and Survey II (2000). Int. J. Environ. Res. Public Health 2005, 2, 308–313. [Google Scholar] [CrossRef] [PubMed]
  18. Jenness, J. Center of Mass (Center_of_mass.Avx) Extension for ArcView 3.x.; Jenness Enterprises: Flagstaff, AZ, USA, 2006. [Google Scholar]
  19. Golden Software LLC. Surfer 17® 17.1.288 (64-bit) Dec 11 2019. Golden Software LLC: 809 14th Street, Golden, CO, USA. Available online: www.goldensoftware.com (accessed on 30 June 2020).
  20. ESRI. ArcGIS Desktop 10; Environmental Systems Research Institute: Redlands, CA, USA, 2011. [Google Scholar]
  21. Reich, A.A. Transportation Efficiency. Strateg. Plan. Energy Environ. 2012, 32, 32–43. [Google Scholar] [CrossRef]
  22. Manson, S.; Schroeder, J.; Van Riper, D.; Ruggles, S. Integrated Public Use Microdata Series (IPUMS) National Historical Geographic Information System: Version 14.0 [Database]; IPUMS: Minneapolis, MN, USA, 2019. [Google Scholar]
  23. Cade, B.S.; Richard, J. User Manual for Blossom Statistical Software; U.S. Geological Survey: Reston, VA, USA, 2001; p. 128. [Google Scholar]
  24. Berry, K.J.; Johnston, J.E.; Mielke, P.W. A Chronicle of Permutation Statistical Methods: 1920–2000, and Beyond; Springer International Publishing: Cham, Switzerland, 2014; ISBN 978-3-319-02743-2. [Google Scholar]
  25. Mielke, P.W., Jr.; Berry, K.J. Permutation Methods: A Distance Function Approach. In Springer Series in Statistics, 2nd ed.; Springer: New York, NY, USA, 2007; ISBN 978-0-387-69811-3. [Google Scholar]
  26. Berry, K.J.; Mielke, P.W. A Generalization of Cohen’s Kappa Agreement Measure to Interval Measurement and Multiple Raters. Educ. Psychol. Meas. 1988, 48, 921–933. [Google Scholar] [CrossRef]
  27. IBM Corp. IBM SPSS Statistics for Macintosh; IBM Corporation: Armonk, NY, USA, 2015. [Google Scholar]
  28. CDC. Centers for Disease Control and Prevention (CDC) Response to Advisory Committee on Childhood Lead Poisoning Prevention Recommendations in “Low Level Lead Exposure Harms Children: A Renewed Call of Primary Prevention”. Department of Health and Human Services, CDC; 2012. Available online: http://www.cdc.gov/nceh/lead/acclpp/cdc_response_lead_exposure_recs.pdf (accessed on 30 June 2020).
  29. Bullard, R.D. Confronting Environmental Racism: Voices from the Grassroots; South End Press: Boston, MA, USA, 1993; ISBN 978-0-89608-446-9. [Google Scholar]
  30. Campanella, R.; Mielke, H.W. Human Geography of New Orleans’ High-Lead Geochemical Setting. Environ. Geochem. Health 2008, 30, 531–540. [Google Scholar] [CrossRef]
  31. McClintock, N. A Critical Physical Geography of Urban Soil Contamination. Geoforum 2015, 65, 69–85. [Google Scholar] [CrossRef] [Green Version]
  32. Mielke, H.W.; Laidlaw, M.A.S.; Gonzales, C.R. Estimation of Leaded (Pb) Gasoline’s Continuing Material and Health Impacts on 90 US Urbanized Areas. Environ. Int. 2011, 37, 248–257. [Google Scholar] [CrossRef]
  33. Pellow, D. Garbage Wars: The Struggle for Environmental Justice in Chicago; MIT Press: Cambridge, MA, USA, 2002; ISBN 978-0-262-66187-4. [Google Scholar]
  34. Massey, D.S. Segregation and Stratification: A Biosocial Perspective. Du Bois Rev. 2004, 1, 7–25. [Google Scholar] [CrossRef]
  35. Morello-Frosch, R.; Lopez, R. The Riskscape and the Color Line: Examining the Role of Segregation in Environmental Health Disparities. Environ. Res. 2006, 102, 181–196. [Google Scholar] [CrossRef] [PubMed]
  36. Jones, R.L.; Homa, D.M.; Meyer, P.A.; Brody, D.J.; Caldwell, K.L.; Pirkle, J.L.; Brown, M.J. Trends in Blood Lead Levels and Blood Lead Testing Among US Children Aged 1 to 5 Years, 1988–2004. Pediatrics 2009, 123, e376–e385. [Google Scholar] [CrossRef] [PubMed] [Green Version]
  37. Stretesky, P.B. The Distribution of Air Lead Levels across U.S. Counties: Implications for the Production of Racial Inequality. Sociol. Spectr. 2003, 23, 91–118. [Google Scholar] [CrossRef]
  38. Laidlaw, M.A.S.; Filippelli, G.M.; Sadler, R.C.; Gonzales, C.R.; Ball, A.S.; Mielke, H.W. Children’s Blood Lead Seasonality in Flint, Michigan (USA), and Soil-Sourced Lead Hazard Risks. Int. J. Environ. Res. Public Health 2016, 13, 358. [Google Scholar] [CrossRef] [Green Version]
  39. Pulido, L. Flint, Environmental Racism, and Racial Capitalism. Capital. Nat. Soc. 2016, 27, 1–16. [Google Scholar] [CrossRef] [Green Version]
  40. Markowitz, G.; Rosner, D. Lead Wars: The Politics of Science and the Fate of America’s Children; University of California Press: Berkeley, CA, USA, 2013. [Google Scholar]
  41. Benfer, E.A. Contaminated Childhood: How The United States Failed to Prevent the Chronic Lead Poisoning of Low-Income Children and Communities of Color. Harv. Environ. Law Rev. 2017, 41, 70. [Google Scholar]
  42. Bellinger, D.C. Childhood Lead Exposure and Adult Outcomes. JAMA 2017, 317, 1219–1220. [Google Scholar] [CrossRef]
  43. Guan, W.; Liang, W.; Zhao, Y.; Liang, H.; Chen, Z.; Li, Y.; Liu, X.; Chen, R.; Tang, C.; Wang, T.; et al. Comorbidity and Its Impact on 1590 Patients with COVID-19 in China: A Nationwide Analysis. Eur. Respir. J. 2020, 55. [Google Scholar] [CrossRef] [Green Version]
  44. Ebhardt, T.; Remondini, C.; Bertacche, M. 99% of Those Who Died From Virus Had Other Illness, Italy Says. 18 March 2020. Available online: https://thebridgelifeinthemix.info/wp-content/uploads/2020/04/SB-7.-www_bloomberg_com_news_articles_2020_03_18_99_of_those_who_d.pdf (accessed on 30 June 2020).
  45. Fox, S.E.; Akmatbekov, A.; Harbert, J.L.; Li, G.; Quincy Brown, J.; Vander Heide, R.S. Pulmonary and Cardiac Pathology in African American Patients with COVID-19: An Autopsy Series from New Orleans. Lancet Respir. Med. 2020, 8, 681–686. [Google Scholar] [CrossRef]
  46. Apostoli, P.; Maranelli, G.; Dei Cas, L.; Micciolo, R. Blood Lead and Blood Pressure: A Cross Sectional Study in a General Population Group. Cardiologia 1990, 35, 597–603. [Google Scholar]
  47. De Almeida Lopes, A.C.B.; Silbergeld, E.K.; Navas-Acien, A.; Zamoiski, R.; da Cunha Martins, A., Jr.; Camargo, A.E.I.; Urbano, M.R.; Mesas, A.E.; Paoliello, M.M.B. Association between Blood Lead and Blood Pressure: A Population-Based Study in Brazilian Adults. Environ. Health 2017, 16, 27. [Google Scholar] [CrossRef] [PubMed] [Green Version]
  48. Menke, A.; Muntner, P.; Batuman, V.; Silbergeld, E.K.; Guallar, E. Blood Lead Below 0.48 Μmol/L (10 Μg/DL) and Mortality Among US Adults. Circulation 2006, 114, 1388–1394. [Google Scholar] [CrossRef] [PubMed] [Green Version]
  49. Schober, S.E.; Mirel Lisa, B.; Graubard Barry, I.; Brody Debra, J.; Flegal Katherine, M. Blood Lead Levels and Death from All Causes, Cardiovascular Disease, and Cancer: Results from the NHANES III Mortality Study. Environ. Health Perspect. 2006, 114, 1538–1541. [Google Scholar] [CrossRef] [PubMed]
  50. Chung, H.K.; Chang, Y.S.; Ahn, C.W. Effects of Blood Lead Levels on Airflow Limitations in Korean Adults: Findings from the 5th KNHNES 2011. Environ. Res. 2015, 136, 274–279. [Google Scholar] [CrossRef] [PubMed]
  51. Pugh Smith, P.; Nriagu, J.O. Lead Poisoning and Asthma among Low-Income and African American Children in Saginaw, Michigan. Environ. Res. 2011, 111, 81–86. [Google Scholar] [CrossRef] [PubMed]
  52. Muntner, P.; He, J.; Vupputuri, S.; Coresh, J.; Batuman, V. Blood Lead and Chronic Kidney Disease in the General United States Population: Results from NHANES III. Kidney Int. 2003, 63, 1044–1050. [Google Scholar] [CrossRef] [PubMed] [Green Version]
  53. Pollack, A.Z.; Mumford, S.L.; Mendola, P.; Perkins, N.J.; Rotman, Y.; Wactawski-Wende, J.; Schisterman, E.F. Kidney Biomarkers Associated with Blood Lead, Mercury, and Cadmium in Premenopausal Women: A Prospective Cohort Study. J. Toxicol. Environ. Health Part A 2015, 78, 119–131. [Google Scholar] [CrossRef] [PubMed] [Green Version]
  54. Boskabady, M.; Marefati, N.; Farkhondeh, T.; Shakeri, F.; Farshbaf, A.; Boskabady, M.H. The Effect of Environmental Lead Exposure on Human Health and the Contribution of Inflammatory Mechanisms, a Review. Environ. Int. 2018, 120, 404–420. [Google Scholar] [CrossRef]
  55. Mishra, K.P. Lead Exposure and Its Impact on Immune System: A Review. Toxicol. In Vitro 2009, 23, 969–972. [Google Scholar] [CrossRef]
  56. Roper, W.L.; Houk, V.N.; Falk, H.; Binder, S. Preventing Lead Poisoning in Young Children: A Statement by the Centers for Disease Control, October 1991; Centers for Disease Control: Atlanta, GA, USA, 1991. [Google Scholar]
  57. Aghdam, K.A.; Zand, A.; Sanjari, M.S. Bilateral Optic Disc Edema in a Patient with Lead Poisoning. J. Ophthalmic Vis. Res. 2019, 14, 513–517. [Google Scholar] [CrossRef]
  58. Laidlaw, M.A.S.; Filippelli, G.M.; Brown, S.; Paz-Ferreiro, J.; Reichman, S.M.; Netherway, P.; Truskewycz, A.; Ball, A.S.; Mielke, H.W. Case Studies and Evidence-Based Approaches to Addressing Urban Soil Lead Contamination. Appl. Geochem. 2017, 83, 14–30. [Google Scholar] [CrossRef] [Green Version]
  59. Ottesen, R.T.; Alexander, J.; Langedal, M.; Haugland, T.; Høygaard, E. Soil Pollution in Day-Care Centers and Playgrounds in Norway: National Action Plan for Mapping and Remediation. Environ. Geochem. Health 2008, 30, 623–637. [Google Scholar] [CrossRef] [PubMed]
  60. Egendorf, S.P.; Cheng, Z.; Deeb, M.; Flores, V.; Paltseva, A.; Walsh, D.; Groffman, P.; Mielke, H.W. Constructed Soils for Mitigating Lead (Pb) Exposure and Promoting Urban Community Gardening: The New York City Clean Soil Bank Pilot Study. Landsc. Urban Plan. 2018, 175, 184–194. [Google Scholar] [CrossRef]
Figure 1. Soil Pb (circles with scale on the left) and blood Pb (squares with scale on the right) medians as a function of distance sectors from the Main Post Office (MPO) for the 1998–2001 soil Pb and 2000–2005 blood Pb surveys compared with the 2013–2017 soil Pb and 2011–2016 blood Pb surveys.
Ijerph 18 01314 g001
Figure 2. The relationship between racial composition and children’s median blood Pb as a function of distance sectors from the Main Post Office (MPO) to outlying communities. Children’s blood Pb (BPb) data (red squares with the scale on the right) are not disaggregated by race. The overall racial composition of the sampling areas are represented (blue, grey, and green circles with the scale on the left).
Ijerph 18 01314 g002
Table 1. The percentage of White, Black, and Other populations, median interpolated soil Pb, median interpolated blood Pb, and median household incomes in 2000 and 2015 for NEAR and FAR groups from the main post office. The median household income data are from IPUMS [22].
Dist. MPO kmArea km2Pop.km2% White% Black% OtherSPb mg/kgBPb µg/dLHousehold Income US$
2000
NEAR
N of Census Tracts147147147147147147147147147
Minimum0.00.12940.00.90.3353.04621
50%3.80.6389223.072.73.14105.721,981
Maximum6.26.415,52797.499.524.8177410.6109,721
FAR
N of Census Tracts147147147147147147147147146
Minimum6.20.5220.00.00.062.116,250
50%10.21.6238878.112.74.2443.037,919
Maximum20.918.8647698.7100.021.52375.0146,158
p-Value2.5 × 10−531.7 × 10−261.4 × 10−195.2 × 10−141.8 × 10−144.3 × 10−54.8 × 10−402.1 × 10−422.4 × 10⁻²²
Mielke’s R0.4250.1430.1270.1300.1380.0280.3490.4110.149
2015
NEAR
N of Census Tracts143143143143143143143143141
Minimum0.40.163070.00.40.0161.08738
50%3.90.64281340.851.54.41872.130,917
Maximum6.75.05770297.0100.021.19104.9155,714
FAR
N of Census Tracts143143143143143143143143143
Minimum6.70.46980.00.00.060.518,114
50%10.61.44217071.517.05.5251.044,357
Maximum20.918.65690099.4100.024.91273.3161,250
p-Value4.2 × 10−538.7 × 10−221.2 × 10−95.8 × 10−52.0 × 10−50.0161.4 × 10−342.6 × 10−355.1 × 10⁻⁶
Mielke’s R0.4370.1150.0620.0360.0420.0100.3010.3350.035
Table 2. New Orleans Census tract characteristics, soil Pb (SPb), and children’s blood Pb (BPb) are divided into 10 distance sectors from the Main Post Office (PO). The population density is inhabitants per square kilometer. The interpolated values for SPb, BPb, and household income are also given.
SECTOR MEDIANS
2000–2005NMain POMain POPop. SPbBPbHousehold
SectorCTsMIN DIST kmMAX DIST kmDensity% White% Black% OtherSoil Pb (interp.)Blood Pb (interp.)Income US$
1300.002.32450621.9074.803.086156.811,950
2292.363.25512214.7782.113.275416.321,619
3293.274.22412922.9974.372.815055.721,456
4304.305.31378627.3170.462.732755.023,608
5295.316.16258922.8572.603.371334.027,526
6296.197.45234464.9726.293.62693.033,839
7307.578.93237777.7515.044.13553.040,014
8298.9711.60238887.365.114.16473.034,250
92911.8114.97257791.181.383.03443.040,086
103014.9720.92199074.7915.926.03223.039,699
TOTAL294
SECTOR MEDIANS
2011–2015NMain POMain POPop. SPbBPbHousehold
SectorCTsMIN DIST kmMAX DIST kmDensity% White% Black% OtherSoil Pb (interp.)Blood Pb (interp.)Income US$
1290.382.49361029.1764.744.782822.425,389
2282.503.36363231.1661.834.672542.528,927
3293.384.38270748.3343.294.372152.234,583
4284.385.41258246.1845.074.301351.934,822
5295.436.66198140.4848.304.27451.441,172
6286.738.01207642.6350.685.39361.238,312
7298.059.50198077.3616.565.35261.044,984
8289.5612.04221670.4018.775.49321.039,224
92912.2414.98223380.839.444.54231.052,422
102915.0320.92204071.4616.079.22171.047,679
TOTAL286
Table 3. Pb exposure and COVID-19 comorbidity conditions.
Pre-Existing Condition for COVID-19 ComorbidityAssociation with Pb ExposureReferences
High blood pressure (Hypertension)Most studied cardiovascular outcome of Pb exposure, effects may occur at BPb ≤ 5 µg/dL.Apostoli et al., 1990 [46]; Bertin de Almeida Lopes et al., 2017 [47]
Coronary heart disease (CHD)A positive dose–response relationship at BPb ≤ 10 µg/dL is an all-cause mortality and mortality cause of coronary heart disease.Menke et al., 2006 [48]; Schober et al., 2006 [49]
Chronic obstructive pulmonary disease (COPD)Over a BPb range of ≤10 µg/dL and BPb > 50 µg/dL, workers had decreased pulmonary function, obstructive pulmonary disease, increased asthma, and shortness of breath compared to controls.Chung et al., 2015 [50]; Pugh Smith and Nriagu, 2011 [51]
Chronic kidney disease (CKD)Exposure of BPb (≤ 10 ≥ 50 µg/dL) alters kidney function and chronic kidney disease (CKD). Renal nephrotoxicity severity is associated with increasing BPb.Muntner et al., 2003 [52]; Pollack, 2015 [53]
Inflammation, immune system disorders and lymphatic system dysfunctionElevated BPb (≥10 µg/dL) is an important factor in autoimmune diseases, chronic inflammation, and edema.Boskabady et al., 2018 [54]; Mishra et al., 2009 [55]; CDC, 1991 [56]; Aghdam et al., 2019 [57]
Publisher’s Note: MDPI stays neutral with regard to jurisdictional claims in published maps and institutional affiliations.

