
Face Alignment in Thermal Infrared Images Using Cascaded Shape Regression


Abstract
:1. Introduction
2. Cascaded Shape Regression
3. Experiments
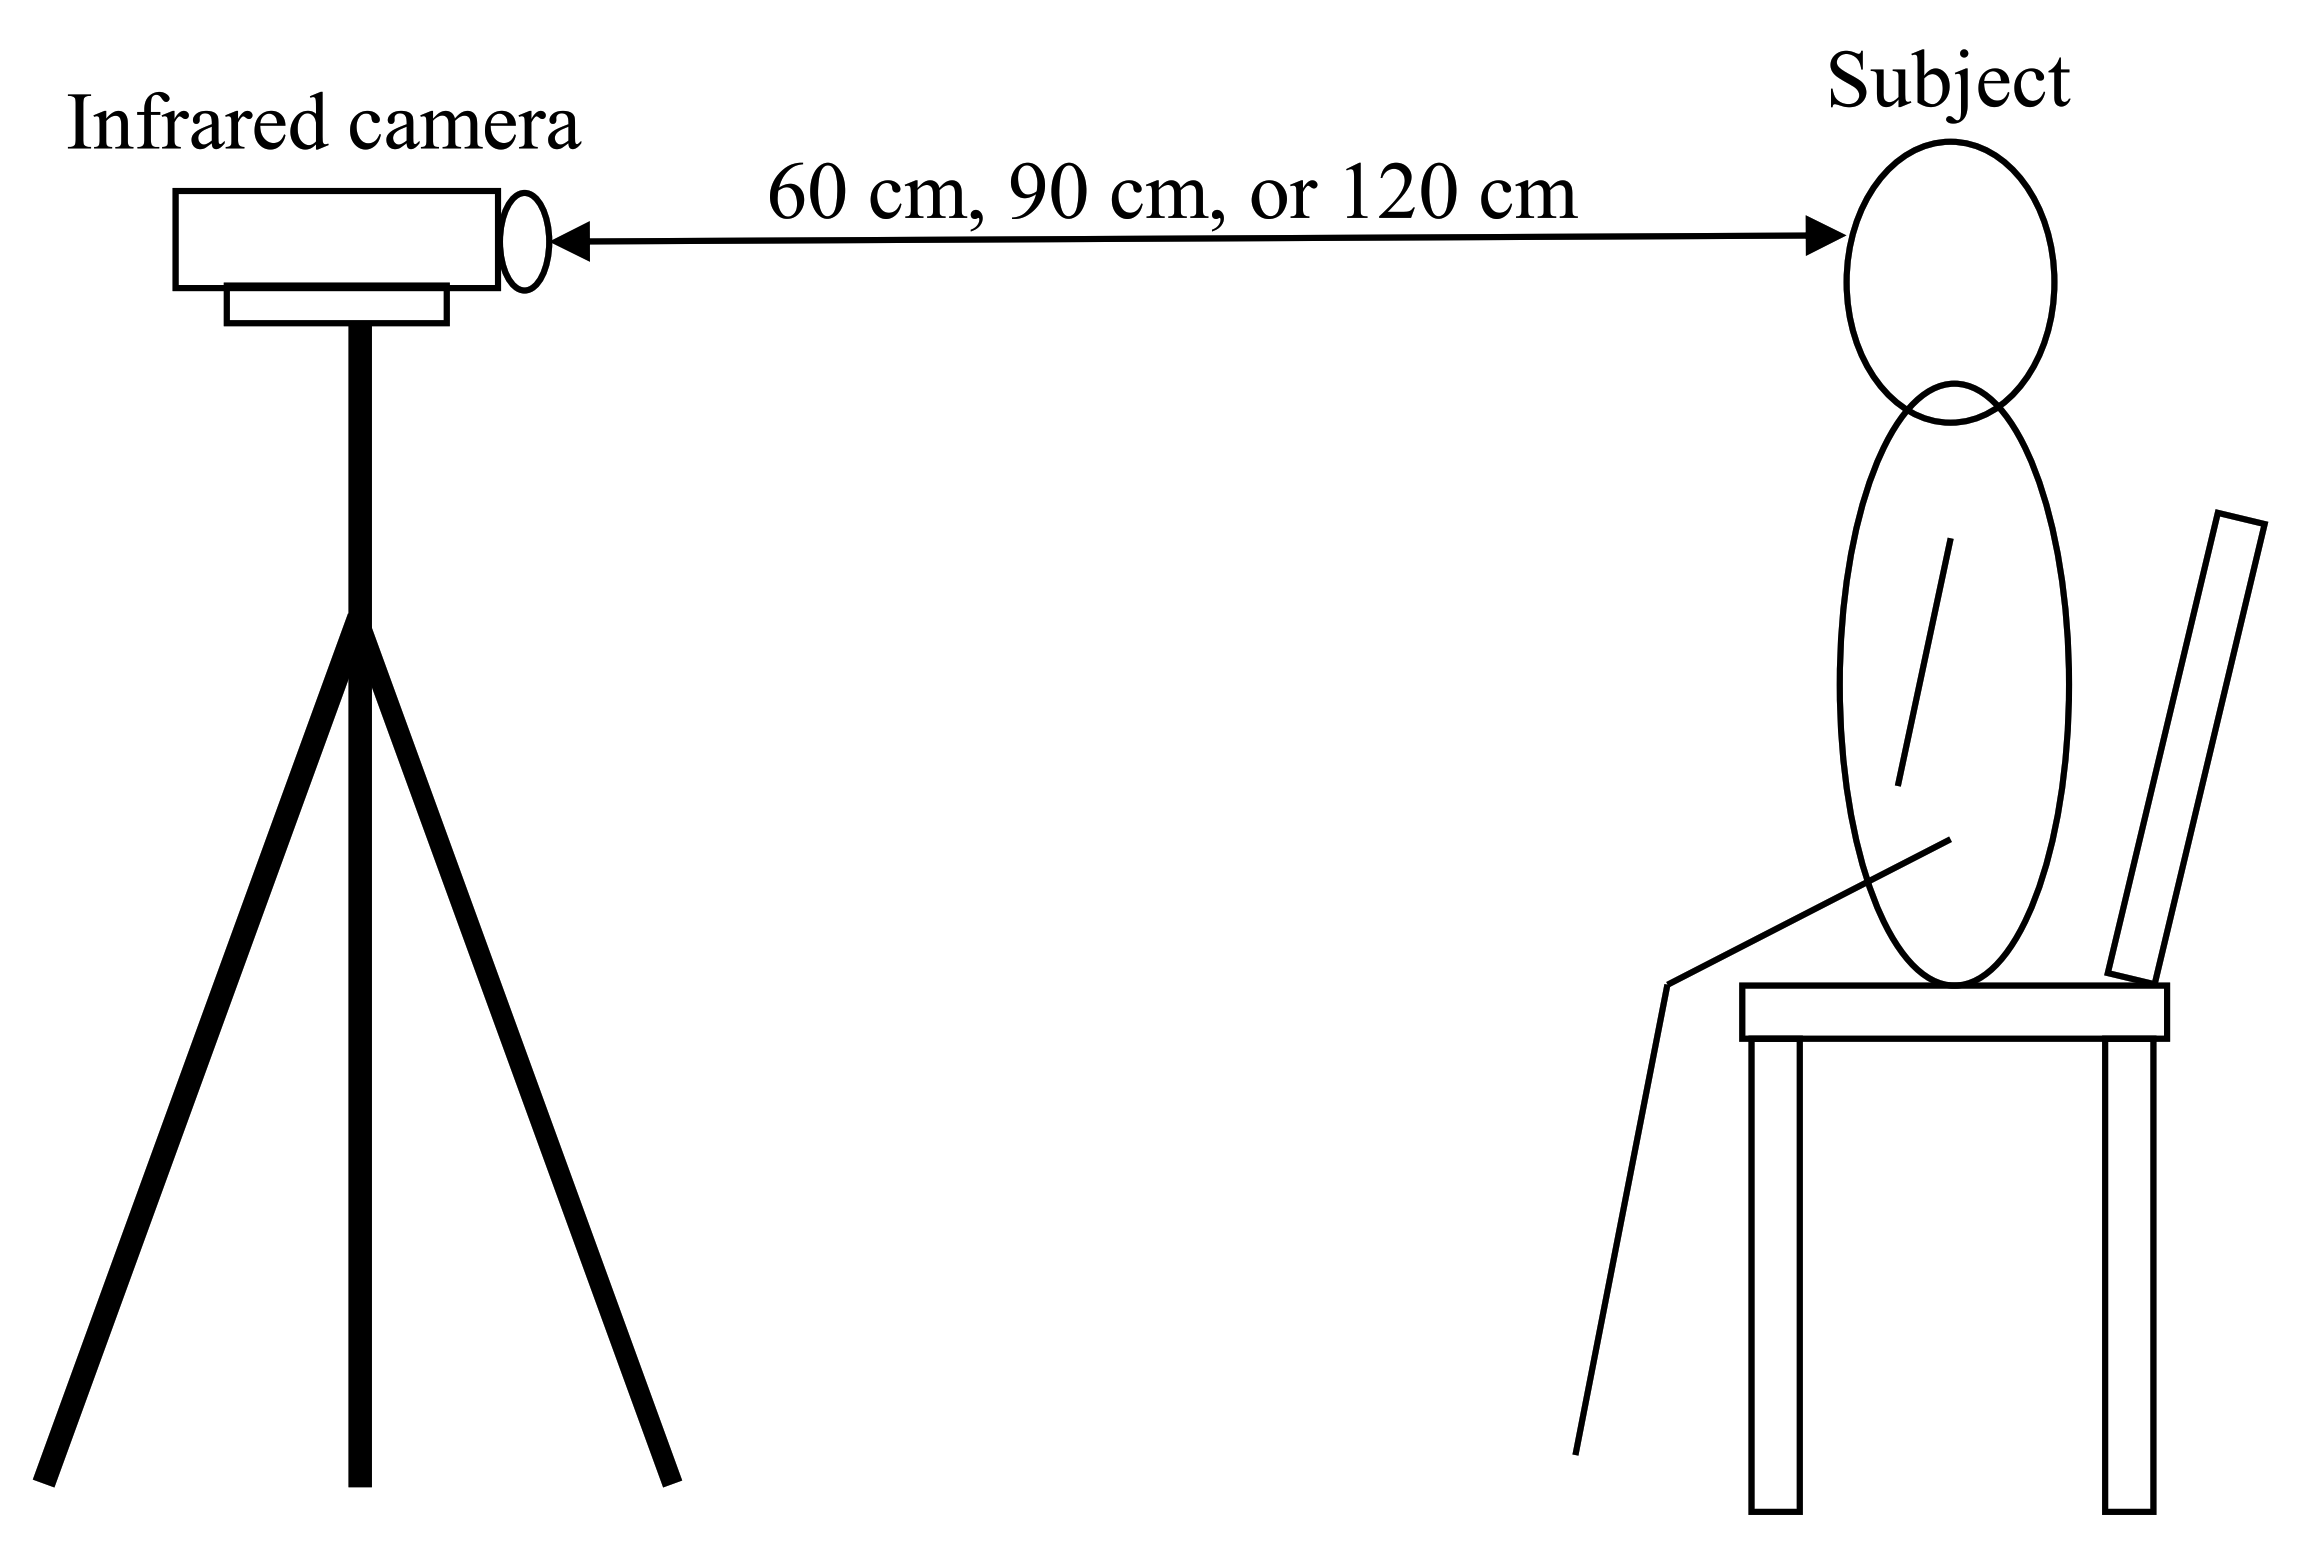
3.1. Experimental Methods
3.2. Analysis Methods
4. Results
5. Conclusions
Author Contributions
Funding
Institutional Review Board Statement
Informed Consent Statement
Conflicts of Interest
Abbreviations
| AAM | Active Appearance Model |
| CSR | Cascaded Shape Regression |
| ROI | Regions of Interest |
| HOG | Histogram of Oriented Gradients |
| DSIFT | Dense Scale Invariant Feature Transform |
| NPPE | Normalized Point to Point Error |
| FPS | Frames Per Second |
References
- Hall, T.; Lie, D.Y.; Nguyen, T.Q.; Mayeda, J.C.; Lie, P.E.; Lopez, J.; Banister, R.E. Non-contact sensor for long-term continuous vital signs monitoring: A review on intelligent phased-array Doppler sensor design. Sensors 2017, 17, 2632. [Google Scholar] [CrossRef] [Green Version]
- van den Heuvel, C.J.; Ferguson, S.A.; Dawson, D.; Gilbert, S.S. Comparison of digital infrared thermal imaging (DITI) with contact thermometry: Pilot data from a sleep research laboratory. Physiol. Meas. 2003, 24, 717. [Google Scholar] [CrossRef] [PubMed]
- Ahmadi, N.; McQuilkin, G.L.; Akhtar, M.W.; Hajsadeghi, F.; Kleis, S.J.; Hecht, H.; Naghvi, M.; Budoff, M. Reproducibility and variability of digital thermal monitoring of vascular reactivity. Clin. Physiol. Funct. Imaging 2011, 31, 422–428. [Google Scholar] [CrossRef] [PubMed]
- Zaproudina, N.; Varmavuo, V.; Airaksinen, O.; Närhi, M. Reproducibility of infrared thermography measurements in healthy individuals. Physiol. Meas. 2008, 29, 515. [Google Scholar] [CrossRef]
- McCoy, M.; Campbell, I.; Stone, P.; Fedorchuk, C.; Wijayawardana, S.; Easley, K. Intra-examiner and inter-examiner reproducibility of paraspinal thermography. PLoS ONE 2011, 6, e16535. [Google Scholar] [CrossRef] [Green Version]
- Nilsson, A.L. Blood flow, temperature, and heat loss of skin exposed to local radiative and convective cooling. J. Investig. Dermatol. 1987, 88, 586–593. [Google Scholar] [CrossRef] [Green Version]
- Ioannou, S.; Ebisch, S.; Aureli, T.; Bafunno, D.; Ioannides, H.A.; Cardone, D.; Manini, B.; Romani, G.L.; Galese, V.; Merla, A. The autonomic signature of guilt in children: A thermal infrared imaging study. PLoS ONE 2013, 8, e79440. [Google Scholar] [CrossRef] [Green Version]
- Ioannou, S.; Gallese, V.; Merla, A. Thermal infrared imaging in psychophysiology: Potentialities and limits. Psychophysiology 2014, 51, 951–963. [Google Scholar] [CrossRef] [Green Version]
- Fernández-Cuevas, I.; Marins, J.C.B.; Lastras, J.A.; Carmona, P.M.G.; Cano, S.P.; García-Concepción, M.Á.; Sillero-Quintana, M. Classification of factors influencing the use of infrared thermography in humans: A review. Phys. Technol. 2015, 71, 28–55. [Google Scholar] [CrossRef]
- Lewis, G.F.; Gatto, R.G.; Porges, S.W. A novel method for extracting respiration rate and relative tidal volume from infrared thermography. Psychophysiology 2011, 48, 877–887. [Google Scholar] [CrossRef] [PubMed] [Green Version]
- Gault, T.; Farag, A. A fully automatic method to extract the heart rate from thermal video. In Proceedings of the IEEE Conference on Computer Vision and Pattern Recognition Workshops (CVPRW), Portland, OR, USA, 23–28 June 2013; pp. 336–341. [Google Scholar]
- Asano, H.; Sakamoto, N.; Nozawa, A.; Ide, H. Presumption oftransient awakening of driver by facial skin temperature. IEEJ Trans. Electron. Inf. Syst. 2010, 130, 428–432. (In Japanese) [Google Scholar]
- Bando, S.; Oiwa, K.; Nozawa, A. Evaluation of dynamics of forehead skin temperature under induced drowsiness. IEEJ Trans. Electr. Electron. Eng. 2017, 12, S104–S109. [Google Scholar] [CrossRef]
- Adachi, H.; Oiwa, K.; Nozawa, A. Drowsiness level modeling based on facial skin temperature distribution using a convolutional neural network. IEEJ Trans. Electr. Electron. Eng. 2019, 14, 870–876. [Google Scholar]
- Nakanishi, R.; Imai-Matsumura, K. Facial skin temperature decreases in infants with joyful expression. Infant Behav. Dev. 2008, 31, 137–144. [Google Scholar] [CrossRef] [PubMed]
- Ebisch, S.J.; Aureli, T.; Bafunno, D.; Cardone, D.; Romani, G.L.; Merla, A. Mother and child in synchrony: Thermal facial imprints of autonomic contagion. Biol. Psychol. 2012, 89, 123–129. [Google Scholar] [CrossRef]
- Kopaczka, M.; Kolk, R.; Schock, J.; Burkhard, F.; Merhof, D. A thermal infrared face database with facial landmarks and emotion labels. IEEE Trans. Instrum. Meas. 2019, 68, 1389–1401. [Google Scholar] [CrossRef]
- Engert, V.; Merla, A.; Grant, J.A.; Cardone, D.; Tusche, A.; Singer, T. Exploring the use of thermal infrared imaging in human stress research. PLoS ONE 2014, 9, e90782. [Google Scholar] [CrossRef] [PubMed] [Green Version]
- Sonkusare, S.; Ahmedt-Aristizabal, D.; Aburn, M.J.; Nguyen, V.T.; Pang, T.; Frydman, S.; Denman, S.; Fookes, C.; Breakspear, M.; Guo, C.C. Detecting changes in facial temperature induced by a sudden auditory stimulus based on deep learning-assisted face tracking. Sci. Rep. 2019, 9, 1–11. [Google Scholar] [CrossRef] [PubMed]
- Masaki, A.; Nagumo, K.; Bikash, L.; Oiwa, K.; Nozawa, A. Anomaly detection in facial skin temperature using variational autoencoder. Artif. Life Robot. 2020, 26, 122–128. [Google Scholar] [CrossRef]
- Cootes, T.F.; Edwards, G.J.; Taylor, C.J. Active appearance models. IEEE Trans. Pattern Anal. Mach. Intell. 2001, 23, 681–685. [Google Scholar] [CrossRef] [Green Version]
- Kopaczka, M.; Acar, K.; Merhof, D. Robust Facial Landmark Detection and Face Tracking in Thermal Infrared Images using Active Appearance Models. In Proceedings of the 11th International Joint Conference on Computer Vision, Imaging and Computer Graphics Theory and Applications (VISIGRAPP 2016), Rome, Italy, 27–29 February 2016; pp. 150–158. [Google Scholar]
- Gross, R.; Matthews, I.; Baker, S. Generic vs. person specific active appearance models. Image Vis. Comput. 2005, 23, 1080–1093. [Google Scholar] [CrossRef] [Green Version]
- Dollár, P.; Welinder, P.; Perona, P. Cascaded pose regression. In Proceedings of the IEEE Computer Society Conference on Computer Vision and Pattern Recognition (CVPR 2010), San Francisco, CA, USA, 13–18 June 2010; pp. 1078–1085. [Google Scholar]
- Cao, X.; Wei, Y.; Wen, F.; Sun, J. Face alignment by explicit shape regression. Int. J. Comput. Vis. 2014, 107, 177–190. [Google Scholar] [CrossRef]
- Ren, S.; Cao, X.; Wei, Y.; Sun, J. Face alignment at 3000 fps via regressing local binary features. In Proceedings of the IEEE Conference on Computer Vision and Pattern Recognition (CVPR 2014), Columbus, OH, USA, 24–27 June 2014; pp. 1685–1692. [Google Scholar]
- Kazemi, V.; Sullivan, J. One millisecond face alignment with an ensemble of regression trees. In Proceedings of the IEEE Conference on Computer Vision and Pattern Recognition (CVPR 2014), Columbus, OH, USA, 24–27 June 2014; pp. 1867–1874. [Google Scholar]
- Burgos-Artizzu, X.P.; Perona, P.; Dollár, P. Robust face landmark estimation under occlusion. In Proceedings of the IEEE International Conference on Computer Vision (ICCV 2013), Sydney, Australia, 1–8 December 2013; pp. 1513–1520. [Google Scholar]
- Steketee, J. Spectral emissivity of skin and pericardium. Phys. Med. Biol. 1973, 18, 686. [Google Scholar] [CrossRef] [PubMed]
- Sagonas, C.; Tzimiropoulos, G.; Zafeiriou, S.; Pantic, M. 300 faces in-the-wild challenge: The first facial landmark localization challenge. In Proceedings of the IEEE International Conference on Computer Vision Workshop (ICCVW), Sydney, Australia, 2–8 December 2013. [Google Scholar]
- Zhu, X.; Ramanan, D. Face detection, pose estimation, and landmark localization in the wild. In Proceedings of the IEEE Conference on Computer Vision and Pattern Recognition (CVPR 2012), Providence, Rhode Island, 16–21 June 2012; pp. 2879–2886. [Google Scholar]
- Marciniak, T.; Chmielewska, A.; Weychan, R.; Parzych, M.; Dabrowski, A. Influence of low resolution of images on reliability of face detection and recognition. Multimed. Tools Appl. 2015, 74, 4329–4349. [Google Scholar] [CrossRef] [Green Version]
- Zafeiriou, S.; Trigeorgis, G.; Chrysos, G.; Deng, J.; Shen, J. The menpo facial landmark localisation challenge: A step towards the solution. In Proceedings of the IEEE Conference on Computer Vision and Pattern Recognition Workshops (CVPRW), Honolulu, HI, USA, 21–27 July 2017; pp. 170–179. [Google Scholar]
- Ivanitsky, G.R.; Khizhnyak, E.P.; Deev, A.A.; Khizhnyak, L.N. Thermal imaging in medicine: A comparative study of infrared systems operating in wavelength ranges of 3–5 and 8–12 um as applied to diagnosis. Dokl. Biochem. Biophys. 2006, 407, 59–63. [Google Scholar] [CrossRef]


| Subject | Facial Skin Temperature/°C | Ambient Temperature/°C | ||
|---|---|---|---|---|
| Minimum | Maximum | Mean | ||
| A | 30.64 ± 0.22 | 34.27 ± 0.15 | 32.50 ± 0.13 | 24.42 ± 0.07 |
| B | 29.23 ± 0.28 | 33.76 ± 0.12 | 31.89 ± 0.22 | 24.38 ± 0.37 |
| C | 29.99 ± 0.20 | 33.67 ± 0.17 | 31.85 ± 0.17 | 24.46 ± 0.14 |
| D | 30.81 ± 0.17 | 34.13 ± 0.17 | 32.64 ± 0.19 | 24.02 ± 0.06 |
| E | 31.42 ± 0.16 | 34.18 ± 0.09 | 32.98 ± 0.09 | 24.33 ± 0.06 |
| F | 30.32 ± 0.33 | 34.05 ± 0.27 | 32.27 ± 0.25 | 24.44 ± 0.29 |
| G | 31.20 ± 0.32 | 34.15 ± 0.17 | 32.80 ± 0.22 | 24.11 ± 0.10 |
| Method | FPS |
|---|---|
| CSR | 83.3 |
| AAM + Intensity | 5.56 |
| AAM + HOG | 0.35 |
| AAM + DSIFT | 0.64 |
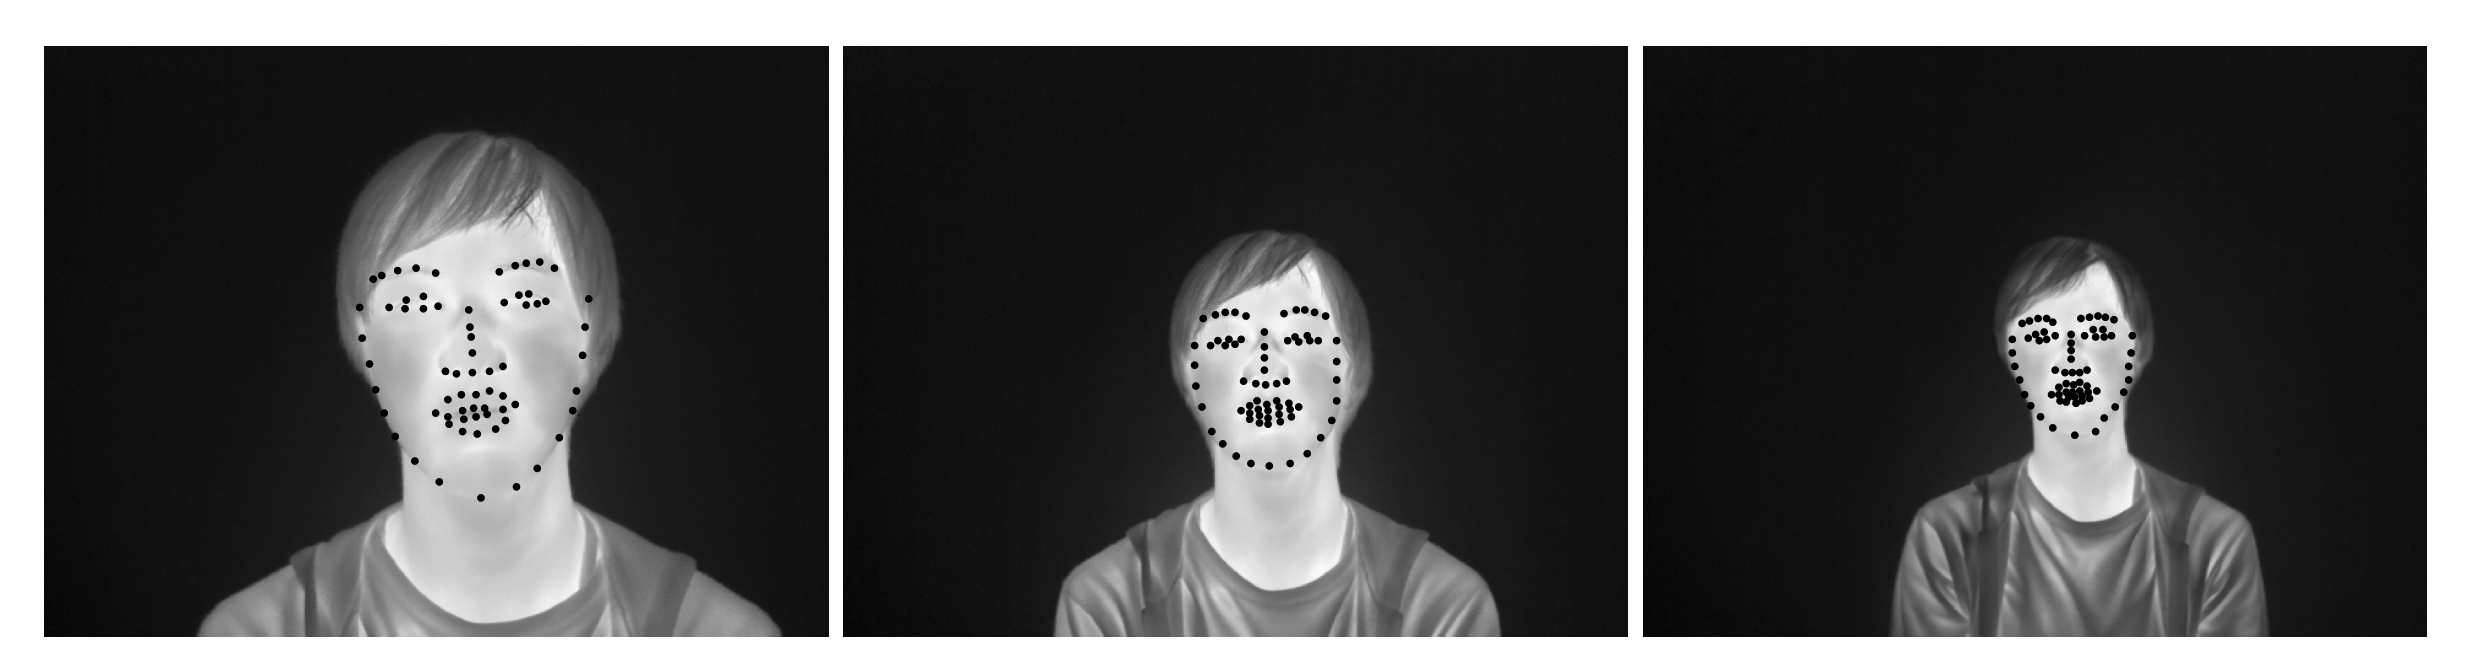
| Distance/cm | Pixels Per Face Width | NPPE/% |
|---|---|---|
| 60 | 184 ± 20 | 3.25 ± 1.99 |
| 90 | 126 ± 13 | 3.02 ± 1.71 |
| 120 | 97 ± 10 | 3.23 ± 1.47 |
Publisher’s Note: MDPI stays neutral with regard to jurisdictional claims in published maps and institutional affiliations. |
© 2021 by the authors. Licensee MDPI, Basel, Switzerland. This article is an open access article distributed under the terms and conditions of the Creative Commons Attribution (CC BY) license (http://creativecommons.org/licenses/by/4.0/).
Share and Cite
Nagumo, K.; Kobayashi, T.; Oiwa, K.; Nozawa, A. Face Alignment in Thermal Infrared Images Using Cascaded Shape Regression. Int. J. Environ. Res. Public Health 2021, 18, 1776. https://doi.org/10.3390/ijerph18041776
Nagumo K, Kobayashi T, Oiwa K, Nozawa A. Face Alignment in Thermal Infrared Images Using Cascaded Shape Regression. International Journal of Environmental Research and Public Health. 2021; 18(4):1776. https://doi.org/10.3390/ijerph18041776
Chicago/Turabian StyleNagumo, Kent, Tomohiro Kobayashi, Kosuke Oiwa, and Akio Nozawa. 2021. "Face Alignment in Thermal Infrared Images Using Cascaded Shape Regression" International Journal of Environmental Research and Public Health 18, no. 4: 1776. https://doi.org/10.3390/ijerph18041776