4.4. Age and Gender
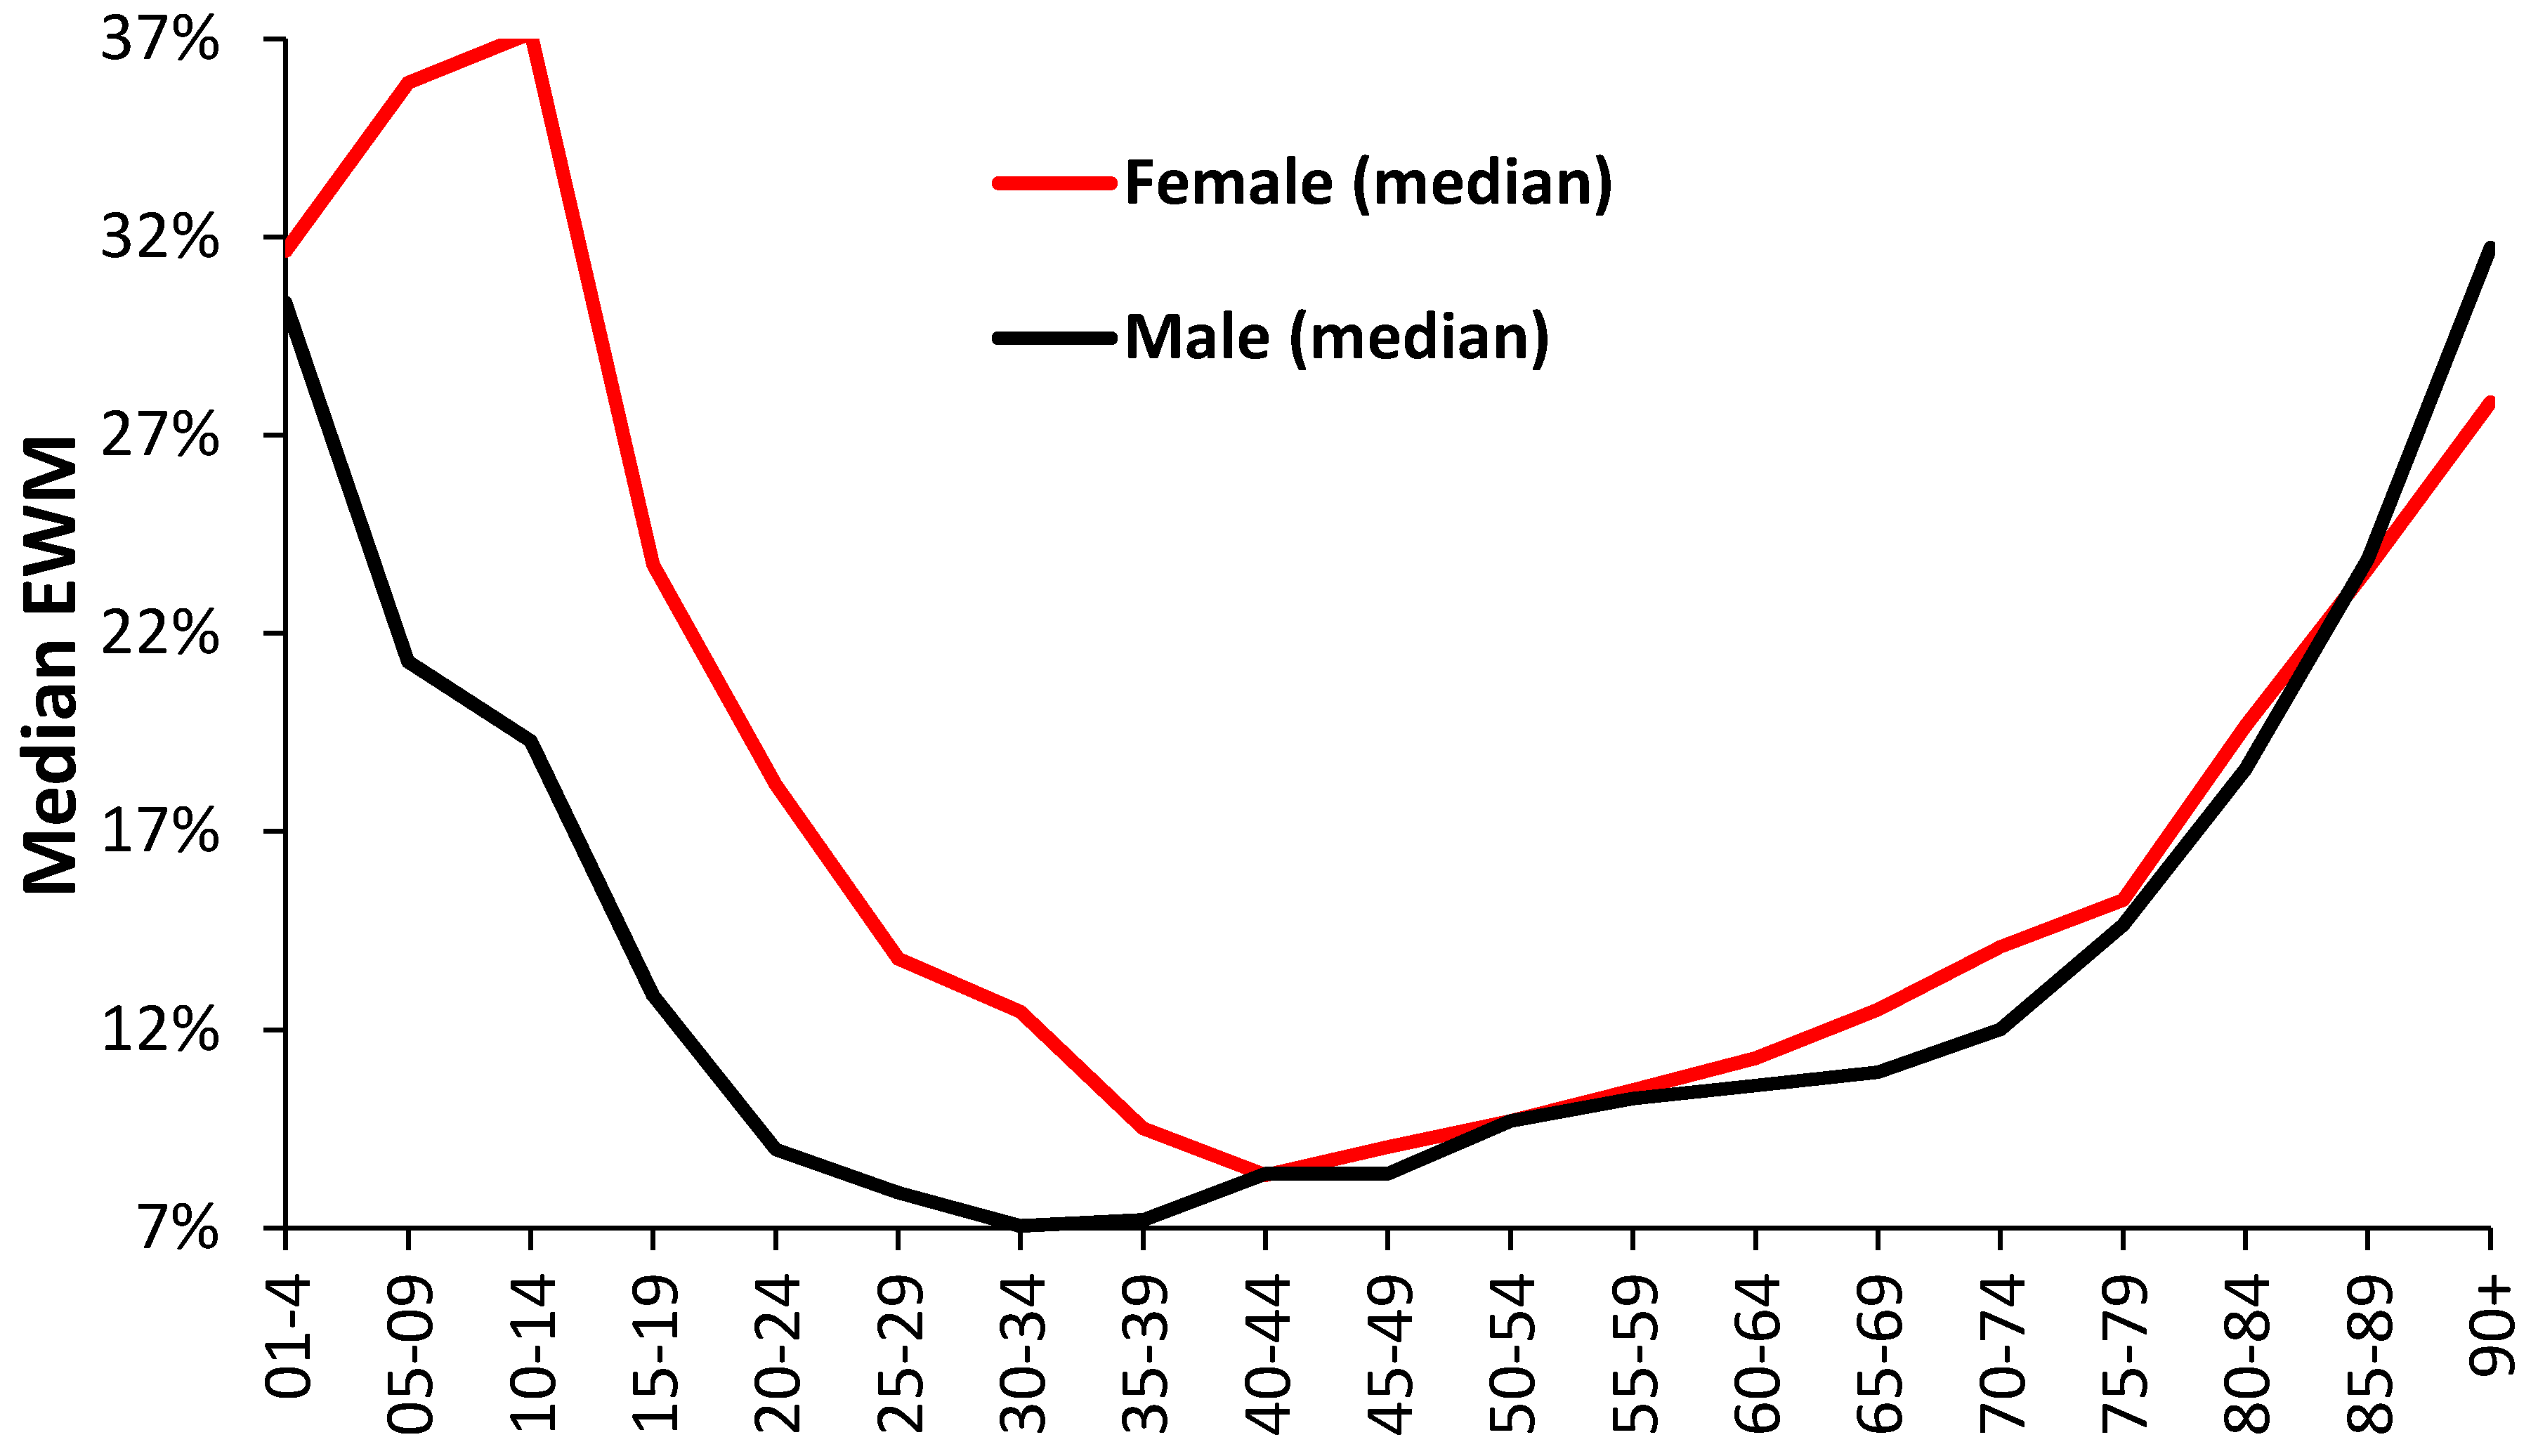
Roles for age and gender have been recognized for some time. For example, in New Zealand the young and elderly were recognized to experience higher EWM, while females had 9% higher EWM than males [
39]. This study has gone beyond broad age bands, as in
Table 1, and explored the effect of age using 5-year age bands by gender (
Figure 4 and
Figure 5). One of the key observations is for extremely high female EWM around the age of puberty (age 10–14) which requires more detailed examination by cause of death. However, for adults EWM increases above age 45 and keeps rising with age.
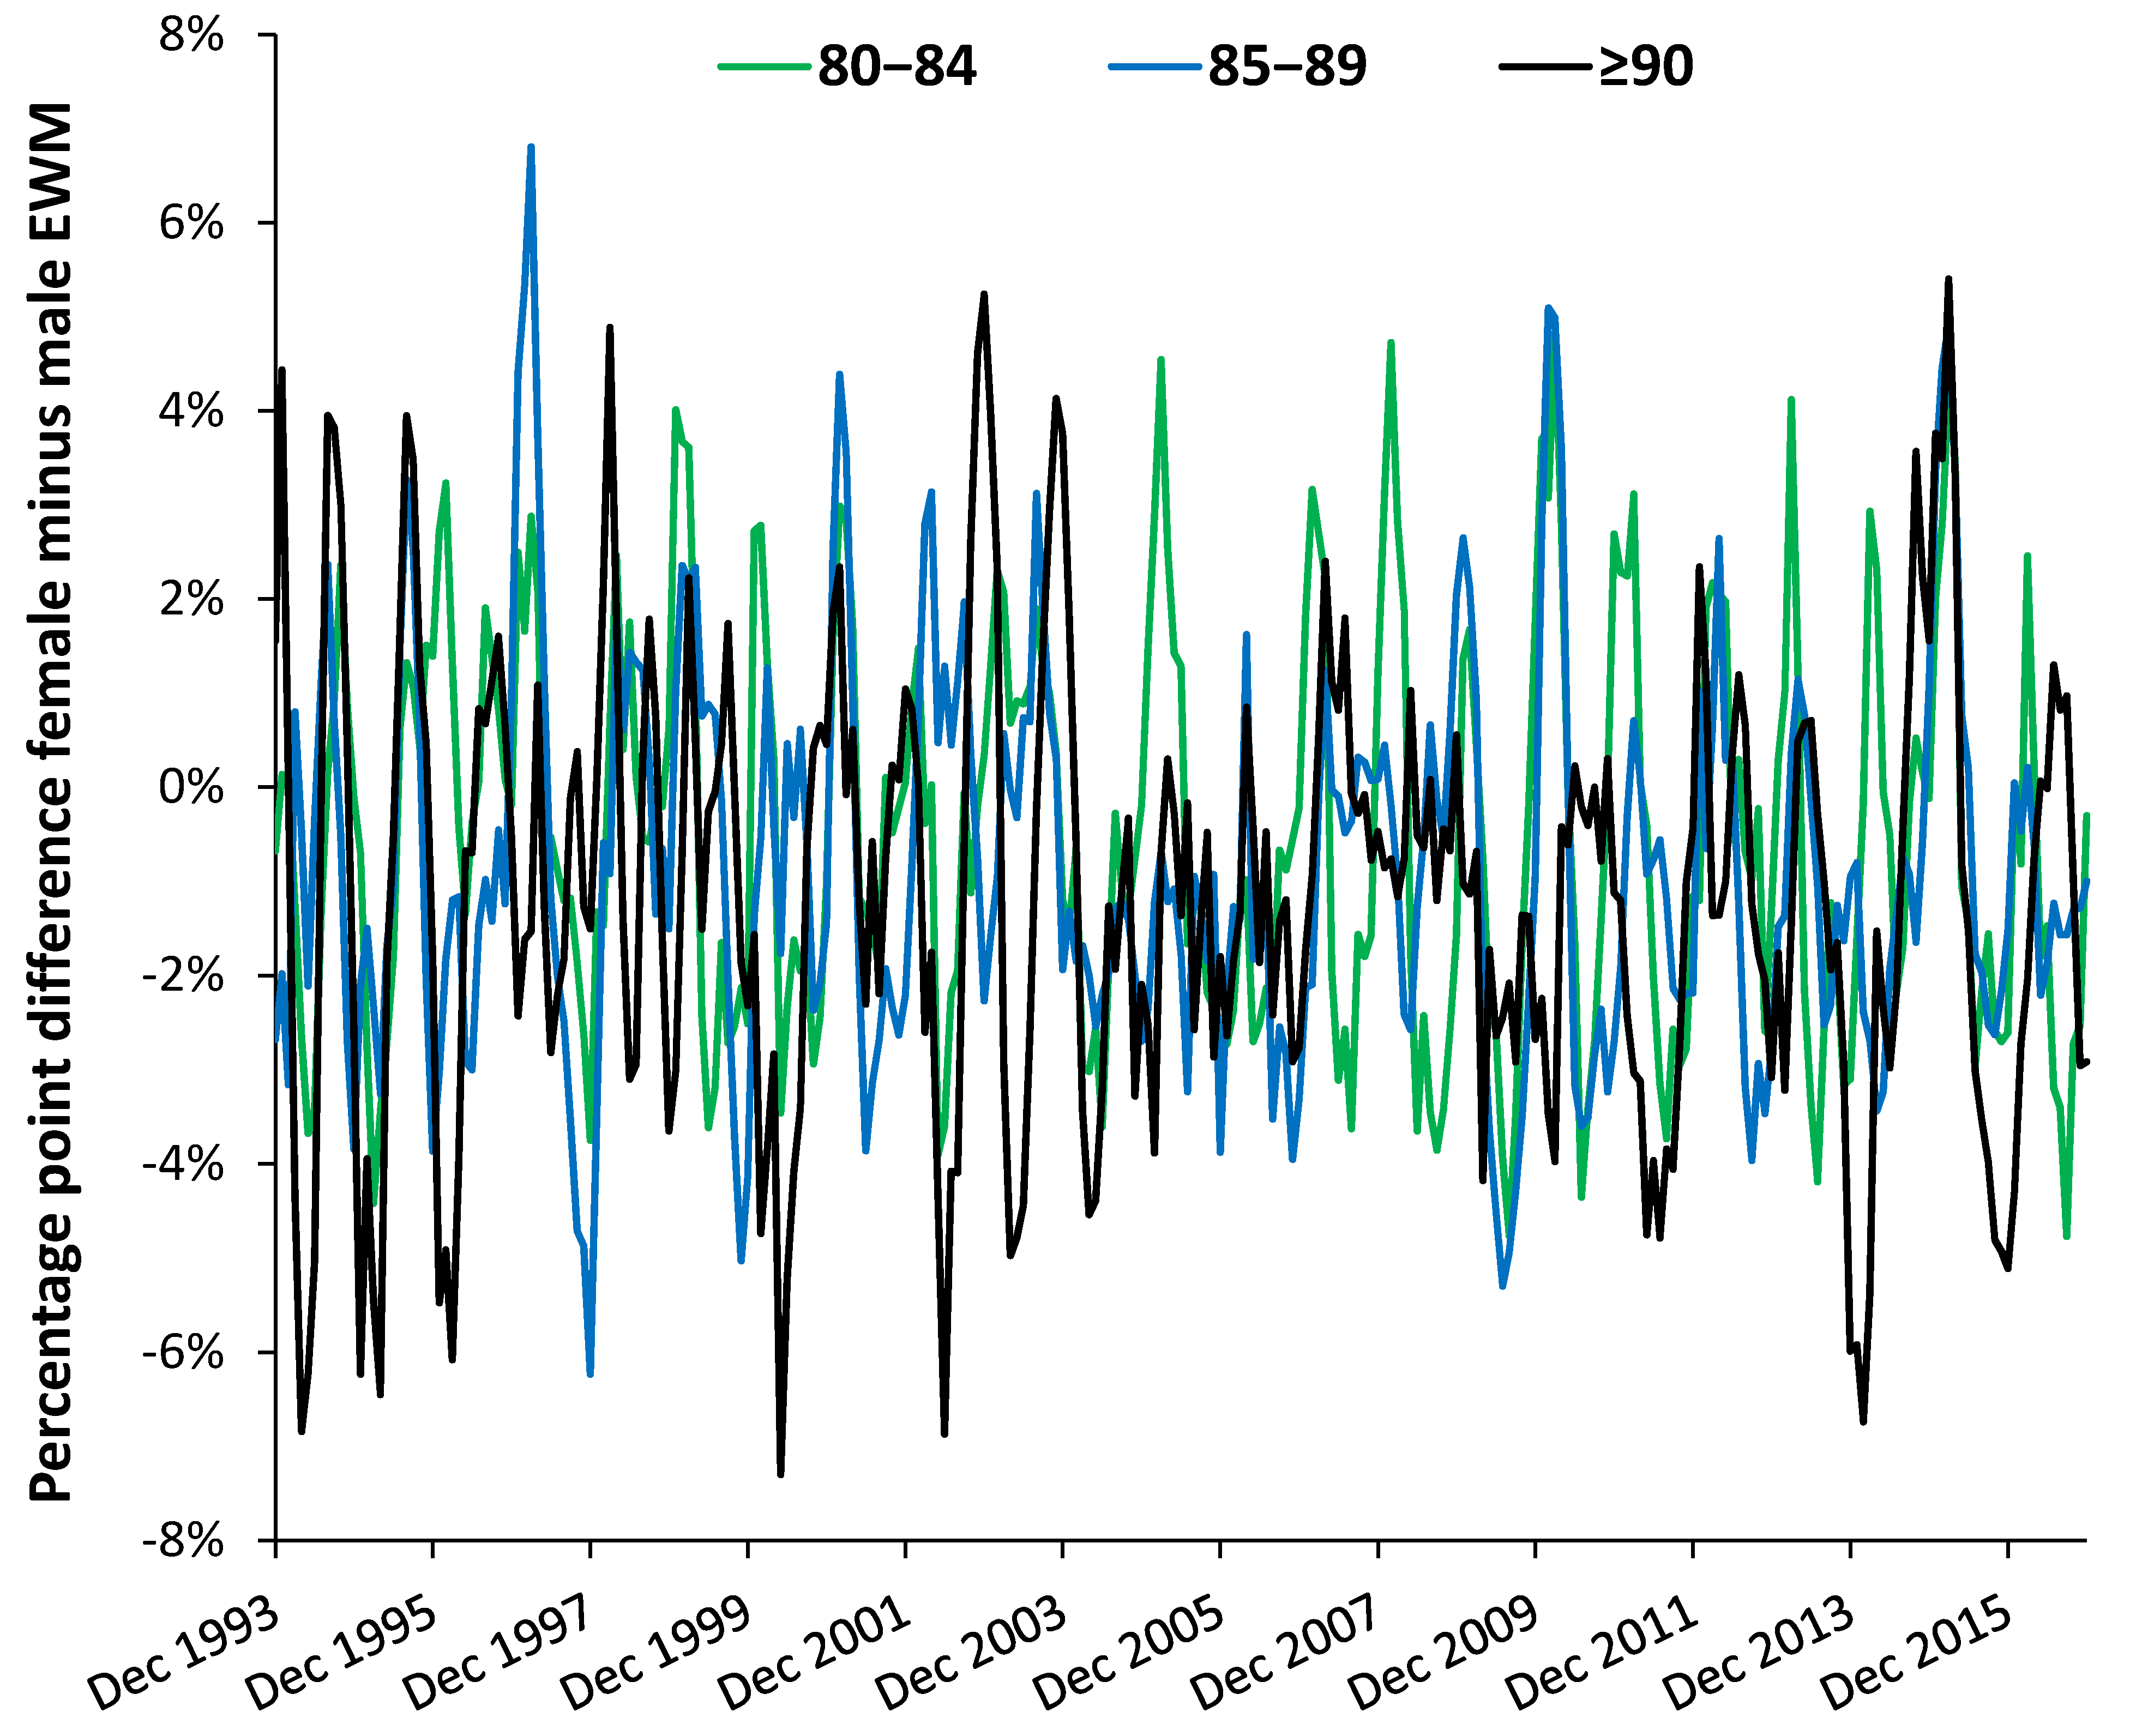
The difference between females and males by age band (
Figure 5) reveals complex time trends which are discussed further in
Section 4.8 dealing with EWM and influenza. Evidence for curious trends/patterns due to gender have been reported for the costs of long-term conditions in the USA [
40], and more recently for admissions relating to a wide range of diagnoses [
25]. These have relevance to deaths by virtue of the nearness to death effect where hospital admissions and costs escalate in the last year of life. See
Section 4.7 and
Section 4.8. However, such curious trends are usually dismissed because they do not neatly fit with currently accepted notions of how health care trends are supposed to behave.
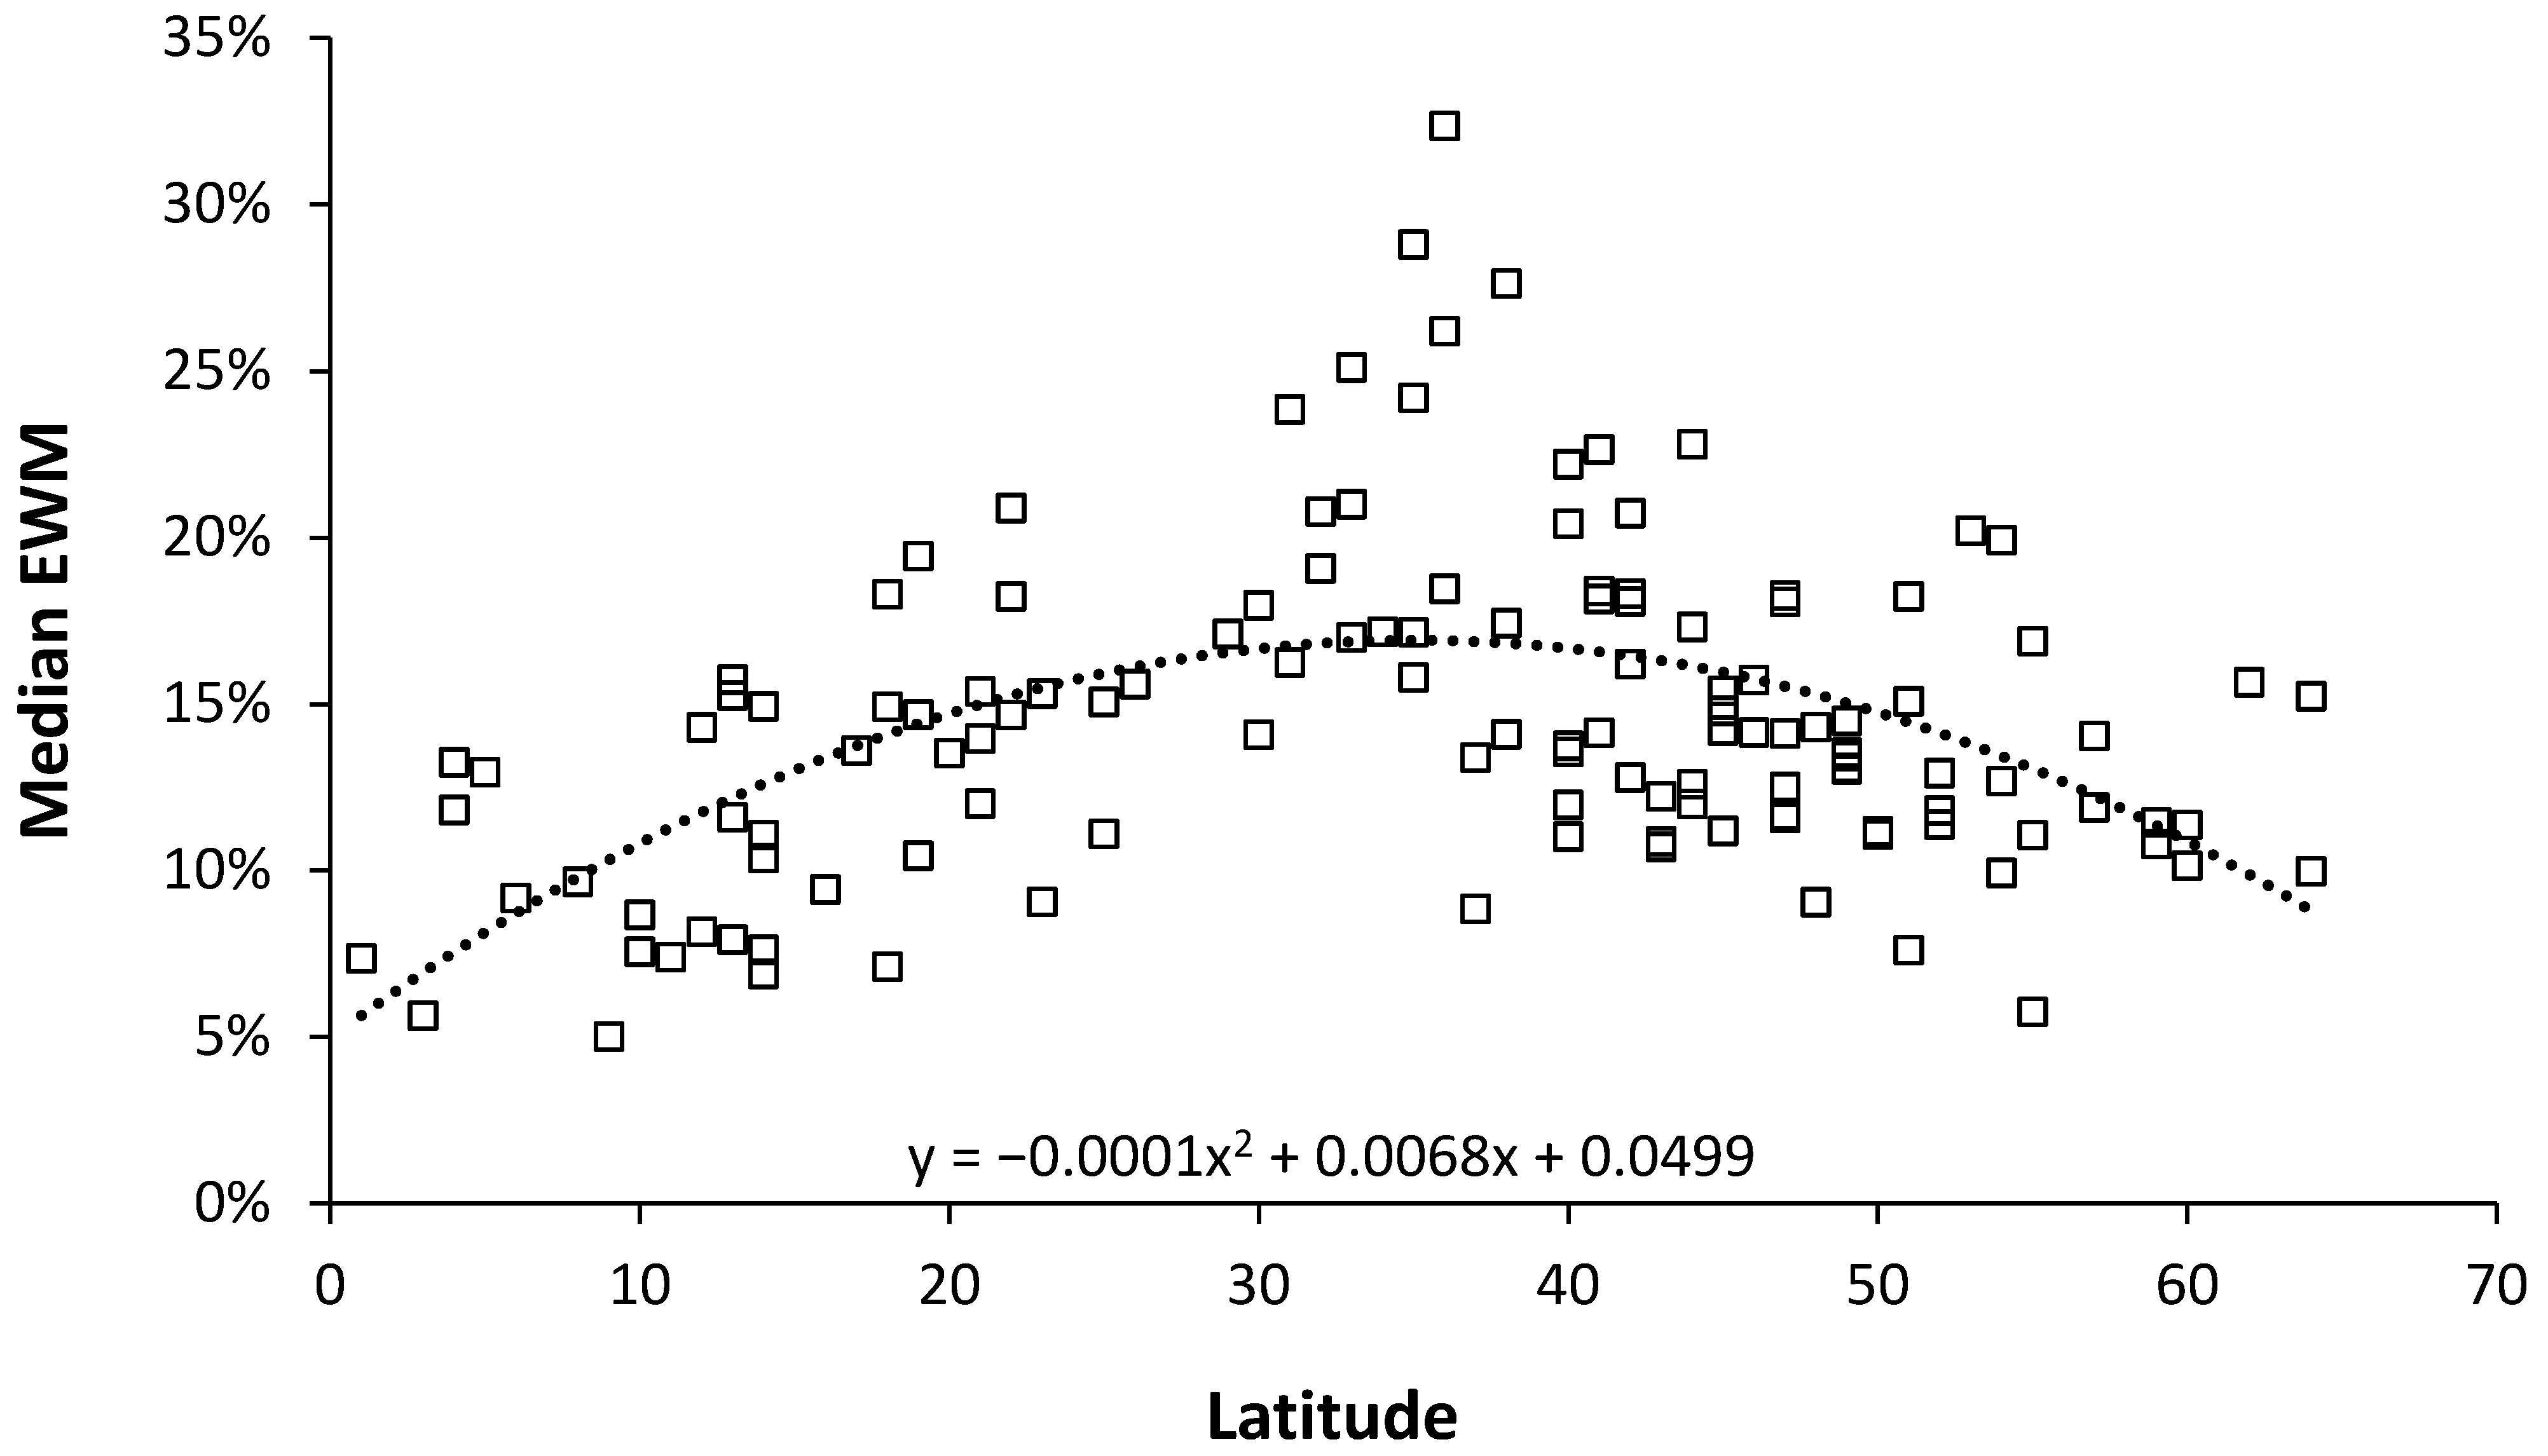
Clearly the distribution of age at death between different locations, and the changes in age at death overtime have the potential to modify the overall EWM figure. Calculation by the author shows that the ageing population does not make a huge contribution to EWM trends.
4.5. Location and Area Deprivation
Regional differences in cold-related risk are known to occur [
27]. In New Zealand regional differences in EWM were minimal [
39], although are higher in Portugal [
37] mainly due to the ability to afford winter heating. EWM and cost of heating were also linked in the US [
2,
8]. There is almost universal agreement that housing standards make the greatest contribution to
average EWM [
3,
4,
37,
38], followed by the ability to pay for heating [
2,
3,
8,
10,
37]. The same also holds for winter hospital admission rates [
10].
Slight regional differences were observed in
Table 2 between the maximum EWM, the volatility in the EWM (as a standard deviation), and the timing of maximum EWM. Spread of infectious agents such as influenza(s) looks likely. Similar timing differences were seen in
Table 3 which grouped areas in England and Wales by deprivation decile. Similar timing differences have been observed between US and German states and UK local authorities [
25,
26,
41].
In the UK, a winter fuel payment was introduced in 1997 to all persons of pension age [
42]. A structural break in the EWM time series in the UK after the winter of 1999/00 was interpreted in one study to be due to the winter fuel payment [
43]. However, the timing of the structural break is slightly out with the timing of the fuel payments and the structural break at 1999/00 also holds more widely around the world [
6] and was due to a drop-in influenza activity. Hence, the winter fuel payment may not have made a substantial impact on EWM.
The lack of a relationship between EWM and area deprivation score in
Table 3 is consistent with other observations that deprivation per se does not play a role in EWM [
11,
39]. This is possibly because in the UK persons receiving social security payments tend to live in social housing which has higher building standards that many owner-occupied or private rented properties [
44].
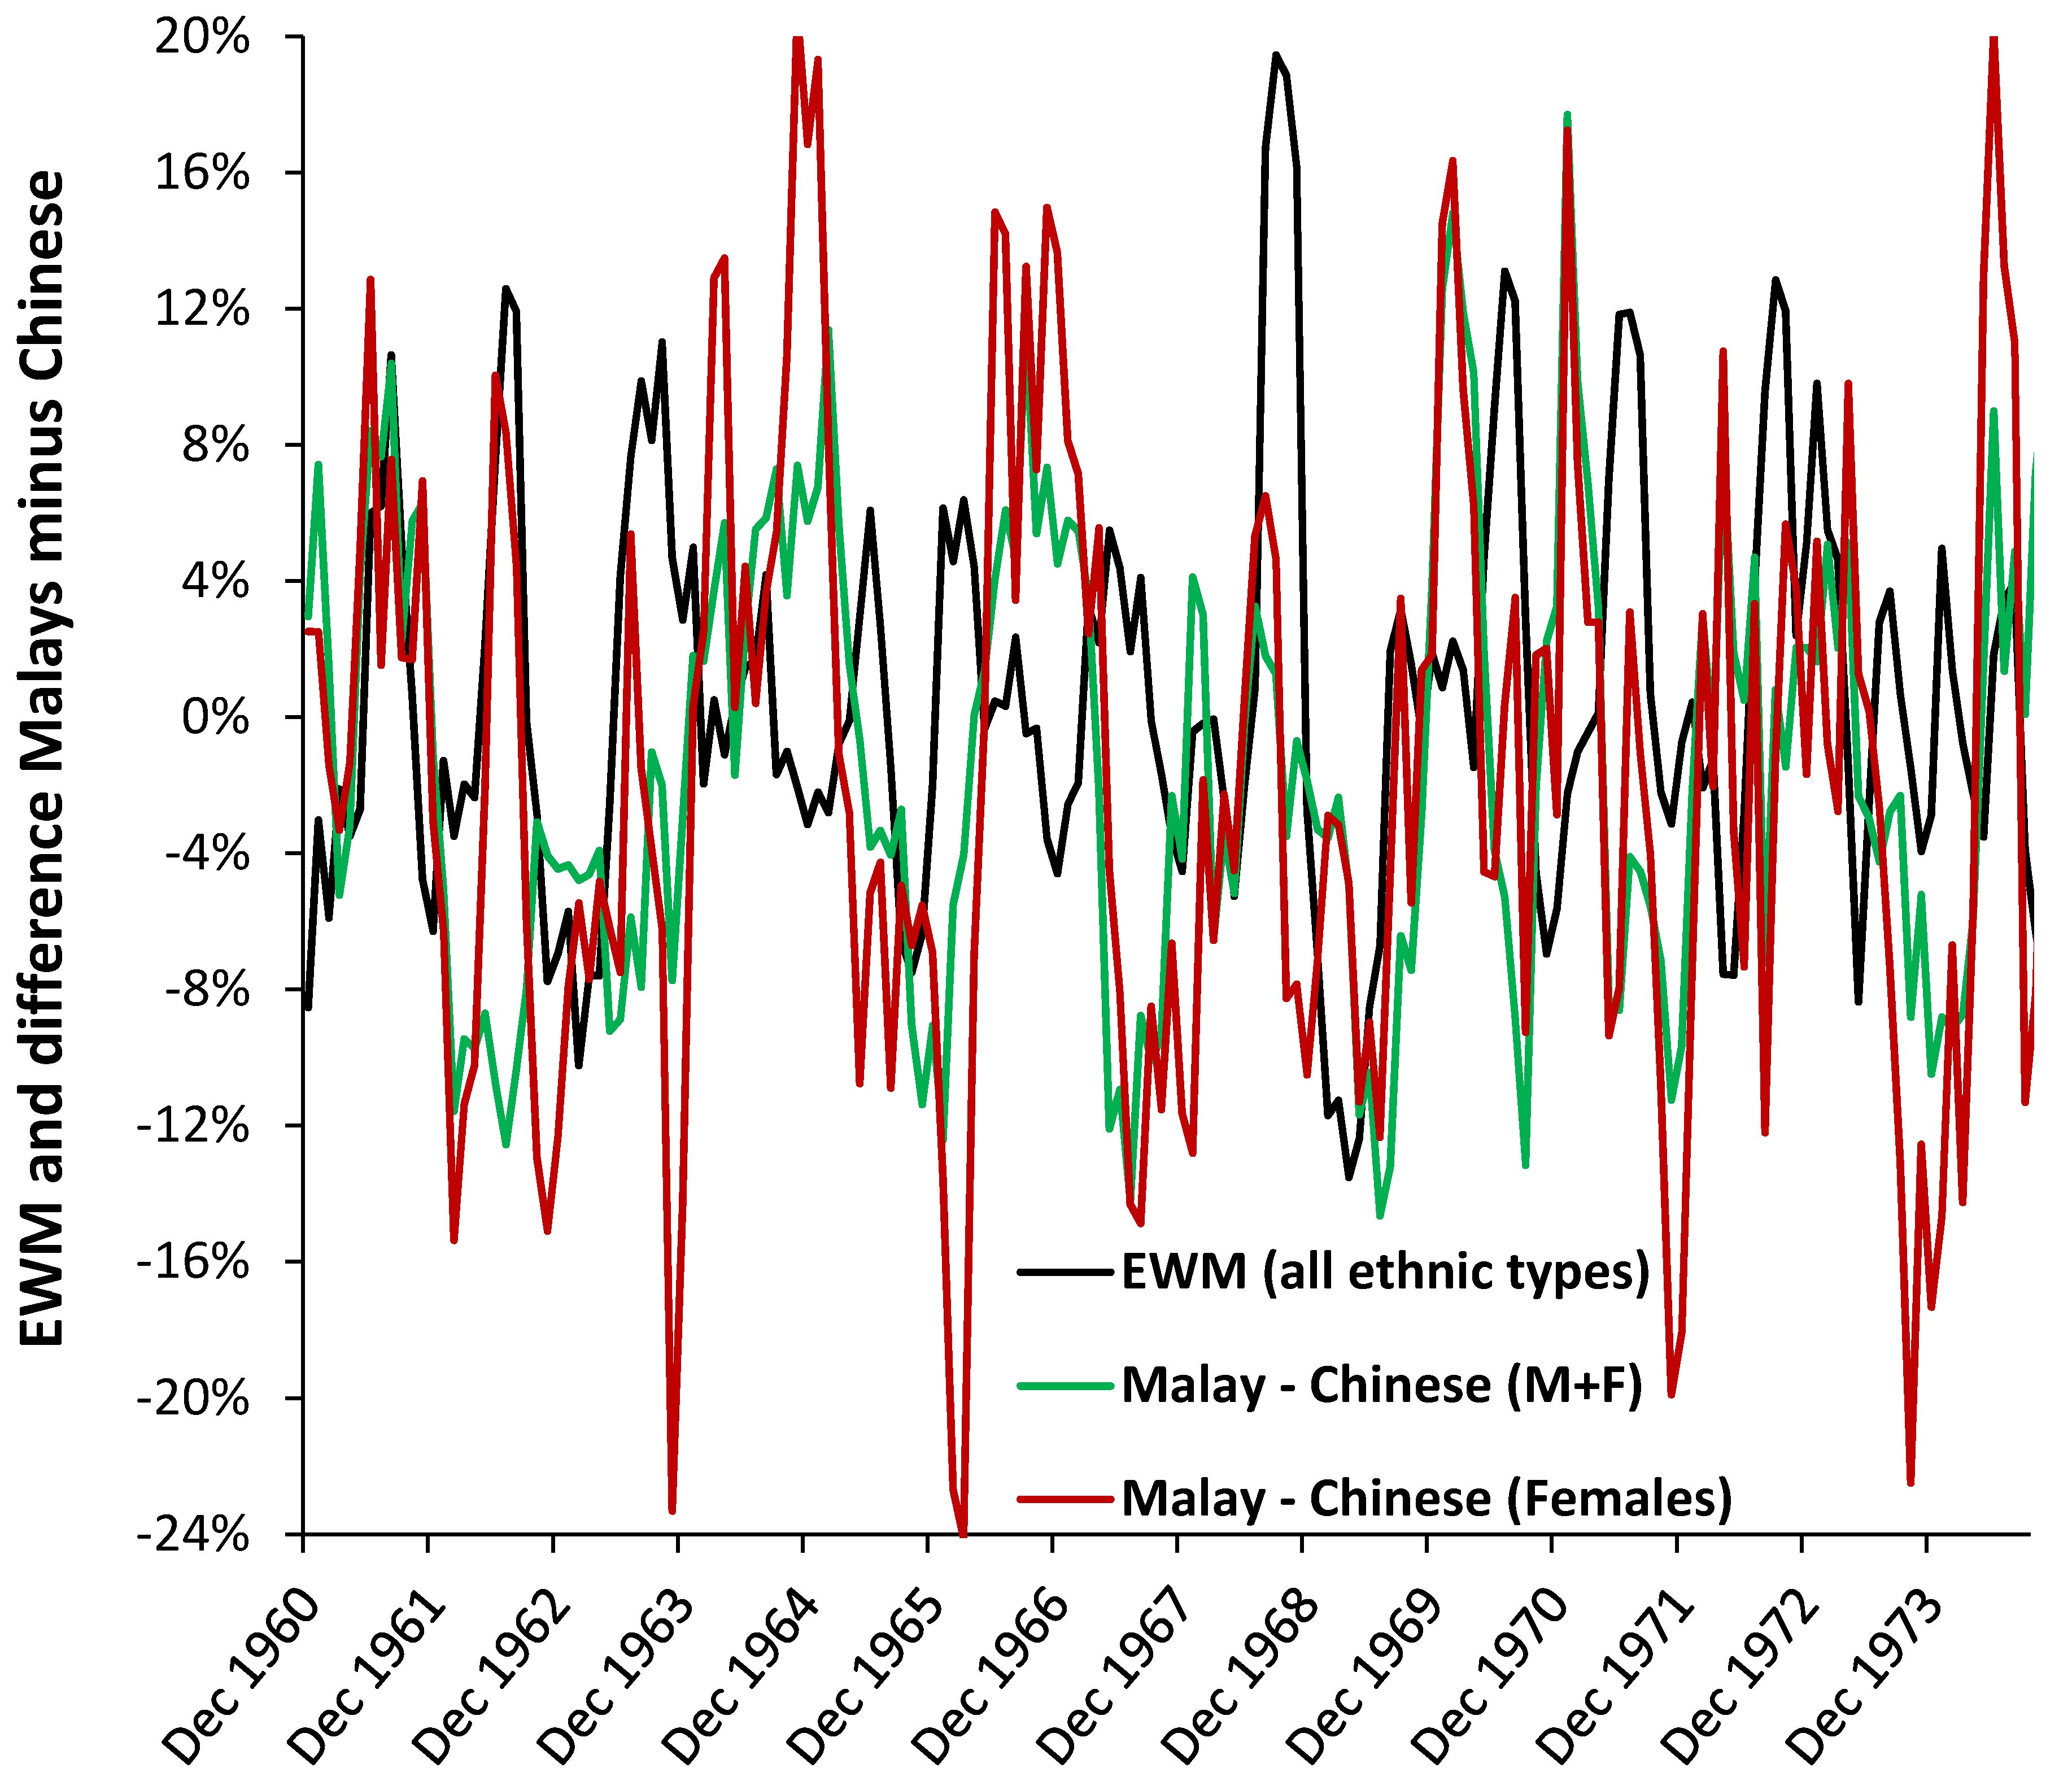
4.6. Ethnicity
Ethnicity is not widely studied in EWM. A study in New Zealand concluded that there was no difference [
39]. The study based on data for Singapore therefore gives useful insight into the role of ethnicity in the influenza-related part of EWM.
Figure 6 focusses on the gender differences concealed in the rolling EWM trends. The black EWM line presents the raw EWM trend, the green line shows the difference between Malays and Chinese, while the red line shows the difference between Malays and Chines for females alone. The date range 1960 to 1974 was chosen to allow the trends to become clearer to view.
These subtle differences in magnitude and timing would otherwise go unnoticed. Influenza is not the only pathogen affecting human health and the trends will be the composite picture of the interaction between all pathogens, which will have a more tropical disease emphasis in Singapore.
Over many years life expectancy of Chinese has always been highest, while that of Malays has remained lowest [
45]. These are probably reflected in income and socioeconomic situation. The Malays could therefore be assumed to experience a higher burden of infectious diseases, although the types may vary between the two groups.
More research is needed to determine if this is due to ethnicity or socioeconomic position. However, the male female differences do appear to be important.
4.8. EWM and Influenza
There are only three primary reasons for EWM to vary each year in different countries, namely, temperature per se, temperature fluctuations (cold snaps) and winter infectious outbreaks of which influenza is a key pathogen. Periods of cold dry air are known to elevate both pneumonia and influenza mortality [
48].
Figure 9 has demonstrated roles for influenza outbreaks in the variation of EWM. After the Hong Kong flu (H3N2) had struck Singapore, two variants had emerged which then infected Europe and the North Americas [
49], and this may explain why Singapore showed such a large earlier response. The effect of influenza epidemics/pandemics seems to entirely depend on the degree of antigenic similarity to similar strains which the elderly has been exposed during childhood and through life [
50,
51]. Hence, changes in influenza strains, vaccine effectiveness and proportion of elderly vaccinated should all interact with temperature to change the magnitude of EWM.
The joint role of influenza and temperature can be illustrated in England and Wales during the winter of 1950/51 when EWM rose to 68.2% in males and 70.7% in females in March 1951 (authors calculation). The winter of 1950/51 was the coldest in 100 years and was experienced across most of the Northern Hemisphere [
52]. This winter was so ferocious that military operations during the Korean war were substantially affected [
53]. This winter also involved a substantial outbreak of influenza A(H1N1) [
54].
Recall that in the 1950s most homes in the UK did not have central heating and insulation was almost absent. Heating was from coal fires which would have created additional lung irritation. However, the principle has been established that extreme cold plus influenza leads to substantial elevation in EWM. A study in France showed that age 75+, resident in a nursing home, monthly minimum temperature, and influenza activity (as influenza-like-illness) gave good prediction of EWM [
46].
In the US, the peak months of mortality for ischemic heart disease, cerebrovascular disease, and diabetes mellitus coincided with peaks in pneumonia and influenza. The magnitude of the seasonal component was highly correlated with measures of excess mortality and was significantly larger in seasons dominated by influenza A(H2N2) and A(H3N2) viruses than in seasons dominated by A(H1N1) or B viruses [
55].
There was an age shift in mortality during and after the 1968/69 pandemic in each disease class, with features specific to influenza A(H3N2) [
55]. This study demonstrated that there were increases in the proportion of excess pneumonia and influenza mortality that occurred in the younger age group (<75 years) during the 1968/69 pandemic year. The magnitude of the age shift decreased steadily until 1975/76, after which time the age shift appeared to be independent of the circulating influenza virus type but continued to move toward older age groups [
55]. This is highly relevant to shifts in EWM discussed in the
Section 4.9.
In Portugal, influenza has also been associated with higher EWM [
56]. Approximately 90% all-cause deaths in the winter were for those aged 65+. Excess mortality was 3–6 fold higher during seasons dominated by the A(H3N2) subtype than seasons dominated by A(H1N1)/B. High excess mortality impact was also seen in children under the age of four years. Seasonal excess mortality rates from cerebrovascular diseases, ischemic heart diseases, diseases of the respiratory system, and chronic respiratory diseases, were highly correlated with each other and with seasonal rates of influenza-like-illness (ILI) among those aged 65+ [
56].
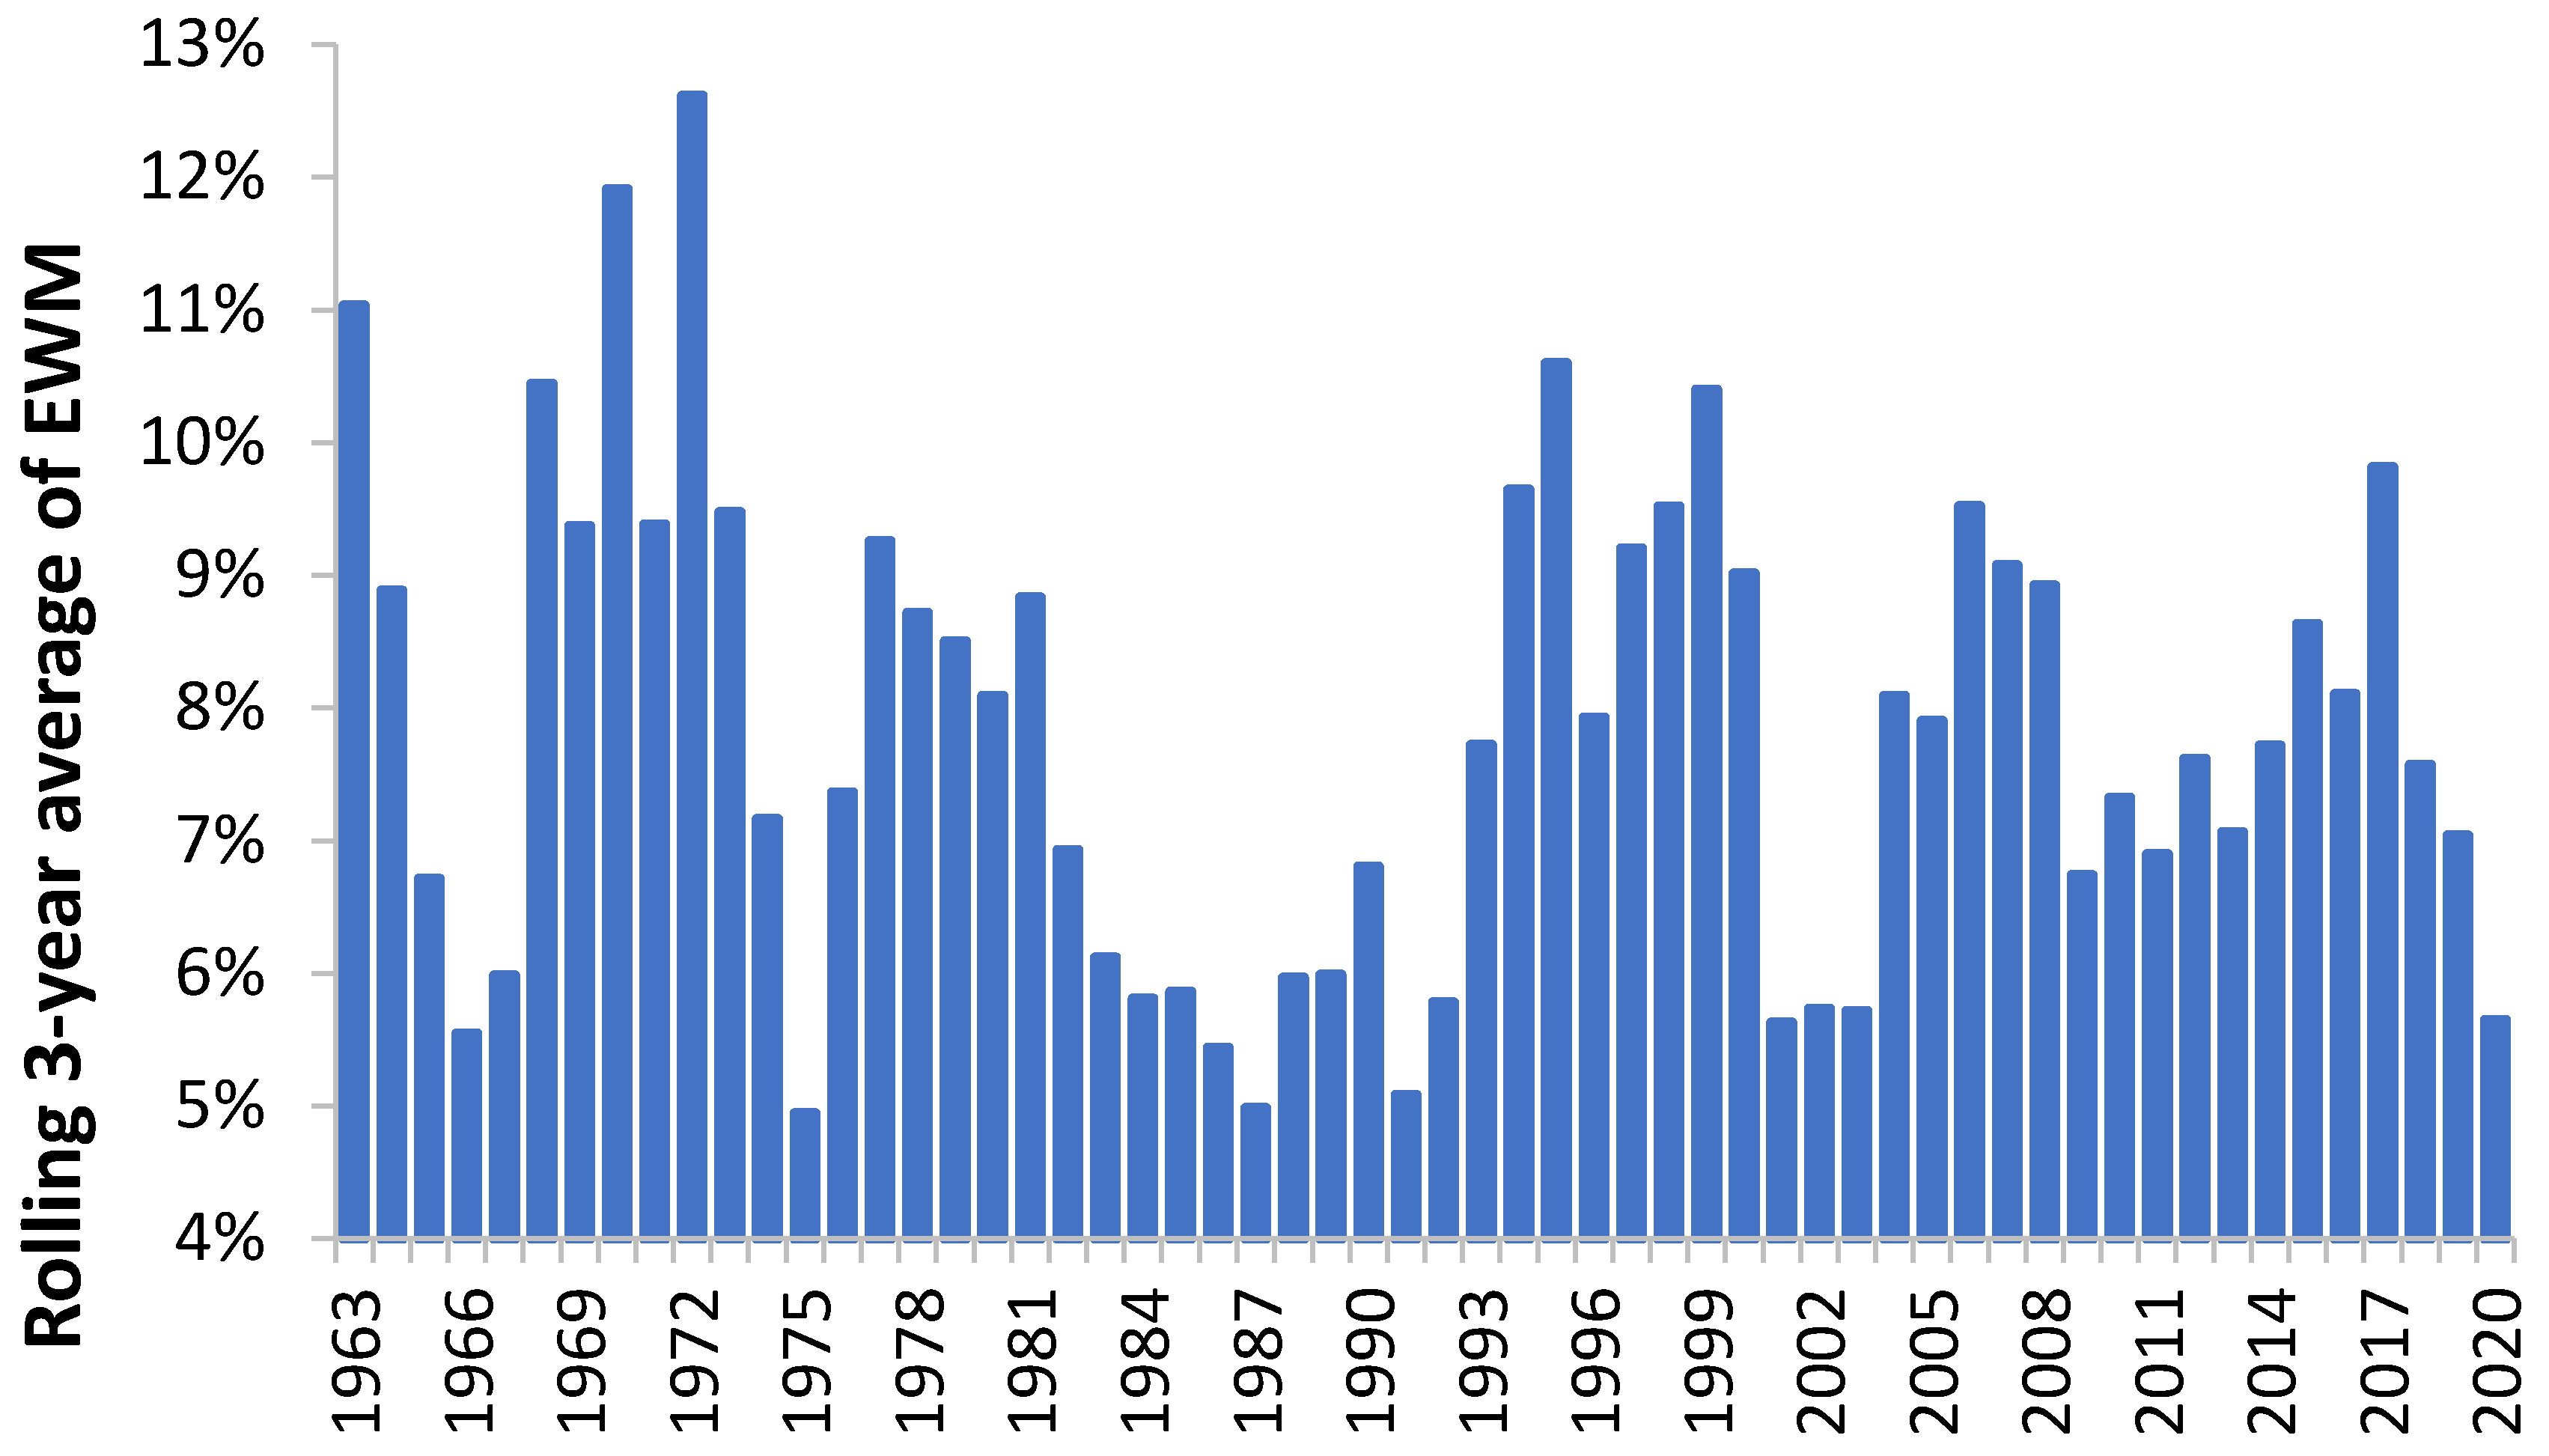
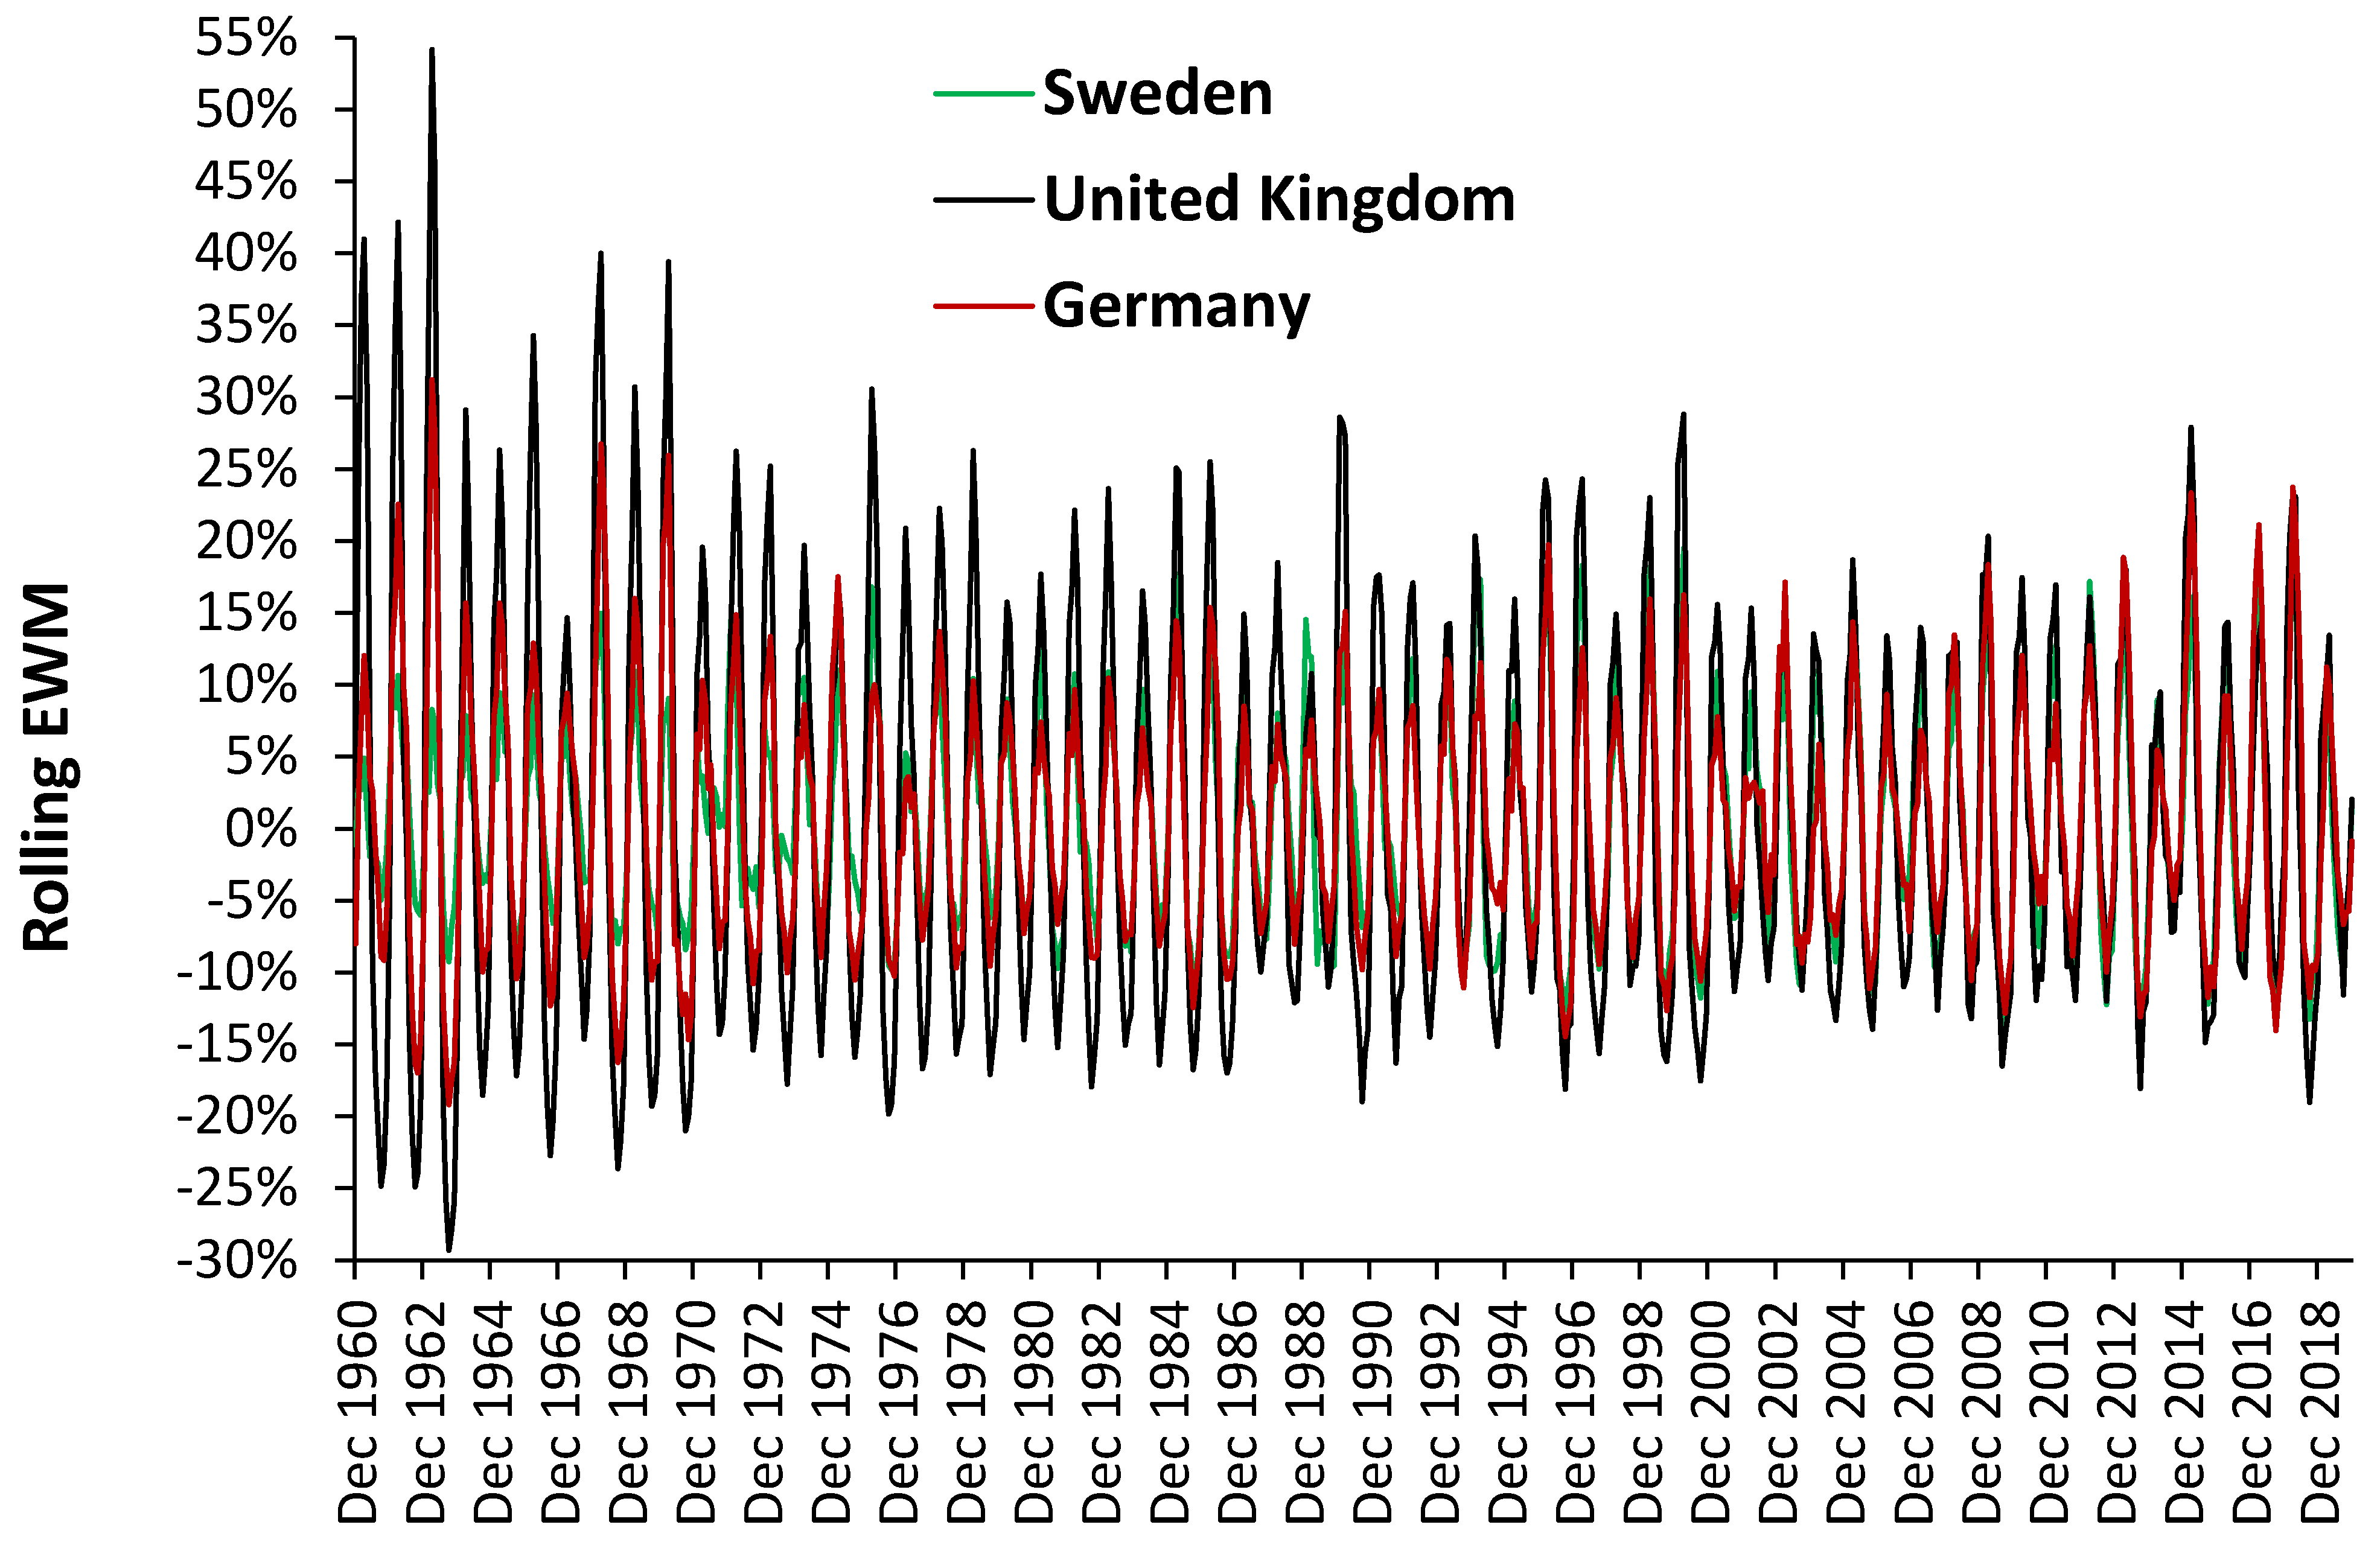
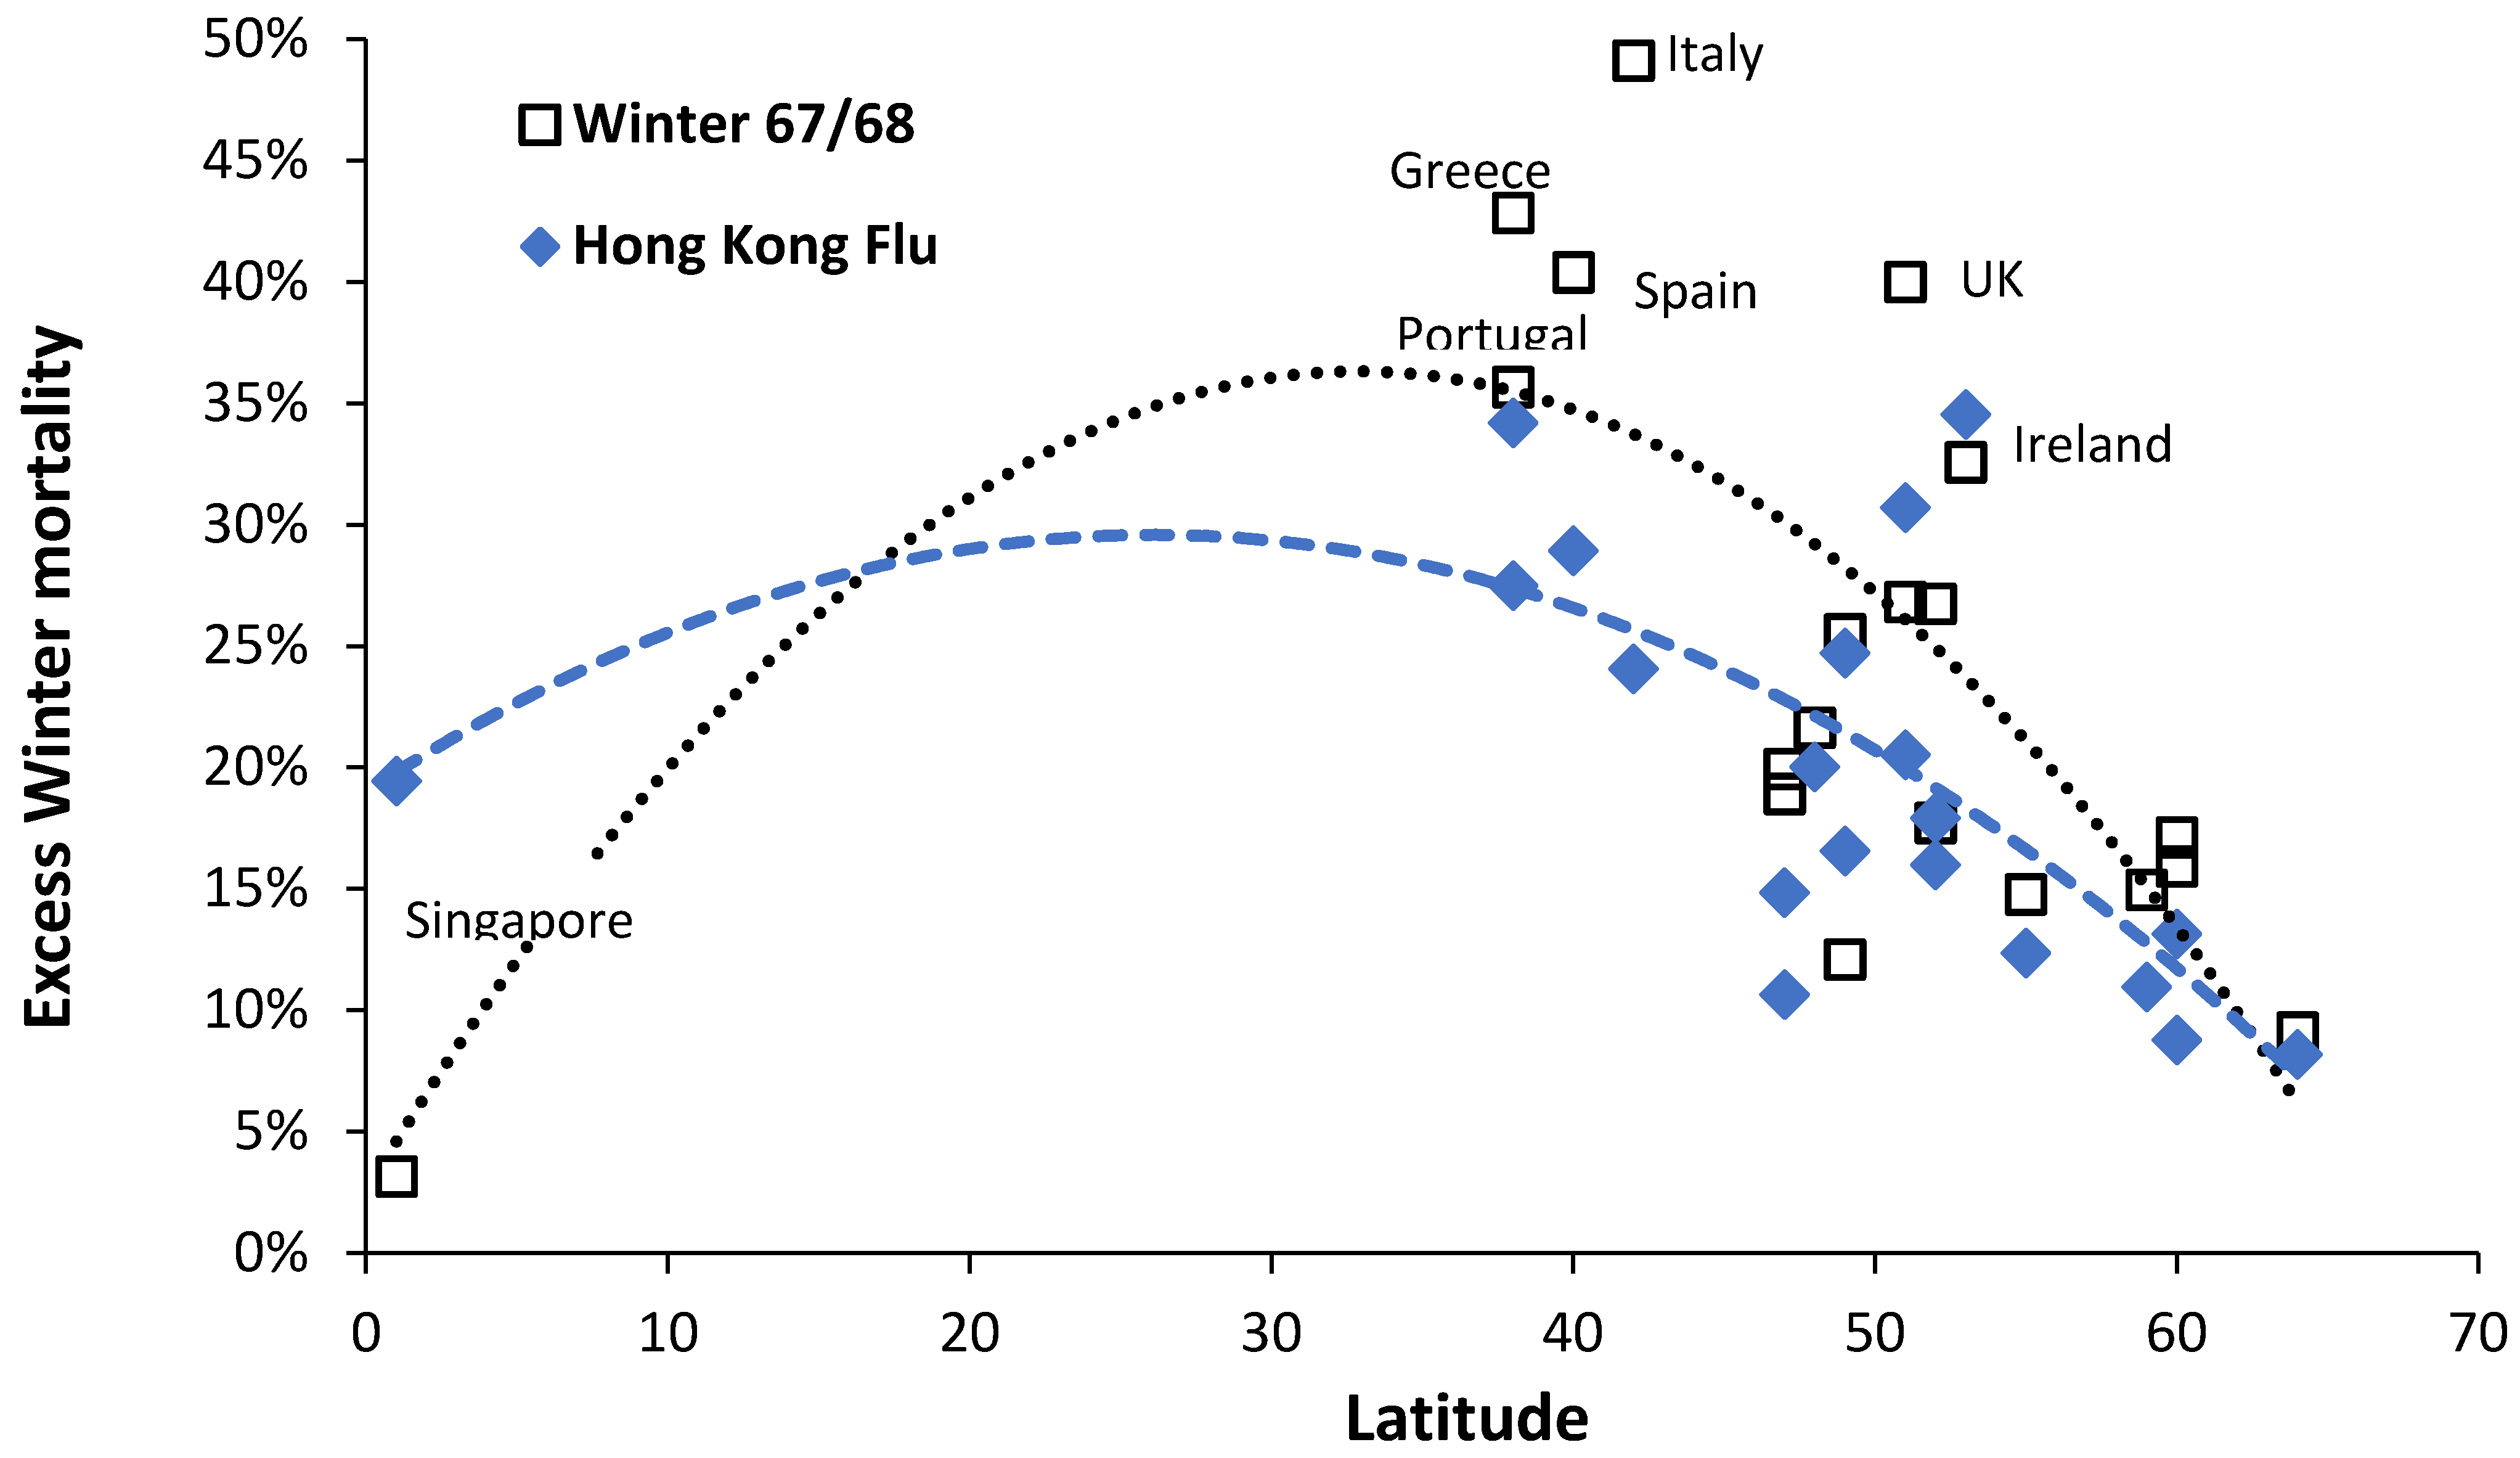
Singapore therefore provides a useful benchmark into the role of influenza in the absence of winter cold. Apart from a 19% value for EWM during the Hong Kong flu, maximum EWM has never risen above 12% to 13% from 1960 through to 2020 (13% in July-62 and August-06, and 12% in June-97 and August-17), and the median value is only 7%.
Subtracting EWM in Singapore from EWM in the UK yields a 28% (percentage point) gap during the Hong Kong flu, 21% in the winter of 1999/00, 19% in 2017/18 down to 1% in 2005/06. The actual mix of strains and variants between the two will differ but cold seems to play a far greater role in the UK. This was the somewhat disputed conclusion of Donaldson and Keating in 2002 [
57]. Winter humidity and rainfall were also associated with EWM across Europe [
4]. Clearly winter mortality from influenza is very much influenced by climate, which is exacerbated by home insulation standards and the ability to maintain a suitable temperature. Such a notion is supported by the study of Laake and Sverre [
38], who concluded that the gap between the UK and Norway was due to temperature (and its implications in less well insulated homes) and not influenza per se for those aged 65+.
There is one exception which was pointed out in a study of EWM in France, namely, residents of nursing homes [
46]. Nursing homes are universally kept warm during the winter, yet the residents were observed to suffer highest EWM. This is probably a reflection of the phenomena called the nearness to death effect (NTD), where rapid decline in health generally occurs in the last year of life discussed in [
25,
26]. This possibility was confirmed in
Table 6 where care home residents have almost double the EWM of persons living at home. Higher EWM then occurs by frailty, other than for persons dying in hospice since the terminally ill will die on a more even annual basis, or places in hospices are limited which caps the extent of EWM. For care homes, winter is therefore about transmissible winter pathogens, rather than indoor temperature. The high EWM for other communal establishments, mainly student halls of residence and boarding schools—refer to
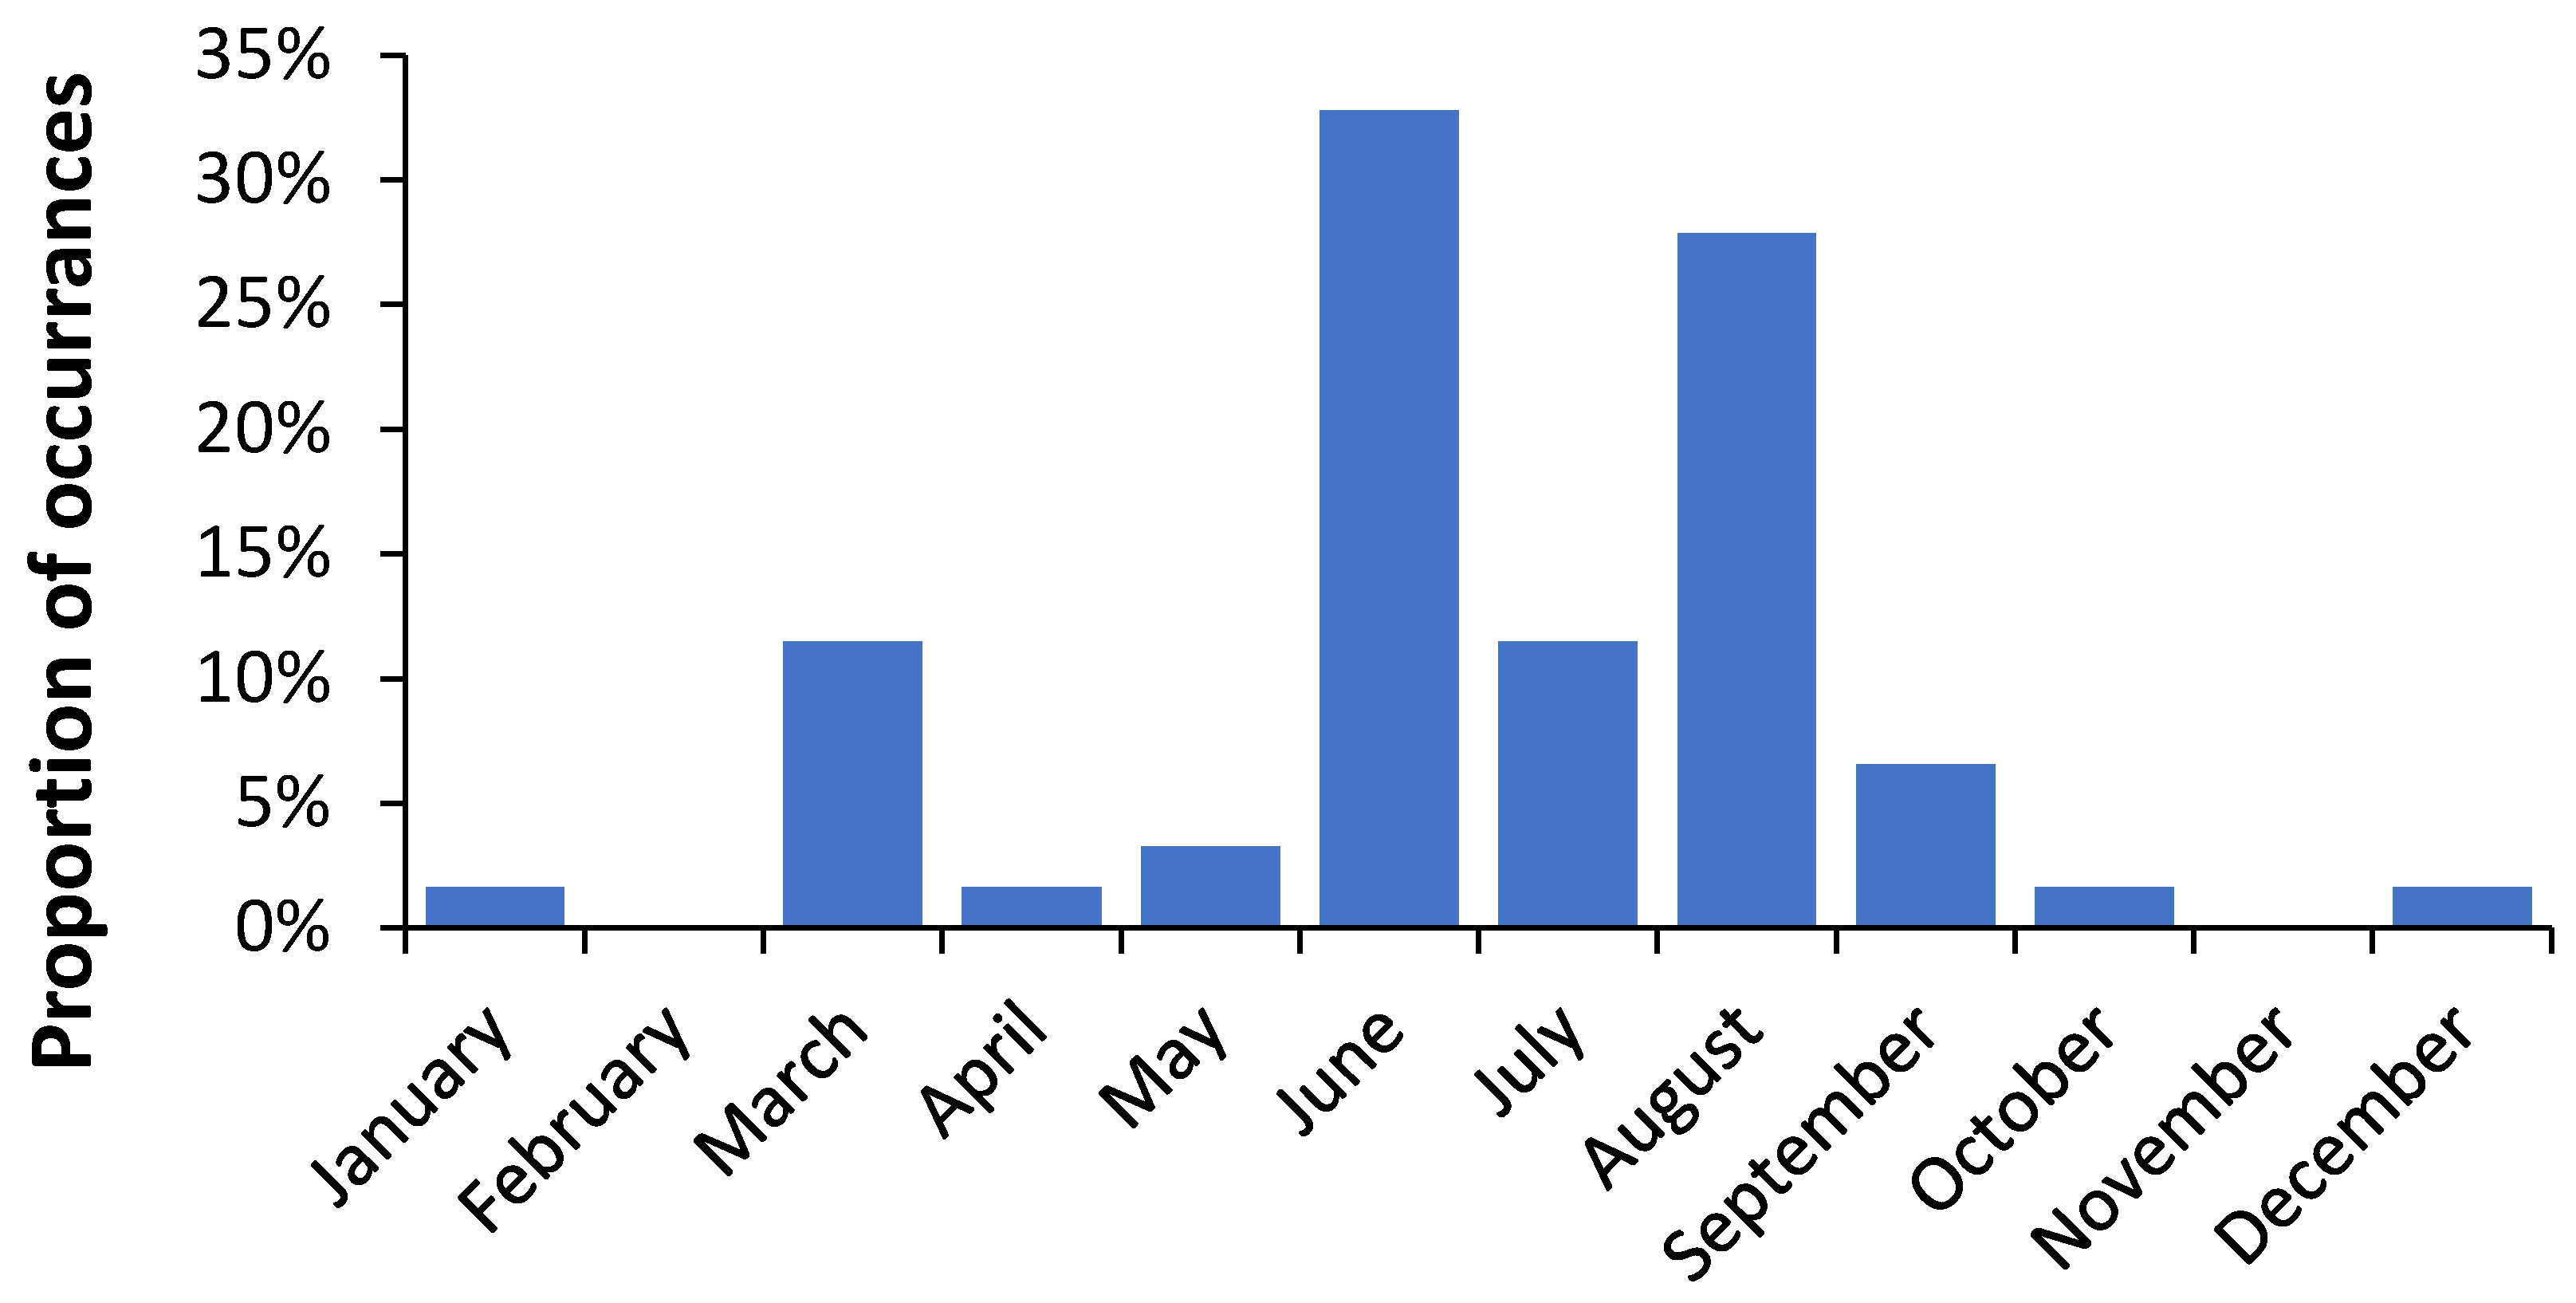
Figure 4 where adolescents have remarkably high EWM, seemingly due to traffic accidents and suicides which will peak in the winter [
58].
Under such circumstances it was proposed that influenza vaccination may lose its protective effect, and the nursing home residents will succumb to whichever pathogen they first encounter, presumably bought into the nursing home by staff or visitors. From
Table 6 it was observed that in England and Wales some 22% of all deaths occurred in a care home, and a significant proportion of the 47% of deaths in a hospital will also be persons from a care home.
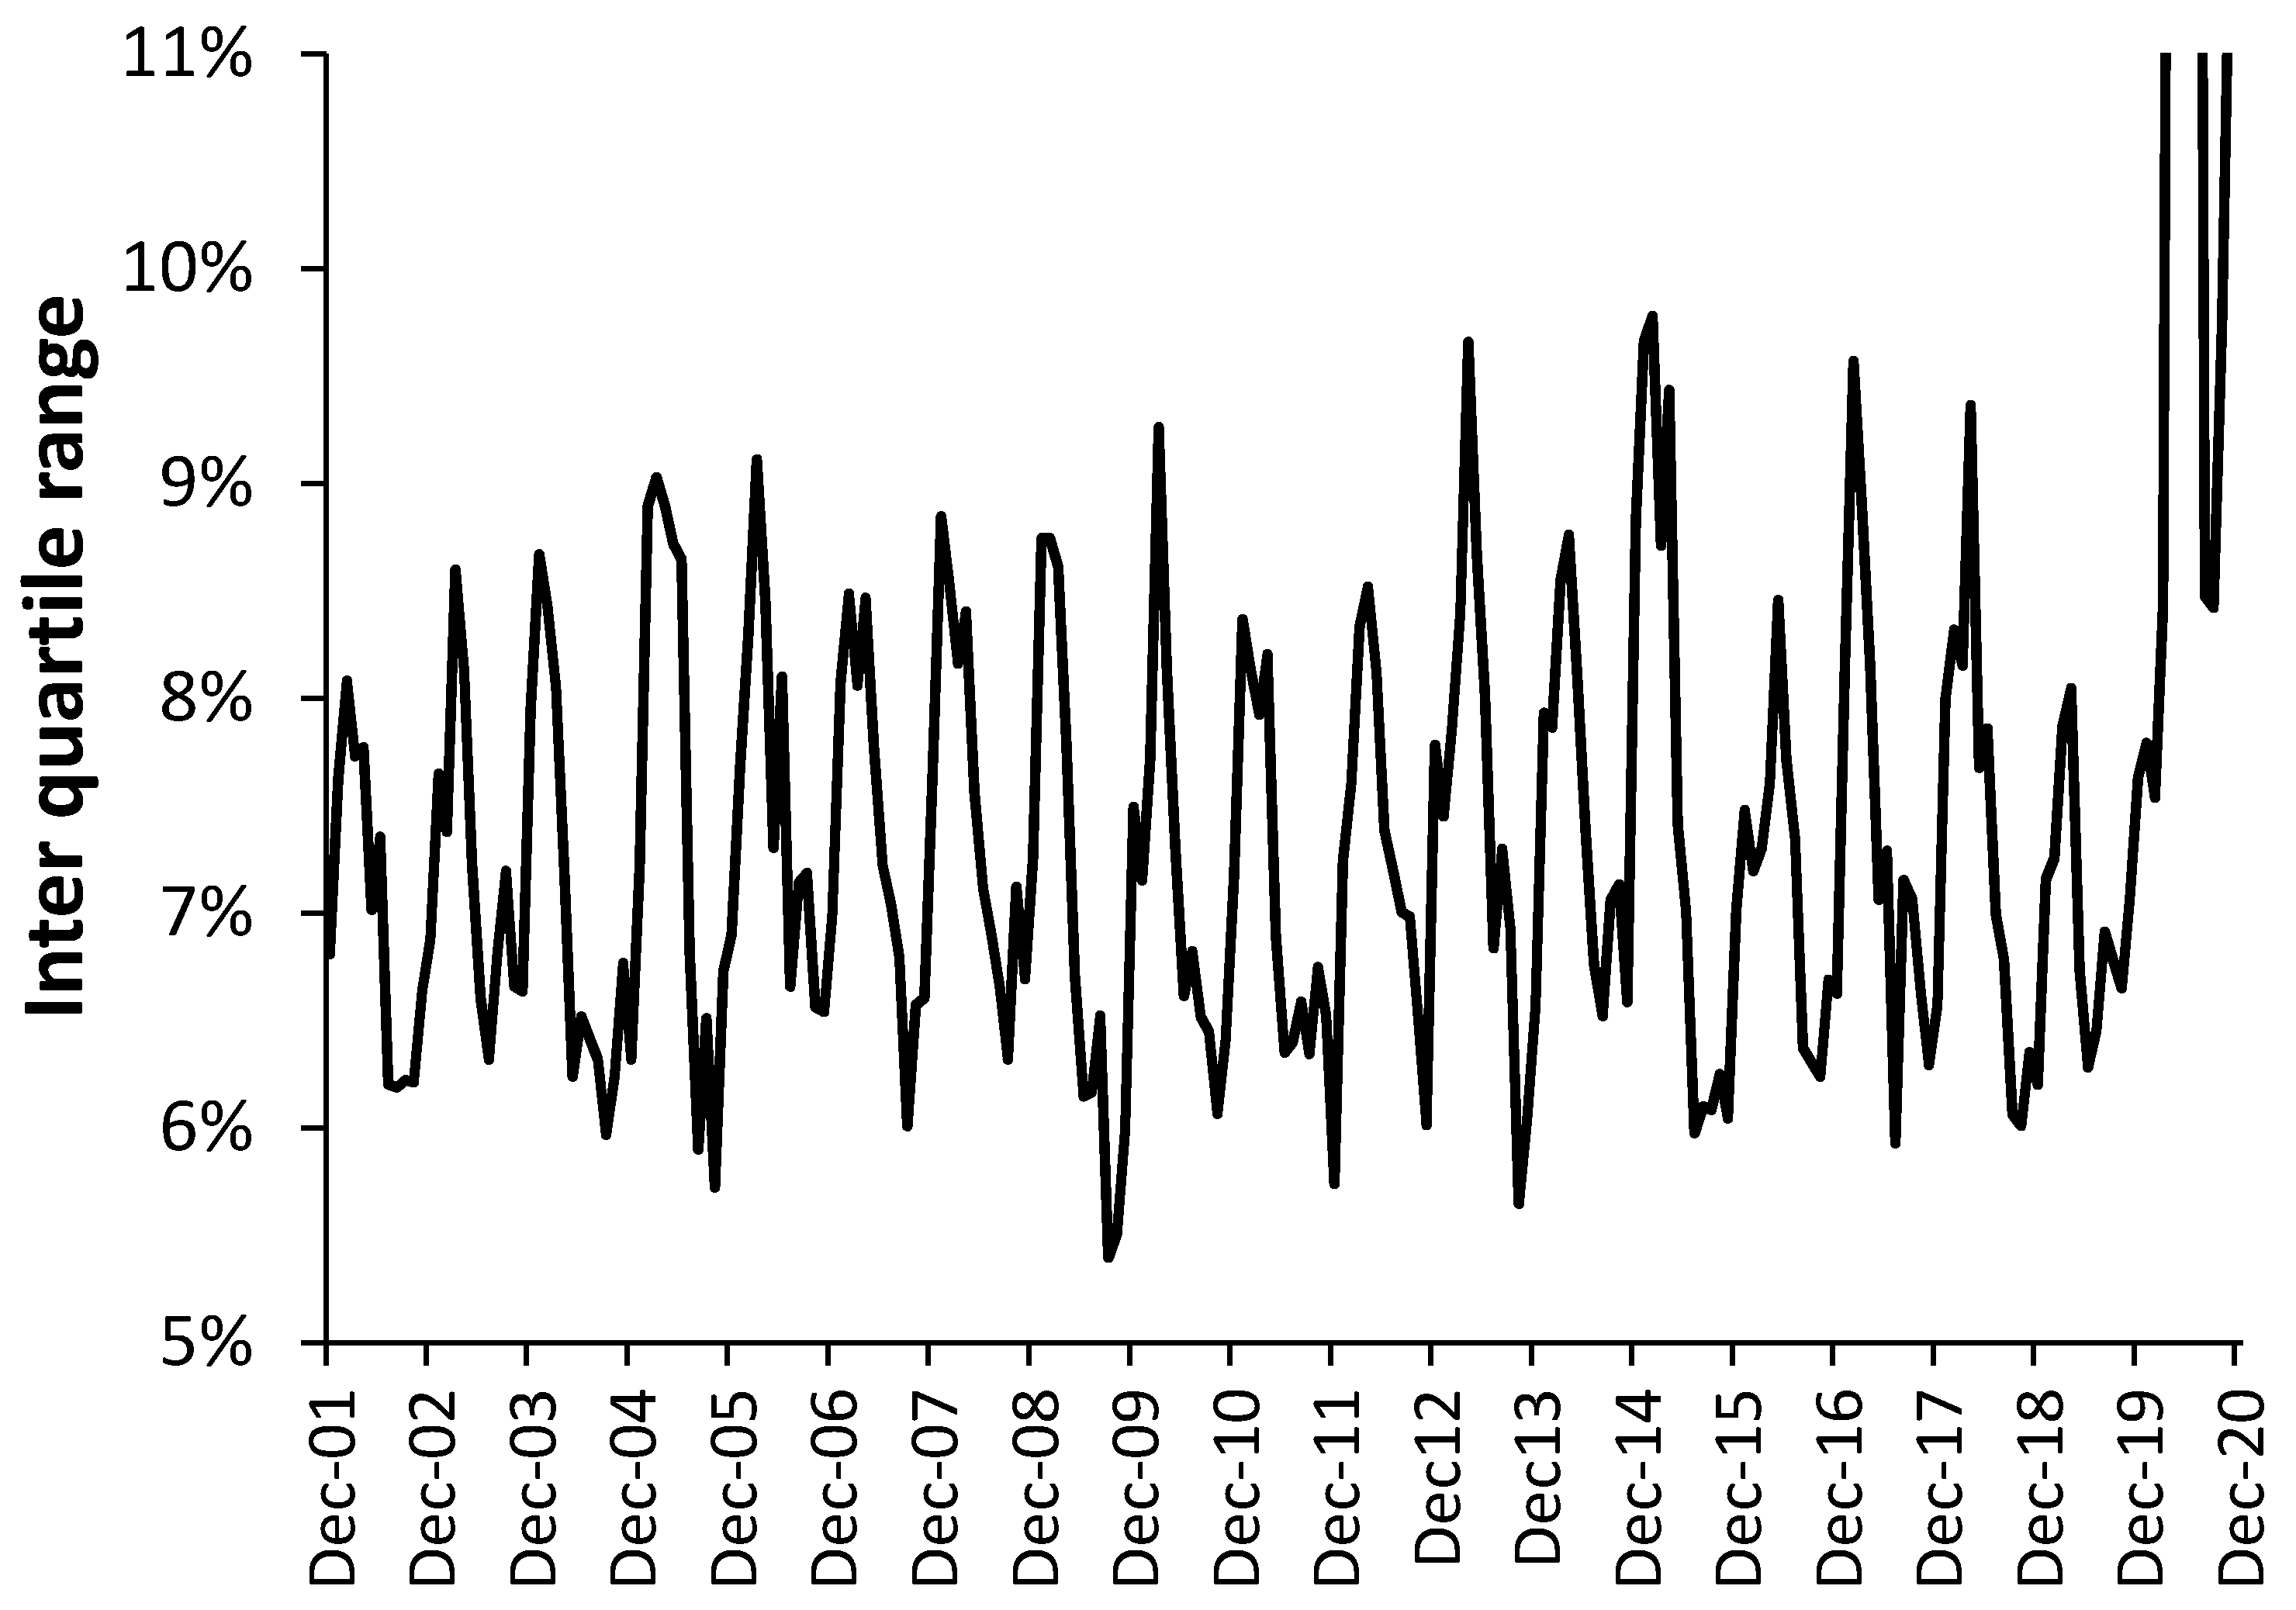
Section 3.12 and
Figure 11 illustrate the truth that all infectious outbreaks show high (sub-national and international) spatiotemporal granularity. Hence during the winter of 2014/15 in the UK, the EWM was the highest in around 25 years, however, the IQR ranged from an EWM of 17% at the lower quartile to 27% at the upper quartile. This was not an extreme winter in terms of temperature and the range in sub-national EWM therefore arose from the spread of, and interaction between, winter infectious agents, of which influenza is but one agent [
25,
26]. Even more curiously the gap between female and male EWM in the winter of 2014/15 (9.2% difference) was the second highest since 1949, only slightly lower than 1996/97 (9.2% difference). Influenza happens very frequently so what happened in these two years that causes such a huge difference between the genders? No pathogen ever operates in splendid isolation [
26].
Finally, the wider effect of influenza vaccination on EWM requires some thought. Vaccination is widely recognized for its benefits and along with other public health measures acts to increase life expectancy, i.e., ultimate death is not prevented but simply shifted to a future date. Hence while vaccination enhances life expectancy, like all other interventions it may well fail to confer benefit in the last months of life. Hence, paradoxically it should have little effect on EWM as was observed in the French study with nursing home residents. An interesting topic for future research.
4.9. Intrpreting Shifts in EWM
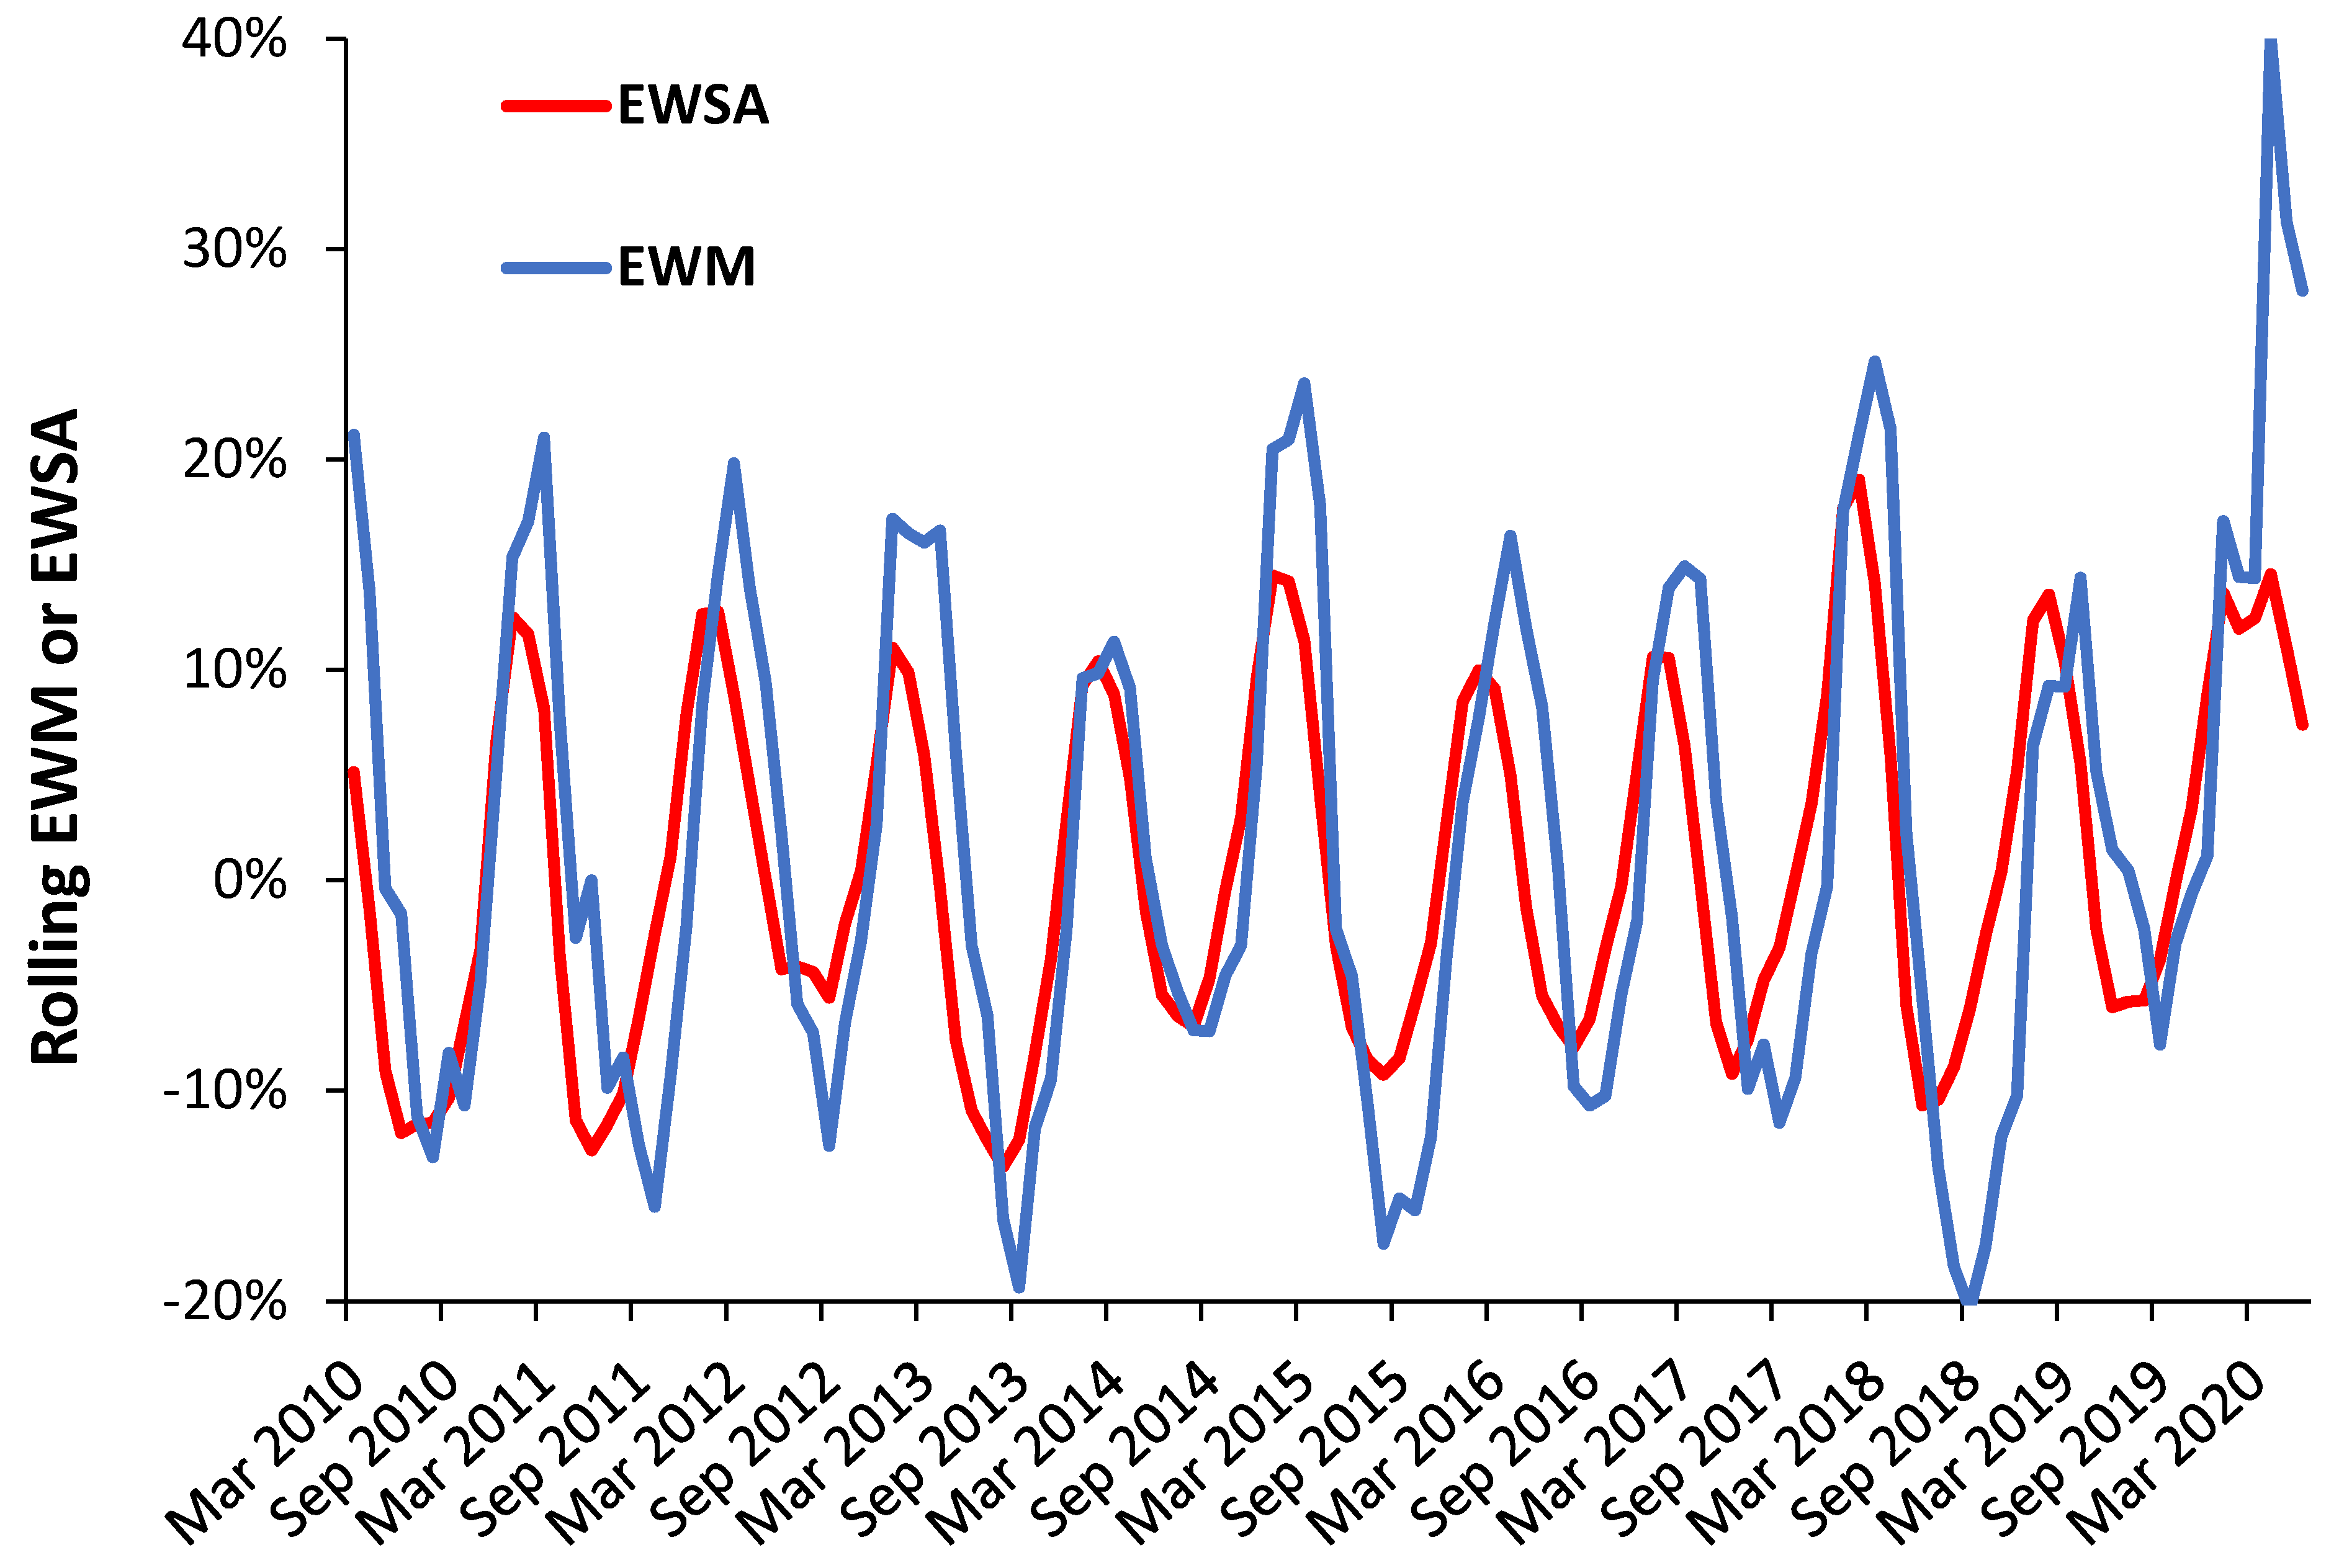
Both
Figure 7 and
Figure 8 demonstrated sudden shifts in the value of EWM during a time-series. It is known that the emergence of a significant new variant of influenza (as in a pandemic) leads to a shift to higher mortality at younger ages. The study of Reichert et al. [
55] demonstrated that such a shift occurred during and after the 1968/69 Hong Kong flu pandemic in each disease class, i.e., for ischemic heart disease, cerebrovascular disease, and diabetes mellitus, pneumonia, and influenza with features specific to influenza A(H3N2). There were increases in the proportion of excess pneumonia and influenza mortality that occurred in the younger age group (<75 years) during the 1968/69 pandemic year. The magnitude of the age shift decreased steadily until 1975/76, after which time the age shift appeared to be independent of the circulating influenza virus type but continued to move toward older age groups [
55].
In England and Wales age-specific shifts were also demonstrated in
Figure 5, although data did not go back to the 1968/69 winter. Nevertheless, both macroscopic and age-specific shifts do occur and are probably due to the emergency of new influenza variants.
However, a perusal of the time series for various European countries shows that the 1968/69 shift to lower EWM was seen in Germany, UK, Portugal, Greece, Italy, France, Ireland, Spain, Austria, and Belgium. In contrast, a shift-up appeared to occur in Sweden, while no shift or only minimal change occurred in Switzerland, Netherlands, Denmark, Finland, Iceland, Norway, and Liechtenstein. Most of these are Scandinavian countries. The relevant point is that the trends in EWM are country specific with suspected involvement of influenza strains, but that such shifts can make calculation of average and median EWM subject to distortion depending on the time scale employed in various studies on this topic.
It is worth noting that the timing and mix of influenza(s) vary considerably each year between countries and within regions of a country [
59]. Hence an explanation for timing differences in maximum EWM seen in
Table 2 and
Table 3.


