
Analysis of Runoff Variation Characteristics and Influencing Factors in the Wujiang River Basin in the Past 30 Years


Abstract
:1. Introduction
2. Materials and Methods
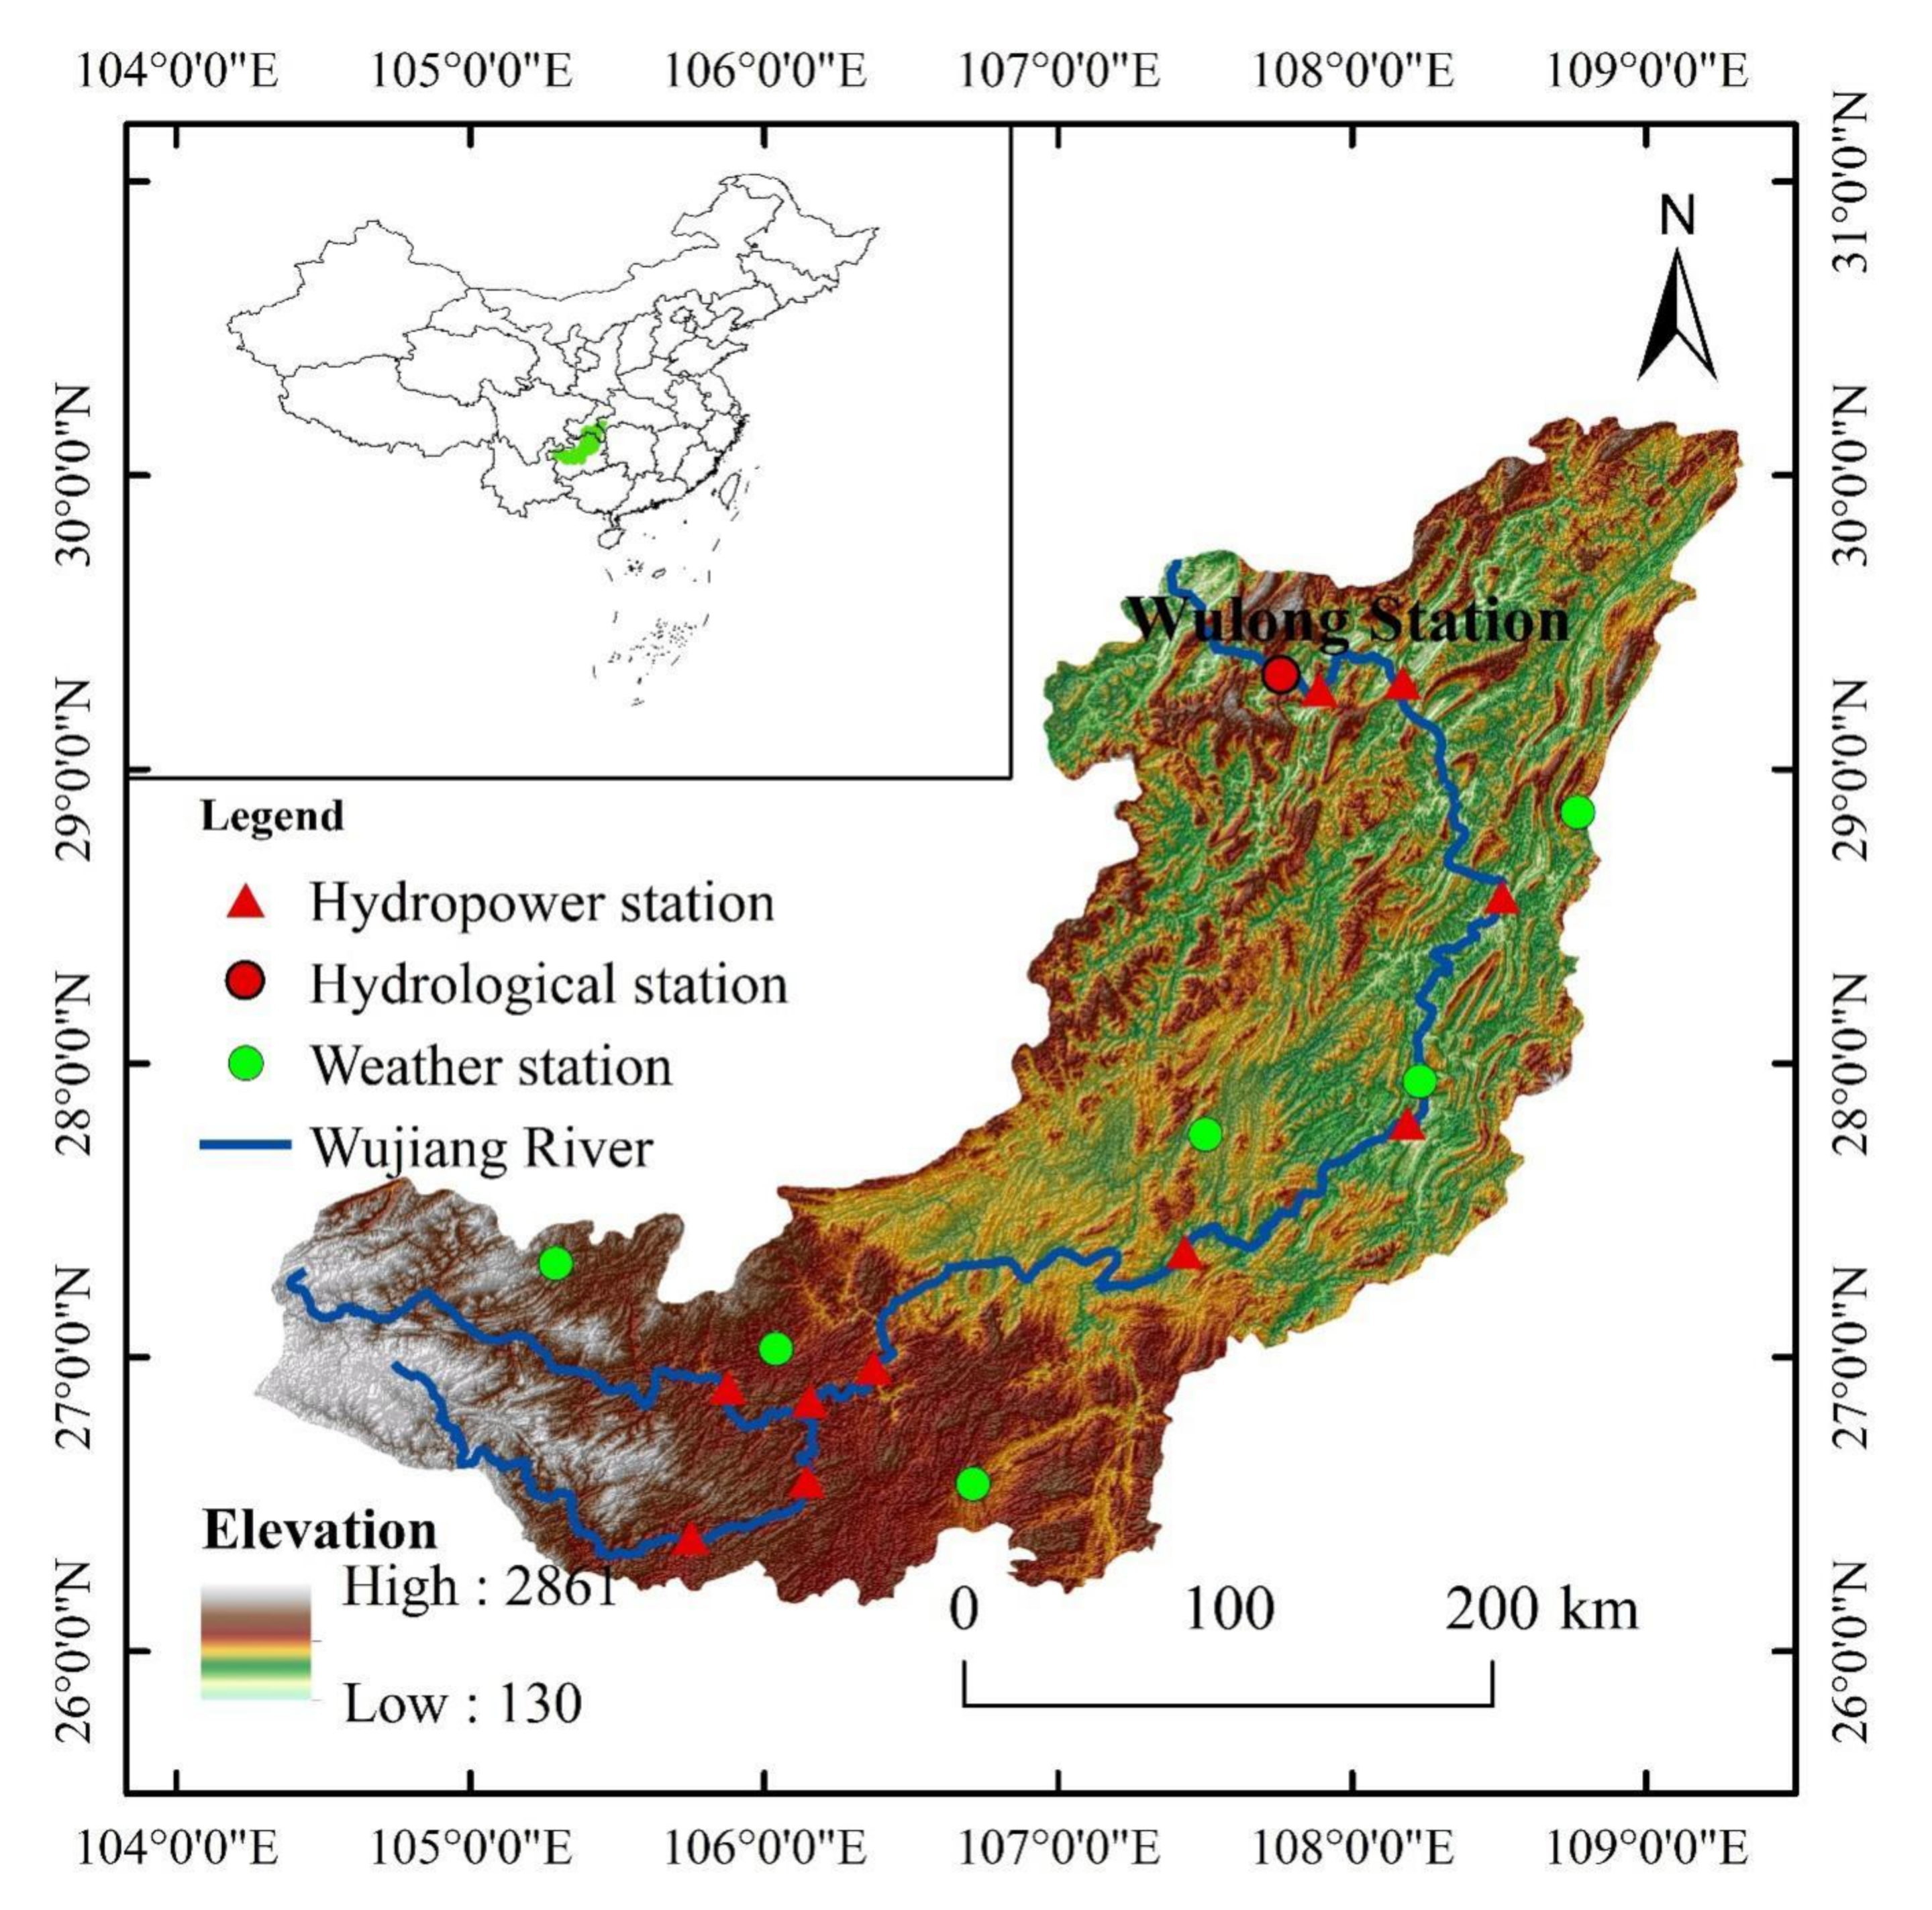
2.1. Study Area and Dataset
2.2. Methods
2.2.1. Mann-Kendall Test
2.2.2. Budyko Hypothesis
2.2.3. Indicators of Hydrologic Alteration
3. Result
3.1. Trend and Mutation Analysis
3.2. IHA Hydrological Regime Analysis
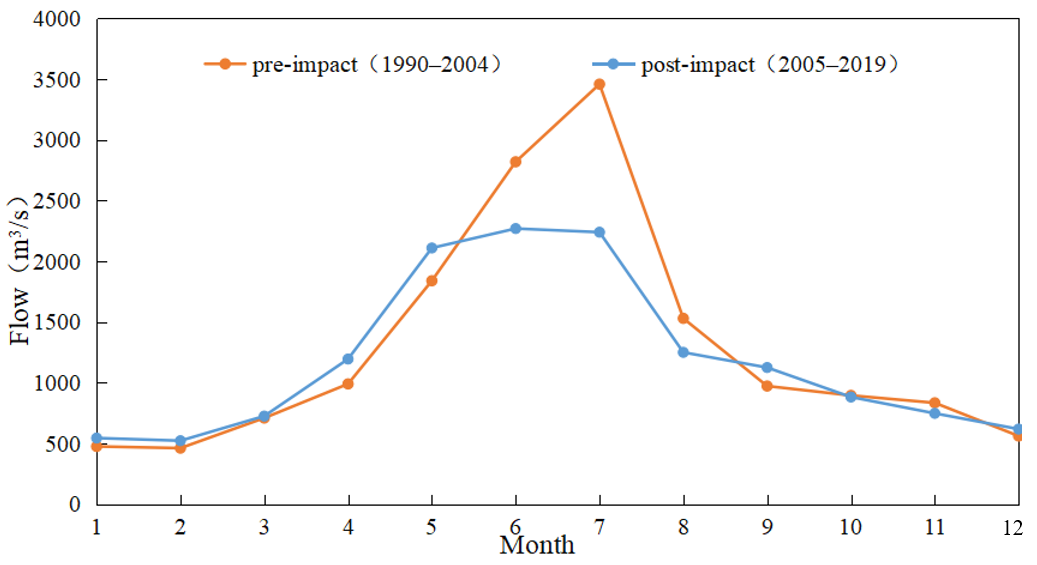
3.2.1. Change of Monthly Median Flow
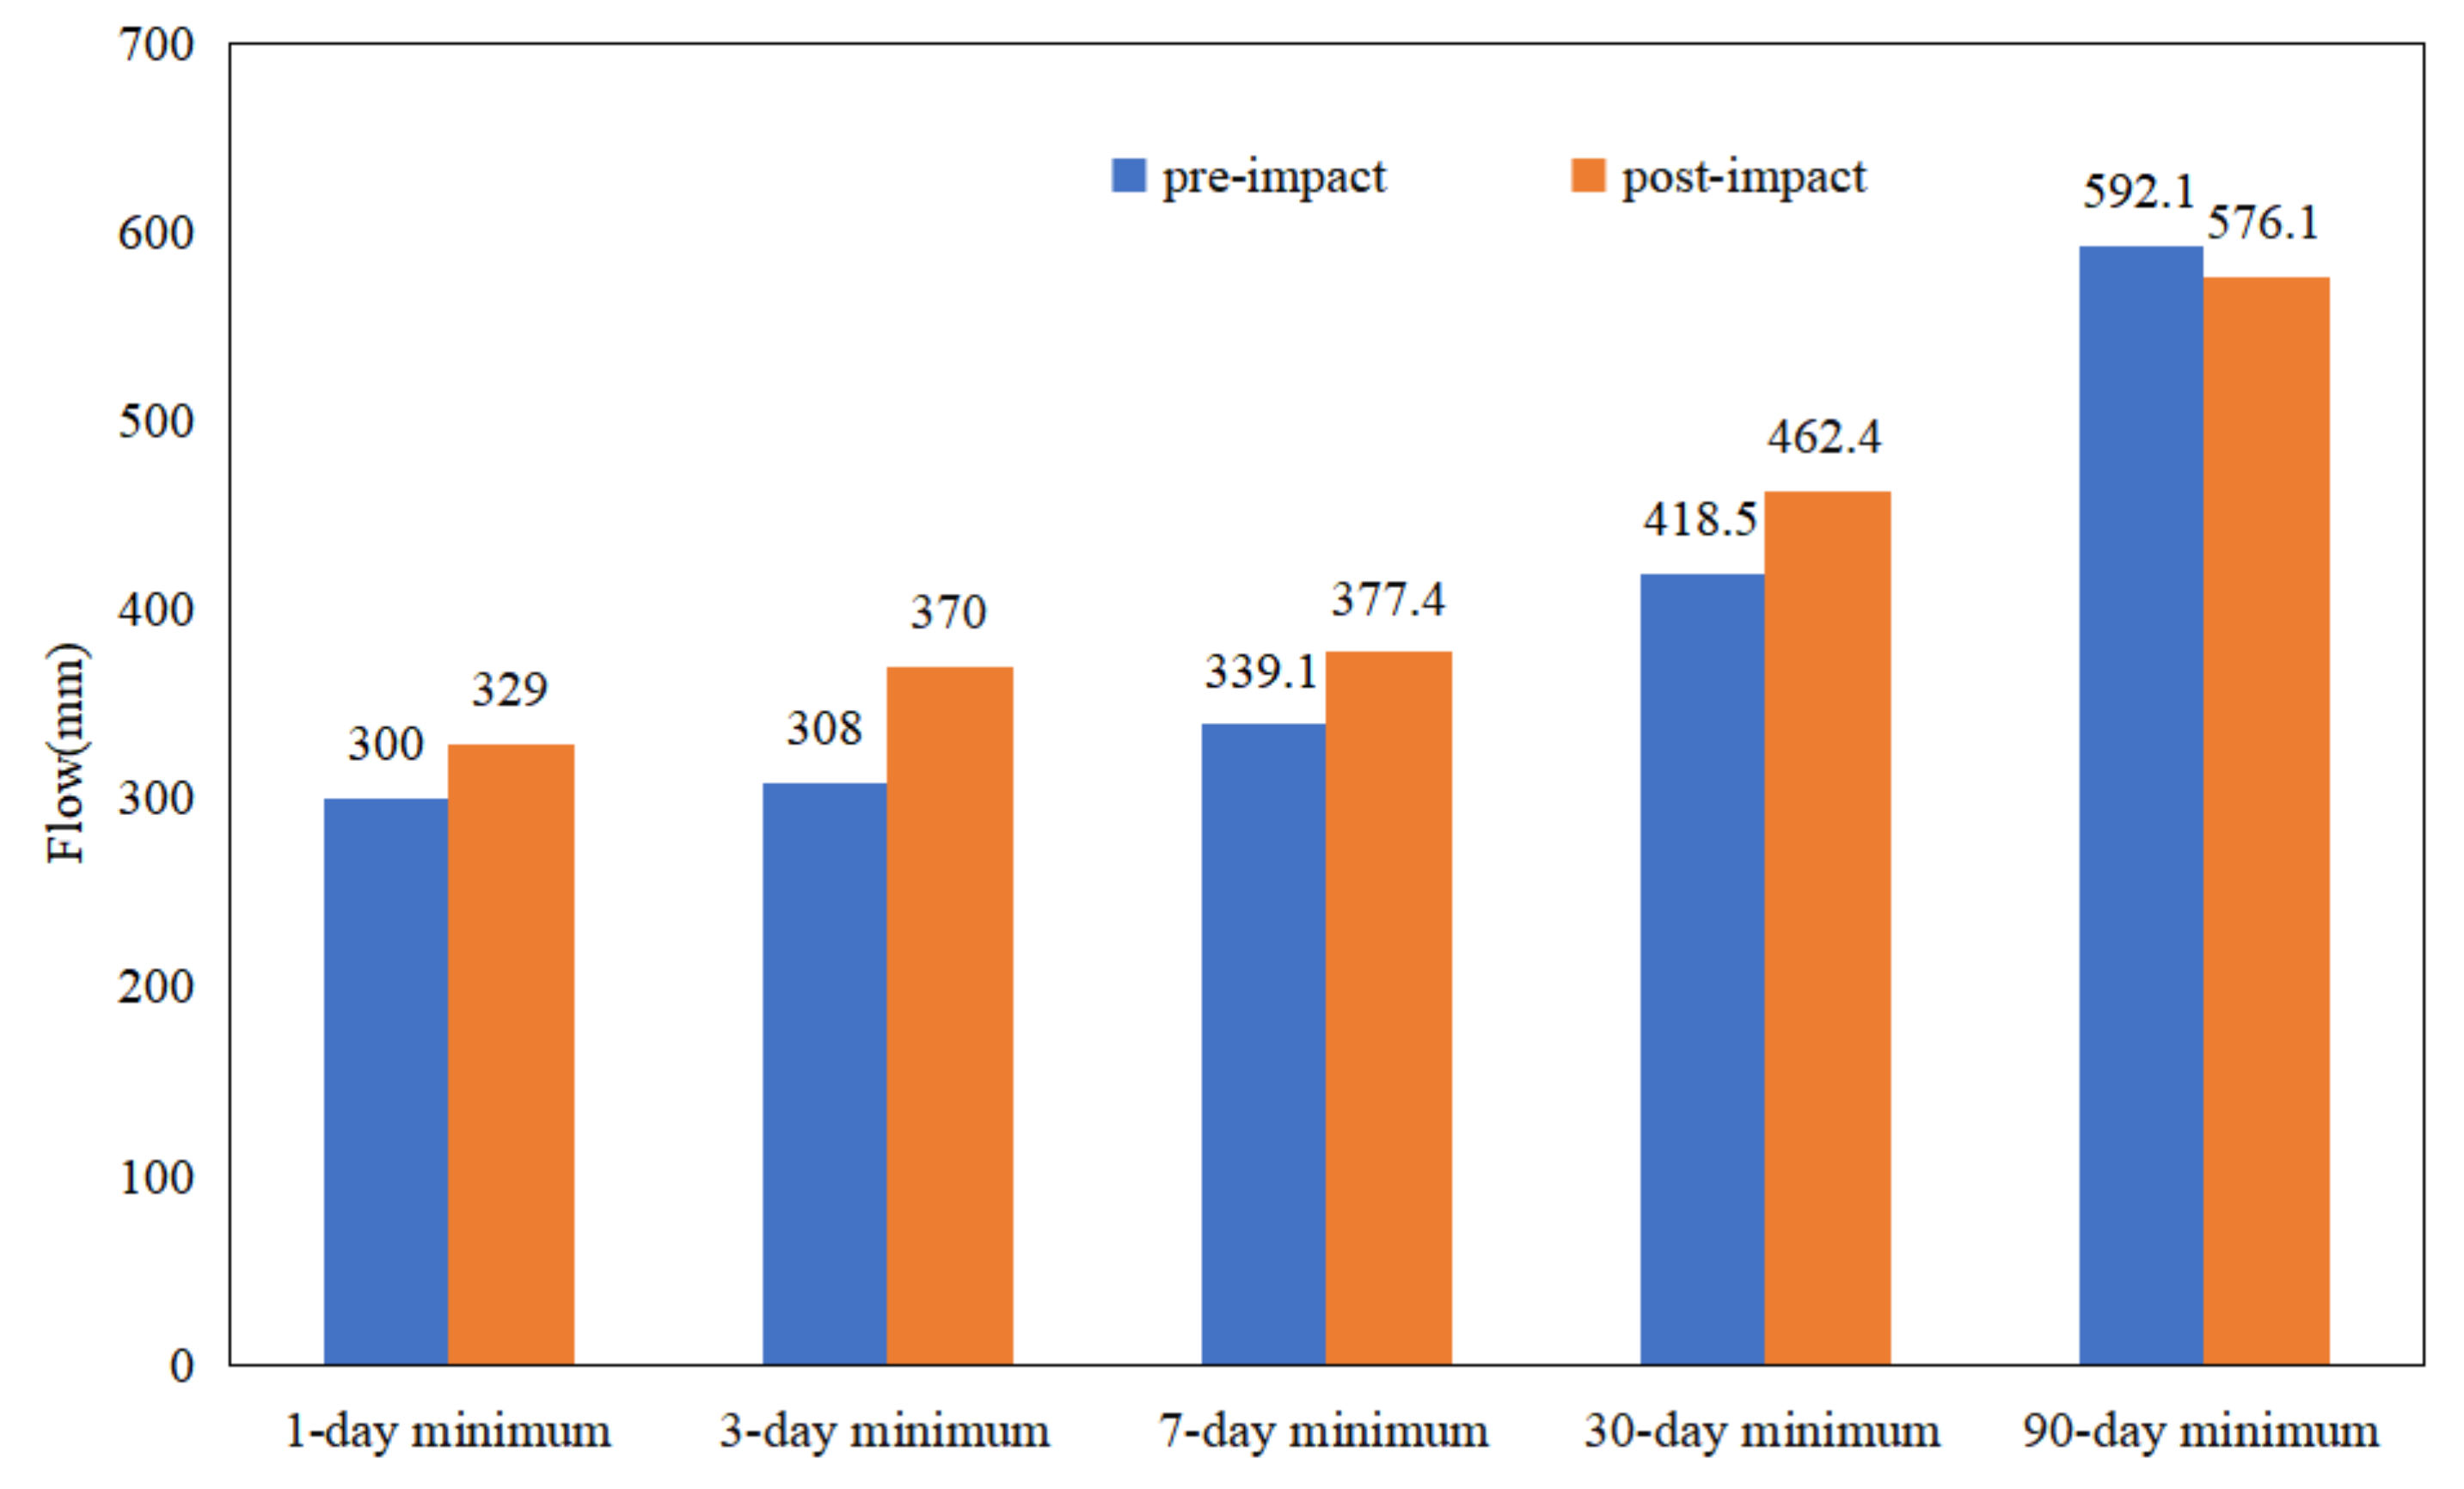
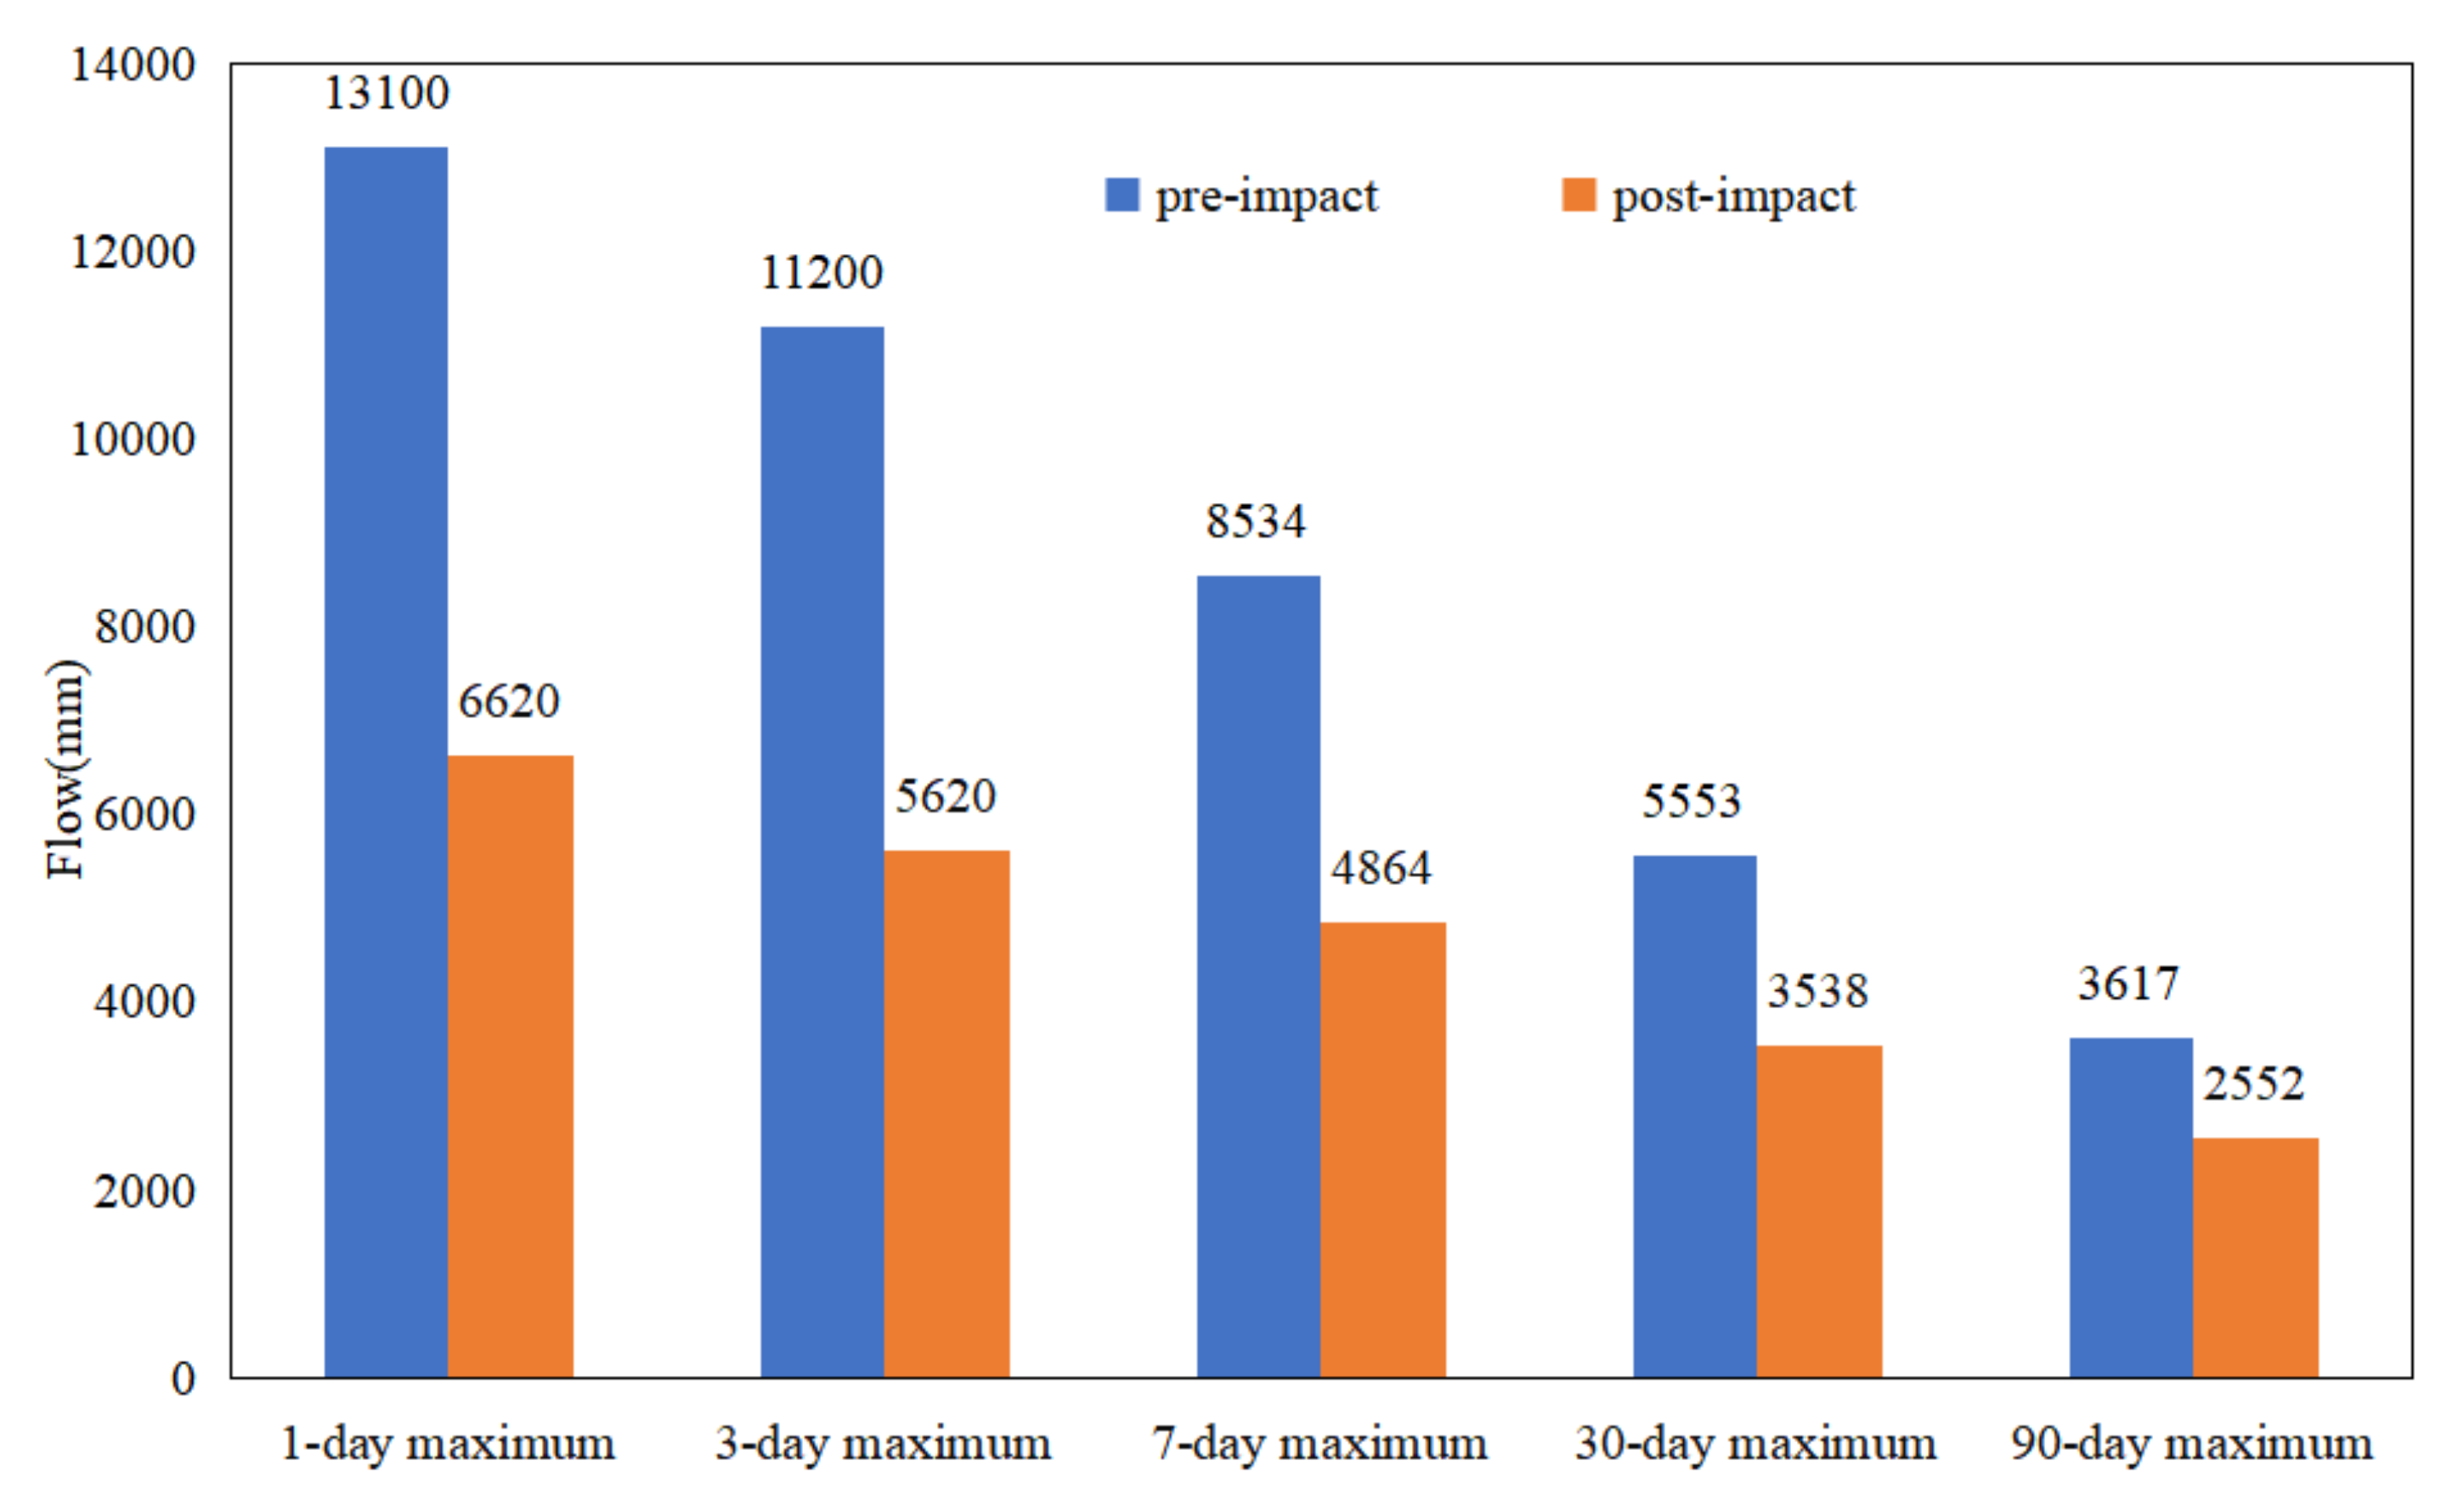
3.2.2. Change of Annual Extreme Flow
3.2.3. Change in the Occurrence Time of Annual Extreme Flow
3.2.4. Change of Flow Pulse and Flow Change Rate
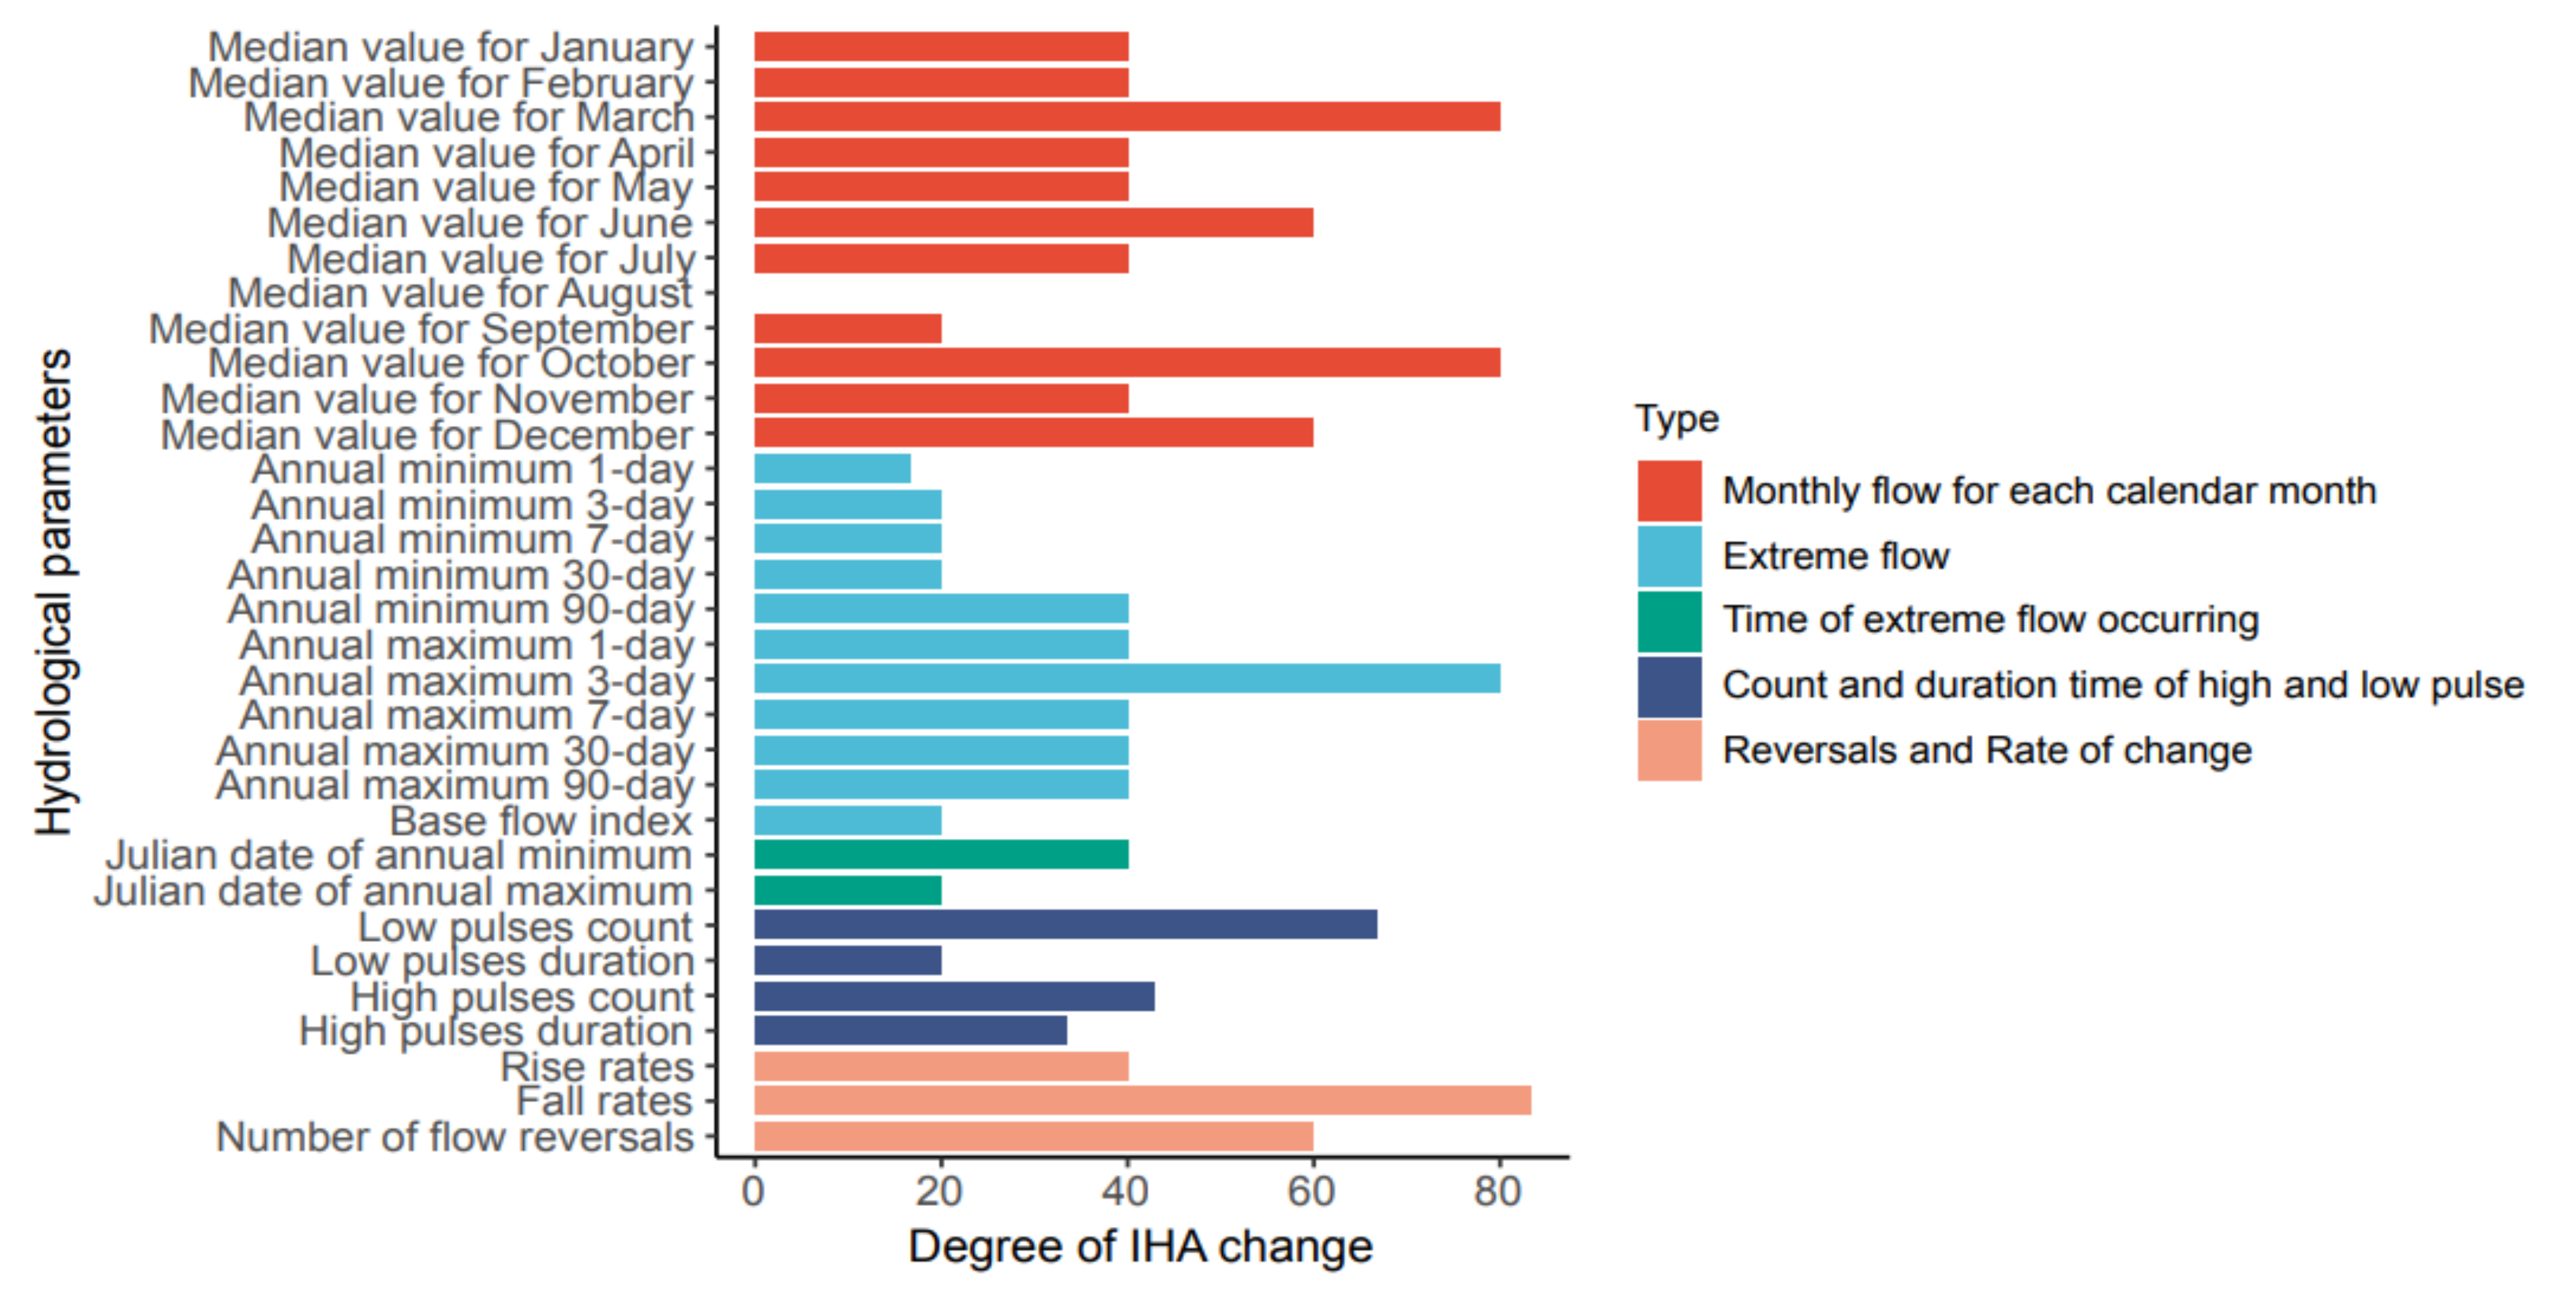
3.2.5. Overall Change Degree of Hydrology
3.3. Attribution Analysis
Attribution Analysis of Runoff Change
4. Discussion
4.1. The Impact of Climatic Change
4.2. The Impact of Underlying Surface Change
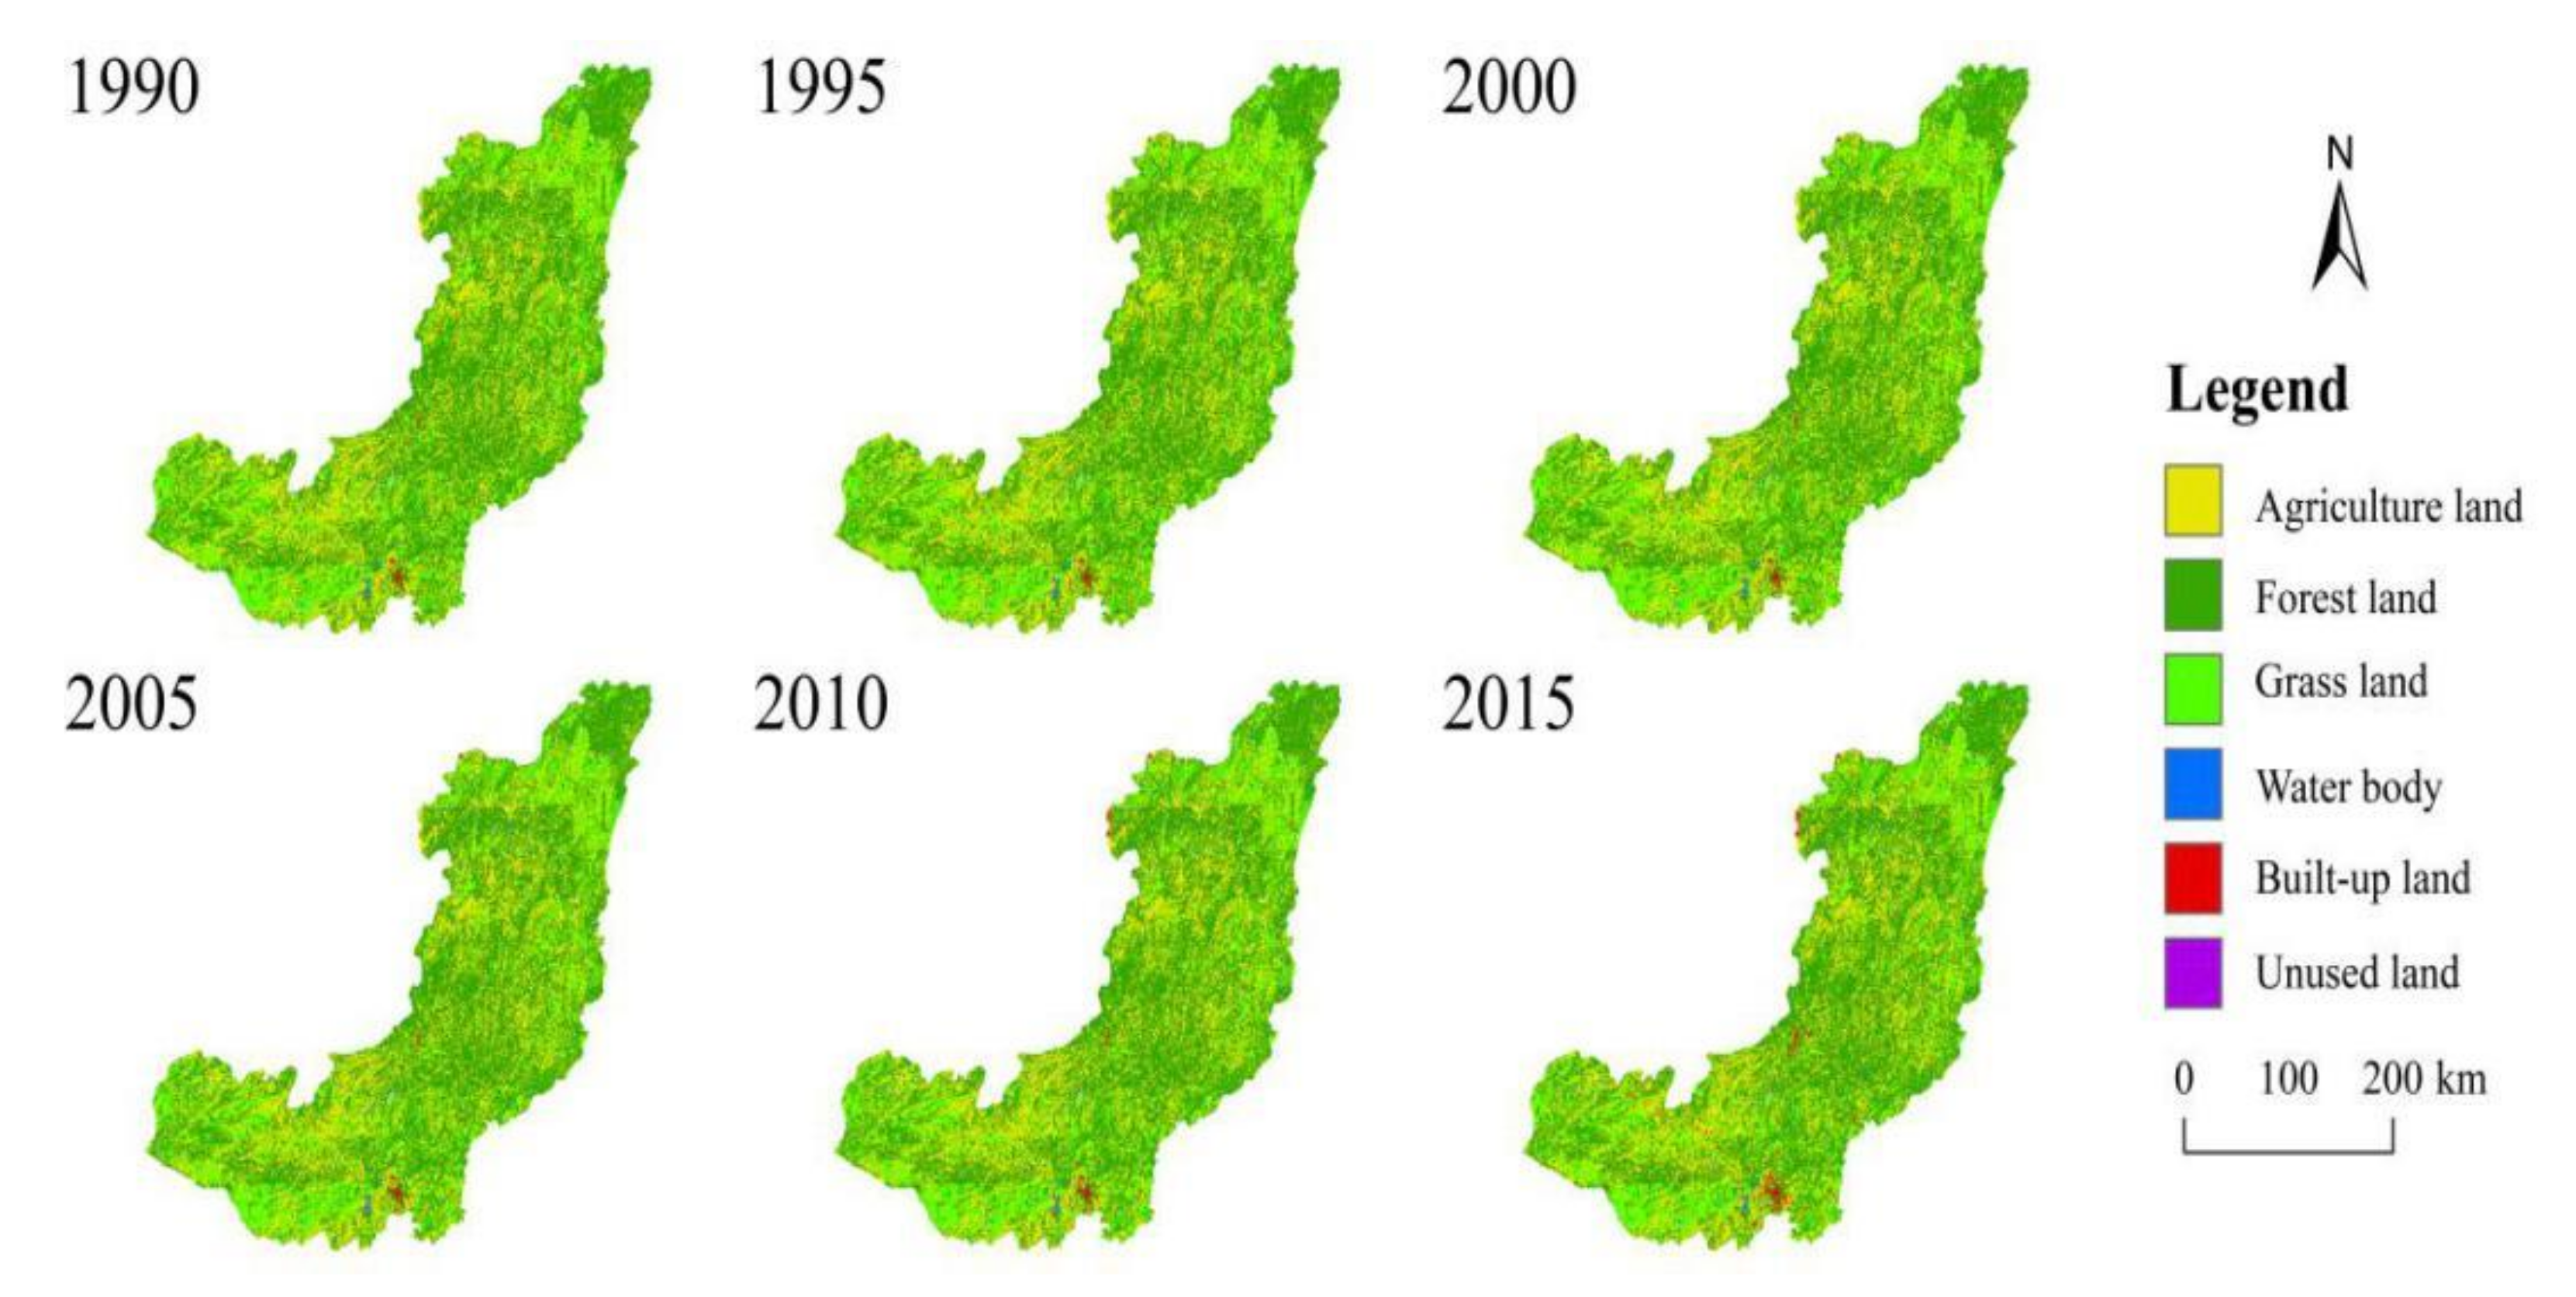
4.2.1. Land-Use
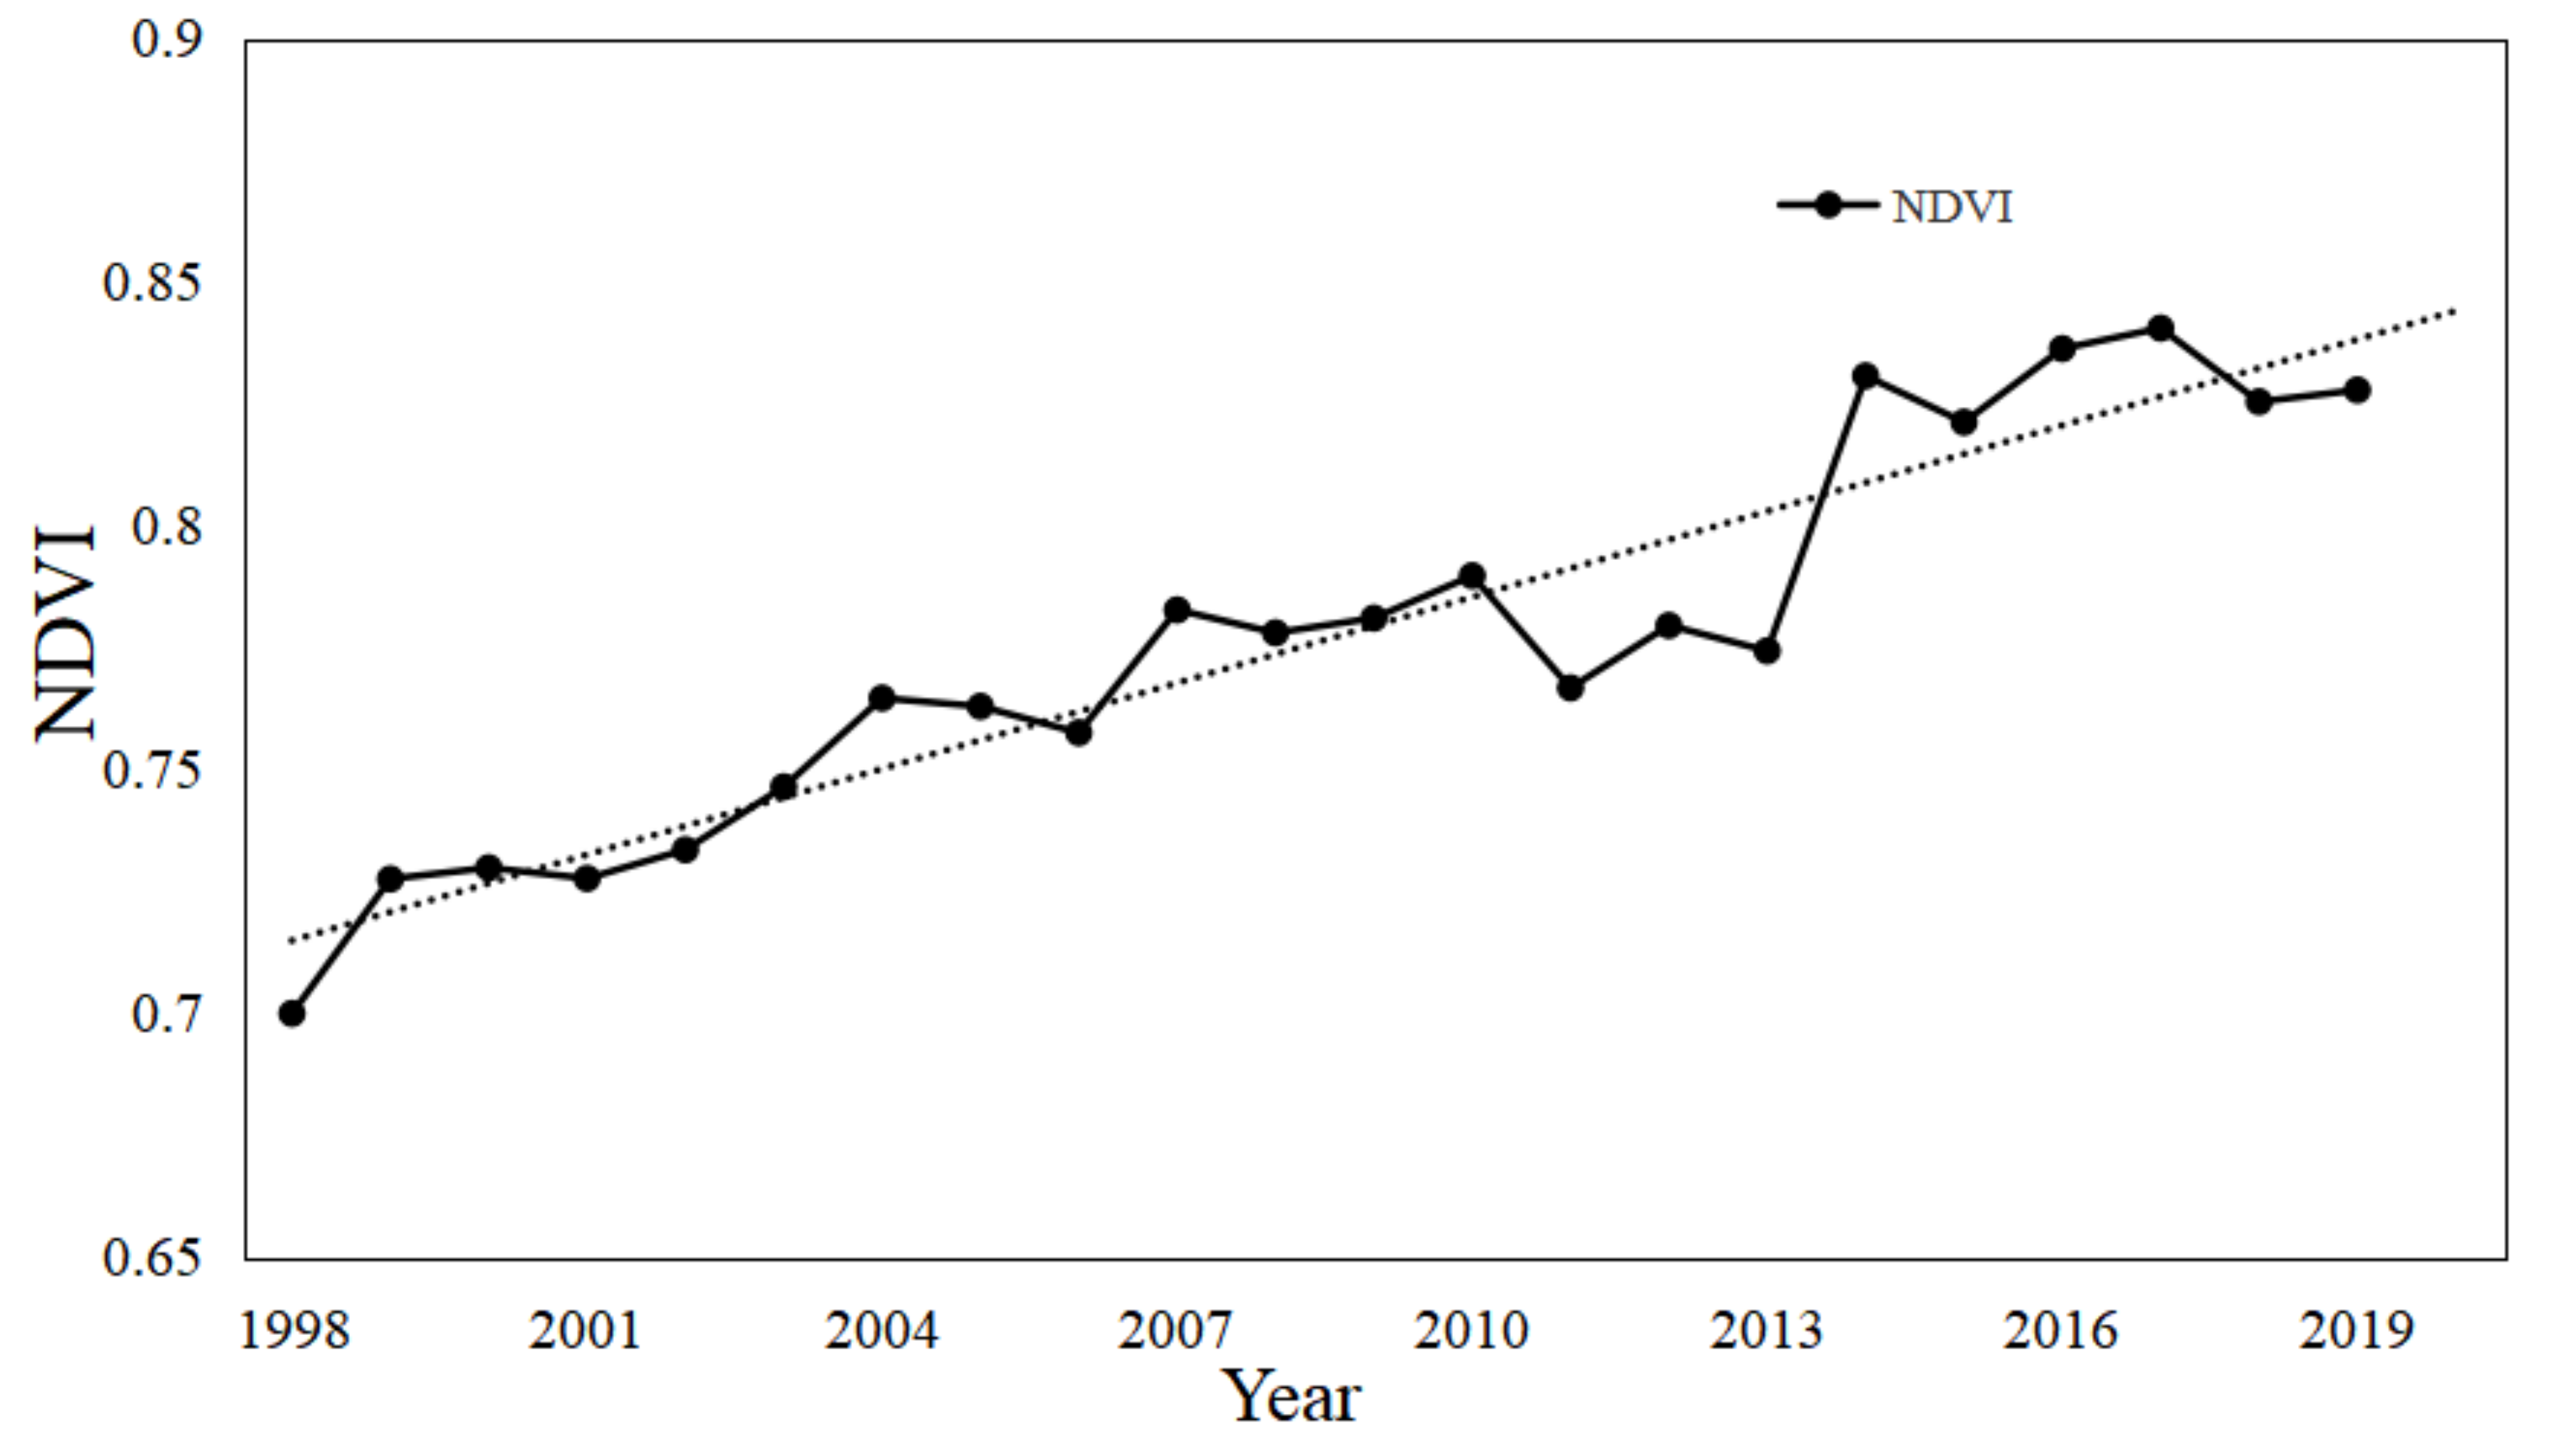
4.2.2. Vegetation Cover
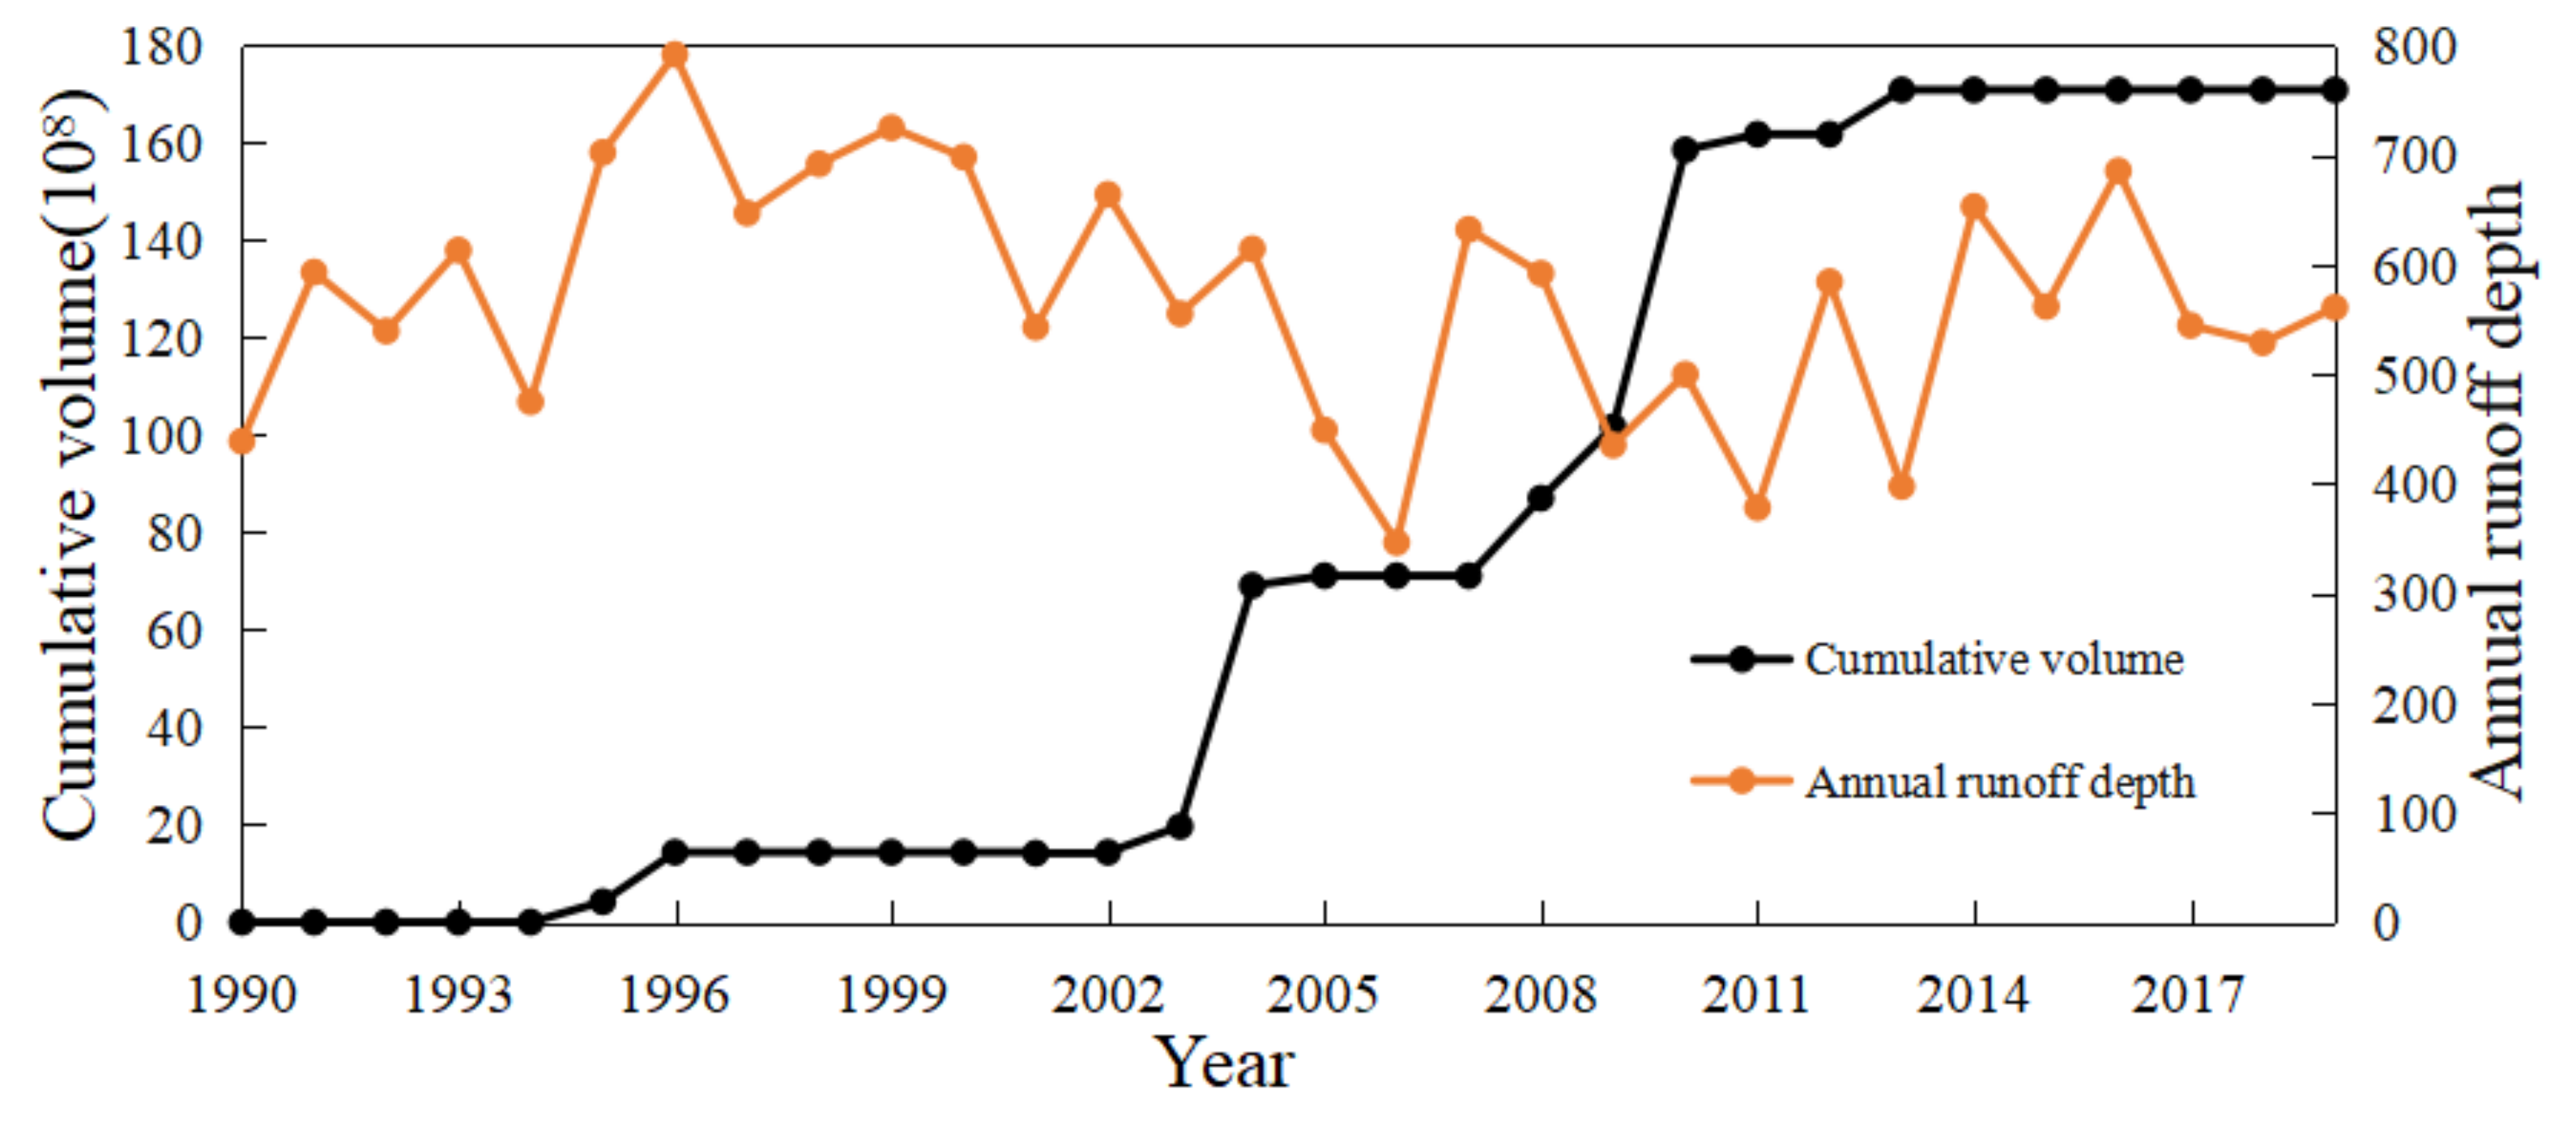
4.2.3. Construction of Reservoirs
5. Conclusions
- 1.
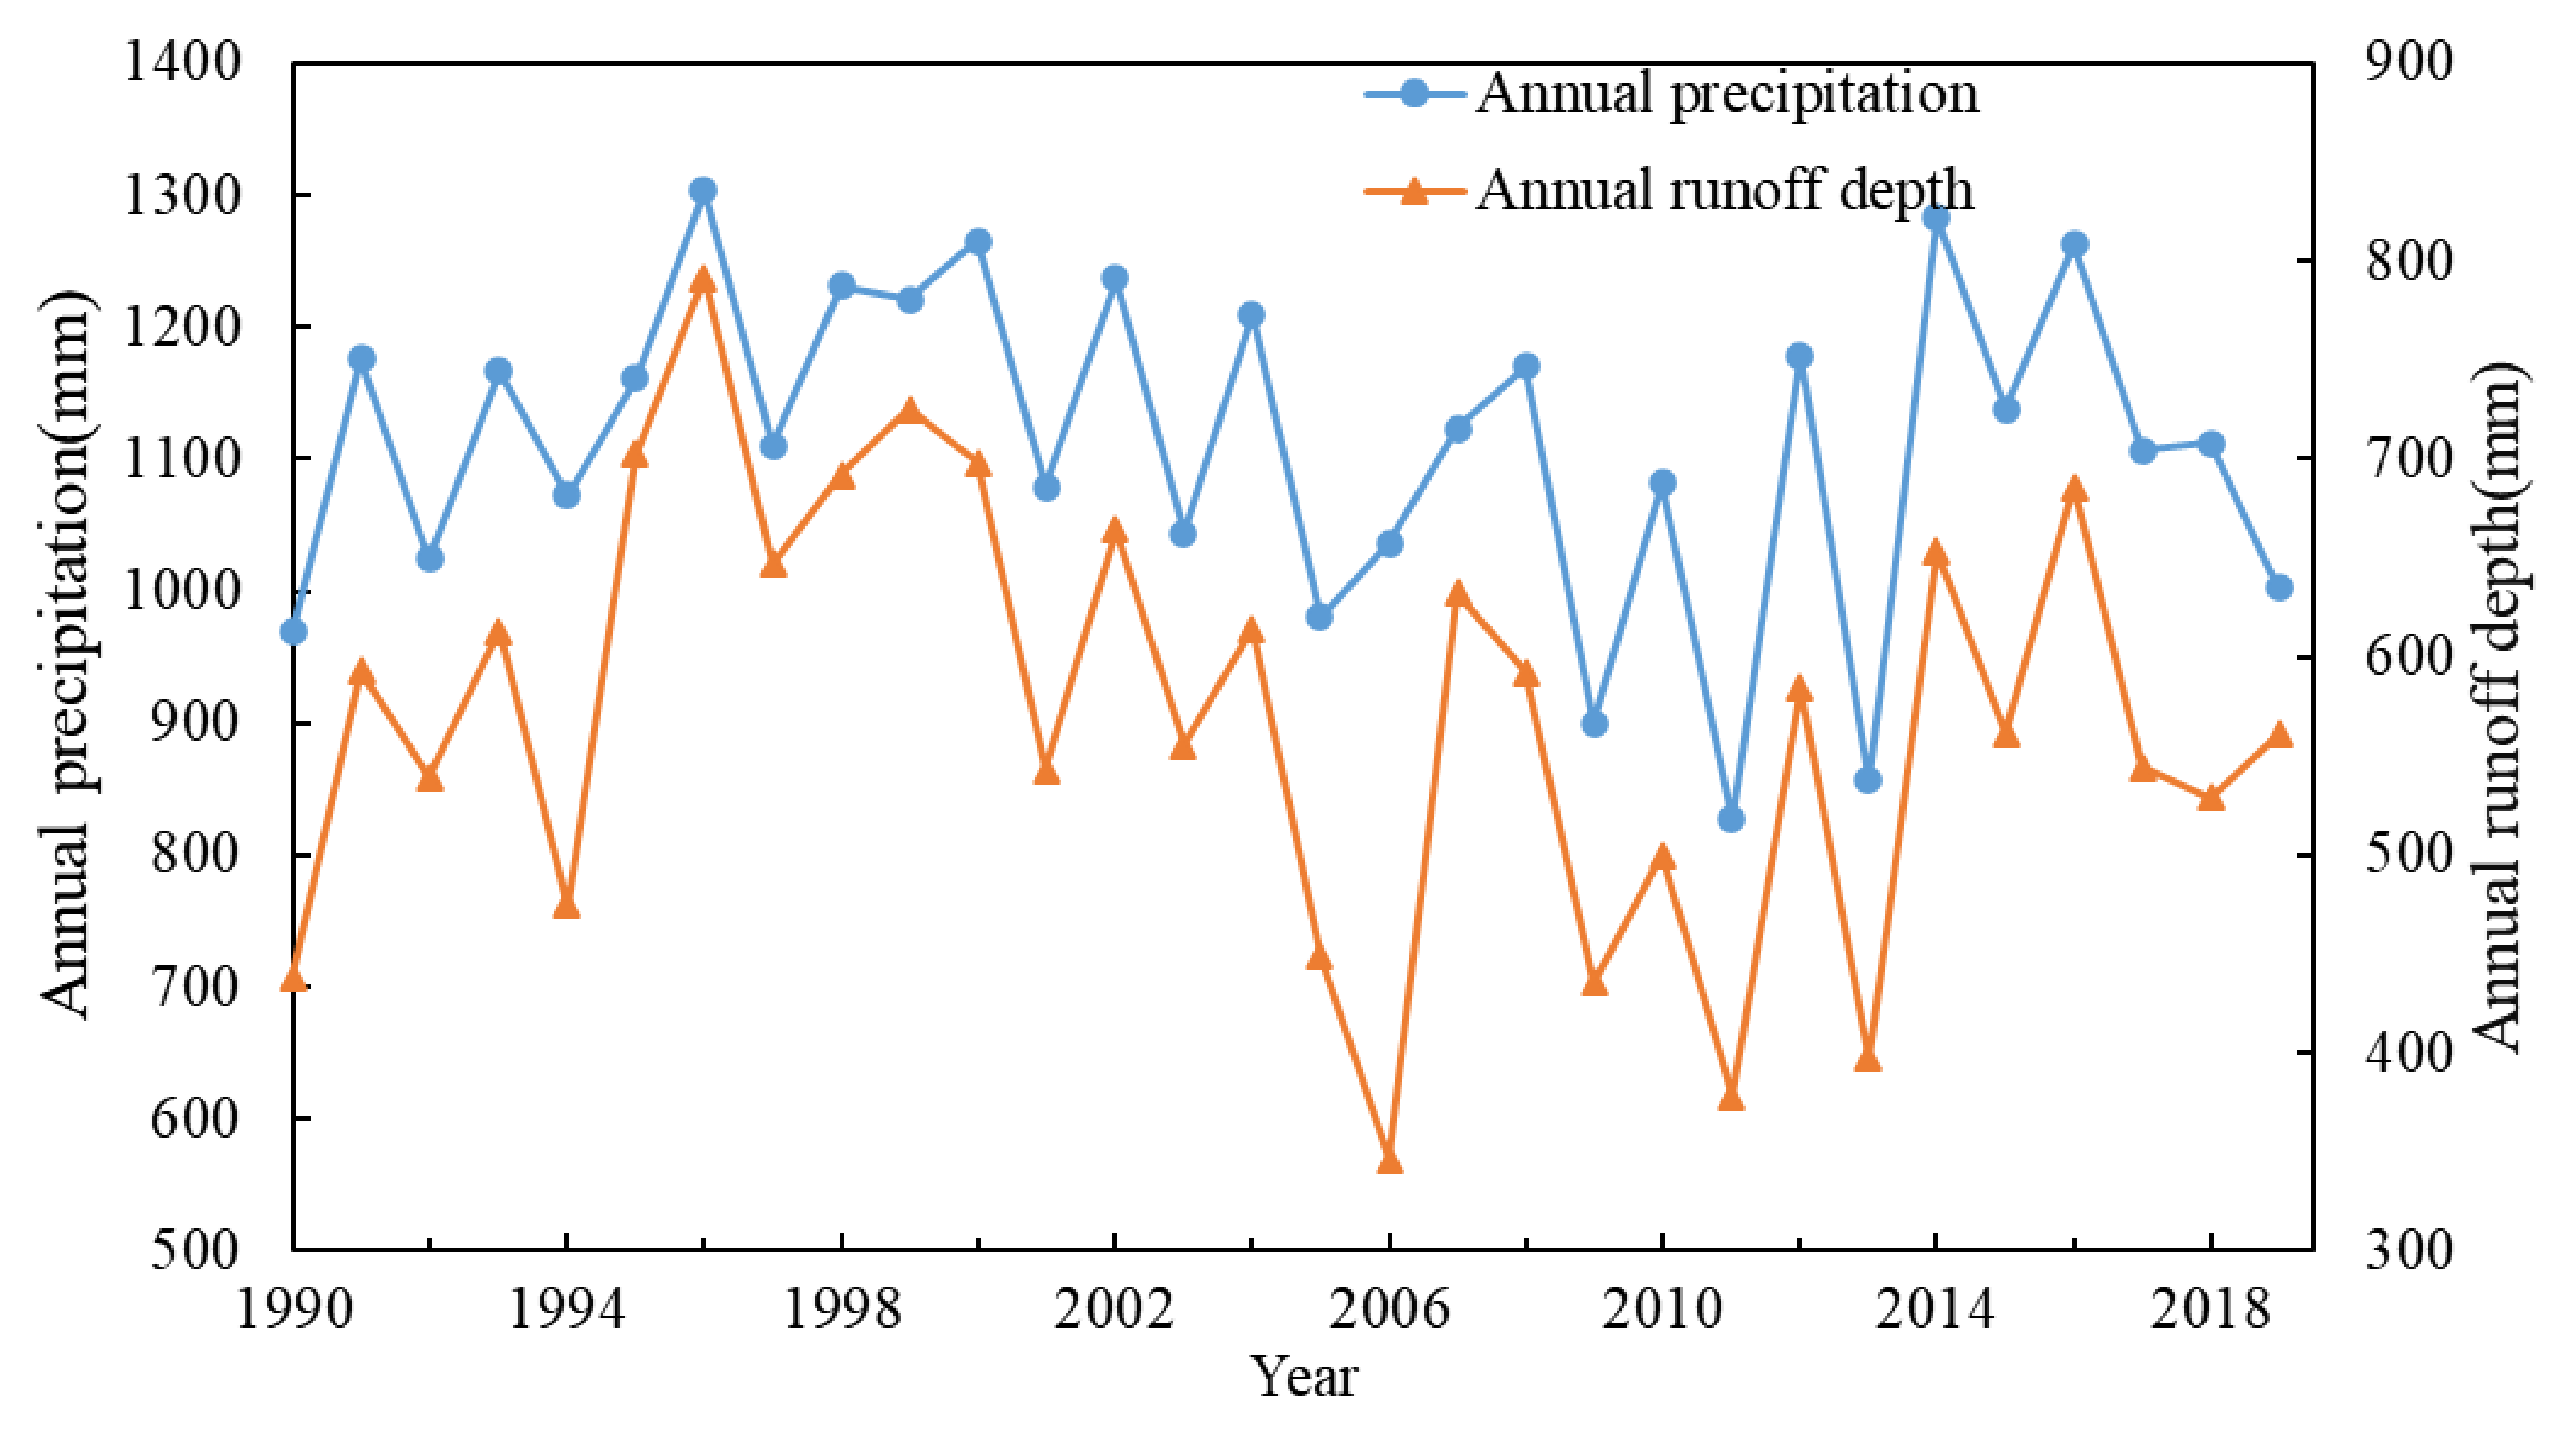
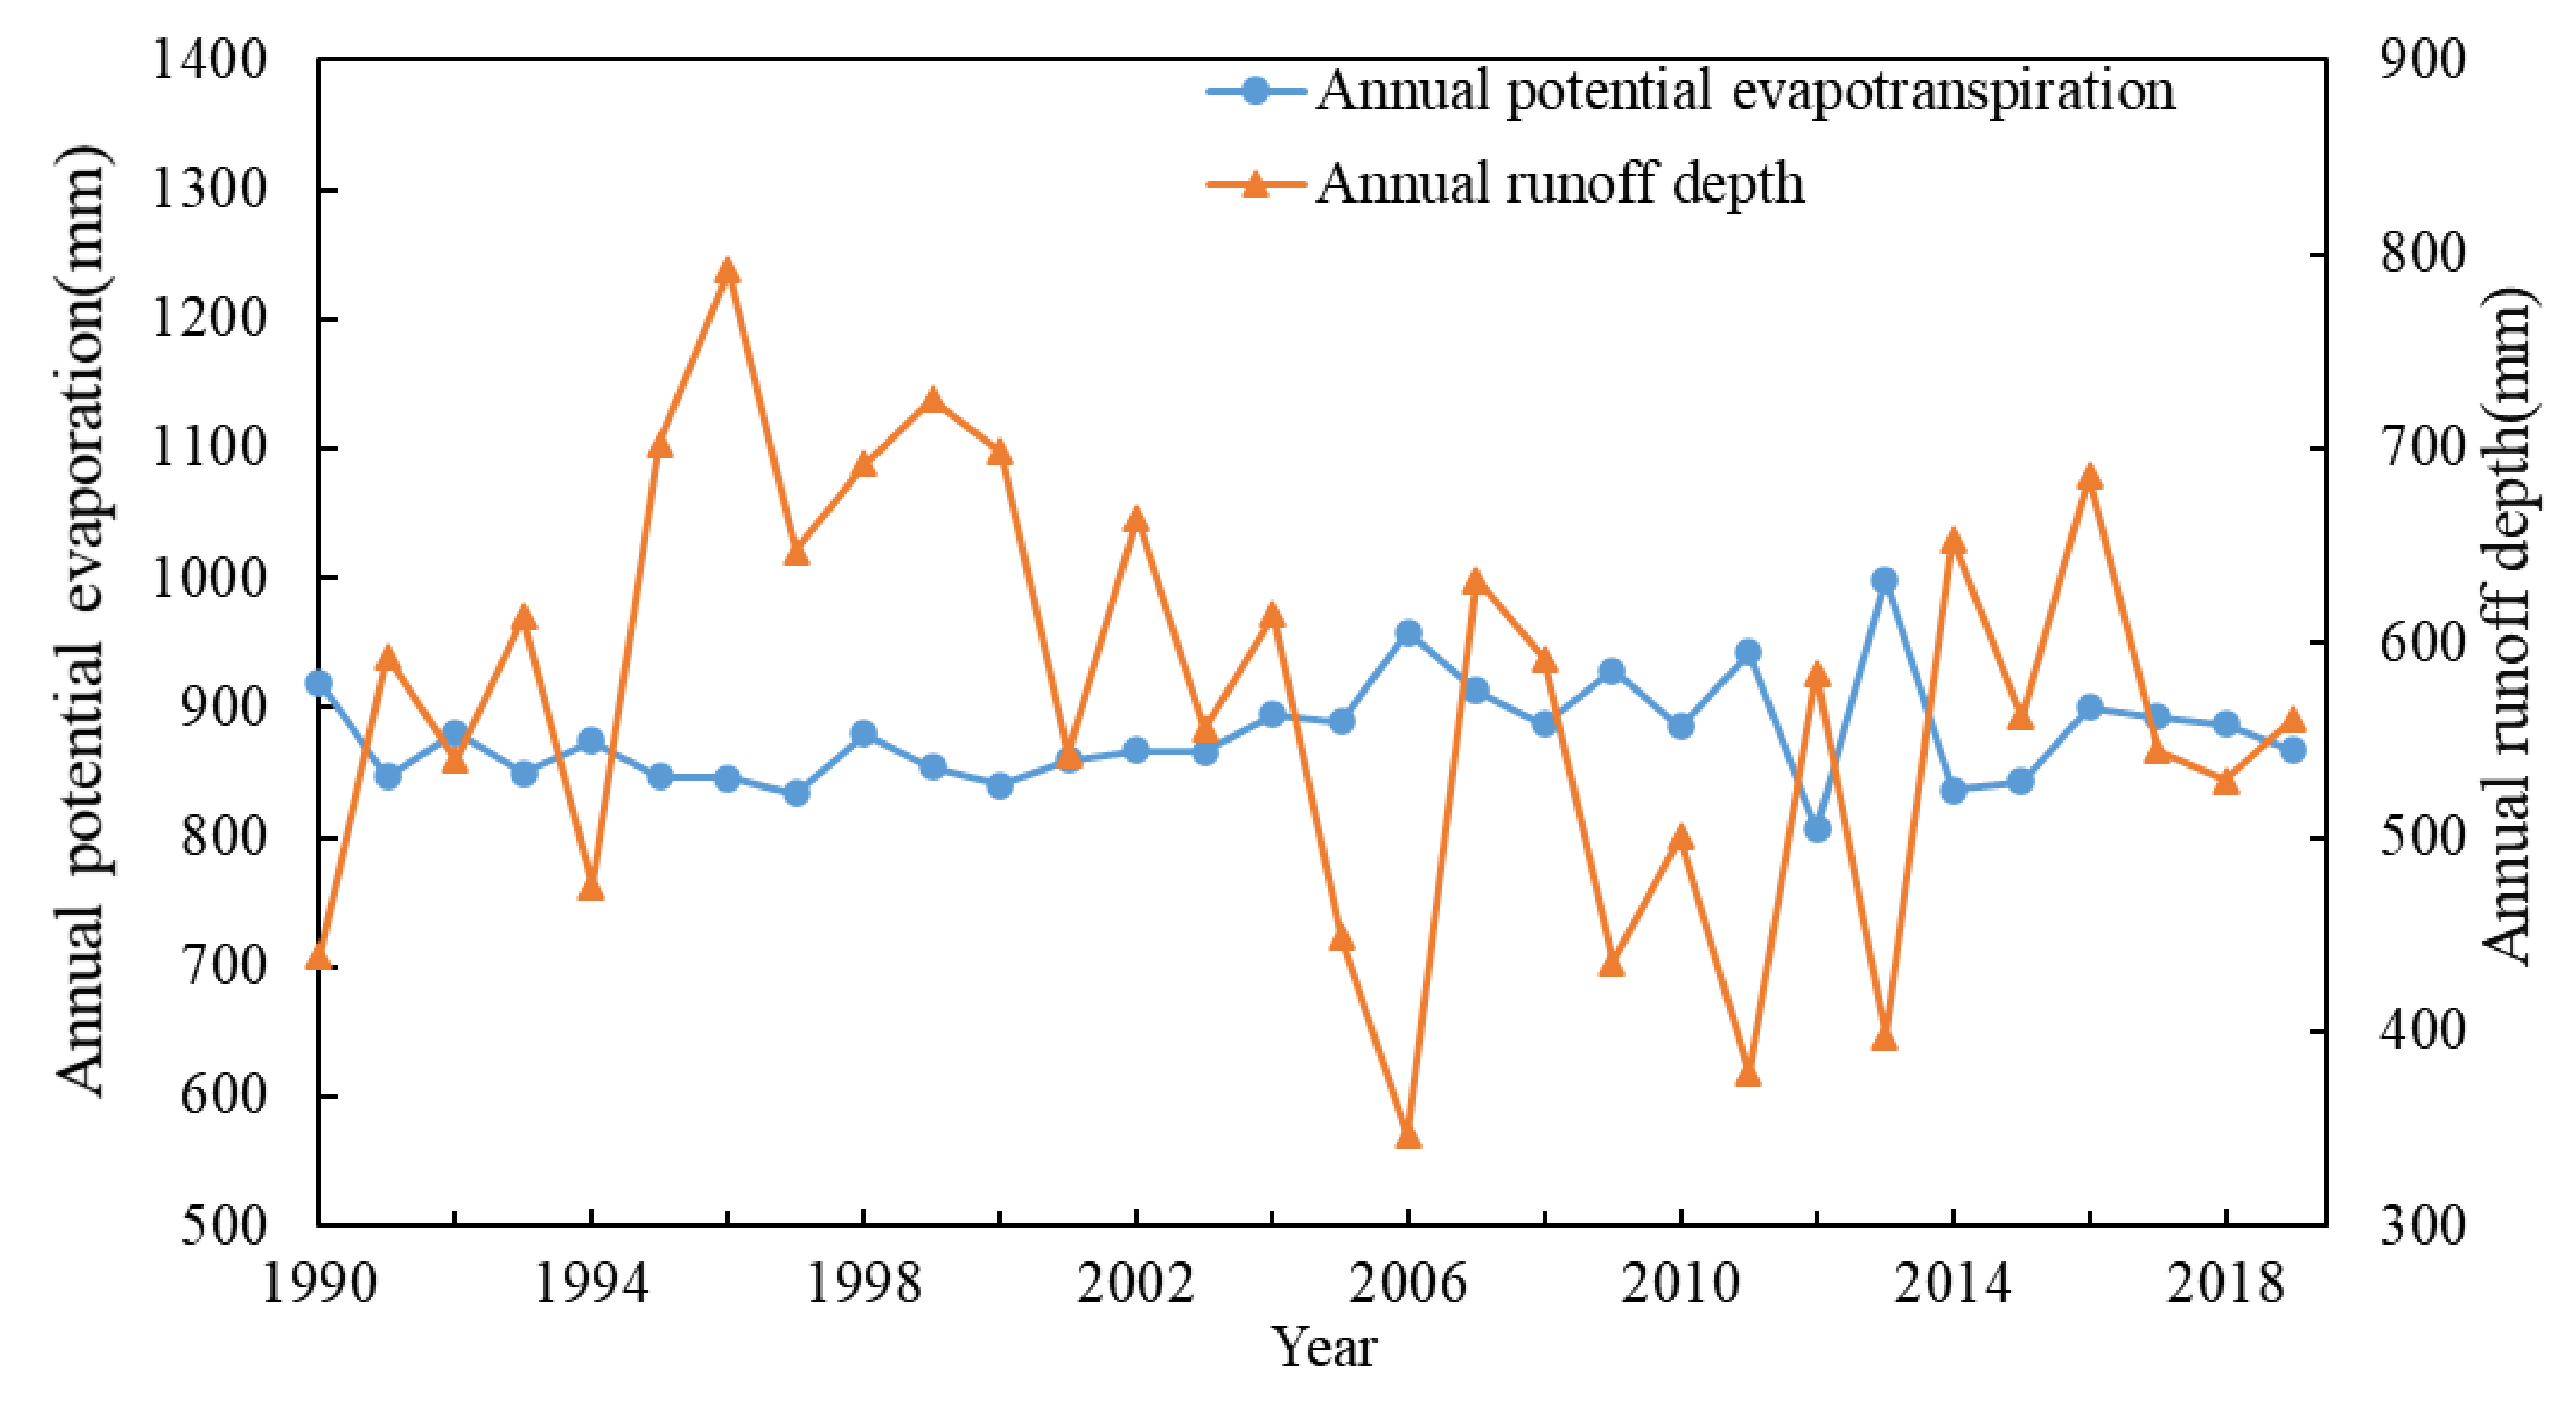
- Yearly runoff depth and precipitation in the WRB exhibited a slight downward trend from 1990 to 2019, with an abrupt change in 2005. Potential evapotranspiration shows a tiny upward trend.
- 2.
- Through the analysis of Wujiang River before and after 2005, among the 32 IHA hydrological change degree indicators selected, 4 indicators are a high level of change, 19 indicators are a moderate change, and 9 indicators are a low change; the comprehensive hydrological change degree of the basin is 46%; and the overall flow is reduced, which belongs to a moderate change.
- 3.
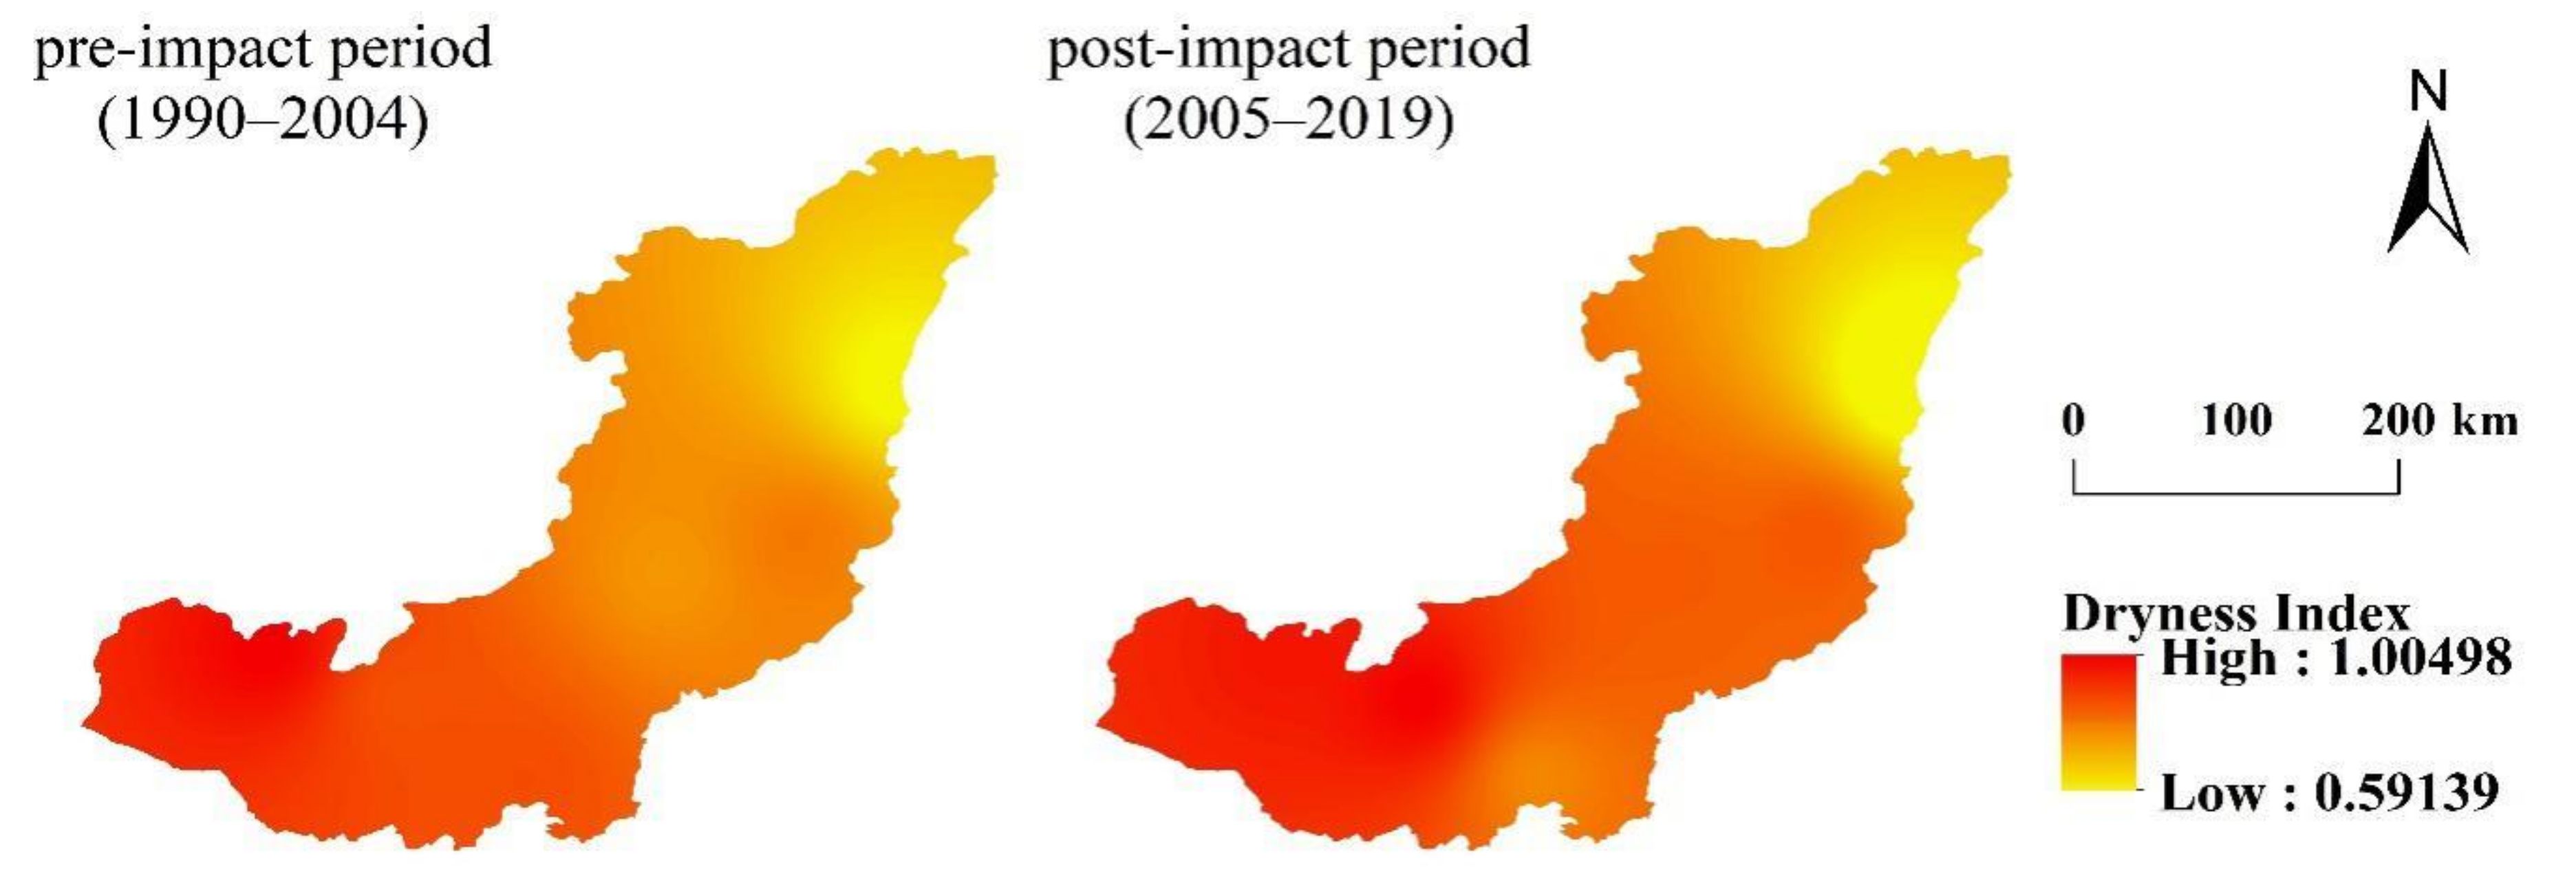
- Based on the Budyko Framework and Choudhury–Yang equation (Equation (6)), the contribution of climate change and the change of the underlying surface to runoff reduction is 73.1% and 26.9%, respectively. The dry climate in the basin is the main reason for the decrease in runoff depth. The decrease in runoff is also due to an increase in the underlying surface parameter n. After 2005, the WRB′s vegetation coverage rose, the extent of built-up land expanded, and reservoir development increased. These are the factors that have contributed to the decrease in the runoff.
Author Contributions
Funding
Institutional Review Board Statement
Informed Consent Statement
Data Availability Statement
Conflicts of Interest
References
- Cloern, J.E.; Abreu, P.C.; Carstensen, J.; Chauvaud, L.; Elmgren, R.; Grall, J.; Greening, H.; Johansson, J.O.R.; Kahru, M.; Sherwood, E.T.; et al. Human activities and climate variability drive fast-paced change across the world’s estuarine-coastal ecosystems. Glob. Change Biol. 2016, 22, 513–529. [Google Scholar] [CrossRef] [PubMed]
- Wu, X.L.; Xiang, X.H.; Chen, X.; Zhang, X.; Hua, W.J. Effects of cascade reservoir dams on the streamflow and sediment transport in the Wujiang River basin of the Yangtze River, China. Inland Waters 2018, 8, 216–228. [Google Scholar] [CrossRef]
- Richter, B.D.; Baumgartner, J.V.; Braun, D.P.; Powell, J. A spatial assessment of hydrologic alteration within a river network. River Res. Appl. 1998, 14, 329–340. [Google Scholar] [CrossRef]
- Richter, B.D.; Baumgartner, J.V.; Powell, J.; Braun, D.P. A Method for Assessing Hydrologic Alteration within Ecosystems. Conserv. Biol. 1996, 10, 1163–1174. [Google Scholar] [CrossRef] [Green Version]
- Huang, Y.; Huang, B.; Qin, T.; Nie, H.; Shen, Z. Assessment of Hydrological Changes and Their Influence on the Aquatic Ecology over the last 58 Years in Ganjiang Basin, China. Sustainability 2019, 11, 4882. [Google Scholar] [CrossRef] [Green Version]
- Yang, M.; Li, X.D.; Huang, J.; Ding, S.; Yi, Y. Damming effects on river sulfur cycle in karst area: A case study of the Wujiang cascade reservoirs. Agric. Ecosyst. Environ. 2020, 294, 106857. [Google Scholar] [CrossRef]
- Gao, B.; Li, J.; Wang, X. Analyzing Changes in the Flow Regime of the Yangtze River Using the Eco-Flow Metrics and IHA Metrics. Water 2018, 10, 1552. [Google Scholar] [CrossRef] [Green Version]
- Ashraf, F.; Haghighi, A.T.; Marttila, H.; Kløve, B. Assessing impacts of climate change and river regulation on flow regimes in cold climate: A study of a pristine and a regulated river in the sub-arctic setting of Northern Europe. J. Hydrol. 2016, 542, 410–422. [Google Scholar] [CrossRef]
- Andaryani, S.; Nourani, V.; Ball, J.; Asl, S.J.; Keshtkar, H.; Trolle, D. A comparison of frameworks for separating the impacts of human activities and climate change on river flow in existing records and different near-future scenarios. Hydrol. Processes 2021, 35, e14301. [Google Scholar] [CrossRef]
- Xu, X.; Yang, D.; Yang, H.; Lei, H. Attribution analysis based on the Budyko hypothesis for detecting the dominant cause of runoff decline in Haihe basin. J. Hydrol. 2014, 510, 530–540. [Google Scholar] [CrossRef]
- Liu, H.; Wang, Z.; Ji, G.X.; Yue, Y.L. Quantifying the Impacts of Climate Change and Human Activities on Runoff in the Lancang River Basin Based on the Budyko Hypothesis. Water 2020, 12, 3501. [Google Scholar] [CrossRef]
- He, Y.; Song, J.X.; Hu, Y.Y.; Tu, X.; Zhao, Y. Impacts of different weather conditions and landuse change on runoff variations in the Beiluo River Watershed, China. Sustain. Cities Soc. 2019, 50, 101674. [Google Scholar] [CrossRef]
- Zuo, L.Y.; Gao, J.B.; Du, F.J. The pairwise interaction of environmental factors for ecosystem services relationships in karst ecological priority protection and key restoration areas. Ecol. Indic. 2021, 131, 108125. [Google Scholar] [CrossRef]
- Chen, S.B.; Chen, L.; Gao, Y.; Guo, J.S.; Li, L.F.; Shen, Z.Y. Larger phosphorus flux triggered by smaller tributary watersheds in a river reservoir system after dam construction. J. Hydrol. 2021, 601, 126819. [Google Scholar] [CrossRef]
- Zhao, L.; Guo, Y.N.; Meng, B.; Yao, H.; Feng, X.B. Effects of damming on the distribution and methylation of mercury in Wujiang River, Southwest China. Chemosphere 2017, 185, 780–788. [Google Scholar] [CrossRef]
- Wang, J.C.; Peng, T.; Shen, T.Y. Temporal and Spatial Variation Characteristics Analysis of Precipitation Days and Intensity over the Wujiang River Basin in Flood Season. J. Coast. Res. 2019, 93, 209–219. [Google Scholar] [CrossRef]
- Wang, L.N.; Shao, Q.X.; Chen, X.H.; Li, Y.; Wang, D.G. Flood changes during the past 50 years in Wujiang River, South China. Hydrol. Processes 2012, 26, 3561–3569. [Google Scholar] [CrossRef]
- Gocic, M.; Trajkovic, S. Analysis of changes in meteorological variables using Mann-Kendall and Sen’s slope estimator statistical tests in Serbia. Glob. Planet. Change 2013, 100, 172–182. [Google Scholar] [CrossRef]
- Yang, H.; Yang, D.; Lei, Z.; Sun, F. New analytical derivation of the mean annual water-energy balance equation. Water Resour. Res. 2008, 44, 893–897. [Google Scholar] [CrossRef]
- Choudhury, B. Evaluation of an empirical equation for annual evaporation using field observations and results from a biophysical model. J. Hydrol. 1999, 216, 99–110. [Google Scholar] [CrossRef]
- Duan, W.X.; Guo, S.L.; Wang, J.; Liu, D.D. Impact of Cascaded Reservoirs Group on Flow Regime in the Middle and Lower Reaches of the Yangtze River. Water 2016, 8, 218. [Google Scholar] [CrossRef] [Green Version]
- Song, X.X.; Zhuang, Y.H.; Wang, X.L.; Li, E.H. Combined Effect of Danjiangkou Reservoir and Cascade Reservoirs on Hydrologic Regime Downstream. J. Hydrol. Eng. 2018, 23, 05018008. [Google Scholar] [CrossRef]
- Cui, T.; Tian, F.Q.; Yang, T.; Wen, J.; Khan, M.Y.A. Development of a comprehensive framework for assessing the impacts of climate change and dam construction on flow regimes. J. Hydrol. 2020, 590, 125358. [Google Scholar] [CrossRef]
- Lu, W.W.; Lei, H.M.; Yang, D.W.; Tang, L.H.; Miao, Q.H. Quantifying the impacts of small dam construction on hydrological alterations in the Jiulong River basin of Southeast China. J. Hydrol. 2018, 567, 382–392. [Google Scholar] [CrossRef]
- Song, X.X.; Zhuang, Y.H.; Wang, X.L.; Li, E.H.; Zhang, Y.Y.; Lu, X.R.; Yang, J.; Liu, X. Analysis of Hydrologic Regime Changes Caused by Dams in China. J. Hydrol. Eng. 2020, 25, 05020003. [Google Scholar] [CrossRef]
- Zheng, Y.T.; Huang, Y.F.; Zhou, S.; Wang, K.Y.; Wang, G.Q. Effect partition of climate and catchment changes on runoff variation at the headwater region of the Yellow River based on the Budyko complementary relationship. Sci. Total Environ. 2018, 643, 1166–1177. [Google Scholar] [CrossRef]
- Yang, H.B.; Qi, J.; Xu, X.Y.; Yang, D.W.; Lv, H.F. The regional variation in climate elasticity and climate contribution to runoff across China. J. Hydrol. 2014, 517, 607–616. [Google Scholar] [CrossRef]
- Roderick, M.L.; Farquhar, G.D. A simple framework for relating variations in runoff to variations in climatic conditions and catchment properties. Water Resour. Res. 2011, 47, W00G07. [Google Scholar] [CrossRef]
- Li, H.J.; Shi, C.X.; Sun, P.C.; Zhang, Y.S.; Collins, A.L. Attribution of runoff changes in the main tributaries of the middle Yellow River, China, based on the Budyko model with a time-varying parameter. Catena 2021, 206, 105557. [Google Scholar] [CrossRef]
- Yu, K.X.; Zhang, X.; Xu, B.X.; Li, P.; Zhang, X.M.; Li, Z.B.; Zhao, Y. Evaluating the impact of ecological construction measures on water balance in the Loess Plateau region of China within the Budyko framework. J. Hydrol. 2021, 601, 126596. [Google Scholar] [CrossRef]
- Tian, X.J.; Zhao, G.J.; Mu, X.M.; Zhang, P.F.; Tian, P.; Gao, P.; Sun, W.Y. Hydrologic alteration and possible underlying causes in the Wuding River, China. Sci. Total Environ. 2019, 693, 133556. [Google Scholar] [CrossRef] [PubMed]
- Kazemi, H.; Hashemi, H.; Maghsood, F.F.; Hosseini, S.H.; Sarukkalige, R.; Jamali, S.; Berndtsson, R. Climate vs. Human Impact: Quantitative and Qualitative Assessment of Streamflow Variation. Water 2021, 13, 2404. [Google Scholar] [CrossRef]
- Li, D.; Pan, M.; Cong, Z.T.; Zhang, L.; Wood, E. Vegetation control on water and energy balance within the Budyko framework. Water Resour. Res. 2013, 49, 969–976. [Google Scholar] [CrossRef]
- Wang, H.N.; Lv, X.Z.; Zhang, M.Y. Sensitivity and attribution analysis of vegetation changes on evapotranspiration with the Budyko framework in the Baiyangdian catchment, China. Ecol. Indic. 2021, 120, 106963. [Google Scholar] [CrossRef]
- Li, T.S.; Xia, J.; She, D.X.; Cheng, L.; Zou, L.; Liu, B.J. Quantifying the Impacts of Climate Change and Vegetation Variation on Actual Evapotranspiration Based on the Budyko Hypothesis in North and South Panjiang Basin, China. Water 2020, 12, 508. [Google Scholar] [CrossRef] [Green Version]
- Zhao, G.J.; Tian, P.; Mu, X.M.; Jiao, J.Y.; Wang, F.; Gao, P. Quantifying the impact of climate variability and human activities on streamflow in the middle reaches of the Yellow River basin, China. J. Hydrol. 2014, 519, 387–398. [Google Scholar] [CrossRef]
- Mittal, N.; Bhave, A.G.; Mishra, A.; Singh, R. Impact of Human Intervention and Climate Change on Natural Flow Regime. Water Resour. Manag. 2016, 30, 685–699. [Google Scholar] [CrossRef] [Green Version]
- Zhang, Q.; Xiao, M.Z.; Liu, C.L.; Singh, V.P. Reservoir-induced hydrological alterations and environmental flow variation in the East River, the Pearl River basin, China. Stoch. Environ. Res. Risk Assess. 2014, 28, 2119–2131. [Google Scholar] [CrossRef]
- Wang, D.B.; Hejazi, M. Quantifying the relative contribution of the climate and direct human impacts on mean annual streamflow in the contiguous United States. Water Resour. Res. 2011, 47, W00J12. [Google Scholar] [CrossRef] [Green Version]


| IHA Statistics Group | Regime Characteristics | Hydrologic Parameters |
|---|---|---|
| Group 1: Magnitude of monthly flow conditions | Magnitude and timing | Monthly flow for each calendar month |
| Group 2: Magnitude and duration of annual extreme flow conditions | Magnitude and duration | Annual minimum 1-day, 3-day, 7-day, 30-day, and 90-day medians Annual maximum 1-day, 3-day, 7-day, 30-day, and 90-day medians |
| Group 3: Timing of annual extreme flow conditions | Timing | Date of annual 1-day maximum flowDate of annual 1-day minimum flow |
| Group 4: Frequency and duration of high and low pulses | Magnitude, frequency, and duration | Number of high pulses in each year Number of low pulses in each year Median duration of the annual high pulse Median duration of the annual low pulse |
| Group 5: Rate and frequency of flow condition changes | Frequency and rate of change | Medians of all positive differences between consecutive daily values (rise rate) Medians of all negative differences between consecutive daily values (fall rate) Number of reversals |
| Paraments | R | P | ET0 |
|---|---|---|---|
| Statistic | −1.249 | −0.3568 | 1.463 |
| Test | |||
| Abrupt year | 2005, 2015, 2018 | 2005, 2015, 2017 | 2004 |
| Median Value | IHA Threshold | ||||||
|---|---|---|---|---|---|---|---|
| Pre-Impact Period | Post-Impact Period | Low | High | ||||
| January | 475 | 544 | 436.2 | 555.8 | 3 | 5 | −40 |
| February | 461 | 522 | 418.8 | 507.8 | 3 | 5 | −40 |
| March | 709 | 725 | 522.1 | 823.8 | 9 | 5 | 80 |
| April | 990 | 1195 | 842.7 | 1086 | 3 | 5 | −40 |
| May | 1840 | 2110 | 1686 | 1989 | 3 | 5 | −40 |
| June | 2820 | 2270 | 2138 | 3237 | 8 | 5 | 60 |
| July | 3460 | 2240 | 2442 | 3729 | 7 | 5 | 40 |
| August | 1530 | 1250 | 1172 | 2244 | 5 | 5 | 0 |
| September | 972.5 | 1125 | 891.7 | 1194 | 4 | 5 | −20 |
| October | 895 | 882 | 822.7 | 1344 | 9 | 5 | 80 |
| November | 834 | 747.5 | 622.3 | 858.9 | 7 | 5 | 40 |
| December | 561 | 618 | 520.2 | 617.6 | 2 | 5 | −60 |
| 1-day minimum | 300 | 329 | 280.2 | 342 | 7 | 6 | 16.67 |
| 3-day minimum | 308 | 370 | 294.8 | 353.8 | 6 | 5 | 20 |
| 7-day minimum | 339.1 | 377.4 | 323.1 | 381.4 | 6 | 5 | 20 |
| 30-day minimum | 418.5 | 462.4 | 393.1 | 443.9 | 4 | 5 | −20 |
| 90-day minimum | 592.1 | 576.1 | 512.7 | 636.1 | 7 | 5 | 40 |
| 1-day maximum | 13,100 | 6620 | 11,980 | 16,260 | 3 | 5 | −40 |
| 3-day maximum | 11,200 | 5620 | 9433 | 13,660 | 1 | 5 | −80 |
| 7-day maximum | 8534 | 4864 | 7756 | 10,530 | 3 | 5 | −40 |
| 30-day maximum | 5553 | 3538 | 4615 | 6121 | 3 | 5 | −40 |
| 90-day maximum | 3617 | 2552 | 3400 | 3880 | 3 | 5 | −40 |
| Base flow index | 0.2199 | 0.2847 | 0.1949 | 0.2512 | 4 | 5 | −20 |
| Date of minimum | 32 | 57 | 26.96 | 48.44 | 3 | 5 | −40 |
| Date of maximum | 187 | 183 | 178.4 | 193.4 | 4 | 5 | −20 |
| Low pulse count | 6 | 15 | 4.28 | 8 | 2 | 6 | −66.66 |
| Low pulse duration | 6 | 2 | 3.42 | 8.44 | 4 | 5 | −20 |
| High pulse count | 11 | 10 | 10 | 12.72 | 4 | 7 | −42.86 |
| High pulse duration | 4 | 3.5 | 3.64 | 5 | 4 | 6 | −33.33 |
| Rise rate | 73 | 100 | 67.84 | 88.32 | 3 | 5 | −40 |
| Fall rate | −67 | −115 | −80 | −63.28 | 1 | 6 | −83.33 |
| Number of reversals | 136 | 178 | 130.8 | 145.9 | 2 | 5 | −60 |
| Hydrological Station | Hydrological Change Degree of Each Group | Overall Hydrological Change | ||||
|---|---|---|---|---|---|---|
| Group 1 | Group 2 | Group 3 | Group 4 | Group 5 | ||
| Wulong | 50% (M) | 38% (M) | 32% (L) | 44% (M) | 64% (M) | 46% (M) |
| Period | P/mm | R/mm | ET0/mm | n | Elasticity Coefficients | ||
|---|---|---|---|---|---|---|---|
| 1990–2004 | 1151.45 | 619.71 | 863.81 | 1.123 | 1.498 | −0.4977 | −0.52 |
| 2005–2019 | 1076.74 | 523.52 | 895.7 | 1.219 | 1.587 | −0.5878 | −0.595 |
| 1990–2019 | 1114.10 | 571.62 | 879.76 | 1.168 | 1.54 | −0.54 | −0.55 |
| −59.03 | −11.19 | −25.84 | −96.06 | −96.2 | 61.45% | 11.65% | 26.90% |
| Land-Use Pattern (km2) (%) | ||||||
|---|---|---|---|---|---|---|
| Year | Agriculture Land | Forest Land | Grass Land | Water Body | Built-up Land | Barren Land |
| 1990 | 26,603.3 (30.27%) | 45,710.5 (52.00%) | 14,974.0 (17.04%) | 299.6 (0.34%) | 300.6 (0.34%) | 12.0 (0.01%) |
| 1995 | 26,595.3 (30.26%) | 45,699.5 (51.99%) | 14,990.0 (17.05%) | 300.6 (0.34%) | 302.6 (0.34%) | 12.0 (0.01%) |
| 2000 | 26,826.7 (30.52%) | 45,218.5 (51.44%) | 15,216.5 (17.31%) | 303.6 (0.35%) | 322.6 (0.37%) | 12.0 (0.01%) |
| 2005 | 26,880.8 (30.58%) | 45,665.4 (51.95%) | 14,685.4 (16.70%) | 316.6 (0.36%) | 340.7 (0.39%) | 11.0 (0.01%) |
| 2010 | 26,748.6 (30.43%) | 45,745.6 (52.04%) | 14,642.3 (16.65%) | 322.6 (0.37%) | 429.9 (0.49%) | 11.0 (0.01%) |
| 2015 | 26,414.9 (30.05%) | 45,610.3 (51.89%) | 14,564.2 (16.57%) | 342.7 (0.39%) | 958.9 (1.09%) | 9.0 (0.01%) |
Publisher’s Note: MDPI stays neutral with regard to jurisdictional claims in published maps and institutional affiliations. |
© 2021 by the authors. Licensee MDPI, Basel, Switzerland. This article is an open access article distributed under the terms and conditions of the Creative Commons Attribution (CC BY) license (https://creativecommons.org/licenses/by/4.0/).
Share and Cite
Guo, W.; Hu, J.; Wang, H. Analysis of Runoff Variation Characteristics and Influencing Factors in the Wujiang River Basin in the Past 30 Years. Int. J. Environ. Res. Public Health 2022, 19, 372. https://doi.org/10.3390/ijerph19010372
Guo W, Hu J, Wang H. Analysis of Runoff Variation Characteristics and Influencing Factors in the Wujiang River Basin in the Past 30 Years. International Journal of Environmental Research and Public Health. 2022; 19(1):372. https://doi.org/10.3390/ijerph19010372
Chicago/Turabian StyleGuo, Wenxian, Jianwen Hu, and Hongxiang Wang. 2022. "Analysis of Runoff Variation Characteristics and Influencing Factors in the Wujiang River Basin in the Past 30 Years" International Journal of Environmental Research and Public Health 19, no. 1: 372. https://doi.org/10.3390/ijerph19010372