Article

The Assessment of Indoor Formaldehyde and Bioaerosol Removal by Using Negative Discharge Electrostatic Air Cleaners

1
Institute of Environmental Engineering and Management, National Taipei University of Technology, Taipei 106344, Taiwan
2
Union Professional Group of Architecture, Taipei 110057, Taiwan
*
Author to whom correspondence should be addressed.
Int. J. Environ. Res. Public Health 2022, 19(12), 7209; https://doi.org/10.3390/ijerph19127209
Submission received: 26 April 2022 / Revised: 9 June 2022 / Accepted: 10 June 2022 / Published: 12 June 2022

Abstract

:
This study investigated the single-pass performance of a negative corona electrostatic precipitators (ESP) in removing suspended particulates (PM2.5 and PM10), formaldehyde (HCHO), and bioaerosols (bacteria and fungi) and measured the ozone (O3) concentration generated by ESP. The experimental results revealed that if the operational conditions for the ESP were set to high voltage (−10.5 kV) and low air flow rate (2.4 m3/min), ESP had optimal air pollutant removal efficiency. In the laboratory system, its PM2.5 and PM10 removal rates both reached 99% at optimal conditions, and its HCHO removal rate was 55%. In field tests, its PM2.5, PM10, HCHO, bacteria, and fungi removal rates reached 89%, 90%, 46%, 69%, and 85% respectively. The ESP in the laboratory system (−10.5 kV and 2.4 m3/min) generated 7.374 ppm of O3 under optimal conditions. Under the same operational conditions, O3 generated by ESP in the food waste storage room and the meeting room were 1.347 ppm and 1.749 ppm, respectively. The removal of HCHO and bioaerosols was primarily attributed to their destruction in the corona, as well as ozone oxidation, and collection on the dust collection plate.

1. Introduction

Electrostatic precipitator (ESP) air cleaners are widely used to reduce industrial and general indoor air pollution. They have a suspended particulate removal efficiency of 99% [1,2,3,4]. For ultrafine particles with a particle diameter smaller than 0.3 µm, the removal rate ranges 60–99% [5,6,7]. In an ESP, gaseous air pollutants and bioaerosols (bacteria and fungi) are removed by using a high-voltage discharge to charge suspended particulates; these particulates are then collected using dust collection plates. The collection rate increases as the discharge voltage increases [8,9,10]. During the ESP discharge process, the air surrounding the discharge electrode can form a plasma, which destroys gaseous air pollutants [11,12,13]. Han et al. (2017) [14] studied bioaerosol removal efficiency at ESP and discovered that, during the charging process, the removal amount of charged bioaerosols was proportional to the square of particle diameter. As the particle diameter increased, the removal efficiency increased, achieving 70%. Kim et al. (2018) [15] developed a new ESP with a gaseous pollutant (acetic acid, acetaldehyde, and ammonia) removal rate of 58–98%. They found that, if the air flow speed passing through the ESP was low, the pollutants stayed in the corona area for a longer time, resulting an increase in the removal rate. The corona discharge of ESP has favorable HCHO removal efficiencies [16]. Yuan et al. (2020) [17] reported that corona discharge could reduce the concentration of HCHO from 0.8 ppm to 0 ppm in 13 min. An ESP is commonly paired with a downstream catalyst to increase the HCHO removal rate and to reduce the amount of O3 generated [18,19].
ESPs generate O3 during the discharge process. Although O3 can oxidize and remove air pollutants, such as volatile organic compounds and bioaerosols [8,20], excessive O3 production causes secondary pollution. On the basis of the polarity of the discharge electrodes, ESPs can be classified as positive or negative corona ESPs. At the same operational voltage, negative corona ESPs have higher suspended particulate removal rates but also generate more O3 [21,22]. The O3 concentration produced by negative corona ESPs can reach five times that produced by positive corona ESPs [23,24]. The amount of O3 generated is also positively correlated with the ESP discharge voltage [25]. Generally speaking, the O3 concentration generated by positive corona ESPs is lower; thus, most commercial ESP air cleaners are positive corona ESPs. In the air, O3 easily forms unstable free radicals, which can destroy the external membranes of cells, resulting in the leakage of cytoplasm and effectively killing bacteria and fungi [20,26,27].
Many studies have confirmed that ESP has a high efficiency in removing suspended particulates. However, for the removal of gaseous pollutants and bioaerosols, other equipment (such as activated carbon filter or UVGI, etc.) is usually used instead, and the potential of gaseous pollutants and bioaerosols removal of ESP is not well identified. Therefore, this study focuses on the impact of negative discharge on air pollution and the contribution of O3 in the process of removing air pollutants. In this study, the air pollutant removal performance of a negative corona ESP was explored. Performance was measured for removal of suspended particulates (PM2.5 and PM10), formaldehyde (HCHO), and bioaerosols (bacteria and fungi). The O3 concentration generated during the ESP discharging process was also measured. In the experiment, ESP performance was first investigated in the laboratory. Next, ESP was placed in field test environments (a food waste storage room and a meeting room) to assess its actual air pollutant removal performance.

2. Materials and Methods

2.1. Experimental Apparatus and Analysis Methods

In this study, we randomly selected ESP air cleaner on the market without qualifications. A negative corona ESP air cleaner was used. The negative corona discharge electrode modules were wire-to-cylinder structures, and the collection plate consists of 136 groups of cylinders with a radius of 0.75 cm and a height of 2 cm (Figure 1), and the dust collection plate was multiple sets of cylindrical structures with an effective dust collection area of 0.13 m2. The ESP inlet and outlet areas were both 0.04 m2. The voltage of the ESP could be set to a low (−6 kV) or high (−10.5 kV) negative voltage. The operational air flow rate could be set to low (2.4 m3/min, 0.04 m3/s) or high (4.8 m3/min, 0.08 m3/s).
The concentrations of five air pollutants were measured, namely suspended particulates (PM2.5 and PM10), HCHO, bioaerosols (bacteria and fungi), and O3. Table 1 presents the parameters of the experimental devices. A device was used to measure the real-time concentration of air pollutants at the ESP inlet (Cin) and outlet (Cout). For each experiment, at least five groups of data were recorded consecutively. The measurement duration for each group of data was 2–5 min. The mean concentration of the measurement data of Cin and Cout at the steady state was then calculated. Every experiment involved two repeated tests, and the difference between the mean values from the two experiments was within ±10% except for the difference between the mean bioaerosol values, which was within ±20%. Finally, the mean concentrations of air pollutants (Cin and Cout) were used to calculate ESP pollutant removal efficiency (Equation (1)).
Removal   efficiency   ( % ) = [ ( C in     C out ) C in ]   ×   100 %
The bioaerosols (bacteria and fungi) sample collection and cultivation methods adopted in this study were in accordance with the standard method for analyzing bacteria and fungi concentrations in air (NIEA E301.12C and NIEA E401.12C [28,29]) announced by the Environmental Protection Administration of Taiwan. To collect bacteria and fungi samples, an Anderson two-stage sampler was utilized to collect strains and spores in the air. Petri dishes with the collected samples were sent to the laboratory for cultivation. Bacteria and fungi were cultivated at 30 °C for 48 ± 1 h and at 25 °C for 96 ± 12 h, respectively. After cultivation, the colony counts of the bacteria and fungi samples were calculated. The total colony count in the air in the sample was then calculated with Equation (2). For bacteria and fungi sampling, at least two repeat tests were conducted. Before sampling, a flow calibrator was used to calibrate the flow of the Andersen two-stage sampler. The difference between the flow before and after sampling was set to be smaller than ±10%. The limit of detection (LOD) of the bacteria and fungi sampling method was determined in accordance with the analysis method disclosed by the Environmental Protection Administration of Taiwan (Equation (3)).
Bioaerosol   Conc . ( CFU m 3 ) = Colony   forming   unit ( CFU ) Flow   28.3 ( L min ) × Time   Sampling   ( min ) × 1000 ( L m 3 )
LOD = 1000 28.3 × 2 18 CFU m 3
On the basis of the size of the particles, the charging effect of ESP on particles can be classified as having two mechanisms: diffusion charging and field charging [30]. Before calculating the theoretical particle removal efficiency, the unit electric charge that a particle could obtain was calculated for diffusion charging and for field charging by using Equations (4) and (5), respectively. Equation (6) was then used to calculate the terminal velocity of particles in ESP.
n = DkT 2 K E e 2 ln   [ 1 + π K E Dc i e 2 N i t 2 kT ]
n = 3 ε ε + 2 [ ED 2 4 K E e ] [ π K E eZ i tN i 1 + π K E eZ i tN i ]
V = neEC c 3 π μ D
Here, n is the charge of a particle (C), D is the diameter of the particle (μm), T is the absolute temperature (K), k is the Boltzmann constant (N∙m/k), KE is the electrostatic constant (N∙m2/C2), e is the charge of the electron (C), Ci is the mean thermal motion of radicals (m/s), Ni is the ion concentration (radicals/m3), t is the residence time (s), ε is the dielectric constant of the particle (C2/N∙m2), E is the electric field strength (V/m), Zi is the electric mobility of radicals (m2/V∙s), V is the terminal velocity (m/s), µ is the viscosity coefficient of gas (N∙s/m2), and Cc is the slip coefficient.
After obtaining the terminal velocity of the particles in ESP, the Deutsch–Anderson equation (Deutsch, 1992) [31] was used to calculate the theoretical removal rate. ɳ is the total removal rate (%) under the two mechanisms of diffusion charging and field charging, A is the effective area of the ESP dust collection plate (m2), V is the terminal static velocity (m/s), and Q is the inflow air flow rate of the ESP (m/s).
ɳ = [ 1 exp ( AV Q ) ] × 100 %

2.2. Laboratory Test System

In the laboratory test system (Figure 2), the temperature and relative humidity (RH) were maintained at 24 ± 1 °C and 55 ± 5% RH, respectively. PM2.5, PM10, and HCHO pollutant concentrations were measured. An AGK-2000 suspended particle generator was used to generate the suspended particulates. NaCl(ap) was atomized and then dried to generate the required PM2.5 and PM10 concentrations. Particulates were input to the AGK-2000 through a mixing chamber; dry air (30–50% RH) filtered using activated carbon was input to the mixing chamber and could be used to adjust the concentration of the suspended particulates in the chamber. The standard concentrations listed in Taiwan’s Indoor Air Quality Act (PM2.5: 35 μg/m3∙24 h; PM10: 75 μg/m3∙24 h) were used as a reference; substantially larger concentrations were used as the experimental concentrations (70 ± 10 μg/m3 and 150 ± 20 μg/m3, respectively.) After the suspended particulates passed through the mixing chamber and entered the ESP, a device was used to measure the concentrations of PM2.5 and PM10 in the mixing chamber and at the outlet of the ESP. For the HCHO experiment, paraformaldehyde particles were used to prepare an HCHO solution. High-pressure air filtered with activated carbon was mixed into the HCHO solution, and HCHO was atomized with the aeration atomization method. HCHO gas was added to the mixing chamber and mixed with dry air that had been filtered with activated carbon. In the experimental setting, HCHO’s concentration was 0.400 ± 0.010 ppm (the concentration listed in the Indoor Air Quality Act is 0.08 ppm). HCHO gas then entered ESP. A device was used to measure the concentration of HCHO in the mixing chamber and at the outlet of the ESP.
In the experiment investigating O3 concentrations, we first conducted the O3 background concentration experiment for ESP. In the laboratory testing system, dry air (at 55% RH) that had been filtered with activated carbon and had no added pollutants was fed into ESP. The O3 concentrations at the ESP inlet and outlet were measured. Next, O3 experiments with suspended particulates were conducted. The aerosol generator was used to generate air with a mean concentration of 1081 µg/m3 PM2.5 and 2601 µg/m3 PM10, which was inputted to ESP. The O3 concentrations were measured at the inlet and outlet.

2.3. Environmental Conditions for Field Tests

Field tests were performed in a food waste storage room at a university cafeteria and in a university meeting room. The concentrations of environmental pollutants are presented in Table 2. The food waste storage room had an area of 15.8 m2 and height of 2.5 m. When the experiment was conducted, the indoor temperature and humidity were 26.0 °C and 85% RH, respectively. The food waste storage room was in the basement. The room is humid and warm; thus, it was suitable for the growth of bacteria and fungi. The door to the food waste storage room was kept open. ESP was placed outside the door of the food waste storage room, and its inlet was oriented toward the food waste storage room. Figure 3A presents the layout of the food waste storage room and ESP’s location. Concentrations of PM2.5, PM10, HCHO, and bioaerosols (bacteria and fungi) were measured.
The meeting room had an area of 4.5 m2 and height of 3 m. When the experiment was conducted, indoor temperature and humidity were 23.5 °C and 70% RH, respectively. During the experiment, the air conditioning was not switched on, and the doors and windows were closed. Figure 3B presents the placement of the ESP. Concentrations of bioaerosols (bacteria and fungi) were measured.

3. Results

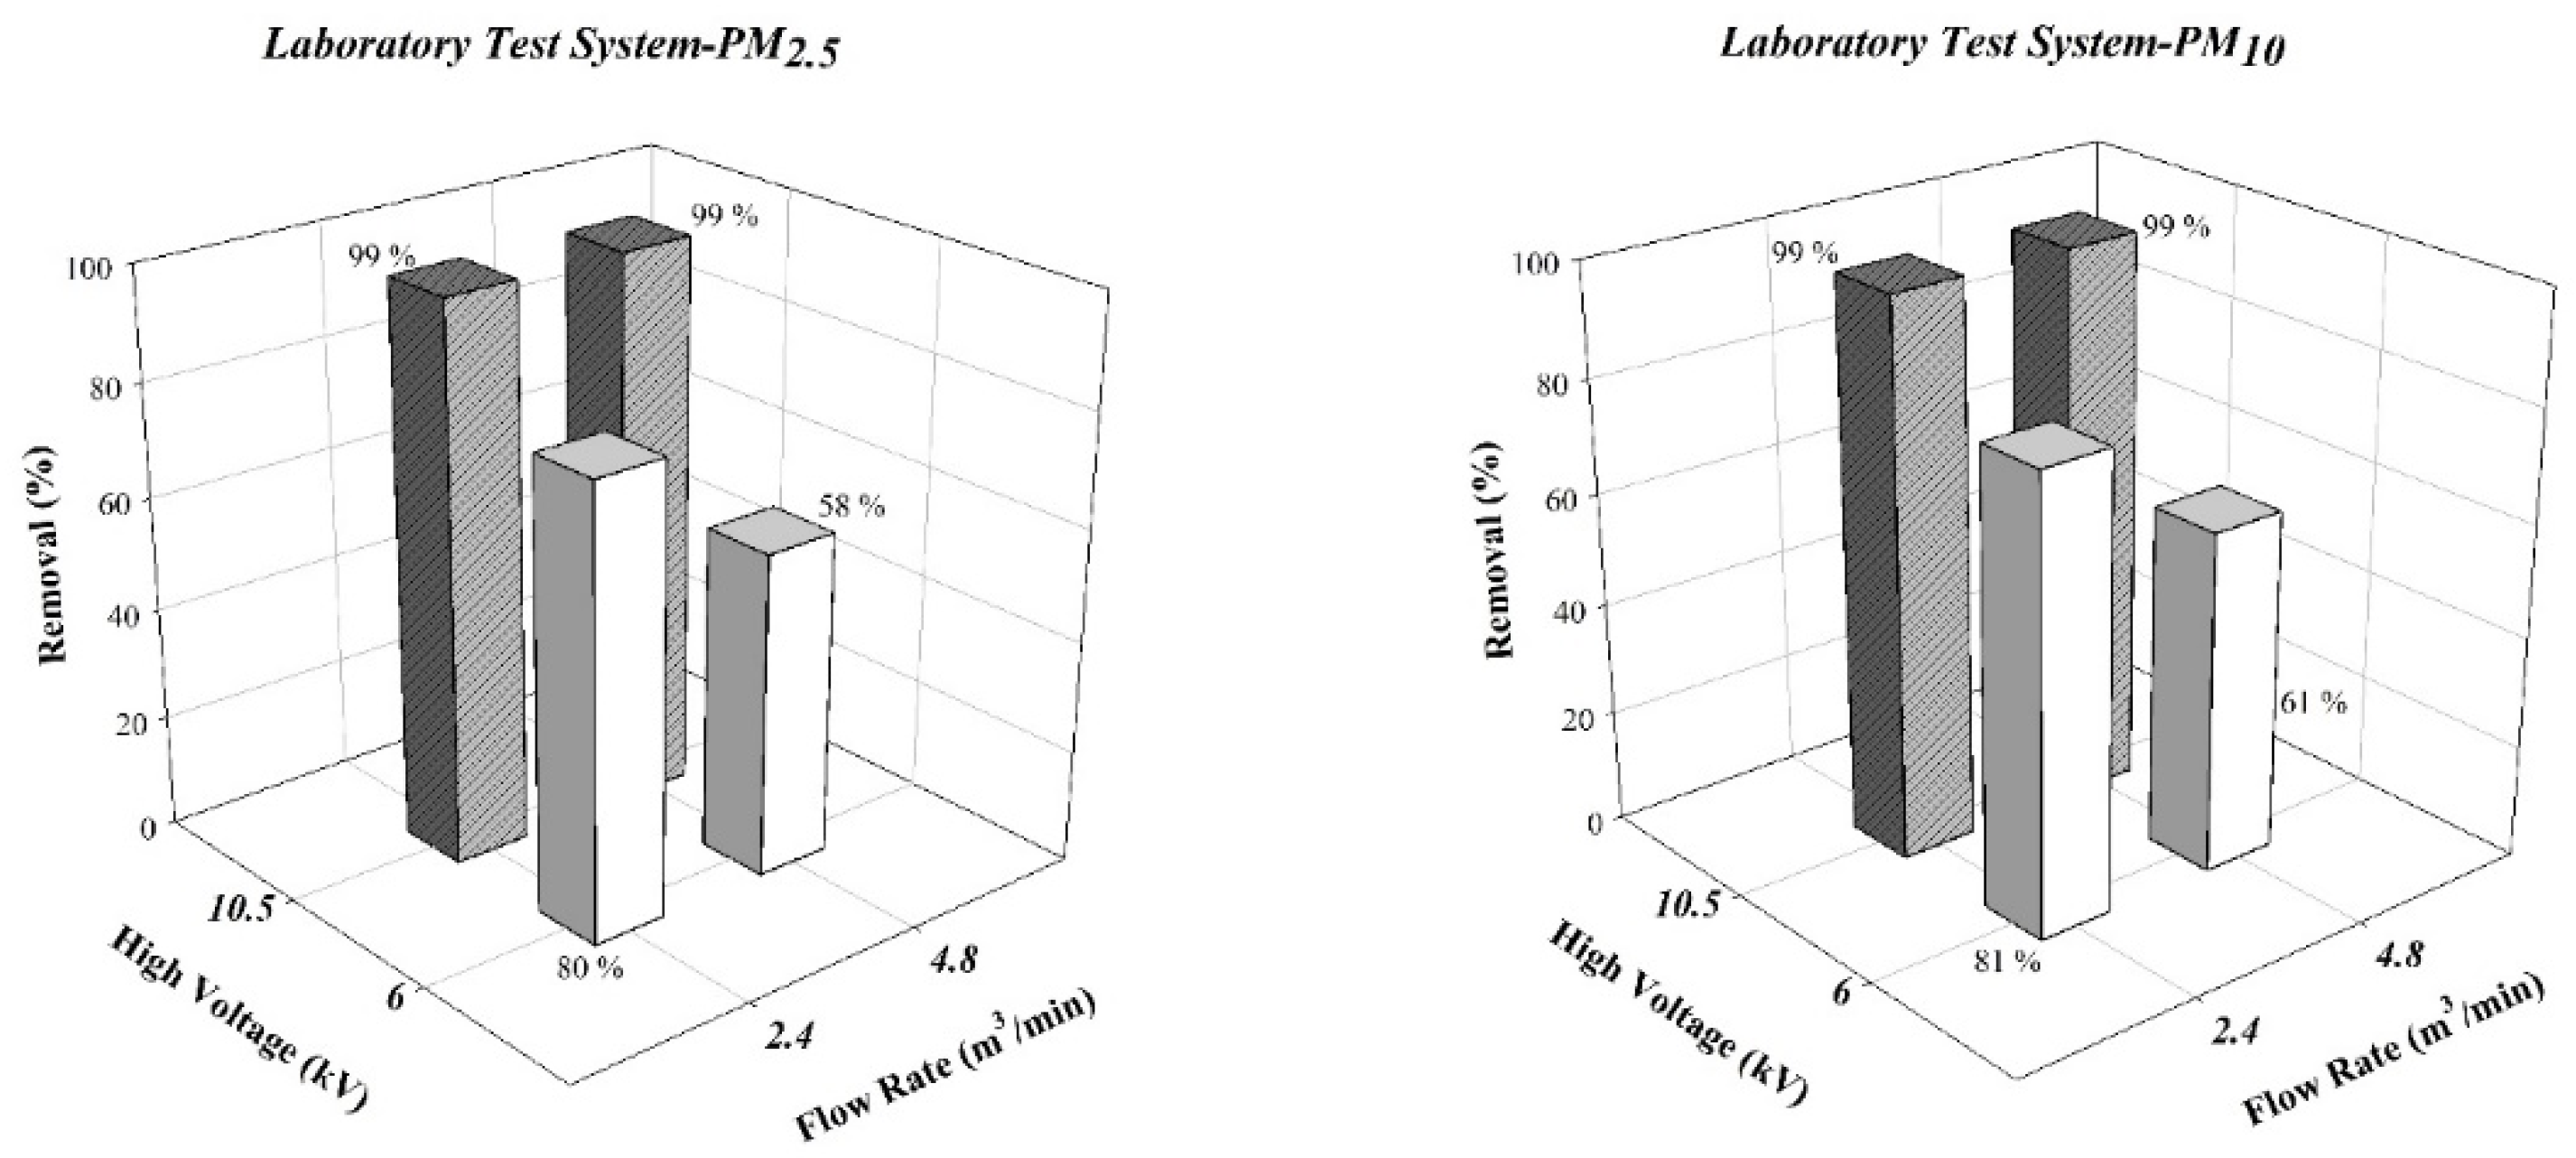
3.1. Assessing ESP Removal Performance for Aerosols

The calculation results of the Deutsch–Anderson equation revealed that, at a discharge voltage of −6 kV and air flow rate of 2.4 m3/min, the theoretical PM2.5 and PM10 removal rates were 80% and 51%, respectively; at 4.8 m3/min, these rates were 81% and 43%, respectively. At −10 kV, the theoretical PM2.5 and PM10 removal rates were 99% at both air flow rates. The results for the laboratory test system are presented in Figure 4. At a discharge voltage was −6 kV, increasing the air flow rate from 2.4 m3/min to 4.8 m3/min reduced the PM2.5 and PM10 removal rates from 80% to 58% and from 81% to 61%, respectively. If the ESP discharge voltage was −10 kV, the PM2.5 and PM10 removal rates were both 99% at both air flow rates. The experimental results for the laboratory test system and the theoretical PM2.5 and PM10 removal rates were in good agreement. Moreover, at a high discharge voltage, ESP had excellent removal efficiency for aerosols.
However, reduced ESP aerosol particle removal rates were observed in the field tests. Figure 5 reveals the experimental results for the food waste storage room. If the ESP discharge voltage was −10 kV, PM2.5 and PM10 removal rates were 89% and 90%, respectively; those for bacteria and fungi were 64% and 85%, respectively. Figure 6 presents the experimental results for the meeting room. The bacteria and fungi removal rates reached 69% and 83%, respectively. The Deutsch–Anderson equation (Equation (7)) was used to calculate theoretical removal rates; the environmental temperature both affects the gas viscosity and reduces particle terminal velocity. However, the temperatures in the laboratory (24 °C) and in the field (23.5–26 °C) did not differ substantially. We inferred that the humidity of the environment was the key reason for the differences in removal efficiencies. In the laboratory test system, the relative humidity was controlled at 55% RH, whereas that at the food waste storage room was at 85% RH. Air flow with high humidity in ESP affected both the strength of the electric field and the size of the ESP corona [32]. Wang and You (2013) [33] discovered that if the humidity of air in the reaction chamber of ESP increased, water molecules were ionized by the corona and agglomerated into water ion groups. Although this phenomenon increased the total number of electric charges in the electric filed, the water ion groups gathered near the discharge electrode and thus reduced the size of the corona field and hindered the electron avalanche process.
The results for suspended particulates and bioaerosols both revealed that discharge voltage had a greater effect on the removal rate than the operational air flow rate of the ESP. If the discharge voltage increased from −6 kV to −10.5 kV, the suspended particulate and bioaerosol removal rates both increased. The experimental results of the field tests (Figure 5 and Figure 6) revealed that PM2.5 removal rates increased from 13–36% to 55–89%, and PM10 removal rates increased from 14–36% to 63–90%. The bioaerosol removal rates in the food waste storage room increased from 28–36% to 60–85%, and those in the meeting room increased from 29–38% to 62–83%. Kawada et al. (2002) [34] suggested that an increase in ESP discharge voltage resulted in an increase in its particle removal rate. At a high discharge voltage, ESP generates a stronger and broader corona field, thus increasing charging efficiencies for particles. With the charging voltage held constant, an increase in the air flow rate from low (2.4 m3/min) to high (4.8 m3/min) reduced the removal rates for both suspended particulates and bioaerosols. If the discharge voltage of the ESP was fixed at −10 kV and the air flow rate was adjusted from 2.4 m3/min to 4.8 m3/min, the optimal suspended particulate removal rate in the food waste storage room was reduced from 89–90% to 55–63%, and the optimal bioaerosol removal rate was reduced from 64–85% to 60–83%. The same trend was observed in the meeting room; the optimal bioaerosol removal rates were reduced from 69–83% to 61–76%. The Deutsch–Anderson equation reveals that if the air flow rate increases, the removal rate decreases because air remains in ESP for a shorter duration, decreasing the charging time for particles in the electric field and the duration that the charged particles can be attracted by the dust collection plate. Thus, particles have an increased probability of passing through the dust collection plate [35].
The bioaerosol experimental results revealed that the bacteria and fungi removal rates in the field tests were both lower than the theoretical removal rates calculated for PM2.5 and PM10. Bioaerosols typically have aerodynamic diameters between 0.1 and 30 µm [36,37]. Analyses of different bacteria were not conducted. Thus, we assumed that most bioaerosols in the field tests had a particle diameter sufficient to become charged by the electric field (i.e., aerodynamic diameter > 1 µm). Fungal spores have larger particle diameters (1–30 μm) than bacteria (0.25–8 μm) [38]. Thus, the bacteria and fungi removal rates were compared with theoretical PM2.5 and PM10 removal rates, respectively. According to the Deutsch–Anderson equation [31], if the particle diameter is large, the removal rate is high. The field experimental results also revealed that the fungi removal rate was higher than that for bacteria. Bioaerosols of 0.1–1 µm are at a transitional size between being affected by field charging and diffusion charging (aerodynamic diameters < 1 µm); thus, they were charged inefficiently, resulting in a reduced removal rate. Field test results also revealed that the bacteria and fungi removal rates were both lower than PM2.5 and PM10 removal rates. We attributed this result to the presence of bioaerosols with electrical resistance in the food waste storage room, resulting in differences between theoretical and experimental PM2.5 and PM10 removal rates. If the outer layers of a microorganisms have the same polarity as the discharge electrode (and thus have electrical resistance), these microorganisms are less likely to be removed by an ESP. Moreover, these bioaerosols affect the charging of other particles in the scope of the corona [39]. The surfaces of airborne microorganisms contain several chemical substances that can be ionized, such as proteins, amino groups (–NH2), and carboxyl groups (–COOH). These cause microorganisms to carry charges in their natural state. However, charges on microorganisms also have other origins and further complexity. If a bioaerosol is covered by a liquid droplet, it may carry both positive and negative charges. When the droplet dries, these charges are transferred to bioaerosols; if the charges are the same or opposite polarity as the bioaerosols, the bioaerosols will carry higher or lower charge, respectively [40]. The total charge carried by bioaerosols entering the ESP comprises not only the charge carried by the microorganisms themselves but also the charge obtained due to charging from the ESP’s electric field. Together, these increase the probability of bioaerosols being collected by the dust collection plate. If the ESP’s corona discharge was high (−10 kV), a favorable bioaerosol removal rate was observed. This result was in accordance with that of Mainelis et al. (2002) [41].
However, bioaerosols differ in the amount of charge that they carry and their polarities. For example, Escherichia coli carries a relatively high positive charge compared with many other bacteria [42]. In negative corona ESP, the charge carried by E. coli is neutralized by the electric field; the bacteria cannot easily be collected by positively charged dust collection plates. However, even if the charge carried by bioaerosols is the opposite polarity of the ESP discharge, the amount of charge generated by corona discharge is typically far greater than that carried by bioaerosols. Mainelis et al. (2002) [43] revealed that completely removing the charge of bioaerosols is challenging. If the charge on bioaerosols is weakened, they could still be collected by the dust collection plate; however, the removal rate would be lower.
For an ESP discharge voltage of −10 kV and a high air flow rate (4.8 m3/min), the bioaerosol removal rates in the food waste storage room and the meeting room were both higher than PM2.5 and PM10 removal rates in the food waste storage room. If the air flow rate of the ESP was adjusted, the difference in bioaerosol removal rate was small, indicating that mechanisms other than the dust collection plate contributed to the removal of bioaerosols. The high-concentration O3 generated by corona could destroy microorganisms. However, in an environment with high humidity, minute droplets coagulate on and cover the surface of microorganisms, increasing the particle diameter of the bioaerosols [44]. This phenomenon reduces the rate of successfully charging bioaerosols in the electric field. Moreover, these droplets protect the microorganism by decreasing the likelihood of their destruction in the electric field. This is from the experimental results in which corona has a removal effect on bioaerosol, although higher ambient humidity will reduce the air pollutant removal efficiency of ESP. However, it can still be observed that ESP can destroy parts of the bioaerosol.

3.2. ESP Ozone Generation and Its Potential for Air Pollutant Removal

Figure 7 presents the results for the removal of HCHO with an ESP in the laboratory test system and food waste storage room. At the same discharge voltage, higher air flow rates resulted in the air remaining in the ESP for a reduced duration, leading to a reduced rate of HCHO removal. At the same amount air flow rate, a stronger discharge intensity led to an increased removal rate. If the discharge voltage was fixed at −10.5 kV low (2.4 m3/min) and high (4.8 m3/min), air flow rates achieved single-pass HCHO removal rates of 55% and 47%, respectively, in the lab tests and 46% and 36% in the waste storage room, respectively.
Chang et al. (1995) [45] reported two mechanisms for the removal of airborne HCHO by the corona: (1) The electrons emitted from the discharge electrode directly collide with the HCHO molecules and break its chemical bonds. (2) Corona discharge turns other gas molecules in the air into free radicals. Free radicals then generate chemical reactions with HCHO, turning HCHO into more stable substances such as CO, CO2, or H2O. In the electric field, HCHO is decomposed into the formyl radical (–CHO). This step is critical; by applying an electric field with suitable strength, the bond (4.3 eV) between H and C can be broken, decomposing HCHO into –CHO and H+ [46]. In addition to corona destruction, a strong electric field ionizes numerous substances. Among these, OH is a major contributor for oxidizing HCHO. Lu et al. (2012) [47] discovered that airborne H2O(g) was dissociated into OH and H+ by corona. At an appropriate environmental humidity of 37% RH, an optimal HCHO removal rate (≈65%) was observed.
During ESP corona discharge, in addition to using a high-energy electric field to destroy HCHO and bioaerosols, the generated O3 can also oxidize and decompose HCHO and bioaerosols. If the electrons in the ESP corona discharge collide with oxygen molecules in the corona layer and form atomic oxygen, atomic oxygen further reacts with other oxygen molecules and forms O3 [48]. The negative corona ESP used in this study generated an enormous amount of O3. To understand the changes in O3 concentrations during ESP operation, the amount of O3 generated was measured in the laboratory system. In the ozone-background test, no pollutants were added. Dry air filtered with an activated carbon filter was input to the ESP, and the O3 concentration at the ESP outlet was measured. For the ozone-suspended particulate test, suspended particulates were input to the ESP, and the O3 concentration at the ESP outlet was measured. The environmental background concentration of O3 must be subtracted from that measured at the ESP outlet. Thus, the O3 concentrations were normalized by measuring the initial background O3 concentration at the inlet of the ESP (0.011 ± 0.002 ppm) and substracting this value from the values at the outlet. Table 3 lists the experimental results. For the ozone-background and test, the O3 concentration reached 7.429 ppm. The O3 concentration generated by the ESP was slightly lower in the ozone-suspended particulate test. The discharge voltage and air flow rate both affected the generated O3 concentration. A high ESP discharge voltage increases the strength of the electric field and expands the corona, increasing the probability of ionizing the air and resulting in the generation of a higher O3 concentration [22,49,50]. If the discharge voltage was constant, an increase in the air flow rate increased the speed of the gas molecules in the chamber. Thus, the time for the molecules to be ionized to form O3 was reduced, leading to a reduction in the amount of generated O3 [51].
In the food waste storage room and the meeting room, the background O3 concentrations measured at the ESP inlet were 0.23 ppm and 0.01 ppm, respectively. The O3 background concentration was higher in the food waste storage room than in the meeting room because the storage room had ultraviolet (UV) germicidal lamps (254 nm). Shortwave UV light (100–280 nm) destroys gaseous O2, forming unstable O that rapidly reacts with other O2 molecules to form O3 [52,53]. Table 3 reveals that the O3 concentrations measured at the ESP outlet in the field tests were lower than those measured in the ozone-background test in the laboratory test system. The increase in O3 concentration at the outlet in the field was lower than that in the laboratory system, and the difference increased as the discharge voltage increased (Figure 8). Under the experimental conditions of high discharge voltage (−10.5 kV) and low air flow rate (2.4 m3/min), the difference in the O3 concentrations was the largest.
The smaller increase in O3 concentrations in the field compared with that in the laboratory system was attributed to two phenomena: (1) The O3 generated during the discharge process reacts with air pollutants inside the ESP. (2) The generation of O3 in the ESP is hindered by humidity or other environmental factors. For the O3 tests in the laboratory system, the air input to the ESP was first manipulated to obtain 55% RH in the mixing chamber. By contrast, RH in the food waste storage room (85%) and the meeting room (70%) could not be controlled. Several studies have reported that RH in the environment substantially affects the corona discharge of ESP [32,33]. If RH is high, the amount of O3 generated by ESP is reduced [22,24]. If air with high humidity flows into the ESP, the electrons emitted by the discharge electrode collide with the water molecules, forming free radicals (OH) and H2O2, both of which are extremely strong oxidizers. In addition, OH degenerates O3 to form HO2 and O2 [54,55]. Wang and Chen (2008) [56] stated that, in a humid environment, O3 generated by a negative corona ESP would be decomposed. Moreover, the generation rate of O3 is reduced at high humidity. At 0 RH%, the concentration and generation rates of O3 were 13 ppm and 6.1 × 10⁻³ mg/m∙s, respectively. At 100 RH%, the concentration and generation rates of O3 were 3.1 ppm and 1.54 × 10⁻³ mg/m∙s, respectively.
O3 concentration is affected not only by the RH of the environment but also by reactions between O3 and airborne pollutants in the air and by O3 decomposition. Chang et al. (1995) [45] discovered that OH plays a key role in the reaction of O3 with airborne HCHO. The OH group binds with H+ in HCHO to produce the –CHO ion, which then reacts with other substances, such as OH, H+, O2−, and O2, eventually becoming relatively harmless CO2 and H2O. However, these chemical reactions require sufficient energy. Fan et al. (2010) [57] stated that the reaction of O3 and HCHO is highly unfavorable without a catalyst and can be ignored. Moreover, in the absence of the electric field or if molecules cannot be converted to radicals (such as OH and O2−), the addition of catalysts does not trigger the reaction between O3 and HCHO. Although O3 can oxidize HCHO, it also reacts with OH, resulting in a reduced removal rate of HCHO and bioaerosols [47]. This may be the reason that the HCHO removal rate in the laboratory system was higher than that in the food waste storage room. Moreover, the difference in O3 concentrations were assumed to be due to both environmental humidity and the reaction of O3 with OH.
ESP removes bioaerosols not only through decomposition through the reaction with radicals (OH) generated in the corona but also through damage caused by bombardment with high-speed electrons or radicals, breaking, or even penetrating microorganism outer membranes and entering to damage their DNA [58,59]. As a result, bioaerosols that are not collected by the dust collection plate cannot survive due to membrane damage causing cytoplasm leakage. Moreover, O3 is exceptionally effective for killing bacteria and fungi. Due to its strong oxidation ability, it can decompose microorganism cell membranes, resulting in cytoplasm leakage and death [27]. For bacterial species such as Bacillus that transform into endospores and become dormant, O3 can also effectively damage the endospore outer membrane, causing a loss of activity and death [20]. Dyas et al. (1983) [60] conducted experiments that revealed that an O3 concentration in a single-patient ward of 1 ppm could kill 95% of the bacteria and fungi in the ward. However, the concentration and contact time required for O3 to kill bioaerosols differed between species [61]. If the environment has relatively high humidity, water forms minute droplets that attach to the surface of bioaerosols, forming a liquid membrane. If O3 contacts these bioaerosols, it dissolved in the liquid membrane and is ineffective for killing bacteria or fungi. By contrast, Li and Wang (2003) [62] discovered that if the environmental humidity is high, more OH was generated and the efficiency for removing bioaerosols increased.
Because the differences in the amount of O3 in the food waste storage room and the meeting room were similar (Figure 8), an ESP discharge voltage of −10.5 kV resulted in optimal bacteria and fungi removal rates of 76–83%. We maintain that, although O3 can remove bioaerosols, corona and reactions with OH− were the primary reasons for their destruction. The removal of HCHO may be caused by similar pathways. However, other mechanisms that degrade or damage HCHO and bioaerosols cannot be eliminated. We can observe that ESP has removal effects on HCHO and bioaerosols, and the changing trend in removal efficiency potential is similar to PM2.5 and PM10.
Although O3 removes HCHO and bioaerosols, the O3 generated by an ESP can affect human health. We, therefore, advised adding activated carbon filters at the outlet of negative corona ESPs to effectively absorb O3 as well as any remaining gaseous pollutants. O3 may be removed by both its reaction with activated carbon and its absorption by activated carbon, resulting in decomposition [63]. Lee and Davidson (1999) [64] demonstrated that activated carbon had a favorable O3 removal rate; the initial removal rate reached 98%. Therefore, when selecting an ESP for indoor use, choosing the ESP with an activated carbon filter at the outlet is prioritized, which can avoid the situation of high O3 concentrations in the room.

4. Conclusions

Negative corona ESPs were used to effectively remove suspended particulates, formaldehyde, and bioaerosols. The performance of the ESP may be affected by environmental humidity. The pollutant removal rates at the field tests (70–85% RH) were all lower than that in the lab tests (55% RH). The optimal PM2.5, PM10, formaldehyde, bacteria, and fungi removal rates in the field tests reached 89%, 90%, 46%, 69%, and 85%, respectively. The results revealed that increasing the ESP discharge voltage increased its air pollutant removal rate. Reducing the air flow rate also increased the removal rate. At high voltage (−10.5 kV) and low air flow rate (2.4 m3/min), ESP achieved its optimal air pollutant removal rate.
If ESP was operated at a high discharge voltage, it had a favorable air pollutant removal rate; however, it generated a large amount of O3. At high voltage (−10.5 kV) and a low air flow rate (2.4 m3/min), the highest O3 concentration was observed at the ESP outlet. The experimental results for O3 and the pollutants revealed that the suspended particulates were not affected by the amount of O3 generated by ESP. Thus, we inferred that only a small proportion of the removed HCHO and bioaerosols were removed due to the oxidation and decomposition by O3; the majority was removed by corona destruction and reaction with OH. However, the amount of O3 generated by the ESP is substantially affected by the RH in the environment. Consequently, the contribution of O3 for removing HCHO and bioaerosols could not be accurately evaluated.
The amount of O3 generated in the field tests was lower than that in the lab tests. This result was attributed to the effects of the relatively high RH on site and because O3 was consumed through reactions with air pollutants and radicals (such as OH). Negative corona ESP had favorable removal performance for air pollutants, but it also generated high concentrations of O3. When using these devices, the risk of damage to the human body caused by high-concentration O3 cannot be ignored. For the problem that ESP may cause excessive indoor O3 concentration, it is recommended to choose an ESP with an activated carbon filter adsorption at the air outlet. In addition, while the negative corona ESP produces a higher concentration of O3, positive corona ESP can be used instead, which will reduce the amount of O3 produced, but pollution removal efficiency will also decrease. Although we believe that O3 and OH- amounts are key factors for the direct destruction or oxidation of HCHO and bioaerosols, the contribution of O3 or OH- has not been separately evaluated from particle collection. We expect that, in future studies, the role of ozone and oxidizing radicals in the corona discharge process can be quantitatively analyzed and that it can be further utilized by properly setting operation parameters.

Author Contributions

C.-Y.L., data curation and writing original draft. C.-H.T., supervision, project administration, and data interpretation. K.-F.W., formal analysis and investigation. All authors have read and agreed to the published version of the manuscript.

Funding

This research received no external funding.

Institutional Review Board Statement

Not applicable.

Informed Consent Statement

Not applicable.

Data Availability Statement

Not applicable.

Conflicts of Interest

The authors declare no conflict of interest.

References

  1. Jaworek, A.; Krupa, A.; Czech, T. Modern electrostatic devices and methods for exhaust gas cleaning: A brief review. J. Electrost. 2007, 65, 133–155. [Google Scholar] [CrossRef]
  2. Zhao, Z.M.; Pfeffer, R. A semi-empirical approach to predict the total collectionefficiency of electrostatic precip-itators. Chem. Eng. Commun. 2012, 148, 315–331. [Google Scholar]
  3. Butz, A.M.; Matsui, E.C.; Breysse, P.; Curtin-Brosnan, J.; Eggleston, P.; Diette, G.; Williams, D.; Yuan, J.; Bernert, J.T.; Rand, C. A randomized trial of air cleaners and a health coach to improve indoor air quality for inner-city children with asthma and secondhand smoke exposure. Arch. Pediatr. Adolesc. Med. 2011, 165, 741–748. [Google Scholar] [CrossRef] [PubMed]
  4. Skulberg, K.R.; Skyberg, K.; Kruse, K.; Eduard, W.; Levy, F.; Kongerud, J.; Djupesland, P. The effects of intervention with local electrostatic air cleaners on airborne dust and the health of office employees. Indoor Air 2005, 15, 152–159. [Google Scholar] [CrossRef]
  5. Mermigkas, A.C.; Timoshkin, I.V.; MacGregor, S.J.; Given, M.J.; Wilson, M.P.; Wang, T. Removal of Fine and Ul-trafine Particles from Air by Microelectrostatic Precipitation. IEEE Trans. Plasma Sci. 2013, 41, 2842–2850. [Google Scholar] [CrossRef]
  6. Waring, M.S.; Siegel, J.A.; Corsi, R.L. Ultrafine particle removal and generation by portable air cleaners. Atmos. Environ. 2008, 42, 5003–5014. [Google Scholar] [CrossRef]
  7. Morawska, L.; Agranovski, V.; Ristovski, Z.; Jamriska, M. Effect of face velocity and the nature of aerosol on the col-lection of submicrometer particles by electrostatic precipitator. Indoor Air 2002, 12, 129–137. [Google Scholar] [CrossRef]
  8. Mizuno, A. Recent Development of Electrostatic Technologies in Environmental Remediation. In Proceedings of the 2009 IEEE Industry Applications Society Annual Meeting, Houston, TX, USA, 4–8 October 2009; p. 10974532. [Google Scholar] [CrossRef]
  9. Mainelis, G.; Grinshpun, S.A.; Willeke, K.; Reponen, T.; Ulevicius, V.; Hintz, P.J. Collection of Airborne Microorgan-isms by Electrostatic Precipitation. Aerosol Sci. Technol. 1999, 30, 127–144. [Google Scholar] [CrossRef]
  10. Koide, S.; Nakagawa, A.; Omoe, K.; Takaki, K.; Uchino, T. Physical and microbial collection efficiencies of an electro-static precipitator for abating airborne particulates in postharvest agricultural processing. J. Electrost. 2013, 71, 734–738. [Google Scholar] [CrossRef]
  11. Botvinnik, I.; Taylor, C.E.; Snyder, G. High-Efficiency Portable Electrostatic Air Cleaner with Insulated Electrodes (January 2007). IEEE Trans. Ind. Appl. 2008, 44, 512–516. [Google Scholar] [CrossRef]
  12. Mizuno, A. Industrial applications of atmospheric non-thermal plasma in environmental remediation. Plasma Phys. Control Fusion 2006, 49, A1–A15. [Google Scholar] [CrossRef]
  13. Li, X.; Li, J.; Wu, D.; Lu, S.; Zhou, C.; Qi, Z.; Li, M.; Yan, J. Removal effect of the low-low temperature electrostatic pre-cipitator on polycyclic aromatic hydrocarbons. Chemosphere 2018, 211, 44–49. [Google Scholar] [CrossRef]
  14. Han, T.T.; Thomas, N.M.; Mainelis, G. Design and development of a self-contained personal electrostatic bioaerosol sampler (PEBS) with a wire-to-wire charger. Aerosol Sci. Technol. 2017, 51, 903–915. [Google Scholar] [CrossRef]
  15. Kim, M.; Lim, G.-T.; Kim, Y.-J.; Han, B.; Woo, C.G.; Kim, H.-J. A novel electrostatic precipitator-type small air purifier with a carbon fiber ionizer and an activated carbon fiber filter. J. Aerosol Sci. 2018, 117, 63–73. [Google Scholar] [CrossRef]
  16. Hensel, K.; Pawlat, J.; Takashima, K.; Mizuno, A. Treatment of HCHO using corona discharge and pellet catalysts. In Proceedings of the 30th International Conference on Plasma Science, Jeju, Korea, 5 June 2003; p. 276. [Google Scholar] [CrossRef]
  17. Yuan, J.; Xu, P.; Wang, J.; Zhang, W.; Zhou, J.; Lai, A.; Wang, L. Experimental Study on the Removal of Formaldehyde by Plasma-Catalyst. IOP Conf. Ser. Earth Environ. Sci. 2020, 435, 012004. [Google Scholar] [CrossRef]
  18. Wan, Y.; Fan, X.; Zhu, T. Removal of low-concentration formaldehyde in air by DC corona discharge plasma. Chem. Eng. J. 2011, 171, 314–319. [Google Scholar] [CrossRef]
  19. He, X.; Zeng, Y.; Chen, J.; Wang, F.; Fu, Y.; Feng, F.; Huang, H. Role of O3 in the removal of HCHO using a DC streamer plasma. J. Phys. D Appl. Phys. 2019, 52, 465203. [Google Scholar] [CrossRef]
  20. Tiwari, B.W.; Brennan, C.S.; Curran, T.; Gallagher, E.; Cullen, P.J.; O’Donnell, C.P. Application of ozone in grain processing. J. Cereal Sci. 2010, 51, 248–255. [Google Scholar] [CrossRef]
  21. Ohkubo, T.; Hamasaki, S.; Nomoto, Y.; Chang, J.-S.; Adachi, T. The effect of corona wire heating on the downstream ozone concentration profiles in an air-cleaning wire-duct electrostatic precipitator. IEEE Trans. Ind. Appl. 1990, 26, 542–549. [Google Scholar] [CrossRef]
  22. Viner, A.S.; Lawless, P.A.; Ensor, D.S.; Sparks, L.E. Ozone generation in DC-energized electrostatic precipitators. IEEE Trans. Ind. Appl. 1992, 28, 504–512. [Google Scholar] [CrossRef]
  23. Huang, S.-H.; Chen, C.-C. Filtration Characteristics of a Miniature Electrostatic Precipitator. Aerosol Sci. Technol. 2001, 35, 792–804. [Google Scholar] [CrossRef]
  24. Boelter, K.J.; Davidson, J.H. Ozone Generation by Indoor, Electrostatic Air Cleaners. Aerosol Sci. Technol. 1997, 27, 689–708. [Google Scholar] [CrossRef]
  25. Hautanen, J.; Janka, K.; Koskinen, J.; Lehtimäki, M.; Kivistö, T. Optimization of Filtration Efficiency and Ozone Pro-duction of the Electrostatic Precipitator. J. Aerosol Sci. 1986, 17, 622–626. [Google Scholar] [CrossRef]
  26. Khadre, M.; Yousef, A.E.; Kim, J.-G. Microbiological Aspects of Ozone Applications in Food: A Review. J. Food Sci. 2001, 66, 1242–1252. [Google Scholar] [CrossRef]
  27. Cullen, P.J.; Tiwari, B.K.; O’Donnell, C.P.; Muthukumarappan, K. Modelling approaches to ozone processing of liquid foods. Trends Food Sci. Technol. 2009, 20, 125–136. [Google Scholar] [CrossRef]
  28. NIEA E301.12C; Standard Method of Total Bacteria Count of Indoor Air. Laboratory of Environmental Analysis, Environmental Protection Administration: Taiwan, China, 2012.
  29. NIEA 401.12C; Standard Method of Total Fungi Count of Indoor Air. Laboratory of Environmental Analysis, Environmental Protection Administration: Taiwan, China, 2012.
  30. Hinds, W.C. Aerosol Technology: Properties, Behavior, and Measurement of Airborne Particles; John-Wiley and Sons: New York, NY, USA, 1999. [Google Scholar]
  31. Deutsch, W. Bewegung und ladung der elektrizitätsträger im zylinderkondensator. Ann. Der Physik. 1922, 68, 355. [Google Scholar] [CrossRef]
  32. Bian, X.; Meng, X.; Wang, L.; MacAlpine, J.M.K.; Guan, Z.; Hui, J. Negative corona inception voltages in rod-plane gaps at various air pressures and humidities. IEEE Trans. Dielectr. Electr. Insul. 2011, 18, 613–619. [Google Scholar] [CrossRef]
  33. Wang, X.; You, C. Effect of humidity on negative corona discharge of electrostatic precipitators. IEEE Trans. Dielectr. Electr. Insul. 2013, 20, 1720–1726. [Google Scholar] [CrossRef]
  34. Kawada, Y.; Kaneko, T.; Ito, T. Simultaneous removal of aerosol particles, NOx and SO2, from incense smokes by a DC electrostatic precipitator with dielectric barrier discharge precharges. J. Phys. D Appl. Phys. 2002, 35, 1961–1966. [Google Scholar] [CrossRef]
  35. Yagi, S.; Tanaka, M. Mechanism of ozone generation in air-fed ozonisers. J. Phys. D Appl. Phys. 1979, 12, 1509–1520. [Google Scholar] [CrossRef]
  36. Nazaroff, W.W. Indoor bioaerosol dynamics. Indoor Air 2014, 26, 61–78. [Google Scholar] [CrossRef] [PubMed]
  37. Niazi, S.; Hassanvand, M.S.; Mahvi, A.H.; Nabizadeh, R.; Alimohammadi, M.; Nabavi, S.; Faridi, S.; Dehghani, A.; Hoseini, M.; Moradi-Joo, M.; et al. Assessment of bioaerosol contamination (bacteria and fungi) in the largest urban wastewater treatment plant in the Middle East. Environ. Sci. Pollut. Res. 2015, 22, 16014–16021. [Google Scholar] [CrossRef] [PubMed]
  38. Bredholt, H.; Fjærvik, E.; Johnsen, G.; Zotchev, S.B. Actinomycetes from Sediments in the Trondheim Fjord, Norway: Diversity and Biological Activity. Mar. Drugs 2008, 6, 12–24. [Google Scholar] [CrossRef]
  39. Lee, S.A.; Willeke, K.; Mainelis, G.; Adhikari, A.; Wang, H.; Reponen, T.; Grinshpun, S.A. Assessment of Electrical Charge on Airborne Microorganisms by a New Bioaerosol Sampling Method. J. Occup. Environ. Hyg. 2004, 1, 127–138. [Google Scholar] [CrossRef] [PubMed]
  40. Mainelis, G.; Willeke, K.; Baron, P.; Reponen, T.; Grinshpun, S.A.; Gorny, R.L.; Trakumas, S. Electrical charges on air-borne microorganisms. Aerosol Sci. 2001, 32, 1087–1110. [Google Scholar] [CrossRef]
  41. Mainelis, G.; Adhikari, A.; Willeke, K.; Lee, S.-A.; Reponen, T.; Grinshpun, A.S. Collection of airborne microorganisms by a new electrostatic precipitator. J. Aerosol Sci. 2002, 33, 1417–1432. [Google Scholar] [CrossRef]
  42. Xu, Y.; Zheng, C.; Liu, Z.; Yan, K. Electrostatic precipitation of airborne bio-aerosols. J. Electrost. 2013, 71, 204–207. [Google Scholar] [CrossRef]
  43. Mainelis, G.; Gorny, R.L.; Reponen, T.; Trunov, M.; Grinshpun, S.A.; Baron, P.; Yadav, J.; Willeke, K. Effect of electrical charges and fileds on injury and viability of airborne bacteria. Biotechnol. Bioeng. 2002, 79, 229–241. [Google Scholar] [CrossRef]
  44. Moisan, M.; Barbeau, J.; Moreau, S.; Pelletier, J.; Tabrizian, M.; Yahia, L. Low-temperature sterilization using gas plasmas: A review of the experiments and an analysis of the inactivation mechanisms. Int. J. Pharm. 2001, 226, 1–21. [Google Scholar] [CrossRef]
  45. Chang, M.B.; Lee, C.C. Destruction of Formaldehyde with Dielectric Barrier Discharge Plasmas. Environ. Sci. Technol. 1995, 29, 181–186. [Google Scholar] [CrossRef]
  46. Nunez, C.M.; Ramsey, G.H.; Ponder, W.H.; Abbott, J.H.; Hamel, L.E.; Kariher, P.H. Corona Destruction: An Innova-tive Control Technology for VOCs and Air Toxics. Air Waste 1993, 4, 242–247. [Google Scholar] [CrossRef] [PubMed]
  47. Lu, Y.; Wang, D.; Wu, Y.; Ma, C.; Zhang, X.; Yang, C. Synergistic Effect of Nanophotocatalysis and Nonthermal Plasma on the Removal of Indoor HCHO. Int. J. Photoenergy 2012, 2012, 354032. [Google Scholar] [CrossRef]
  48. Liang, W.-J.; Li, J.; Li, J.-X.; Zhu, T.; Jin, Y.-Q. Formaldehyde removal from gas streams by means of NaNO2 dielectric barrier discharge plasma. J. Hazard. Mater. 2010, 175, 1090–1095. [Google Scholar] [CrossRef] [PubMed]
  49. Chen, L.; Gonze, E.; Ondarts, M.; Outin, J.; Gonthier, Y. Electrostatic precipitator for fine and ultrafine particle removal from indoor air environments. Sep. Purif. Technol. 2020, 247, 116964. [Google Scholar] [CrossRef]
  50. Castle, G.S.P.; Inculet, I.I.; Burgess, K.I. Ozone Generation in Positive Corona Electrostatic Precipitators. IEEE Trans. Ind. Gen. Appl. 1969, IGA-5, 489–496. [Google Scholar] [CrossRef]
  51. Tanasomwang, L.; Lai, F. Long-term ozone generation from electrostatic air cleaners. IEEE Ind. Appl. Soc. 1997, 3, 2037–2044. [Google Scholar] [CrossRef]
  52. Claus, H. Ozone Generation by Ultraviolet Lamps. Photochem. Photobiol. 2021, 97, 471–476. [Google Scholar] [CrossRef]
  53. Oda, T.; Yamashita, Y.; Takezawa, K.; Ono, R. Oxygen atom behaviour in the non thermal plasma. Thin Solid Film. 2006, 506–507, 669–673. [Google Scholar] [CrossRef]
  54. Bo, Z.; Lu, G.; Wang, P.; Chen, J. Dimensional Analysis of Detrimental Ozone Generation by Negative Wire-to-Plate Corona Discharge in Both Dry and Humid Air. Ozone Sci. Eng. 2013, 35, 31–37. [Google Scholar] [CrossRef]
  55. Chen, J.; Wang, P. Effect of relative humidity on electron distribution and ozone production by DC coronas in air. IEEE Trans. Plasma Sci. 2005, 33, 808–812. [Google Scholar] [CrossRef]
  56. Wang, P.; Chen, J. Numerical modelling of ozone production in a wire-cylinder corona discharge and compari-son with a wire-plate corona discharge. J. Phys. D Appl. Phys. 2008, 42, 035202. [Google Scholar] [CrossRef]
  57. Fan, X.; Zhu, T.; Sun, Y.; Yan, X. The roles of various plasma species in the plasma and plasma-catalytic removal of low-concentration formaldehyde in air. J. Hazard. Mater. 2011, 196, 380–385. [Google Scholar] [CrossRef]
  58. Ohkawa, H.; Akitsu, T.; Tsuji, M.; Kimura, H.; Kogoma, M.; Fukushima, K. Pulse-modulated, high-frequency plasma sterilization at atmospheric-pressure. Surf. Coat. Technol. 2006, 200, 5829–5835. [Google Scholar] [CrossRef]
  59. Laroussi, M.; Mendis, D.A.; Rosenberg, M. Plasma interaction with microbes. New J. Phys. 2003, 5, 41.1–41.10. [Google Scholar] [CrossRef]
  60. Dyas, A.; Boughton, B.J.; Das, B.C. Ozone killing action against bacterial and fungal species; microbiological testing of a domestic ozone generator. J. Clin. Pathol. 1983, 36, 1102–1104. [Google Scholar] [CrossRef] [PubMed]
  61. Hibben, C.R.; Stotzky, G. Effects of ozone on the germination of fungus spores. Can. J. Microbiol. 1969, 15, 1187–1196. [Google Scholar] [CrossRef] [PubMed]
  62. Li, C.S.; Wang, Y.C. Surface Germicidal Effects of Ozone for Microorganisms. Am. Ind. Hyg. Assoc. 2003, 64, 533–537. [Google Scholar] [CrossRef]
  63. Lin, C.-C.; Chen, H.-Y. Impact of HVAC filter on indoor air quality in terms of ozone removal and carbonyls generation. Atmos. Environ. 2014, 89, 29–34. [Google Scholar] [CrossRef]
  64. Lee, P.; Davidson, J. Evaluation of Activated Carbon Filters for Removal of Ozone at the PPB Level. Am. Ind. Hyg. Assoc. J. 1999, 60, 589–600. [Google Scholar] [CrossRef]
Figure 1. Side schematic view of electrode module in ESP.
Ijerph 19 07209 g001
Figure 2. ESP of lab test system.
Ijerph 19 07209 g002
Figure 3. Site plan of the field test on (A) food waste storage room and (B) meeting room.
Ijerph 19 07209 g003
Figure 4. Experimental results of particle in the laboratory test system.
Ijerph 19 07209 g004
Figure 5. Experimental results of particle and bioaerosols in the food waste storage room.
Ijerph 19 07209 g005
Figure 6. Experimental results of bioaerosols in the meeting room.
Ijerph 19 07209 g006
Figure 7. Experimental results of the formaldehyde.
Ijerph 19 07209 g007
Figure 8. Comparing ozone concentration and air pollutant removal efficiency.
Ijerph 19 07209 g008
Table 1. Details of instruments for indoor air quality sampler.
ItemInstrument/ModelPrincipleDetection RangeResolution
PM2.5/PM10AEROCET MetOne 531Laser diode 5 MW, 780 nm0.0001–1 mg/m30.5 μm
HCHOPPM Technology/PPM Formaldmeter htv-mElectrochemical0.001–10 ppm0.01 ppm
Bacteria/fungiThermo/Anderson two-stage samplerImpacting on agar with incubation
(Q: 28.3 LPM)
Stage 0 (8–24 μm)
Stage 1 (1–8 μm)
-
O32B Model 202 Ozone MonitorUV Absorption at 254 nm1.5–100 ppb0.1 ppb
Table 2. Background of concentration in lab and field tests.
PM2.5 (μg/m3)PM10 (μg/m3)HCHO (ppm)Bacterial (CFU/m3)Fungi (CFU/m3)
Lab test system70 ± 10150 ± 200.400 ± 0.010--
Food waste storage room56 ± 3994 ± 570.067 ± 0.027176 ± 661388 ± 705
Meeting roomN.D. *N.D. *N.D. **91 ± 45213 ± 105
N.D. The concentration is below the limit of detection of instrument (* LOD: 1 μg/m3; ** LOD: 0.001 ppm).
Table 3. Ozone generated by lab system test and field test.
6 kV10 kV
2.4 m3/min4.8 m3/min2.4 m3/min4.8 m3/min
Lab system ozone-background test
Avg. Conc. (ppm)0.229 ± 0.0110.147 ± 0.0117.148 ± 0.2814.754 ± 0.029
Lab system ozone -particle test *
Avg. Conc. (ppm)0.181 ± 0.0060.143 ± 0.0117.374 ± 0.1914.611 ± 0.028
Food waste storage room test
Avg. Conc. (ppm)0.026 ± 0.0050.013 ± 0.0031.347 ± 0.1500.647 ± 0.041
Meeting room test
Avg. Conc. (ppm)0.070 ± 0.0080.040 ± 0.0041.749 ± 0.3641.410 ± 0.424
* PM2.5: 1081 ± 72 µg/m3; PM10: 2601 ± 197 µg/m3.
Publisher’s Note: MDPI stays neutral with regard to jurisdictional claims in published maps and institutional affiliations.

