1. Introduction
In the past few years, the novel coronavirus (COVID-19) outbreak has propagated worldwide, causing massive impacts on the economic and social stabilities of the affected countries [
1,
2,
3]. Currently, the recognized pathogen propagation modes are through droplets, aerosols, physical contact, and the fecal−oral route [
4,
5,
6], with the majority of research focusing on droplet and aerosol propagation. However, when samples were taken from surfaces in a hospital environment accommodating coronavirus patients, positive test samples were recorded from floors, computer mice, trash cans, and patient bedrails [
7]. Surprisingly, a positive detection rate of 100% was also recorded on the pharmacy floor, to which the patients had no access [
8]. Thus, in view of the fact that the pharmacy floor is contacted by medical staff alone, and studies have shown that contaminants can be transferred between floors and the soles of shoes [
9], there is a possibility that the detected pathogens were brought into the pharmacy on the shoes of medical staff, ultimately propagating their spread. However, to date, this pathogen propagation mode has not received particular attention.
Air quality issues have received widespread attention in recent years [
10,
11], and there have been several studies on the exposure transmission of pollutants. Therefore, understanding the factors that affect the transfer efficiency during contact would be expected to have important implications for containing propagation. To analyze the relationship between the microbial transfer rate and influencing factors during hand touching, Zhao et al. [
12] used the principal component analysis and found that the donor humidity, microbial transfer direction, donor roughness, and friction were the most significant factors. In addition, Xiao et al. [
13] used fluorescence imaging technology to quantify fluorescent particles on the surfaces and studied the dynamic transport process of the norovirus on aircraft through hand contact on multiple environmental surfaces. Currently, the majority of contact propagation studies focus on the transfer laws from hand to surface or from surface to surface [
14,
15,
16,
17,
18]. Sippola et al. [
9] measured the down lay transfer efficiency of particles between shoes and floors to understand the transport of deposited particulate pollutants, and Rosati et al. [
19] measured the single-step absorption transfer efficiency of amorphous silica particles from carpets to shoes. Similarly, Hunt et al. [
20] measured the transfer of wet and dry soil from shoe soles to tiles and found that the transfer efficiency decreased with each successive step. Furthermore, Mcdonagh et al. [
21] quantified the mass transfer efficiency of aerosol particles deposited on hard and soft surfaces by changing the applied pressure, contact time, and pollutant loading, and found that the transfer efficiency did not increase significantly with an increase in contact time. As the applied pressure and surface roughness increased, the transfer efficiency also increased. Although some studies have investigated pollutant propagation between shoe soles and the ground, the studies on pollutant propagation and diffusion caused by human walking in real-life situations are lacking. Moreover, the pathogens can also exist in the saliva and mucous sputum of personnel, and few studies have been carried out on the spread of liquid pollutants on shoe soles.
In this study, the propagation and diffusion law of ground pollutants with footprints during indoor walking were investigated through employing a fluorescent solution and footprint imaging. More specifically, these tests were carried out based on the fluorescent solution from shoe soles onto the indoor ground via walking. The influence of three factors, namely body weight, walking frequency, and solution viscosity on the footprint decay and transfer efficiency were examined in detail. Finally, the diffusion law was determined and the factors influencing this type of diffusion mode were clarified.
2. Experimental and Analytical Methods
Experiments were based on a charge-coupled device and used violet light-excited fluorescence to obtain fluorescent footprint images to measure the amount of fluorescent solution transferred to the floor panel via walking. Each experiment had three phases: (1) fluorescent solution preparation, (2) exposure process, and (3) fluorescence data analysis.
2.1. Selection and Preparation of the Fluorescent Solution
Green phosphor (MJ-818, 3–5 μm particle size), which consisted of a non-toxic amino resin pigment (CH3C6H4SO2NH2[CH2O]n[NH2]3N3), was purchased from Guangzhou Qihong Technology Co., Ltd., Guangzhou, China. The emission and excitation spectra of the industrial phosphor were concentrated in the range of 350–650 nm.
In this study, edible soybean oil was used as a simulation liquid to replace sputum because its viscosity at room temperature is 57.1 mPa·s, which is similar to that of the sputum of patients with lung disease (52 mPa·s) [
22]. Moreover, as the main component of saliva is water (99–99.5%) [
23], water was used to replace saliva (water viscosity at room temperature = 1 mPa·s).
The fluorescent solution was prepared according to the following procedure. First, different masses of an industrial water-based fluorescent powder (3 and 8 g) were added to the water and edible soybean oil (100 mL each), respectively. Then, each mixture was magnetically stirred for 10 min until the solid phosphor particles were completely dissolved or dispersed. Subsequently, an aqueous-based phosphor solution was prepared with a concentration of 0.03 g/mL, while an oil-based solution was prepared with a concentration of 0.08 g/mL. Equal amounts of the two solutions were poured into an experimental tray to ensure they were evenly dispersed at the bottom of the tray and that the height of the solution was sufficient to completely cover the bottom of the tray. Then, the experimental tray was placed on a horizontal surface for later use.
2.2. Selection of the Experimental Floor and Shoes
The experimental floor panels were composed of polyvinyl chloride (PVC), which is commonly used in hospitals. The floor panels were classed as “water blue” in color, and the panel surfaces were coated with an ultraviolet antifouling layer that was easy to clean. Each experimental floor panel was cut into a rectangle measuring 25 × 40 cm to ensure that it could accommodate the single foot of an average adult male. The experimental floor panels were vertically staggered in a corridor with a spacing of 55 cm, with 11 on each side (left and right; 22 in total), as shown in
Figure 1.
The experimental shoes for the female participants were nursing shoes commonly used in hospitals. The sole material was soft rubber with dot-like protrusions, the shoe size was 230 mm, the contact area of the sole was 20 cm
2, and the tread depth was 2 mm. The experimental shoes for the male participants were casual canvas shoes with rubber soles. The soles exhibited obliquely staggered strip patterns, the shoe size was 260 mm, the contact area of the sole was 35 cm
2, and the tread depth was 2 mm. Photographic images of the soles of both shoe samples can be seen in
Figure S1.
Prior to each experiment, the experimental floor panels and shoes were washed in advance using water and were air dried for 24 h.
2.3. Fluorescence Data Collection
2.3.1. Fluorescence Image Acquisition Device
An 80 × 80 × 80 cm camera obscura was built to photograph the contaminated floor panels. As shown in
Figure 2, two 60 cm long 20 W violet light tubes were placed on both sides of the top of the camera obscura, 75 cm from the experimental floor panels. The tube lamps emitted ultraviolet light with a wavelength of 365 nm to excite the phosphors on the dyed floor panels. A charge-coupled device camera named Insta360 (Arashi Vision, Shenzhen, China) was fixed in the center of the camera obscura, the fluorescence images were photographed, and the camera was set to fix the photographing parameters.
To explore whether the light angle and intensity had any effect on the fluorescence intensity of the fluorescent solution on the experimental floor panels, a paired sample t-test was used to assess the influence of different positions in the dark box and the number of violet lamps that were switched on. Changing the light angle in the dark box had no statistical effect on the average gray value of the fluorescent solution on the floor panels (p = 0.167). However, the effect of changing the light intensity on the average gray value of the fluorescent solution on the floor panels showed a significant difference at the 0.05 significance level. Therefore, during fluorescence data collection, the same number of violet lights must be switched on in each case, and the frequency should be stable (i.e., ~5 min after switching on).
2.3.2. Image Processing and Data Extraction
After walking, the contaminated floor panels were placed into the camera obscura in order of stepping, and the camera obscura was fully closed during recording of the images. ImageJ software was used to uniformly crop the captured images to 1200 × 700 pixels and then perform gray processing. To exclude the interference of the background fluorescence in the experiment, the threshold was set to a background-specific value of 70–255 (see
Figure 3). Using this method, the total grey value of the fluorescent solution on each experimental floor panel was obtained, which is correlated with the total amount of fluorescent substances. The calculation method for obtaining the total and average gray values is as follows:
where
Intden represents the total gray value,
i(
x,
y) represents the gray value of the (
x,
y) pixel point,
MeanIntden represents the average gray value, and
Area represents the pixel area of the selected area.
2.3.3. Statistical Analysis
The Origin2017 (OriginLab Corp., Northampton, MA, USA) and SPSS 23 (IBM Corp., Armonk, NY, USA) software packages were used for plotting and data analysis, respectively. The paired sample t-test was employed to determine whether there was a statistically significant difference in the amount of fluorescent solution on the floor panels between the data collection conditions and the left- and right-foot walking characteristics of the participants. Analysis of variance (ANOVA) was used to determine whether the body weight, walking frequency, and solution viscosity resulted in statistically significant differences in the transfer efficiency and the amount of fluorescent solution on the floor panels.
2.4. Experimental Case Design
According to the Report on Nutrition and Chronic Diseases in China (2020) [
24], the average weight of residents aged 18 years and above was 69.6 kg for males and 59 kg for females. For the experiment, three volunteers were recruited, and their weight ranges were 50–55 kg, 60–65 kg, and 70–75 kg, taking into account the regional differences and weight fluctuations. Volunteer No. 1 was a woman weighing 54 kg with a shoe size of 230 mm, Volunteer No. 2 was a man weighing 63 kg with a shoe size of 260 mm, and Volunteer No. 3 was a man weighing 72 kg with a shoe size of 260 mm. The walking frequency was controlled using a metronome and was set to 80, 100, and 120 steps/min to represent slow, normal, and fast walking states, respectively.
At the beginning of the experiment, the participants wore the experimental shoes and stepped up and down alternately in the experimental tray containing the fluorescent solution to ensure that the shoe soles were completely covered by the fluorescent solution. Subsequently, under the set walking frequency, the participants took the first step with their left foot on the first experimental floor panel prior to continuing along the panel route presented in
Figure 1.
The experimental design adopted three factors and three levels in an orthogonal layout.
Table 1 outlines the three influencing factors: body weight (three levels), walking frequency (three levels), and solution viscosity (two levels). As the solution viscosity only had two levels, the dummy level method was used for processing. Each experiment was repeated six times.
4. Conclusions
This study used a fluorescent solution to simulate the pollutant propagation from rubber soles to PVC floor during indoor walking and explored the diffusion law of ground pollutants with footprints. The effects of body weight (50–75 kg), walking frequency (80–120 steps/min), and solution viscosity (oil and water) on the footprint decay (D) and transfer efficiency (τ) of the fluorescent solution were studied via the fluorescent footprint imaging based on a charge-coupled device and using violet light-excited fluorescence. The conclusions are follows:
- (1)
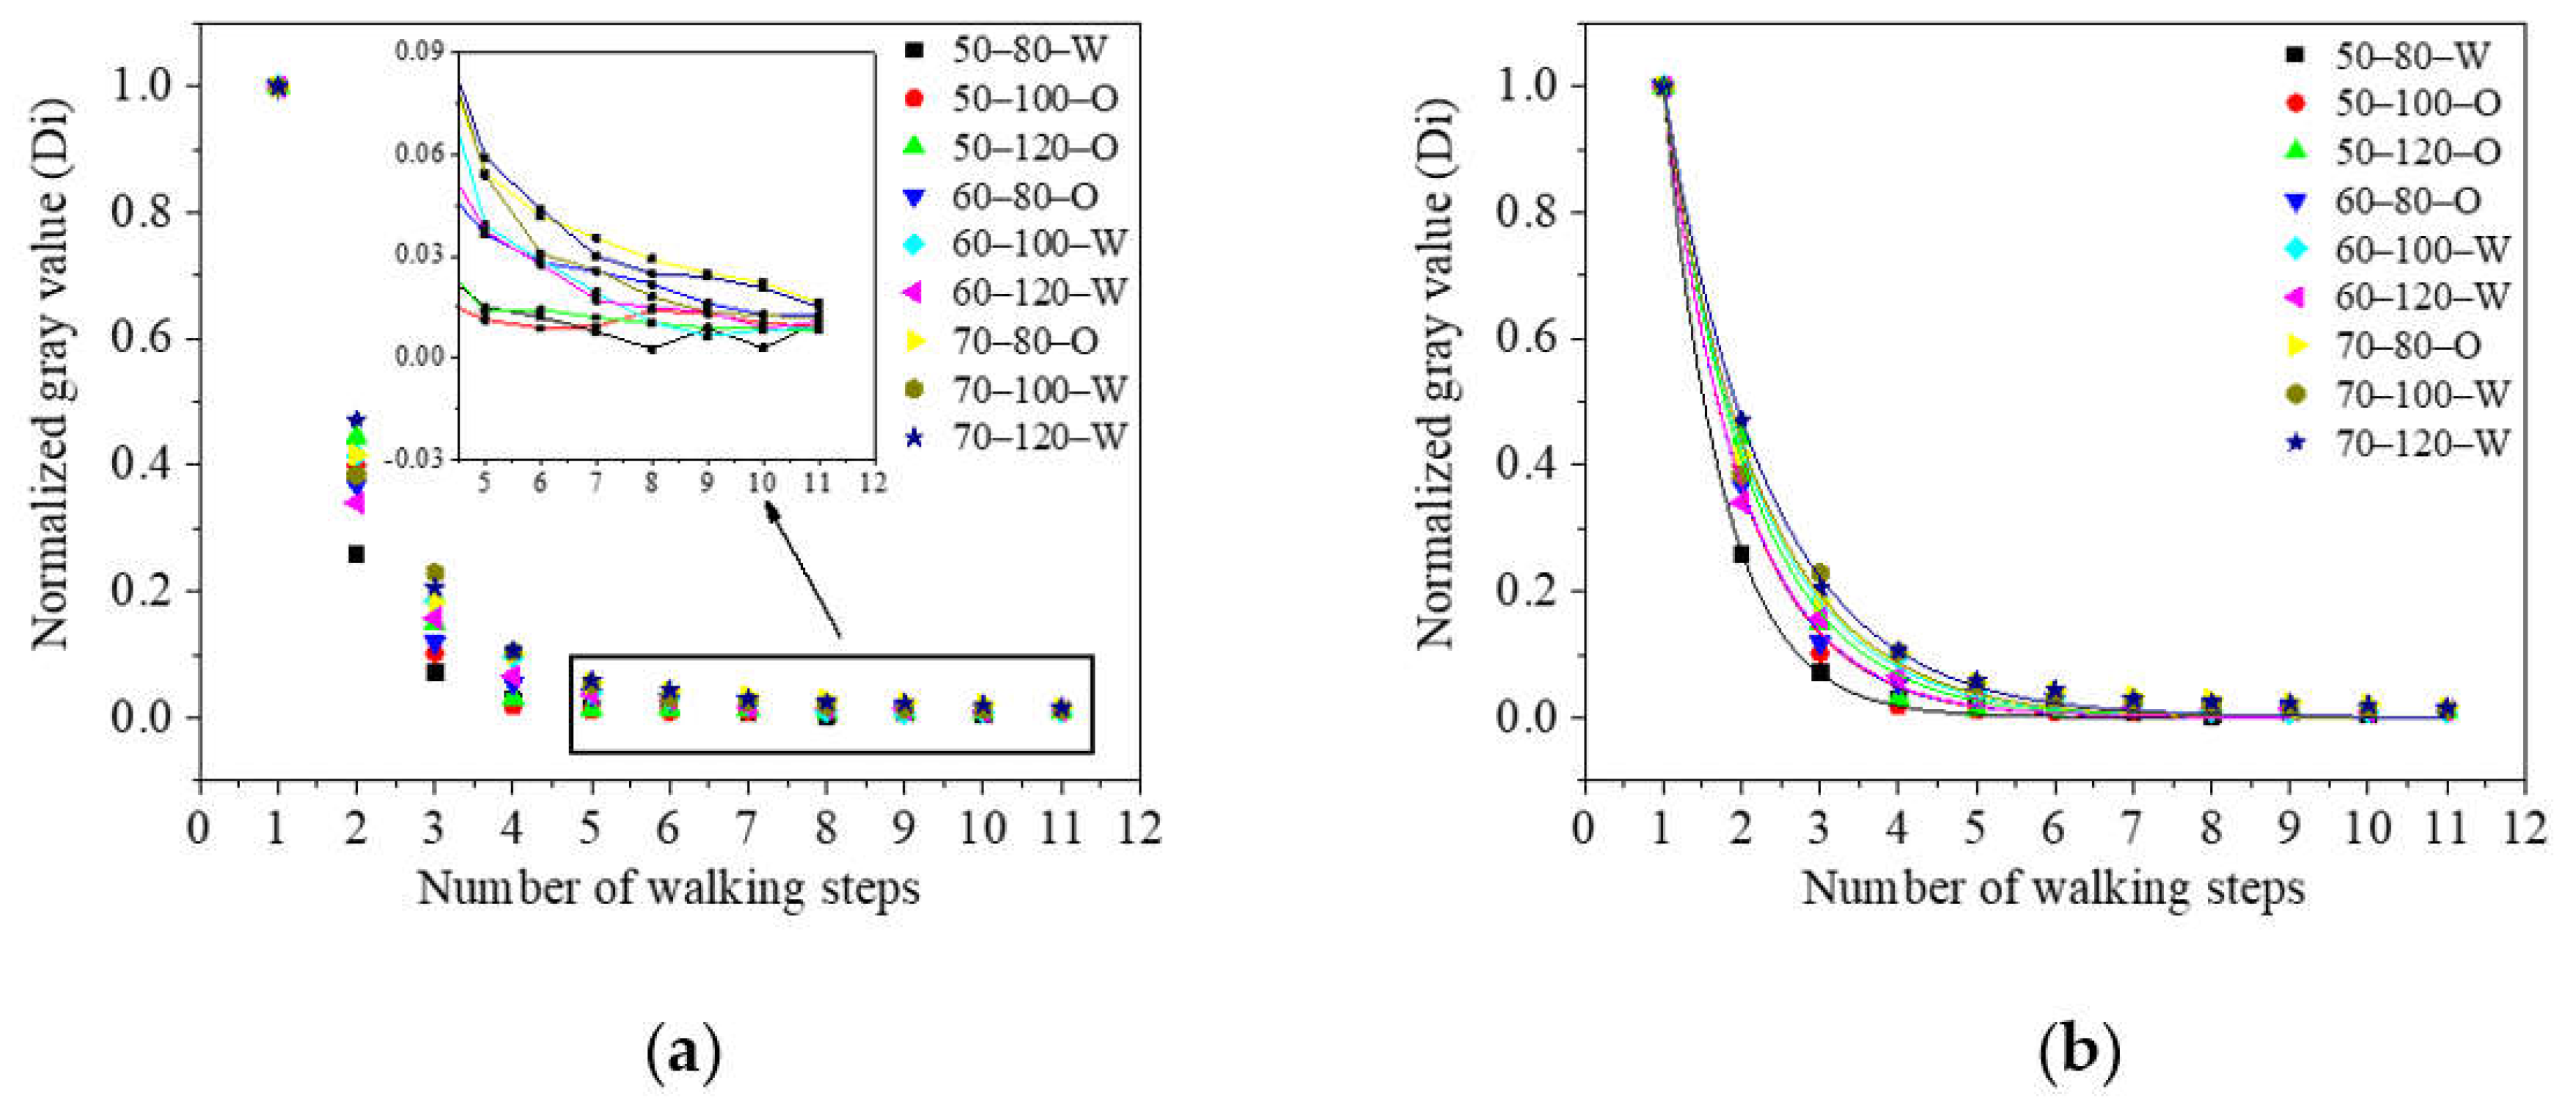
As the number of walking steps increased, the amount of fluorescent substance transferred onto the experimental floor decreased exponentially, the fluorescence value began to fluctuate and decreased to ~6% of the initial value after the fifth step.
- (2)
The relationship between the normalized gray value of the fluorescent solution (D) on each floor panel i was , and can be used to estimate the number of pollutants on the ground. Based on the variance analysis, it was found that the body weight, walking frequency, and solution viscosity had a significant effect on a, with body weight being the most important factor. More specifically, a greater body weight yielded a smaller a value. For parameter b, only body weight had a significant effect, wherein b increased with an increase in body weight.
- (3)
The transfer efficiency was distributed within a range of 0.51–0.72 for all of the experiments, and only the body weight caused it to change significantly. More specifically, with a constant walking frequency and solution viscosity, a greater body weight led to a lower transfer efficiency.
Based on these findings, this work provided a new method for examining the contact propagation and diffusion of ground pollutants while walking. However, the type of real pathogen, its survival time, etc., may have effects on the transmission efficiency. Because of the limitation of the experimental conditions, it is difficult to use the pathogens to conduct the experiment and analyze effects of their number and type. We expect to provide a good guide for subsequent research on the prevention and control of pathogen spread through footprints in a real environment. Additionally, this study is limited by the relatively low detection limit of optical analytical techniques, which cannot distinguish the fluorescent substances from the background floor fluorescence when the quantity of the transferred pollutants is low. Accordingly, further studies should consider using harmless pathogens and higher-sensitivity detection methods.


 ,
, 


