Article

Food Marketing and Power: Teen-Identified Indicators of Targeted Food Marketing

1
Department of Communication, Media and Film, University of Calgary, Calgary, AB T2N 1N4, Canada
2
Department of Community Health Sciences, Cumming School of Medicine, University of Calgary, Calgary, AB T2N 1N4, Canada
*
Author to whom correspondence should be addressed.
Int. J. Environ. Res. Public Health 2022, 19(13), 7815; https://doi.org/10.3390/ijerph19137815
Submission received: 16 May 2022 / Revised: 22 June 2022 / Accepted: 23 June 2022 / Published: 25 June 2022
(This article belongs to the Special Issue Promoting Health for Adolescents)

Abstract

:
Food marketing is powerful and prevalent, influencing young people’s food attitudes, preferences, and dietary habits. Teenagers are aggressively targeted by unhealthy food marketing messages across a range of platforms, prompting recognition of the need to monitor such marketing. To monitor, criteria for what counts as teen-targeted food marketing content (i.e., persuasive techniques) must first be established. This exploratory study engaged teenagers to explore the “power” of food marketing by identifying what they consider to be teen-targeted marketing techniques within various food marketing examples. Fifty-four teenagers (ages 13–17) participated in a tagging exercise of 19 pre-selected food/beverage advertisements. Assessed in light of age and gender, the results showed clear consistency with what indicators the participants identified when it comes to selecting “teen-targeted” ads—with advertisements most frequently chosen as “teen-targeted” containing humor (particularly irony) and celebrities. When it comes to specific indicators used by teenagers, visual style dominated, standing as the marketing technique with the most “power” for teenagers. The findings shed much needed insight into the elements of power—and more precisely, the specific marketing techniques persuasive to teenagers—which are necessary to inform monitoring efforts and to create evidence-based policy.

1. Introduction

In February 2022, the World Health Organization (WHO) released its latest report on food marketing to young people—a narrative review on the nature, extent, and impact of food marketing on children and adolescents [1]. Along with providing an up-to-date review of the research literature on this topic, the report aimed to support the development of policy guidelines that will help countries implement “effective actions” to shield young people from the negative effects of food marketing ([1] p.1). The report’s conclusions were succinct: food marketing remains “pervasive and persuasive” ([1] p.16). More specifically, food marketing promotes unhealthy foods, targets young audiences, and uses a range of persuasive techniques designed to resonate with them.
The 2022 WHO report joins the ever-expanding corpus of literature that pinpoints food marketing as a critical element of the food environment, an element that influences young people’s food attitudes, preferences, and dietary habits [2]. “Big Food”, of course, has long been critiqued for promoting food of dubious nutritional value to consumers of all ages [3,4,5], and for creating an “eat more” environment [6] that urges consumers to eat larger quantities and more often. Recent exposés of the food industry have further revealed how manufacturers manipulate foods to elicit addictive behaviors by tapping into, and exploiting, our biological preference for sweetness [7]. However, the problem of food marketing to children has been given especial attention by national and international health bodies/organizations. One common thread within this literature focused on children is a call to action, not only in terms of creating policy to foster an “enabling food environment” for children [8], but also in building a strong monitoring framework to ensure the policy objectives are being met [8].
Such calls for effective policy and monitoring related to unhealthy food marketing to children have, in recent years, acknowledged the need to consider the teen audience as well. This stems from growing evidence that teenagers are aggressively targeted by food marketers across the full spectrum of communicative platforms [9]—from television [10], websites [11], and online video platforms [12] to social media [13,14,15,16] and within the built environment. Cultural spaces for teenagers are riddled with persuasive food marketing messages [9,12], which—given their powerful emotional and social appeals—teenagers are generally unable or unwilling to resist ([17] p.29). This persuasiveness and ubiquity of food marketing matters, not merely in terms of immediate consumption, but also over the longer term, as it generates behavioral and taste transformations in ways not immediately apparent. As Kelly et al.’s [18] conceptual model outlines, a hierarchy of unhealthy food promotion effects exists, whereby individual exposures to food marketing (and its persuasive power) prompts a “sequenced set of effects” linked to “weight related outcomes” [18]. In particular, food marketing creates awareness of products and brands, positively influences attitudes and preferences, and drives purchase intent and consumption. Notably, this model does not posit a simple “cause-effect” between food marketing exposure and obesity; rather, it draws attention to the need to recognize “the cumulative effects of exposure, the permanence of effects over the longer term, and the impacts of integrated campaigns that span multiple media” ([18] p.e94). Viewed in this light, food marketing messages become more than promotional vehicles; they are part and parcel of the social, environmental, and behavioral factors that impact teenagers’ health potential—moving from adolescence into adulthood.
In short, the power and ubiquity of teen-targeted food marketing, coupled with teenagers’ vulnerability to marketing appeals, has heightened awareness of the need for monitoring. In Canada, the notion of monitoring food marketing to teenagers is part of the federal government’s Healthy Eating Strategy [19], whereby Health Canada is working to foster supportive environments for healthy eating and has (for the first time) also advised Canadians to “be aware of food marketing” in Canada’s Food Guide. However, to monitor food marketing to teenagers, clear criteria for what counts as teen-targeted food marketing must first be worked out.
This, however, is no simple task. One challenge with the existing literature on teenagers and food marketing is that very little of it engages with the actual content of the marketing message. With the exception of a few studies [9,20], the specific persuasive techniques used within the advertisements are glossed over. To date, only one study [9] engages with the persuasive techniques found within marketing found across a spectrum of platforms. Moreover, a scoping review of the literature on teenagers and food marketing revealed a lack of consistency in the indicators used to identify it [21] and high degrees of subjectivity (i.e., based on the interpretation of the researchers). What is needed is more insight into teen perspectives on what makes food marketing teen-targeted and why.
In light of this research gap, our study engaged teenagers to explore the “power” (or persuasive techniques) of food marketing [8]. In particular, we invited teenagers to review examples of food marketing from a variety of platforms and to consider whether they were teen-targeted. If so, the teenagers identified the techniques that (from their perspective) made the specific advertisement teen-targeted. These answers were assessed in light of age and gender, with an eye to revealing the consistency and nuances in both identifying teen-targeted food marketing and techniques (or indicators) within such marketing. Such indicators matter because they are the specific elements that made an advertisement “teen-targeted” to the teenagers consulted. The findings shed much needed insight into the elements of power—and more precisely, the specific marketing techniques persuasive to teenagers—which are necessary to inform monitoring efforts and to create evidence-based policy.

2. Methods

2.1. Recruitment and Procedure

Teenagers (ages 13–17) were recruited through the website of the primary investigator, personal networks of research team members, and by word-of-mouth between January and May 2021. The study was approved by the University of Calgary Conjoint Faculties Research Ethics Board (REB19-0020) and conducted online, via Zoom, due to COVID-19 restrictions regarding in-person meetings. The participants were given verbal and written details about the study aims and procedures and provided written consent to participate. On this consent form, they were able to self-identify gender (girl/boy/gender non-conforming).
In the study, the teenagers were asked to participate in a tagging exercise of 19 pre-selected food/beverage advertisements. The selected advertisements depicted a variety of products and represented a variety of formats (e.g., digital images, video, animated GIFs), from a variety of platforms (e.g., YouTube, Instagram, magazines). Table 1 details the product, platform, and content of the food/beverage marketing examples reviewed by the teen participants.
The 19 food marketing examples were shown to teenagers one at a time (in a PowerPoint slide show). Following the display of each image, a polling question appeared on each participant’s screen, stating: “If you think this is an example of teen-targeted food marketing, please select all of the tags that apply to describe why it is teen-targeted from the list below.” Listed tags included: animated character, teenaged actor, celebrity, language, music, humor, special offer, visual style, theme, or other (you tell us!). When “other” was selected, the participants were asked to explain in more detail by typing in the chat window. Importantly, the participants were instructed to leave the poll question blank if they did not think the advertisement was specifically teen-targeted. The list of evidence-based tags (or indicators) was drawn from a scoping review on teen food marketing literature [16] and subsequently validated in follow-up focus groups with 18 teenagers conducted by the same authors.
Since one aim of the study was to investigate the consistency and nuances in both identifying teen-targeted food marketing and indicators within such marketing, not all of the examples reviewed by the teenagers were clearly teen-targeted. Some were explicitly teen-targeted, others were not, and some were in the grey zone (see Table 2). In addition to the teenage subjectivity in determining whether an advertisement was “teen-targeted” (which this study sought to probe), each food marketing example also had certain boundaries or nonsubjective elements when it came to the applicability of indicators. For instance, one of the food marketing examples reviewed by the teenagers was a package of Kraft Dinner (boxed macaroni and cheese). The package was blue with “KD” written in orange styled font. Since the KD package did not contain indicators such as an animated character, teenaged actor, celebrity, music, or special offer, these “tags” should not be selected. As such, we identified the range of indicators that might reasonably be selected according to the content of each advertisement.

2.2. Statistical Analysis

All statistics were completed using Stata 16 IC. Food marketing content (i.e., tags) and self-identified gender were assessed as categorical variables. Age was assessed as both a continuous variable as well as a categorical variable (≤14 and >14). Indicator variables were created to determine frequencies for each tag option. Univariate analyses of study design characteristics were calculated with Clopper–Pearson 95% confidence intervals. Correlation between each of the potential tag categories was assessed using Pearson’s correlation coefficients. Further bivariate analyses of indicators for teen targeting stratified by food marketing content (i.e., tags) and study characteristics (i.e., gender, age), as well as comparisons between tag selection of specific images, were assessed via cross-tabulation and post hoc calculation of Clopper–Pearson 95% confidence intervals or two-sample tests of proportions (significance determined using p < 0.05). Association via logistic regression between teen-indicated teen-targeted advertisements and researcher-indicated teen-targeted advertisements by tag category via logit included both binary gender and continuous age variables as confounding factors. The probability of tag selection within this regression model and the 95% confidence interval calculated using the standard error of the linear prediction were calculated using the predict post-estimation tools for logit. Where applicable, estimates were interpreted as stratum specific linear combinations of the regression coefficients.

3. Results

Fifty-four teenagers took part in the study, with a mean age of 14.4. Slightly more girls than boys participated (54% vs 46%) (see Table 3); no participants self-identified as gender non-conforming.

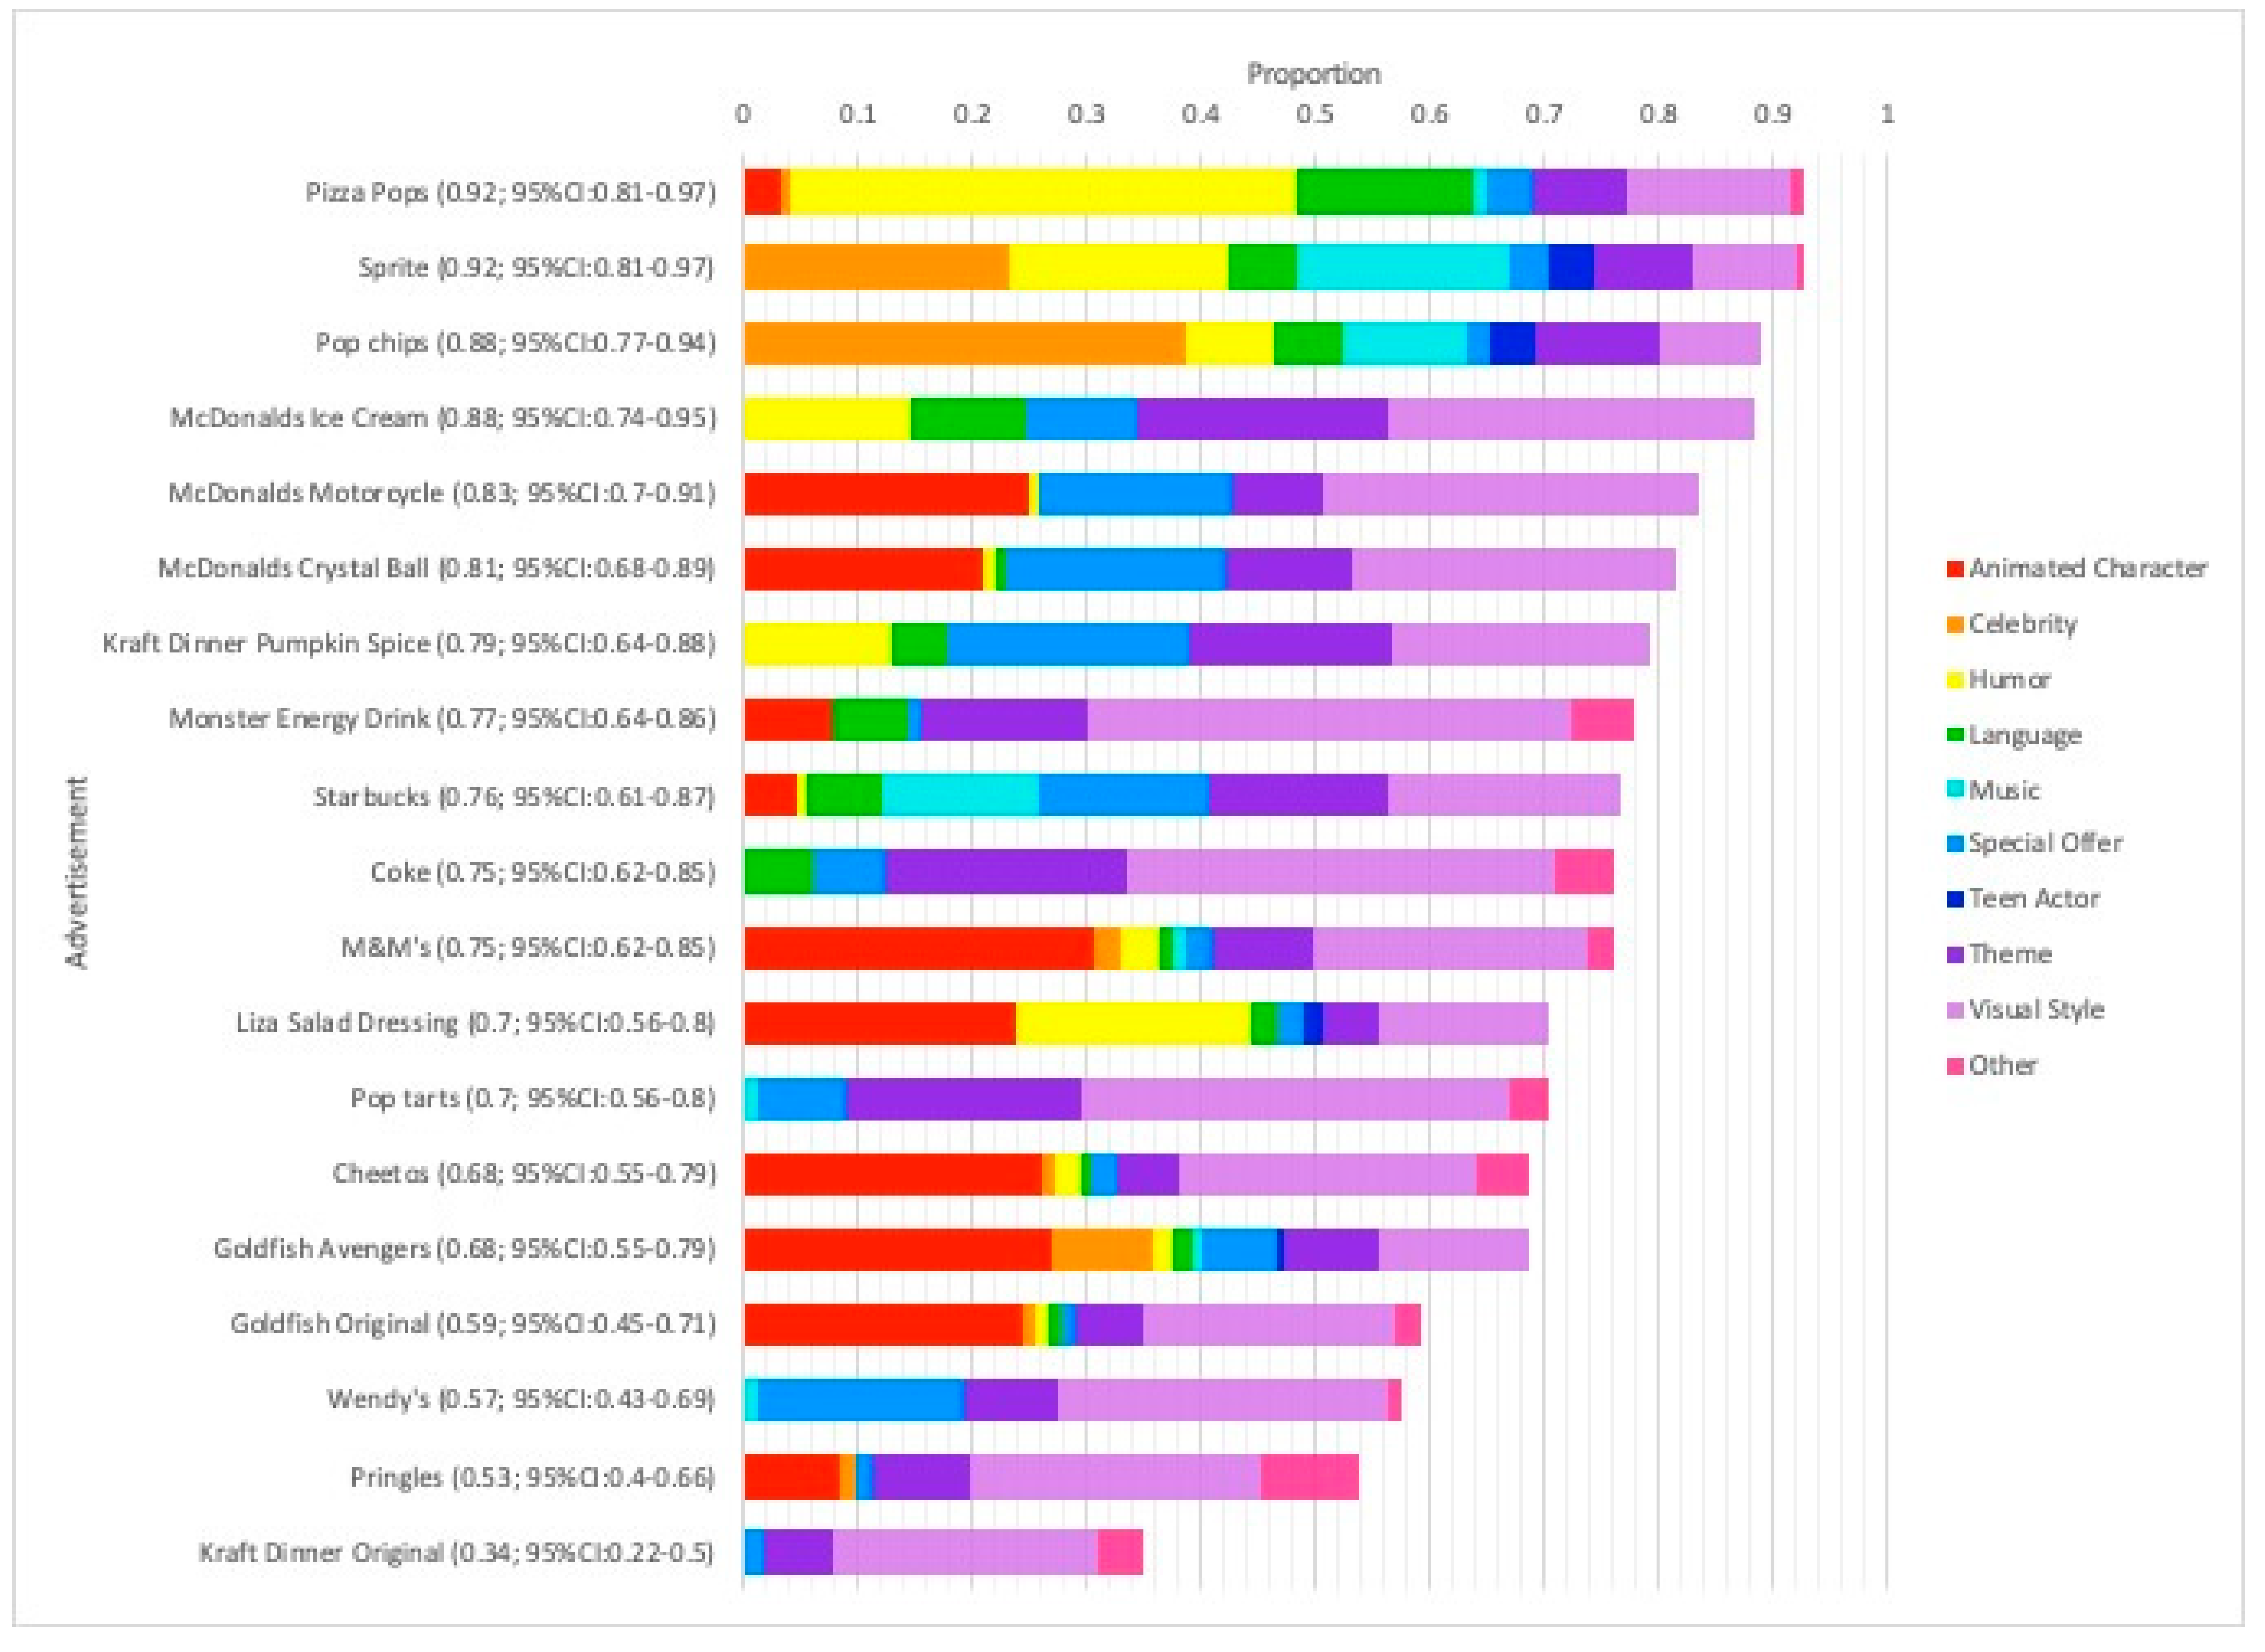
3.1. Teen-Targeted Food Marketing Examples: Frequency of Identification

Table 4 shows the breakdown of advertisements identified as “teen-targeted” by the teenagers. Their categorization (as teen-targeted or not) generally aligned with the researchers’ categorization detailed in Table 2. However, some participants identified food marketing examples (such as Goldfish Crackers and Kraft Dinner packaging) which were not considered teen-targeted by the researchers as “teen-targeted”—the reasons the teens provided will be addressed shortly. Food marketing featuring cheeky humor and celebrities (such as those found in Pop Tarts, Sprite, and Pop Chips) were most frequently chosen as teen-targeted, whereas packaging examples (Pringles potato chips and Kraft Dinner) were selected the least. Recall that the teens were instructed to identify whether the food marketing/advertisement was teen-targeted; as such, this task was about the power of the marketing, not about whether teens thought the food itself was for teenagers.

3.2. Teen-Targeted Indicators: Frequency of Identification

When it comes to specific indicators used by the teenagers, visual style (0.44; 95% CI: 0.41–0.47) was the most frequently selected, followed by animated character (0.21; 95% CI: 0.19–0.24) and theme (0.21; 95% CI: 0.19–0.24). Figure 1 depicts the relative contribution of each tag to the proportion of total indicators selected by the teens for each instance of food marketing. In terms of the advertising examples most frequently classified as “teen-targeted” by the participants (i.e., promotions for Pizza Pops and Sprite), Figure 1 shows the variety of tags selected (9 of 10 options for both) but also the consistency of identification among teenagers when it comes to the tags commonly selected (i.e., humor, language, and visual style for Pizza Pops (0.80; 95% CI: 0.67–0.88, 0.28; 95% CI:0.17–0.41, and 0.26; 95% CI:0.16–0.39 respectively); and celebrity, humor, and music for Sprite (0.85; 95% CI: 0.73–0.92, 0.70; 95% CI: 0.57–0.81, and 0.69; 95% CI: 0.55–0.79)).

3.3. Teen-Targeted Indicators: Frequency of Identification by Gender and Age

Statistical differences existed when it came age and the selection of certain indicators (see Table 5). Younger teenagers (ages 13–14) were more likely than older teenagers (age 15) to select animated character as an indicator; they also selected the language “tag” less frequently than older teens did. Significant differences were also found between the 13- and 14-year-olds when it came to humor as an indicator, since the youngest teens selected humor as an indicator less frequently withing the “teen-targeted” advertising. Special offer was identified more frequently by 16-year-olds than by 13-year-olds. Boys also selected the special offer indicator more frequently than girls did.
Taken together, Table 4 and Table 5 and Figure 1 above show distributional differences in the probability of indicator selection by food marketing content, gender, and age; these factors were included as covariates for the logistic regression modelling in the following section.

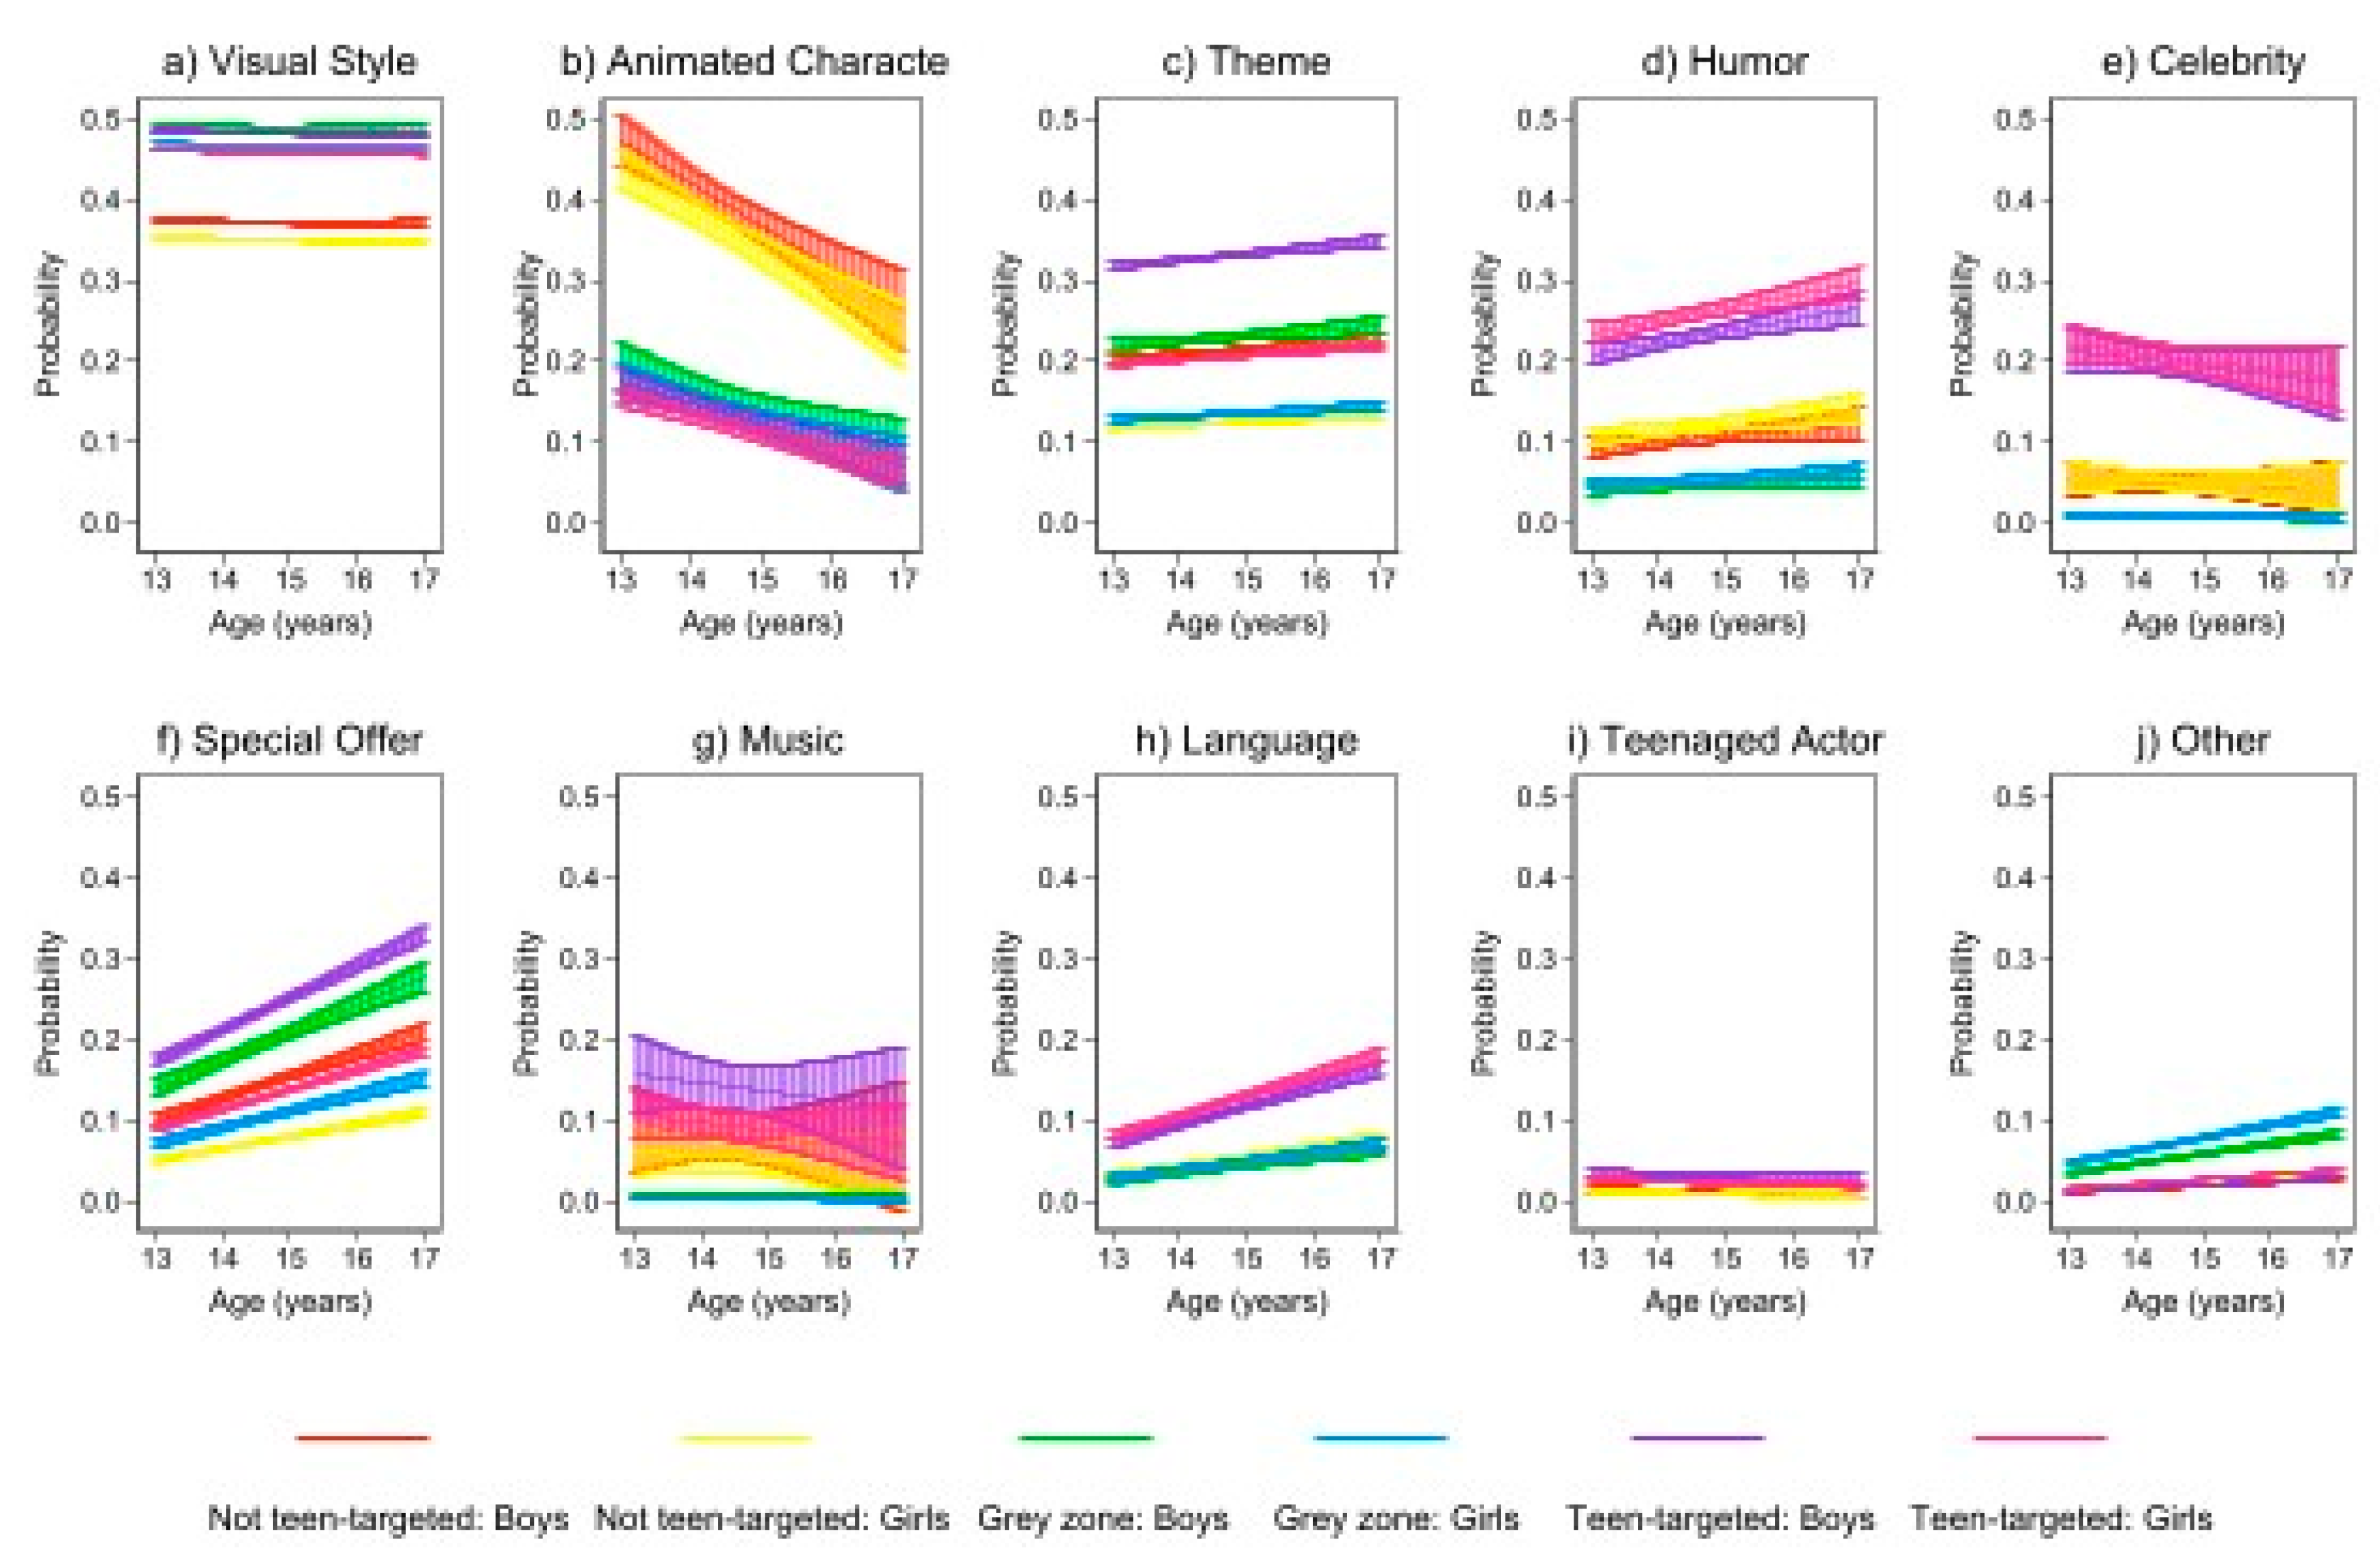
3.4. Teen-Targeted Indicators: Probability of Identification by Age and Gender

As detailed in the methods, the researchers used pre-established indicators of teen-targeted advertising [21] to categorize the 19 food advertisements as “teen-targeted”, “not teen-targeted”, or falling into a “grey-zone” (see Table 2).
Overall, teens were likely to tag visual style across all advertisements, irrespective of how researchers categorized it (i.e., the advertisements the researchers categorized as teen-targeted, not teen-targeted, or grey-zone were tagged by the participants as teen-targeted due to visual style by 47%, 48%, and 35% of the teens, respectively). In contrast, theme (26%), humor (23%), celebrity (18%), special offer (17%), music (15%), language (11%), and teen actor (2%) were all more likely to be identified in the advertisements the researchers (and teens) categorized as “teen-targeted”. The only outlier was animated character, which was identified most consistently (15%) in the ads that the researchers categorized as “not teen-targeted”. This proves interesting insomuch as animated character was the second most selected indicator overall in this study but was most frequently chosen in relation to advertisements that the researchers did not consider to be teen-targeted. (N.B. The researchers considered animated characters in certain advertisements to be kid-appealing but not teen-targeted; the participants’ responses indicated that some of them viewed this differently.) Figure 2 shows the probability of the teens’ tag selection within each of the three researcher-defined categories, examined by indicator.
Supplementary File S1 provides a detailed analysis of the probability of participants selecting each indicator, adjusted for product, gender, and age. In terms of topline observations, however (and when adjusted for marketing content and age), the probability of selecting the visual style tag was the highest among examples that the researchers categorized as both teen-targeted and in the grey zone (0.47; 95% CI: 0.43–0.52 and 0.48; 95% CI: 0.42–0.54, respectively; see Figure 2, Panel a). Age did not influence the probability of tag selection, but boys were more likely to identify visual style in ads categorized as teen-targeted compared to the grey-zone/not teen-targeted ads. In contrast, the probability of selecting animated character as a tag was the highest among advertising examples considered not teen-targeted by the researchers (0.32; 95% CI: 0.27–0.37) and lower among teen-targeted and grey-zone examples (0.15; 95% CI: 0.11–0.19) (see Panel b). The probability of selecting the animated character tag did not differ by gender but did decrease with age.
Theme, like visual style, also had a gendered dimension. Boys had a consistently higher probability of selecting theme. For all participants, the probability of selecting theme as an indicator was the highest among advertising examples categorized as teen-targeted by researchers (0.26; 95% CI: 0.21–0.30) and lower for not teen-targeted and grey-zone examples (0.17; 95% CI: 0.13–0.21 and 0.17; 95% CI: 0.13–0.22, respectively).
The probability of selecting the humor tag did not vary by gender or age. However, the marketing examples categorized as teen-targeted by the researchers were most likely to be tagged with humor (0.23; 95% CI: 0.19–0.27) (not teen-targeted or grey-zone examples: 0.13; 95% CI: 0.09–0.18; and 0.05; 95% CI: 0.02–0.07, respectively).
When adjusted for marketing content, gender, and age, the probability of selecting the special offer tag was the highest among marketing examples the researchers categorized as teen-targeted (0.17; 95% CI: 0.13–0.20) compared to those in the grey zone (0.14; 95% CI: 0.10–0.18), and not teen-targeted categorized content (0.11; 95% CI: 0.07–0.15). The probability of selecting special offer increased with age and was consistently higher for boys than for girls. Finally, the probability of selecting the language tag was the highest among marketing examples considered to be teen-targeted (0.11; 95% CI: 0.08–0.13) and the lowest for not teen-targeted and grey-zone categories (0.05; 95% CI: 0.03–0.08 and 0.04; 95% CI: 0.02–0.06, respectively). The probability of selecting language as a tag increased with age across all researcher categories.

4. Discussion

This exploratory study breaks new ground in engaging teenagers to identify the “power” of selected food marketing examples across a variety of platforms in order to assess consistency of that identification (and in light of age and gender). Such a project is helpful to monitoring efforts, given that the literature on teen engagement with food marketing content is still very much in its infancy. While some recent studies productively explore teenager engagement with food brands and marketing [11,13,14], they sidestep the important issue of advertising content as a key factor driving engagement. To date, only two published studies [9,20] focus in depth on the various persuasive techniques within food advertisements that attract teenagers’ attention and make the message meaningful. Only one of those studies [9] considers food marketing across a variety of platforms.
Although monitoring food marketing to teenagers is positioned as simply a technical issue, identifying the persuasive power (specific techniques or indicators) within this marketing is far more complex. The 54 teenagers in this study provided fascinating insight into what engaged their attention when it comes to food marketing messages, with general alignment in terms of what teenagers identify as teen-targeted food marketing (compared to not teen-targeted) based on particular indicators. When certain exceptions arose with respect to what participating teenagers selected as “teen-targeted”—as per the case in which some teenagers identified food marketing examples like Goldfish Crackers and Kraft Dinner—it appears that these teens were conflating the marketing with the food itself. That is, these teenagers (presumably) were classifying the food as teen food rather than focusing on the packaging: this move was borne out by the respondent who selected the image of a package of Kraft Dinner macaroni and cheese as teen-targeted, chose “other” as an indicator with the explanation that “it is easy to make.” Ease of preparation is not about the appeals on the actual package and does not pertain to the marketing. Rather, it is a functional attribute of Kraft Dinner. Here, it is worth noting that qualitative research with Canadian teenagers reported that these two products—Kraft Dinner and Goldfish Crackers—were given as specific examples of “teen-food” by the participants [22]. In particular, participants explained their classification by connecting the functional attributes of these two food products to teenagers’ unique characteristics and concerns as teenagers. Kraft Dinner was deemed teen food because it was easy to make (and “most teens are lazy when it comes to making food”) [22]. Goldfish Crackers were considered teen food because they are both inexpensive (and “teenagers are usually broke”) and plentiful to share with friends [22].
When it comes to marketing power, the specific appeals that capture teenagers’ attention, this study reveals that visual style dominated. Visual style is a term used to capture aspects such as color, font, or animated effects, which contribute to the overall “feel” of an advertisement. Visual style was the most frequently selected indicator and the tag most used across all advertisements (i.e., including those the researchers categorized as not teen-targeted or grey-zone). Notably, visual style was also the top indicator reported in a participatory study where teens captured their own examples of “teen-targeted” food marketing in real-world settings and identified what made them “teen-targeted” [9]. Here, teens used visual style to describe one of every two advertisements they captured [9]. Other research on food marketing power similarly observes the importance of “appearance-related features” to teenagers ([20] p.9 )and the “highly appealing” nature of visual style for teens [23]. Indeed, the persuasive appeal of visual style extends to a range of consumer products beyond the realm of food [24,25].
Visual style is a highly salient element of marketing power for teenagers. However, alongside this frequently used indicator of “teen-targeted” food marketing found in our study sit several others, such as animated character and theme. These findings reveal important nuances with respect to age and relative power, since it were the younger teenagers who were more likely to select animated character as an indicator of teen targeted food marketing. The waning appeal of cartoon characters as children age has been documented in experimental [26,27] and qualitative research studies [28], and is an important consideration in terms of how marketing power fluctuates depending on the audience. In the same vein, our study showed that the probability of selecting language and special offer increased with age, revealing the shifting priorities of teenagers in terms of what proved persuasive with them.
Finally, our study revealed the importance of engaging teenagers in studies that aim to inform policies directly relevant to them (such as monitoring food marketing to teenagers) while highlighting indicators most useful to monitoring efforts. Recall that the participants were instructed to consider whether the food marketing/advertisement was teen-targeted and if so, to indicate what made it teen-targeted. Teenagers only selected indicators for the marketing they thought was teen-targeted. While the results showed considerable alignment in terms of what teens identified as teen-targeted food marketing, some advertisements not considered teen-targeted by the researchers were flagged as such by the participants. This was particularly the case for examples containing cartoon characters that the researchers considered child-appealing but not teen-targeted—and so they were not categorized as teen-targeted by the researchers. Fifteen percent of teens flagged these as teen-targeted. While this percentage is not high, it underscores the differing subjectivities at play between adults and teens when it comes to interpretating “teen-targeted.”
Most significantly, the study revealed strong consistency among participants when it came identifying why various advertisements were teen-targeted: indicators such as theme, humor, celebrity, special offer, music, language, and teen actor were all more likely to be identified in the marketing examples categorized as teen-targeted. The importance of these indicators—especially alongside visual style, discussed above—is mirrored in recent research where teenagers engage with capturing and tagging teen-targeted food marketing in real-world settings [9].

Strengths and Limitations

This was an exploratory study, designed to probe the perceptions of teen-specific or teen-targeted persuasive power within food marketing. Study strengths include the focus on an understudied topic, providing marketing examples appealing to various audiences and across a full range of platforms to assess, a comprehensive set of indicators for teens to select from; the option for teens to include indicators, justifications that were salient to them (using an “other” category and a free text form field), consideration of age and gender, and policy relevance. Limitations stem from the exploratory nature. Future studies with a larger number of teenagers across the age range would be useful.

5. Conclusions

Food marketing is powerful and prevalent, influencing young people’s food attitudes, preferences, and dietary habits. Given calls to monitor such marketing to teenagers, a closer look at the content of the advertising is required. Findings from this study provide much needed insight into the elements of power—and more precisely, the specific marketing techniques persuasive to teenagers. Such insight is necessary to inform monitoring efforts and to create evidence-based policy, particularly since a “one-size fits all” approach—one that treats child- and teen-targeted indicators as synonymous—is not appropriate. Teenagers are not the same as children, nor are they targeted with the same appeals: indeed, there is little purchase in seeking to explore the persuasive appeals of food marketing from a teen perspective if these teen-identified appeals are glossed over by those creating policy and leading monitoring efforts. Moreover, when viewed in light of the hierarchy of unhealthy food promotion effects model [18], it becomes clear that knowing these indicators is no trivial matter. These persuasive elements comprise the power of an individual food advertisement, combining to impact food attitudes, preferences, and dietary practices [1,2].

Supplementary Materials

The following supporting information can be downloaded at: https://www.mdpi.com/article/10.3390/ijerph19137815/s1, File S1: Probability Analysis for Each Indicator.

Author Contributions

C.E. is responsible for conceptualizing the study, methodology, project execution, researching and writing the manuscript, formal analysis/interpretation of results, supervision, and funding acquisition. E.T. is responsible for the methodology, project administration and execution, data cleaning and curation, and formal analysis/interpretation of results. N.S. is responsibility for data analysis and data curation. All authors have read and agreed to the published version of the manuscript.

Funding

This research was supported by the CIHR Canada Research Chairs Program and funding from Ottawa Public Health.

Institutional Review Board Statement

The study was approved by the University of Calgary Conjoint Faculties Research and Ethics Board (REB19-0020).

Informed Consent Statement

Informed consent was obtained from all subjects involved in the study.

Data Availability Statement

The anonymized dataset is available from the authors upon request and will be accompanied by a formal data sharing agreement outlining that the data be used for academic purposes only.

Conflicts of Interest

The authors declare no conflict of interests. The funders had no role in the design of the study; in the collection, analyses, or interpretation of data; in the writing of the manuscript, or in the decision to publish the results.

References

  1. WHO [World Health Organization]. Food Marketing Exposure and Power and Their Associations with Food-Related Attitudes, Beliefs and Behaviours: A Narrative Review. 2022. Available online: https://www.who.int/publications/i/item/9789240041783 (accessed on 8 April 2022).
  2. Smith, R.; Kelly, B.; Yeatman, H.; Boyland, E. Food marketing influences children’s attitudes, preferences and consumption: A systematic critical review. Nutrients 2019, 11, 875. [Google Scholar] [CrossRef] [PubMed] [Green Version]
  3. Nestle, M. Food Politics: How the Food Industry Influences Nutrition and Health; University of California Press: Berkeley, CA, USA, 2007. [Google Scholar]
  4. Swinburn, B.; Egger, G.; Raza, F. Dissecting obesogenic environments: The development and application of a framework for identifying and prioritizing environmental interventions for obesity. Prev. Med. 1999, 29, 563–570. [Google Scholar] [CrossRef] [PubMed]
  5. Elliott, C. ‘Big Food’ and ‘gamified’ products: Promotion, packaging, and the promise of fun. Crit. Public Health 2015, 25, 348–360. [Google Scholar] [CrossRef]
  6. Nestle, M.; Nesheim, M. Why Calories Count: From Science to Politics; University of California Press: Berkeley, CA, USA, 2012. [Google Scholar]
  7. Moss, M. Hooked: Food, Free Will, and How the Food Giants Exploit Our Addictions; Random House: Toronto, ON, Canada, 2021. [Google Scholar]
  8. WHO [World Health Organization]. A Framework for Implementing the Set of Recommendations on the Marketing of Foods and Non-Alcoholic Beverages to Children. 2012. Available online: http://apps.who.int/iris/bitstream/10665/80148/1/9789241503242_eng.pdf?ua=1 (accessed on 8 April 2022).
  9. Elliott, C.; Truman, E.; Aponte-Hao, S. Food marketing to teenagers: The power and platforms of food and beverage marketing in Canada. Appetite 2022, 173, 105999. [Google Scholar] [CrossRef] [PubMed]
  10. Hammond, D. International Food Policy Study: 2020 Youth Survey—Canada. 2021. Available online: https://foodpolicystudy.com/wp-content/uploads/2021/08/2020-IFPS-Youth-Survey-Canada_20210819.pdf (accessed on 8 April 2022).
  11. Kelly, B.; Bosward, R.; Freeman, B. Australian Children’s Exposure to, and Engagement With, Web-Based Marketing of Food and Drink Brands: Cross-sectional Observational Study. J. Med. Internet Res. 2021, 23, e28144. [Google Scholar] [CrossRef] [PubMed]
  12. Chester, J.; Montgomery, K.C.; Kopp, K. “Big Food, Big Tech, and the Global Childhood Obesity Pandemic”. 2021. Available online: https://www.democraticmedia.org/article/big-food-big-tech-and-global-childhood-obesity-pandemic (accessed on 8 April 2022).
  13. Fleming-Milici, F.; Harris, J.L. Adolescents’ engagement with unhealthy food and beverage brands on social media. Appetite 2020, 146, 104501. [Google Scholar] [CrossRef] [PubMed]
  14. Qutteina, Y.; Hallez, L.; Mennes, N.; DeBacker, C.; Smits, T. What Do Adolescents See on Social Media? A Diary Study of Food Marketing Images on Social Media. Front. Psychol. 2019, 10, 2637. [Google Scholar] [CrossRef] [PubMed]
  15. Lutfeali, S.; Ward, T.; Greene, T.; Arshonsky, J.; Seixas, A.; Dalton, M.; Bragg, M.A. Understanding the Extent of Adolescents’ Willingness to Engage With Food and Beverage Companies’ Instagram Accounts: Experimental Survey Study. JMIR Public Health Surveill. 2020, 6, e20336. [Google Scholar] [CrossRef] [PubMed]
  16. Potvin Kent, M.; Pauzé, E.; Roy, E.; Billy, N.; Czoli, C. Children and Adolescents’ Exposure to Food and Beverage Marketing in Social Media Apps. Pediatric Obes. 2019, 14, e12508. [Google Scholar] [CrossRef] [PubMed] [Green Version]
  17. WHO [World Health Organization]. Evaluating Implementation of the WHO Set of Recommendations on the Marketing of Food and Non-Alcoholic Beverages to Children: Progress, Challenges and Guidance for Next Steps in the WHO European Region. 2018. Available online: https://www.euro.who.int/__data/assets/pdf_file/0003/384015/food-marketing-kids-eng.pdf (accessed on 8 April 2022).
  18. Kelly, B.; King, L.; Chapman, K.; Boyland, E.; Bauman, A.E.; Baur, L.A. A hierarchy of unhealthy food promotion effects: Identifying methodological approaches and knowledge gaps. Am. J. Public Health 2015, 105, e86–e95. [Google Scholar] [CrossRef] [PubMed]
  19. Minister of Finance; Government of Canada. Investigating the Middle Class: Budget 2019 [See pg. 152]. 2019. Available online: https://www.budget.gc.ca/2019/docs/plan/budget-2019-en.pdf (accessed on 8 April 2022).
  20. Bowman, D.D.; Minaker, L.M.; Simpson, B.J.K.; Gilliland, J.A. Development of a teen-informed coding tool to measure the power of food advertisements. Int. J. Environ. Res. Public Health 2019, 16, 4258. [Google Scholar] [CrossRef] [PubMed] [Green Version]
  21. Truman, E.; Elliott, C. Identifying food marketing to teenagers: A scoping review. Int. J. Behav. Nutr. Phys. Act. 2019, 16, 67. [Google Scholar] [CrossRef] [PubMed]
  22. Elliott, C. Promotional culture, tastes, and teenagers: Navigating the interplay between food marketing, monitoring and “teen food”. In Routledge Companion to Advertising and Promotional Culture, 2nd ed.; McAllister, M.P., West, E., Eds.; Routledge: London, UK, 2013. [Google Scholar]
  23. Bragg, M.; Lutfeali, S.; Greene, T.; Osterman, J.; Dalton, M. How food marketing on Instagram shapes adolescents’ food preferences: Online randomized trial. J. Med. Internet Res. 2021, 23, e28689. [Google Scholar] [CrossRef] [PubMed]
  24. Valentini, R.S.; Murtarelli, G.; Pizzetti, M. Digital visual engagement: Influencing purchase intentions on Instagram. J. Commun. Manag. (Lond. Engl.) 2018, 22, 362–381. [Google Scholar] [CrossRef]
  25. Bigoin-Gagnan, A.; Lacoste-Badie, S. Symmetry influences packaging aesthetic evaluation and purchase intention. Int. J. Retail. Distrib. Manag. 2018, 46, 1026–1040. [Google Scholar] [CrossRef]
  26. Ogle, A.D.; Graham, D.J.; Lucas-Thompson, R.G.; Roberto, C.A. Influence of cartoon media characters on children’s attention to and preference for food and beverage products. J. Acad. Nutr. Diet. 2017, 117, 265–270. [Google Scholar] [CrossRef] [PubMed] [Green Version]
  27. Ares, G.; Arrúa, A.; Antúnez, L.; Vidal, L.; Machín, L.; Martínez, J.; Giménez, A. Influence of label design on children’s perception of two snack foods: Comparison of rating and choice-based conjoint analysis. Food Qual. Prefer. 2016, 53, 1–8. [Google Scholar] [CrossRef]
  28. Elliott, C. Healthy food looks serious: How children interpret packaged food products. Can. J. Commun. 2009, 34, 359–380. [Google Scholar] [CrossRef] [Green Version]
Figure 1. Stacked bar graph showing the relative contribution of each tag to the proportion of indicators for identifying an instance of teen-targeted food marketing.
Ijerph 19 07815 g001
Figure 2. The probability of selecting teen-targeted indicators by gender and age.
Ijerph 19 07815 g002
Table 1. Food marketing examples selected for teen-targeted indicators testing.
Food Brand/ProductFormat and Original PlatformDescription of Content
Popchips2D print ad, magazineImage of pop singer Katy Perry in a blue dress (against a blue background), holding up a bag of original Popchips in each hand at chest level. Main caption reads: “Nothing fake about ‘em”.
Pizza PopsVideo (6 s), InstagramAdult male in pizza pop costume hands out samples on the street, then spins a sign that reads “Bake at 420”
Wendy’sGIF (3 s), InstagramStop-motion image of loose French fries moving into a shape that represents “$1”.
McDonalds McRib I (Motorcycle)GIF (10 s), InstagramSilhouette of motorcycle rider against brightly coloured striped background, ends with message “McRib is back. 29 October–25 November 2018”.
McDonalds McRib II (Crystal Ball)GIF (10 s), InstagramSilhouette of fortune teller, crystal ball with multiple messages and images: “it’s coming”; cartoon image of McRib sandwich; cartoon of cellphone with McRib finder map.
Liza Salad Dressing2D print ad, magazineImage of large cartoon chicken attempting to catch a frisbee in a park, humans in background. In bottom right-hand corner a very small caption reads “Make new friends, eat more salad” next to an image of a salad dressing bottle.
SpriteVideo (60 s), YouTubeNBA player LeBron James walks through a large house and yard (with teen actors in the background, lounging and dancing, and rapper Lil Yachty); repeatedly claims he is not telling the audience to drink Sprite.
Coca-Cola2D image (6 images in 2 × 3 grid), InstagramImage grid features similarly designed red and black stylized artwork featuring Coke bottle/can, hearts, and motivational sayings (i.e., “Love is the standard”, “Happiness looks good on you”).
Pop Tarts2D image (6 images in 2 × 3 grid), InstagramImage grid features photo realist pictures of summer themes (i.e., fireflies, s’mores) in both dark/moody and bright colourways, some including product packaging.
Pringles2D image, food packagePhoto of Pringles Canister, Sour Cream and Onion flavor.
Cheetos2D image, food packagePhoto of Cheetos Puffs bag.
M&M’s2D image, food packagingPhoto of M&M’s Chocolate Bar.
Goldfish Crackers Original2D image, food packagePhoto of Goldfish Crackers bag, Original flavor.
Goldfish Crackers Avengers2D image, food packagePhoto of Goldfish Cracker bag, featuring cartoon images of Avengers characters.
Monster Energy Drink2D image, food packagePhoto of Monster Punch can, featuring stylized skull imagery.
McDonalds Ice Cream Cone2D image, Sign/posterImage of a McDonald’s ice cream cone with a charge cord plugged into the bottom of it, held up by a disembodied hand. Text reads: “Get fully charged. Download the new app”.
StarbucksVideo (15 s), YouTubeHighlights three specialty drink flavors in holiday cups, in a winter setting (snowman, blowing snow, snow drifts with drinks set in them).
Kraft Dinner Original2D image, food packagingPhoto of Kraft Dinner box, Original flavor.
Kraft Dinner Pumpkin Spice2D image, TwitterImage of fall setting (fallen leaves, pumpkins) with disembodied hand holding a takeout drink cup (branded with KD logo) filled with Kraft Dinner macaroni and cheese. Text reads: “Pumpkin Spice KD. Coming this October”.
Table 2. Examples of food marketing used in the study (based on presence of teen-targeted indicators in the content, as defined by the researchers).
Teen-TargetedNot Teen-TargetedGrey Zone
Pizza Pops
Sprite
Pop Chips
McDonald’s Ice Cream Cone
McDonald’s McRib I
McDonald’s McRib II
Coca-Cola
Pop Tarts
Starbucks
M&M’s Chocolate Bar
Liza Salad Dressing
Goldfish Crackers Avengers
Goldfish Crackers Original
Kraft Dinner Original
Kraft Dinner Pumpkin
Spice
Monster Energy Drink
Cheetos
Wendy’s
Pringles
Table 3. Participant characteristics.
Number of Participants
Gender
Girl29
Boy25
Age
13 years11
14 years19
15 years16
16 years6
17 years2
Table 4. The proportions of teens identifying the examples of food marketing as teen-targeted.
Marketing ExampleIndicated as Teen-TargetedProportion (95% CI)
Pizza Popsn = 50/540.93 (0.82–0.97)
Spriten = 50/540.93 (0.82–0.97)
Popchipsn = 48/540.89 (0.77–0.95)
McDonald’s Ice Cream Conen = 38/430.88 (0.75–0.95)
McDonald’s McRib In = 45/540.83 (0.71–0.91)
McDonalds McRib IIn = 44/540.81 (0.69–0.90)
Kraft Dinner Pumpkin Spicen = 34/430.79 (0.64–0.89)
Monster Energy Drinkn = 42/540.78 (0.65–0.87)
Starbucksn = 33/430.77 (0.62–0.87)
Coken = 41/540.76 (0.63–0.85)
M&M’sn = 41/540.76 (0.63–0.85)
Liza Salad Dressingn = 38/540.70 (0.57–0.81)
Pop-Tartsn = 38/540.70 (0.57–0.81)
Cheetosn = 37/540.69 (0.55–0.79)
Goldfish Crackers Avengersn = 37/540.69 (0.55–0.79)
Goldfish Crackers Originaln = 32/540.59 (0.46–0.71)
Wendy’sn = 31/540.57 (0.44–0.70)
Pringlesn = 29/540.54 (0.40–0.66)
Kraft Dinner Originaln = 15/430.35 (0.22–0.50)
Table 5. Frequency of teen-targeted indicators identified by gender and age (statistical differences determined by exclusivity of the 95% confidence intervals are bolded and denoted by *).
CharacteristicObservationsAnimated Character
% (95% CI)
Celebrity
% (95% CI)
Humor
% (95% CI)
Language
% (95% CI)
Music
% (95% CI)
Special Offer
% (95% CI)
Teenaged Actor
% (95% CI)
Theme
% (95% CI)
Visual Style
% (95% CI)
Other
% (95% CI)
GENDER
Boys (n = 25)n = 45122.17 (18.57–26.25)10.18 (7.71–13.33)14.19 (11.26–17.73)6.87 (4.87–9.61)8.43 (6.19–11.37)19.29 (15.90–23.20) *1.77 (0.89–3.51)26.61 (22.73–30.88) *45.01 (40.47–49.64)2.66 (1.52–4.63)
Girls (n = 29)n = 53120.15 (16.95–23.78)10.57 (8.22–13.49)16.01 (13.13–19.38)7.72 (5.73–10.32)5.65 (3.98–7.97)10.17 (7.87–13.05) *1.32 (0.63–2.74)16.01 (13.13–19.38) *42.75 (38.60–47.01)3.58 (2.29–5.54)
AGE
13 years (n = 11)n = 20925.36
(19.92–31.70) *
8.13 (5.11–12.70)9.57 (6.25–14.37) *4.31
(2.25–8.07) *
7.18 (4.37–11.57)9.09 (5.87–13.82) *1.44 (0.46–4.36)20.57 (15.62–26.60)44.98 (38.36–51.78)1.91 (0.72–4.99)
14 years (n = 19)n = 36125.24
(20.75–30.32) *
14.51 (11.04–18.84)18.61 (14.70–23.29) *4.73
(2.87–7.70) *
7.57 (5.12–11.05)13.25 (9.94–17.45)1.89 (0.85–4.15)17.98 (14.13–22.61)41.64 (36.33–47.15)2.52 (1.27–4.97)
15 years (n = 16)n = 30414.80
(11.23–19.26) *
8.55 (5.89–12.27)16.45 (12.69–21.05)12.50
(9.23–16.72) *
6.91 (4.54–10.37)17.11 (13.27–21.77)0.99 (0.32–3.02)25.33 (20.75–30.53)45.72 (40.19–51.36)4.28 (2.50–7.23)
16 years (n = 6)n = 11421.05 (14.52–29.51)7.89 (4.16–14.49)11.40 (6.73–18.66)7.89 (4.16–14.49)4.39 (1.84–10.12)21.93 (15.27–30.46) *2.63 (0.85–7.85)17.54 (11.60–25.65)43.86 (35.04–53.08)4.39 (1.84–10.12)
17 years (n = 2)n = 3813.16 (5.58–27.98)10.53 (4.00–24.92)18.42 (9.04–33.92)2.63 (0.37–16.49)7.89 (2.56–21.82)7.89 (2.56–21.82)021.05 (10.88–36.80)39.47 (25.37–55.57)2.63 (0.37–16.49)
Publisher’s Note: MDPI stays neutral with regard to jurisdictional claims in published maps and institutional affiliations.

