Article

Characterization of Atmospheric Fine Particles and Secondary Aerosol Estimated under the Different Photochemical Activities in Summertime Tianjin, China

1
School of Science, Tianjin Chengjian Unversity, Tianjin 300384, China
2
Tianjin Research Institute for Water Transport Engineering, Tianjin 300456, China
3
School of Civil Engineering, North China Institute of Aerospace Engineering, Langfang 065000, China
*
Authors to whom correspondence should be addressed.
Int. J. Environ. Res. Public Health 2022, 19(13), 7956; https://doi.org/10.3390/ijerph19137956
Submission received: 24 May 2022 / Revised: 27 June 2022 / Accepted: 27 June 2022 / Published: 29 June 2022

Abstract

:
In order to evaluate the pollution characterization of PM2.5 (particles with aerodynamic diameters less than or equal to 2.5 μm) and secondary aerosol formation under the different photochemical activity levels, CO was used as a tracer for primary aerosol, and hourly maximum of O3 (O3,max) was used as an index for photochemical activity. Results showed that under the different photochemical activity levels of L, M, LH and H, the mass concentration of PM2.5 were 29.8 ± 17.4, 32.9 ± 20.4, 39.4 ± 19.1 and 42.2 ± 18.9 μg/m3, respectively. The diurnal patterns of PM2.5 were similar under the photochemical activity and they increased along with the strengthening of photochemical activity. Especially, the ratios of estimated secondary aerosol to the observed PM2.5 were more than 58.6% at any hour under the photochemical activity levels of LH and H. The measured chemical composition included water soluble inorganic ions, organic carbon (OC), and element carbon (EC), which accounted for 73.5 ± 14.9%, 70.3 ± 24.9%, 72.0 ± 21.9%, and 65.8 ± 21.2% in PM2.5 under the photochemical activities of L, M, LH, and H, respectively. Furthermore, the sulfate (SO42−) and nitrate (NO3) were nearly neutralized by ammonium (NH4+) with the regression slope of 0.71, 0.77, 0.77, and 0.75 between [NH4+] and 2[SO42−] + [NO3]. The chemical composition of PM2.5 was mainly composed of SO42−, NO3, NH4+ and secondary organic carbon (SOC), indicating that the formation of secondary aerosols significantly contributed to the increase in PM2.5. The formation mechanism of sulfate in PM2.5 was the gas-phase oxidation of SO2 to H2SO4. Photochemical production of nitric acid was intense during daytime, but particulate nitrate concentration was low in the afternoon due to high temperature.

1. Introduction

Since the serious haze incidents in 2013 in China, the regional atmospheric environment pollution, characterized by fine particulate matter (PM2.5; particles with aerodynamic diameters less than or equal to 2.5 micrometers (μm)), has attracted widespread attention, and serious haze pollution has endangered the public health [1,2,3,4]. In order to alleviate the severe situation of atmospheric environment pollution and effectively improve air quality, a series of control policies have been formulated, such as the Air Pollution Prevention and Control Action Plan in China [5]. Through the cooperative prevention and strict implementation of control policies in cities or regions, the mass concentration of PM2.5 has decreased on average in some representative regions, for example the annual mean mass concentration of PM2.5 is less than 35 μg/m3 in the Pearl River Delta (PRD) region, but the mass concentration of PM2.5 is still high in the Beijing–Tianjin–Hebei (BTH) and Yangtze River Delta (YRD) regions [5,6,7]. Furthermore, the mass concentration of ozone (O3) has greatly increased and the compound pollution caused by the interaction between O3 and PM2.5 has become the main problem of atmospheric pollution [8,9,10,11].
Many studies have been conducted on the spatio-temporal distribution characteristic of PM2.5 and O3 in China. In general, the atmospheric pollution of PM2.5 is heavier in autumn and winter [7,12,13], while the atmospheric pollution of O3 is more prominent in summer [14]. Although the serious pollution events owing to the PM2.5 or O3 usually occur in the different seasons, the mutual influence between the PM2.5 and O3 is always present, and is especially important in summer. As a photochemical oxidizer, the O3 oxidation is stronger with the higher mass concentration [15,16,17]. The secondary components of PM2.5 are formed by the oxidation of gasous precursors, which increase the oxidation character and promote the oxidation of the secondary components in atmospheric particulate matter [18,19]. Based on the analysis of the air quality observation data of Taipei, the estimation method of secondary aerosols in PM10 (the particle size less than or equal to 10 μm) is established under the different photochemical activities [20]. This method to estimate secondary aerosol has also been used in Pudong District of Shanghai in China, and shows that it is an effective method for estimating secondary aerosol using observation data of pollutants [19]. Due to the combined effect of emission source structure or intensity, geographical location and meteorological conditions, the complex relationship between PM2.5 and O3 is very different in different regions or cities. For example, the relationship between the meteorological conditions and PM2.5 and O3 concentrations has been studied in the BTH region [21]. The relationship between particulate matter and O3 is found in the North China Plain [9,11]. However, the information and relevant actions are still not sufficient to fully control the related pollution of O3 and PM2.5 because of the lack of the interaction analysis under different photochemical activities.
As the BTH region is one of the representative regions of economic development in China, its atmospheric quality has been receiving more and more attention. Tianjin is in the north-central part of the BTH region. As the BTH is the economic center of the Bohai region, its industry is developed. The main industries include petrochemical, electronics, machinery manufacturing and iron and steel metallurgy, among others. Tianjin is one of the cities with the most serious pollution of PM2.5. Air pollution prevention and control action plans have been implemented in Tianjin since 2013, and the PM2.5 mass concentrations decrease year by year [22]. However, PM2.5 pollution is still serious [23]. In this study, based on the continuous observation, the hourly maximum of O3 (O3,max) was used as an index to measure the levels of photochemical activity. CO was used as a tracer for primary emissions from natural origin sources such as sea salt and dust. Using the secondary aerosol estimation methods based on PM2.5/CO, the formation of secondary aerosols was estimated under different photochemical activities in summer 2020 in Tianjin, China. The main objective of the present work was to chemically characterize PM2.5 and to investigate the relationships between O3 and PM2.5 as well as their association with gaseous pollutants (NO2 and SO2) under the different photochemical activities.

2. Data and Methods

2.1. Sources of Monitoring Data

The air quality monitoring data are downloaded from the data center website of the China National Environmental Monitoring Center (http://www.cnemc.cn/sssj/) (accessed on 1 June 2021). The dataset contains the ambient mass concentrations of PM2.5, O3, NO2, CO and SO2, which are measured following the required equipment and method principles described in the technical specifications of the China National Environmental Monitoring Center (http://www.cnemc.cn/jcgf/) (accessed on 1 June 2021). PM2.5 is measured using a tapered element oscillating microbalance (TEOM) PM2.5 analyzer (Model RP1400a, Sunset Laboratory Inc., Tigard, OR, USA). NO2 is measured using a chemiluminescence NOx analyzer (Model 42C/I, Thermo-Fisher Scientific, Waltham, MA, USA), SO2 is measured using a pulsed fluorescence SO2 analyzer (Model 43C/I, Thermo-Fisher Scientific, Waltham, MA, USA), O3 is measured using a UV photometric O3 analyzer (Model 49C/I, Thermo-Fisher Scientific, Waltham, MA, USA), and CO is measured with a nondispersive infrared analyzer (Model 48i, TE). The data observed by the Tianjin monitoring site (39.08° N, 117.21° E) in the network is used from 1 June to 31 August 2020.
The continuous water-soluble inorganic ions and organic carbon (OC) and elemental carbon (EC) are measured on the top of the fourth floor (39°6′ N, 117°6′ E) in Tianjin Chengjian University, about 15 m from the ground. The main traffic line of Jinjing Road is the south and about 200 m away the sampling point, and the other surrounding areas are mainly residential communities. The water-soluble inorganic ions (i.e., SO42−, NO3, Cl, NH4+, Na+, K+, Ca2+, and Mg2+) in PM2.5 are determined during the same observation period by the ambient ion monitor instrument (AIM, URG Corporation, Chapel Hill, NC, USA, CarURG9000B). OC and EC are measured Semi-Continuous OCEC instrument (Model 4, Sunset Laboratory Inc., Tigard, OR, USA). An automatic meteorological monitoring instrument (Milos520, Vaisala, Vantaa, Finland) is used to record the main meteorological parameters, including temperature, humidity, wind speed, and wind direction.
The PM2.5 data are initially available based on 5 min averages. The hourly means are calculated using a minimum of nine 5 min averages, and the daily means are calculated using a minimum of 18 1 h averages; otherwise, the hourly and daily value is considered missing. The other daily data (gaseous pollutants, water-soluble inorganic ions, OC, EC and meteorological parameters) are averaged over 24 h periods when at least 75% of hourly data are available for each day; the missing values are excluded from the analysis.

2.2. Classification of Photochemical Activity Levels

Because the formation of secondary aerosol is closely related to the photochemical activity, O3 is often used as an index of photochemical reactions [15,16,17,20,24]. To differentiate the effect of the different photochemical activity levels, in this study, photochemical activity is categorized into four groups (L, M, LH and H) based on hourly maximum of O3 mass concentration: L denotes O3,max < 100 μg/m3 (8 h O3 standard in the National Ambient Air Quality Standard (NAAQS, GB3095-2012) of China; M denotes 100 μg/m3 ≤ O3,max < 160 μg/m3 (8 h O3 standard in GB3095-2012); LH denotes 160 μg/m3 ≤ O3,max < 200 μg/m3 (1 h O3 standard in GB3095-2012); H denotes O3,max ≥ 200 μg/m3 (1 h O3 standard in GB3095-2012).
As the Kruskal–Wallis test does not assume normality in the data, it is much less sensitive to outliers than the one-way Analysis of Variance (ANOVA). The Kruskal–Wallis test is used to determine the statistically significant difference in PM2.5 and its chemical components under the different photochemical levels in this study.

2.3. Estimating the Photochemical Secondary Aerosols

In order to understand the formation of secondary aerosol in PM2.5, the secondary aerosol in PM2.5 is estimated occurring with the intense levels of photochemical activity. CO and O3 are used as indicating species for primary sources of motor vehicle emissions and secondary sources due to photochemical activity levels. When the level of photochemical activity is L, the observed PM2.5 mass concentration is mainly from primary source emissions (including sea salt). Using the hourly ratio of PM2.5/CO to represent the primary aerosol emission, the proportion of secondary components in PM2.5 is greater when the ratio of PM2.5/CO is greater and has been already clarified this hypothesis in [20,21]. The regression analysis between PM2.5 and CO is conducted and the correlation coefficients are 0.70, 0.55, 0.62, and 0.63 under the photochemical activity level of L, M, LH and H, respectively. This illustrates that photochemical activities are low when O3,max is less than 100 μg/m3. The ratio of PM2.5/CO is a useful tracer for estimating primary aerosol when photochemical activity is high [20].
When the photochemical activity levels are M, LH, and H, the photochemical activity is relatively high, and the primary aerosol in PM2.5 is estimated by multiplying the ratio of PM2.5/CO by the CO. In this study, the primary aerosols are estimated using the hourly CO mass concentration under the different photochemical activity levels of M, LH and H. The equations used for calculation of the primary aerosol are as follows [16,25].
( PM 2 . 5 ) P , M , t = CO M , t × ( PM 2 . 5 / CO ) P , L
( PM 2 . 5 ) P , LH , t = CO LH , t × ( PM 2 . 5 / CO ) P , L
( PM 2 . 5 ) P , H , t = CO H , t × ( PM 2 . 5 / CO ) P , L
In the aforementioned formula, P denotes primary pollutant; t denotes any hour of the day; L, M, LH, and H denots the different Photochemical activity levels; and (PM2.5/CO)p,L is the 25th percentile (0.014) of the hourly ratio for PM2.5/CO at L photochemical activity.
The estimated secondary aerosol mass concentration is calculated by the observed PM2.5 mass concentration deducting the primary PM2.5 mass concentration, according to the following equations:
( PM 2 . 5 ) sec , M , t = ( PM 2 . 5 ) obs,M,t ( PM 2 . 5 ) P , M , t
( PM 2 . 5 ) sec,LH,t = ( PM 2 . 5 ) obs,LH,t ( PM 2 . 5 ) P,LH,t
( PM 2 . 5 ) sec,H,t = ( PM 2 . 5 ) obs,H,t ( PM 2 . 5 ) P,H,t
In the aforementioned formula, sec denotes secondary pollutant; obs denotes observed value; t denotes any hour of the day; and L, M, LH, and H denote the different photochemical activity levels.
The secondary organic aerosol (SOA) has been an important component of PM2.5 [26,27,28,29,30] and can be formed from the photochemical oxidation reactions of VOCs. In this study, the primary organic aerosol (POA) and secondary organic aerosol (SOA) are estimated by the previously reported ratios, POA/POC (=1.2 μg/μgC) and SOA/SOC (=2.2 μg/μgC) [31,32]. The mass concentrations of POC and SOC are estimated using the method of the minimal ratio of OC/EC [33]:
( POC ) t = ( EC ) t × ( OC / EC ) pri , min
( SOC ) t = ( OC ) obs , t ( POC ) t
In the aforementioned formula, OC and EC are the measured hourly mass concentrations; t denotes any hour of the day; and (OC/EC)pri,min is the minimum of OC/EC in primary emissions. At urban locations and in this study, the minimum OC/EC observed in ambient air is the absolute minimum of all the data in the time series and is used to represent (OC/EC)pri.

3. Results and Discussion

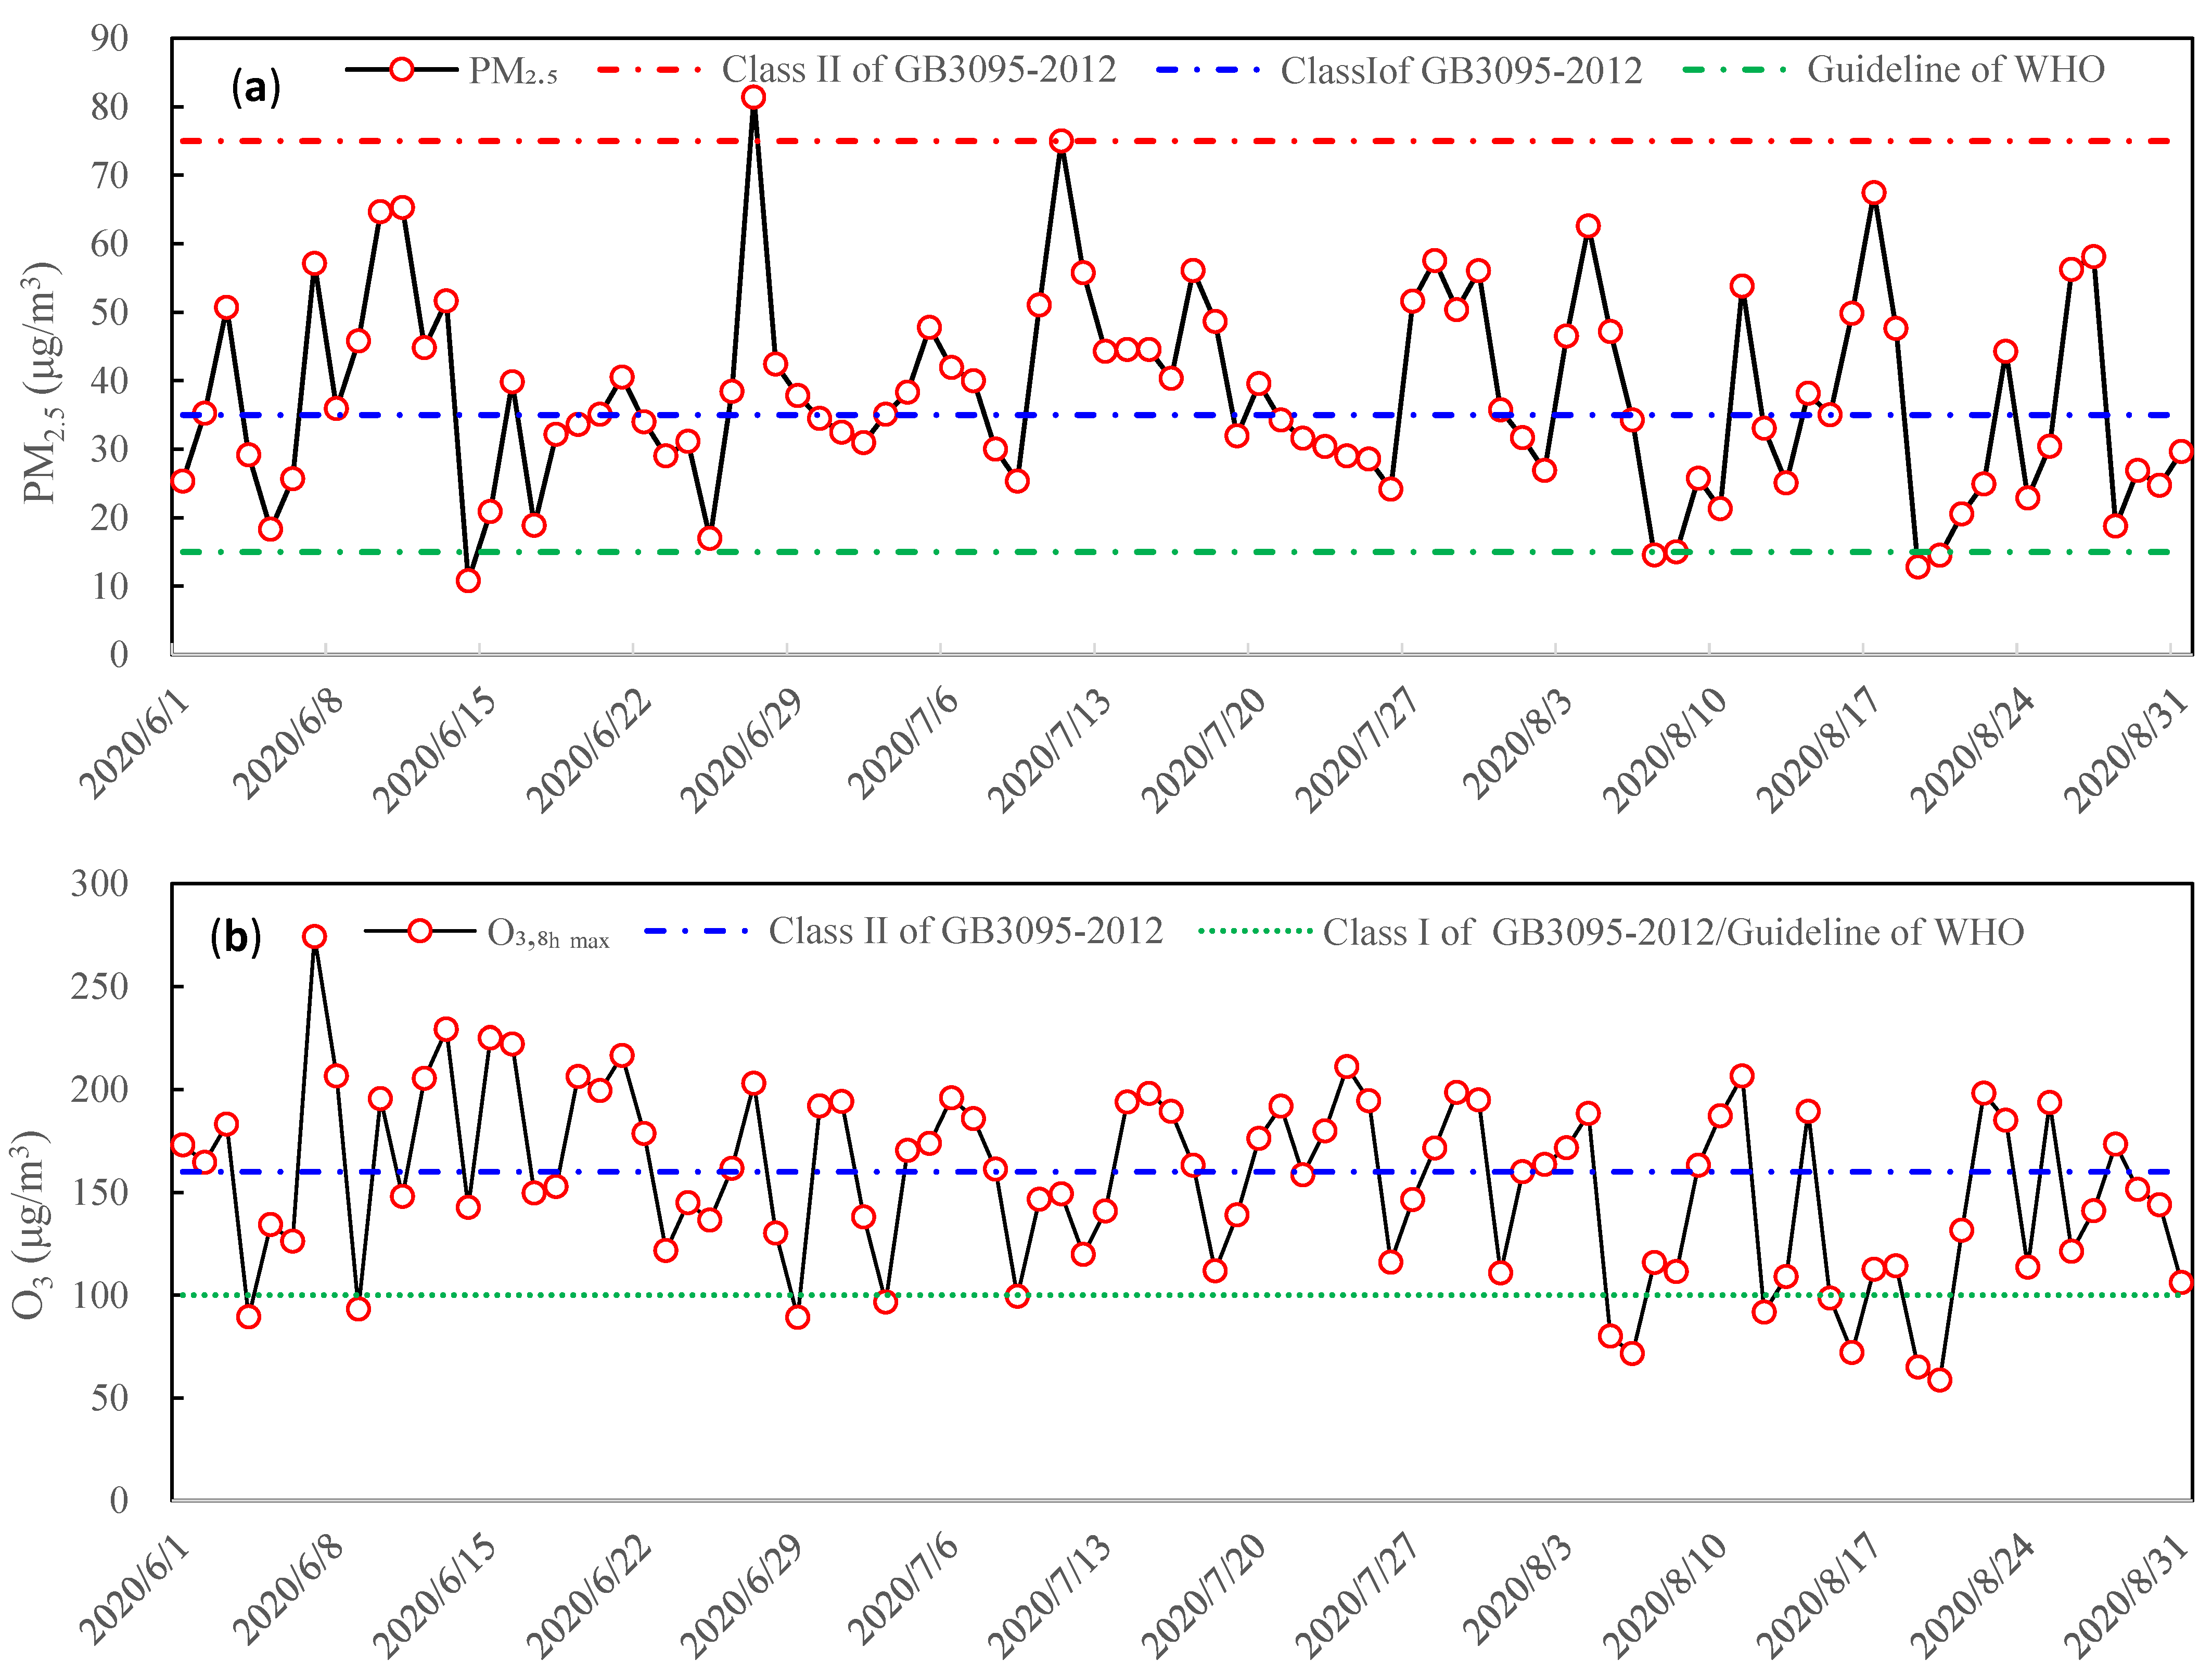
3.1. Mass Concentration of PM2.5 and O3

The mass concentrations of PM2.5 and O3 are shown in Figure 1 during the summertime 2020 in Tianjin, China. As shown in Figure 1a, the PM2.5 daily mean mass concentration was from 10.8 to 81.4 μg/m3, and the quarterly mean mass concentration 37.7 ± 19.8 μg/m3. Compared to the NAAQS of GB3095-2012, the PM2.5 daily mass concentration exceeded the class I (35 μg/m3) and class II (75 μg/m3) in 46 days and 1 day, respectively, accounting for 50% and 1% of the 92 days during the summertime 2020 in Tianjin, China. Compared to air quality guidelines (15 μg/m3) of the World Health Organization (WHO), during the observation period, the PM2.5 daily concentration exceeded 90 days and accounted for 97.8%. As shown in Figure 1b, the O3 seasonal mean concentration was 37.7 ± 19.8 μg/m3. The O3 daily 8 h average maximum (O3,8h max) mass concentration was between 58.6 and 274.3 μg/m3 during the summertime. According to the class I of O3,8h max (100 μg/m3) and the class II of O3,8h max (160 μg/m3), the O3,8h max mass concentration, respectively, exceeded 46 and 34 days, accounting for 50% and 37% of the 92 days in the summertime 2020 in Tianjin, China. These indicated that the combined pollution of PM2.5 and O3 has been shown during the observation period in Tianjin, China.
The COVID-19 pandemic unexpectedly broke out at the end of 2019. Due to the highly contagious, widespread, and risky nature of this disease, pandemic prevention and control measures were adopted in China, such as the public staying at home and some industries shutting down, which had an impact on the structure of pollution sources and air quality. Therefore, it must be clarified that the results of this study were based on exceptional circumstances.
In order to access the significance differences in the PM2.5 under the different photochemical activity levels of L, M, LH and H. The Kruskal–Wallis test was performed and the p value was equal to 0.000 and was significantly smaller than 0.05, which proved the significant difference in the PM2.5 under the different photochemical activity levels of L, M, LH and H. In order to define the quantify of PM2.5 levels, under the different photochemical activities indexed by O3, the PM2.5 and O3 mass concentrations are shown in Figure 2. The PM2.5 mass concentration varied from 6 to 64 μg/m3, from 5 to 102 μg/m3, from 5 to 110 μg/m3, and from 10 to 130 μg/m3, and the mean values were 29.8 ± 17.4, 32.9 ± 20.4, 39.4 ± 19.1 and 42.2 ± 18.9 μg/m3 under the photochemical activity levels of L, M, LH and H, respectively, which indicated that the PM2.5 mass concentration increased with the strength of the photochemical activity as ascertained by O3 levels, and serious pollution of PM2.5 typically occurred in association with active photochemical processes or reactions.

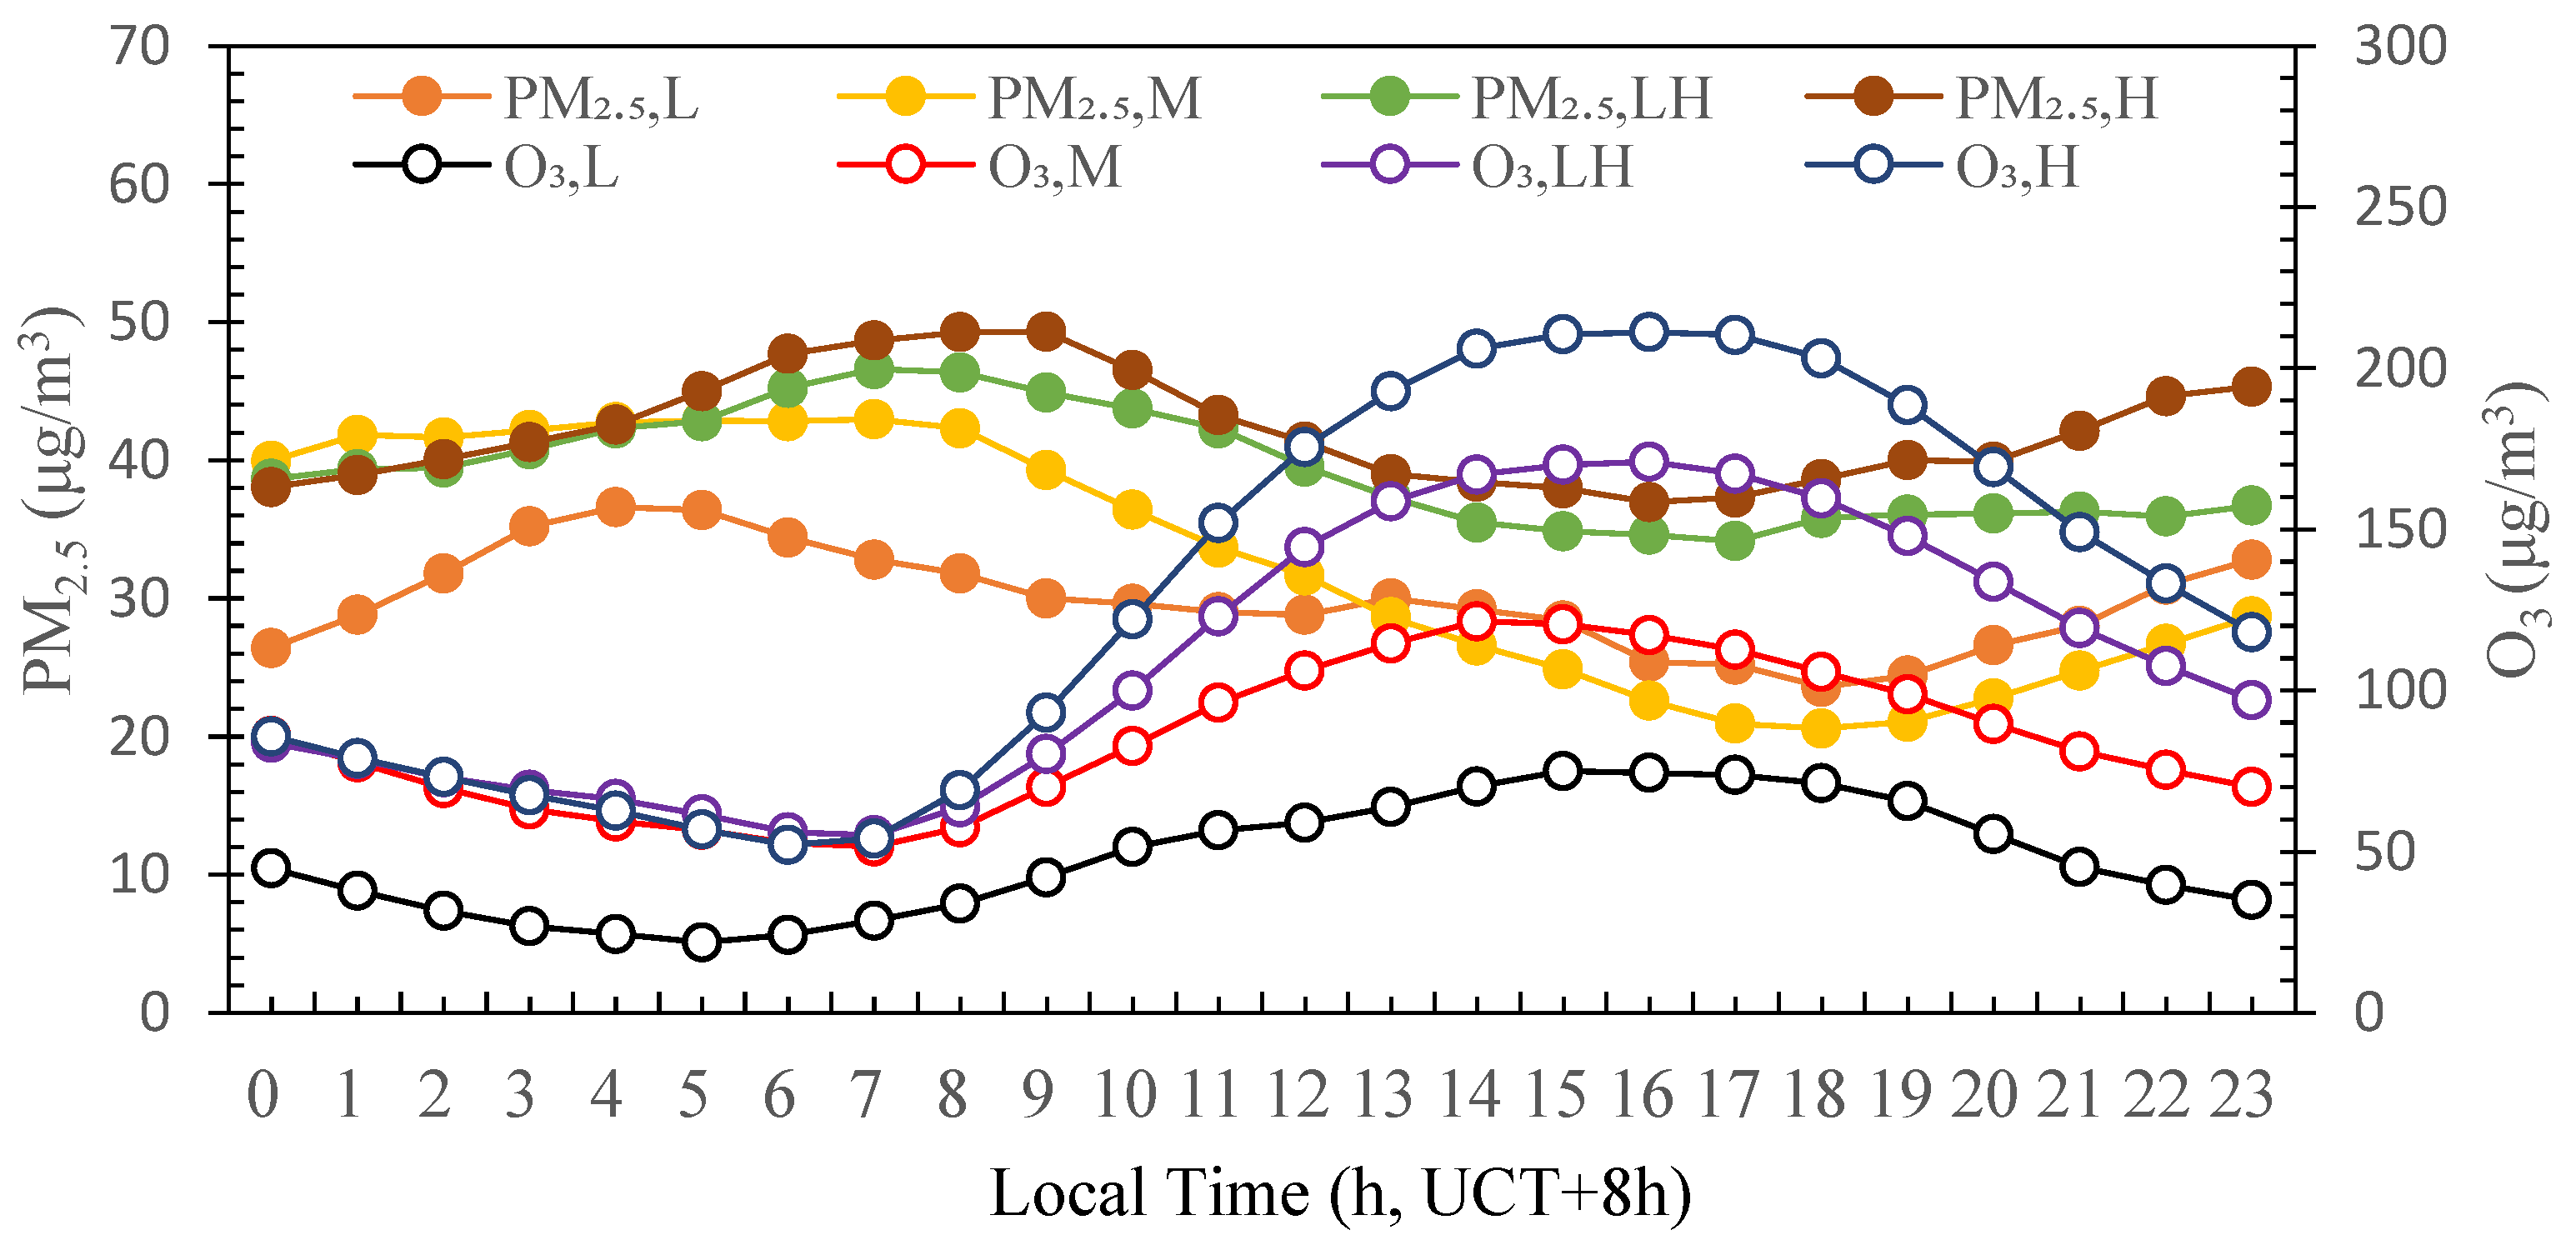
3.2. Diurnal Variations in PM2.5

Based on the classification of photochemical activity, the diurnal profiles of hourly mean concentrations of PM2.5 and O3 are shown in Figure 3. The mass concentrations of PM2.5 and O3 presented a distinct diurnal pattern. The diurnal profile of PM2.5 showed a bimodal distribution. In contrast, the diurnal profile of O3 showed a unimodal distribution with peak value in the afternoon. When the photochemical activity level was L, both PM2.5 and O3 mass concentrations were relatively low and with small fluctuation amplitude, the maximum mass concentrations were 36.6 µg/m3 and 74.4 µg/m3 occurring at around 4:00 and 15:00, respectively. When the photochemical activity level was M, the mass concentrations of O3 were higher but the fluctuation amplitude was still low and the maximum value (121.5 µg/m3) was observed at 14:00. The fluctuation amplitude of PM2.5 was very significant. The maximum value (43.0 µg/m3) was observed at 7:00 and the minimum value (20.6 µg/m3) was observed at 18:00. When the photochemical activity level was LH, the mass concentrations of PM2.5 and O3 were obviously increasing during the daytime and the maximum values were 46.6 µg/m3 and 171.0 µg/m3 and observed at 7:00 and 16:00, respectively. When the photochemical activity level was H, the mass concentration of O3 further increased with a very significant fluctuation amplitude in the daytime and the maximum (211.0 µg/m3) was observed at 16:00. The PM2.5 mass concentrations also increased with small fluctuation amplitude in the daytime. The maximum mass concentration of PM2.5 increased to 49.3 µg/m3 and lagged until 9:00. In summary, under the different levels of photochemical activity, PM2.5 showed similar diurnal variation profile affected by the morning rush hours, the maximum appeared at around 5:00–9:00, after which the PM2.5 mass concentration gradually decreased and its minimum mass concentration occurred around 16:00–18:00 and then gradually increased affected by the night rush hours until 23:00. The mass concentration of O3 showed single peak pattern with lower mass concentration at night and rising rapidly around 7:00 accompanied by the enhancement of solar radiation, reaching the maximum values around 14:00–16:00 and then gradually decreasing until 23:00.

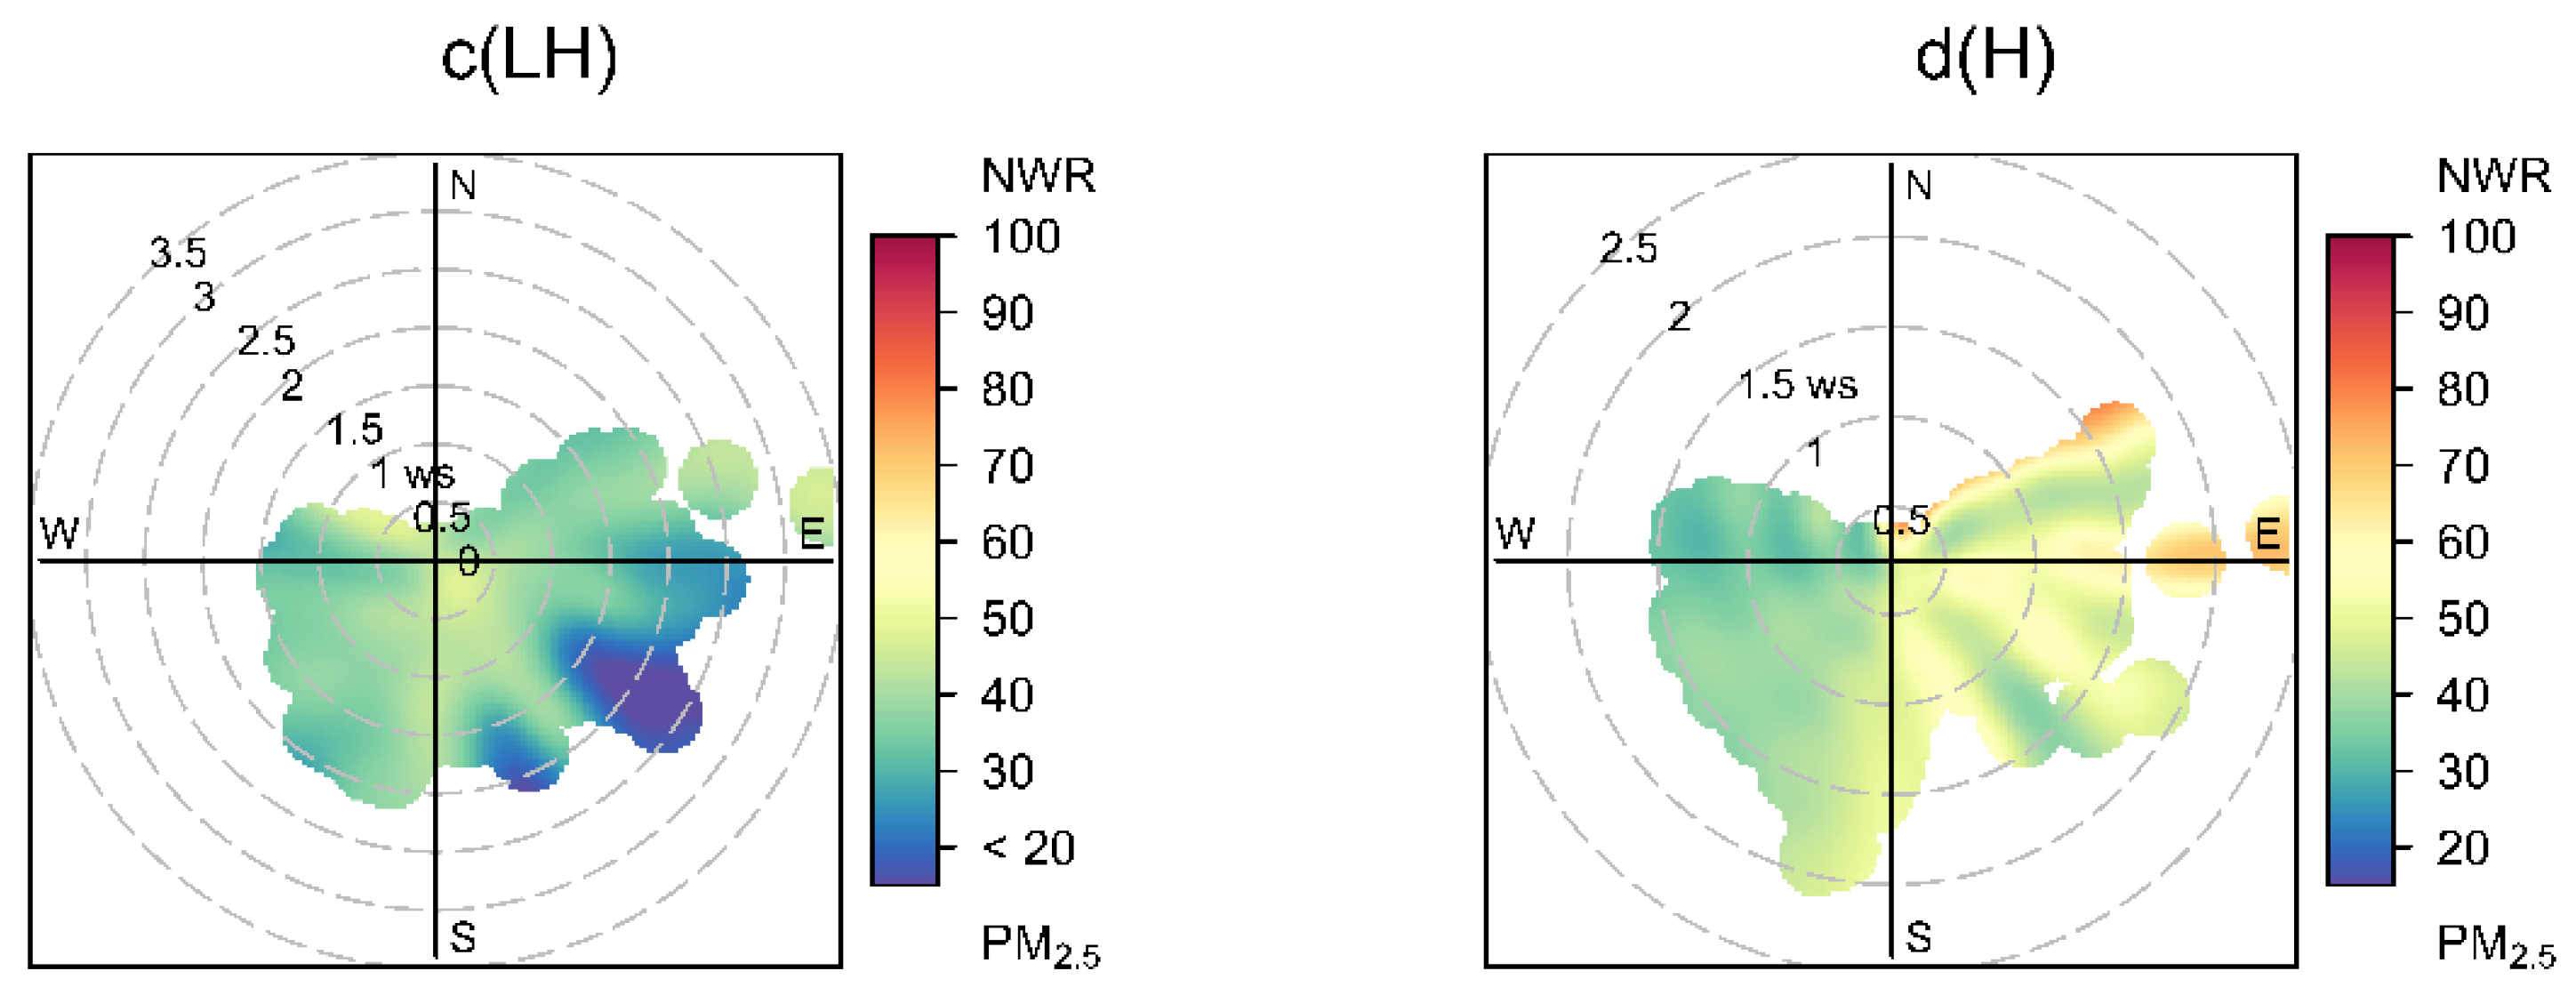
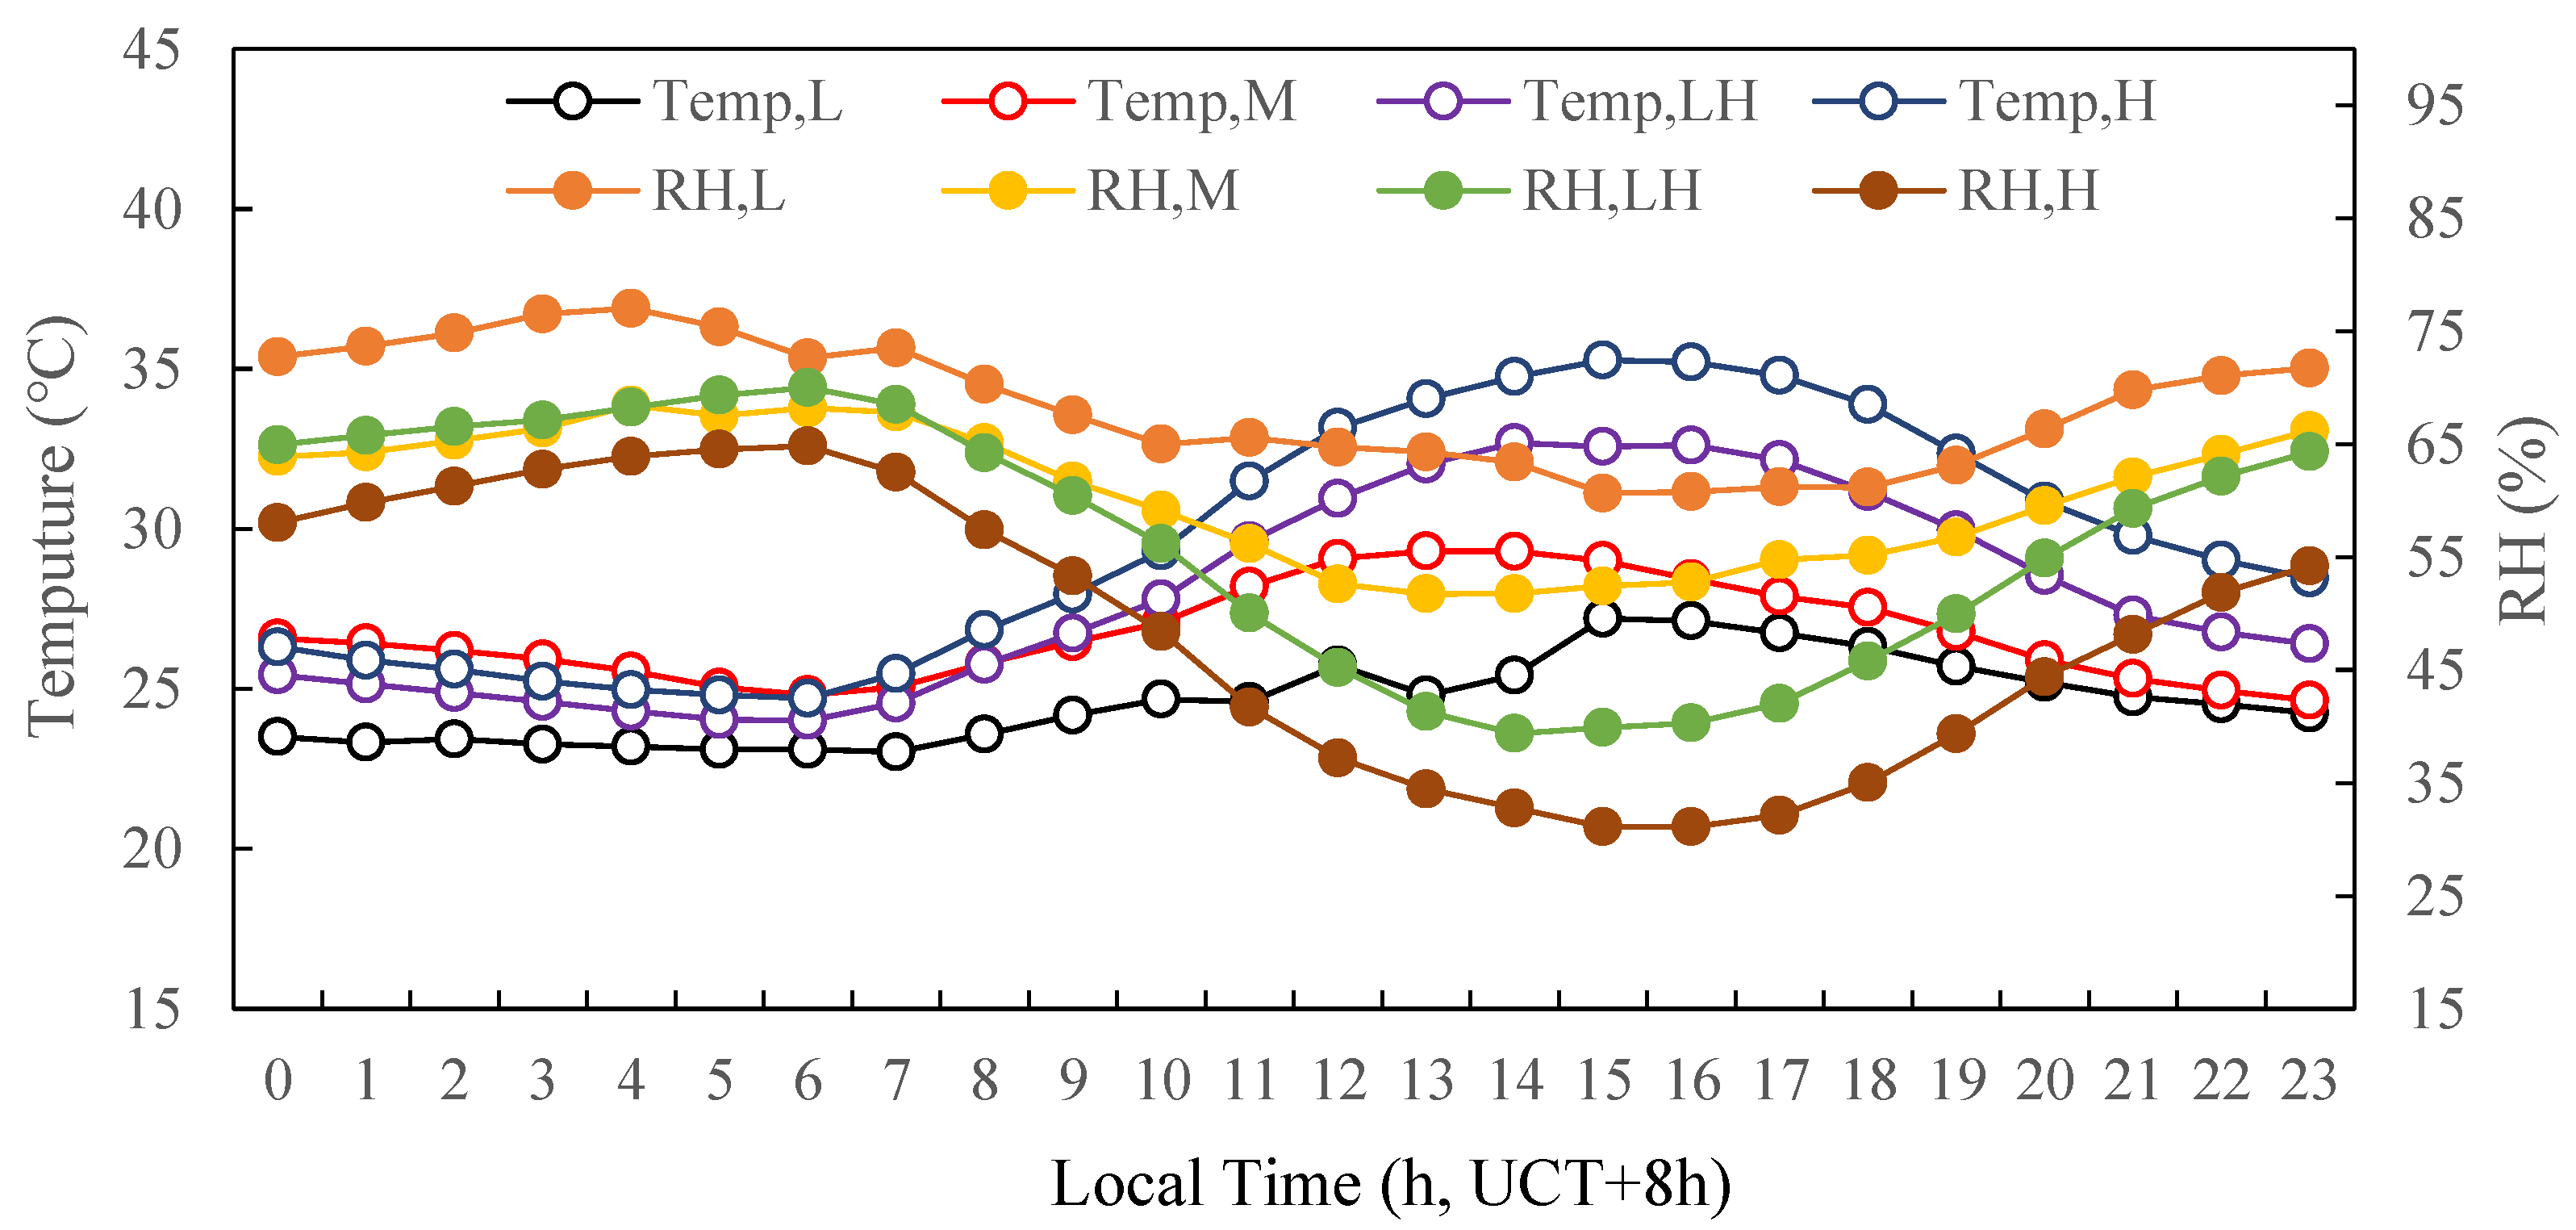
3.3. The Effect of Meteorological Parameters in PM2.5

Under the different photochemical activity levels, the bivariate polar plot (Figure 4) showed the PM2.5 as a function of wind speed and direction, which was used to identify sources responsible for the significant concentrations [32]. Under the L photochemical activity level, the mass concentrations of PM2.5 were high and associated with low wind speeds (<1.5 m/s) indicating the dominance of local pollutants. Under the photochemical activity levels of M, LH and H, the high mass concentrations of PM2.5 were associated with low wind speeds (<1.5 m/s) and high wind speeds (>1.5 m/s) attributed from locally produced and long-range-transported pollutants. The high concentrations of PM2.5 were observed in multiple directions, except for the north, when the wind speeds were low, indicating large heterogeneity in the emission sources. Additionally, the high mass concentrations of PM2.5 with high wind speeds over the photochemical activities of LH and H was associated with the breeze from the southwest and northeast directions.
The other meteorological parameters, including temperature and relative humidity (RH), were also shown in Figure 5. Under the different photochemical activity levels of L, M, LH and H, the diurnal patterns of ambient temperature were typical unimodal and ranged from 23.0 to 27.2 °C, 24.6 to 29.3 °C, 24.0 to 32.7 °C, and 24.7 to 35.3 °C, respectively. The diurnal patterns of RH anti-correlated with temperature. RH ranged from 60.7% to 77.0%, 51.7% to 68.2%, 39.4% to 70.0%, and 31.1% to 64.8%, respectively. This indicated that the photochemical activity level increased along with temperature and conversely decreased with the increase in RH.

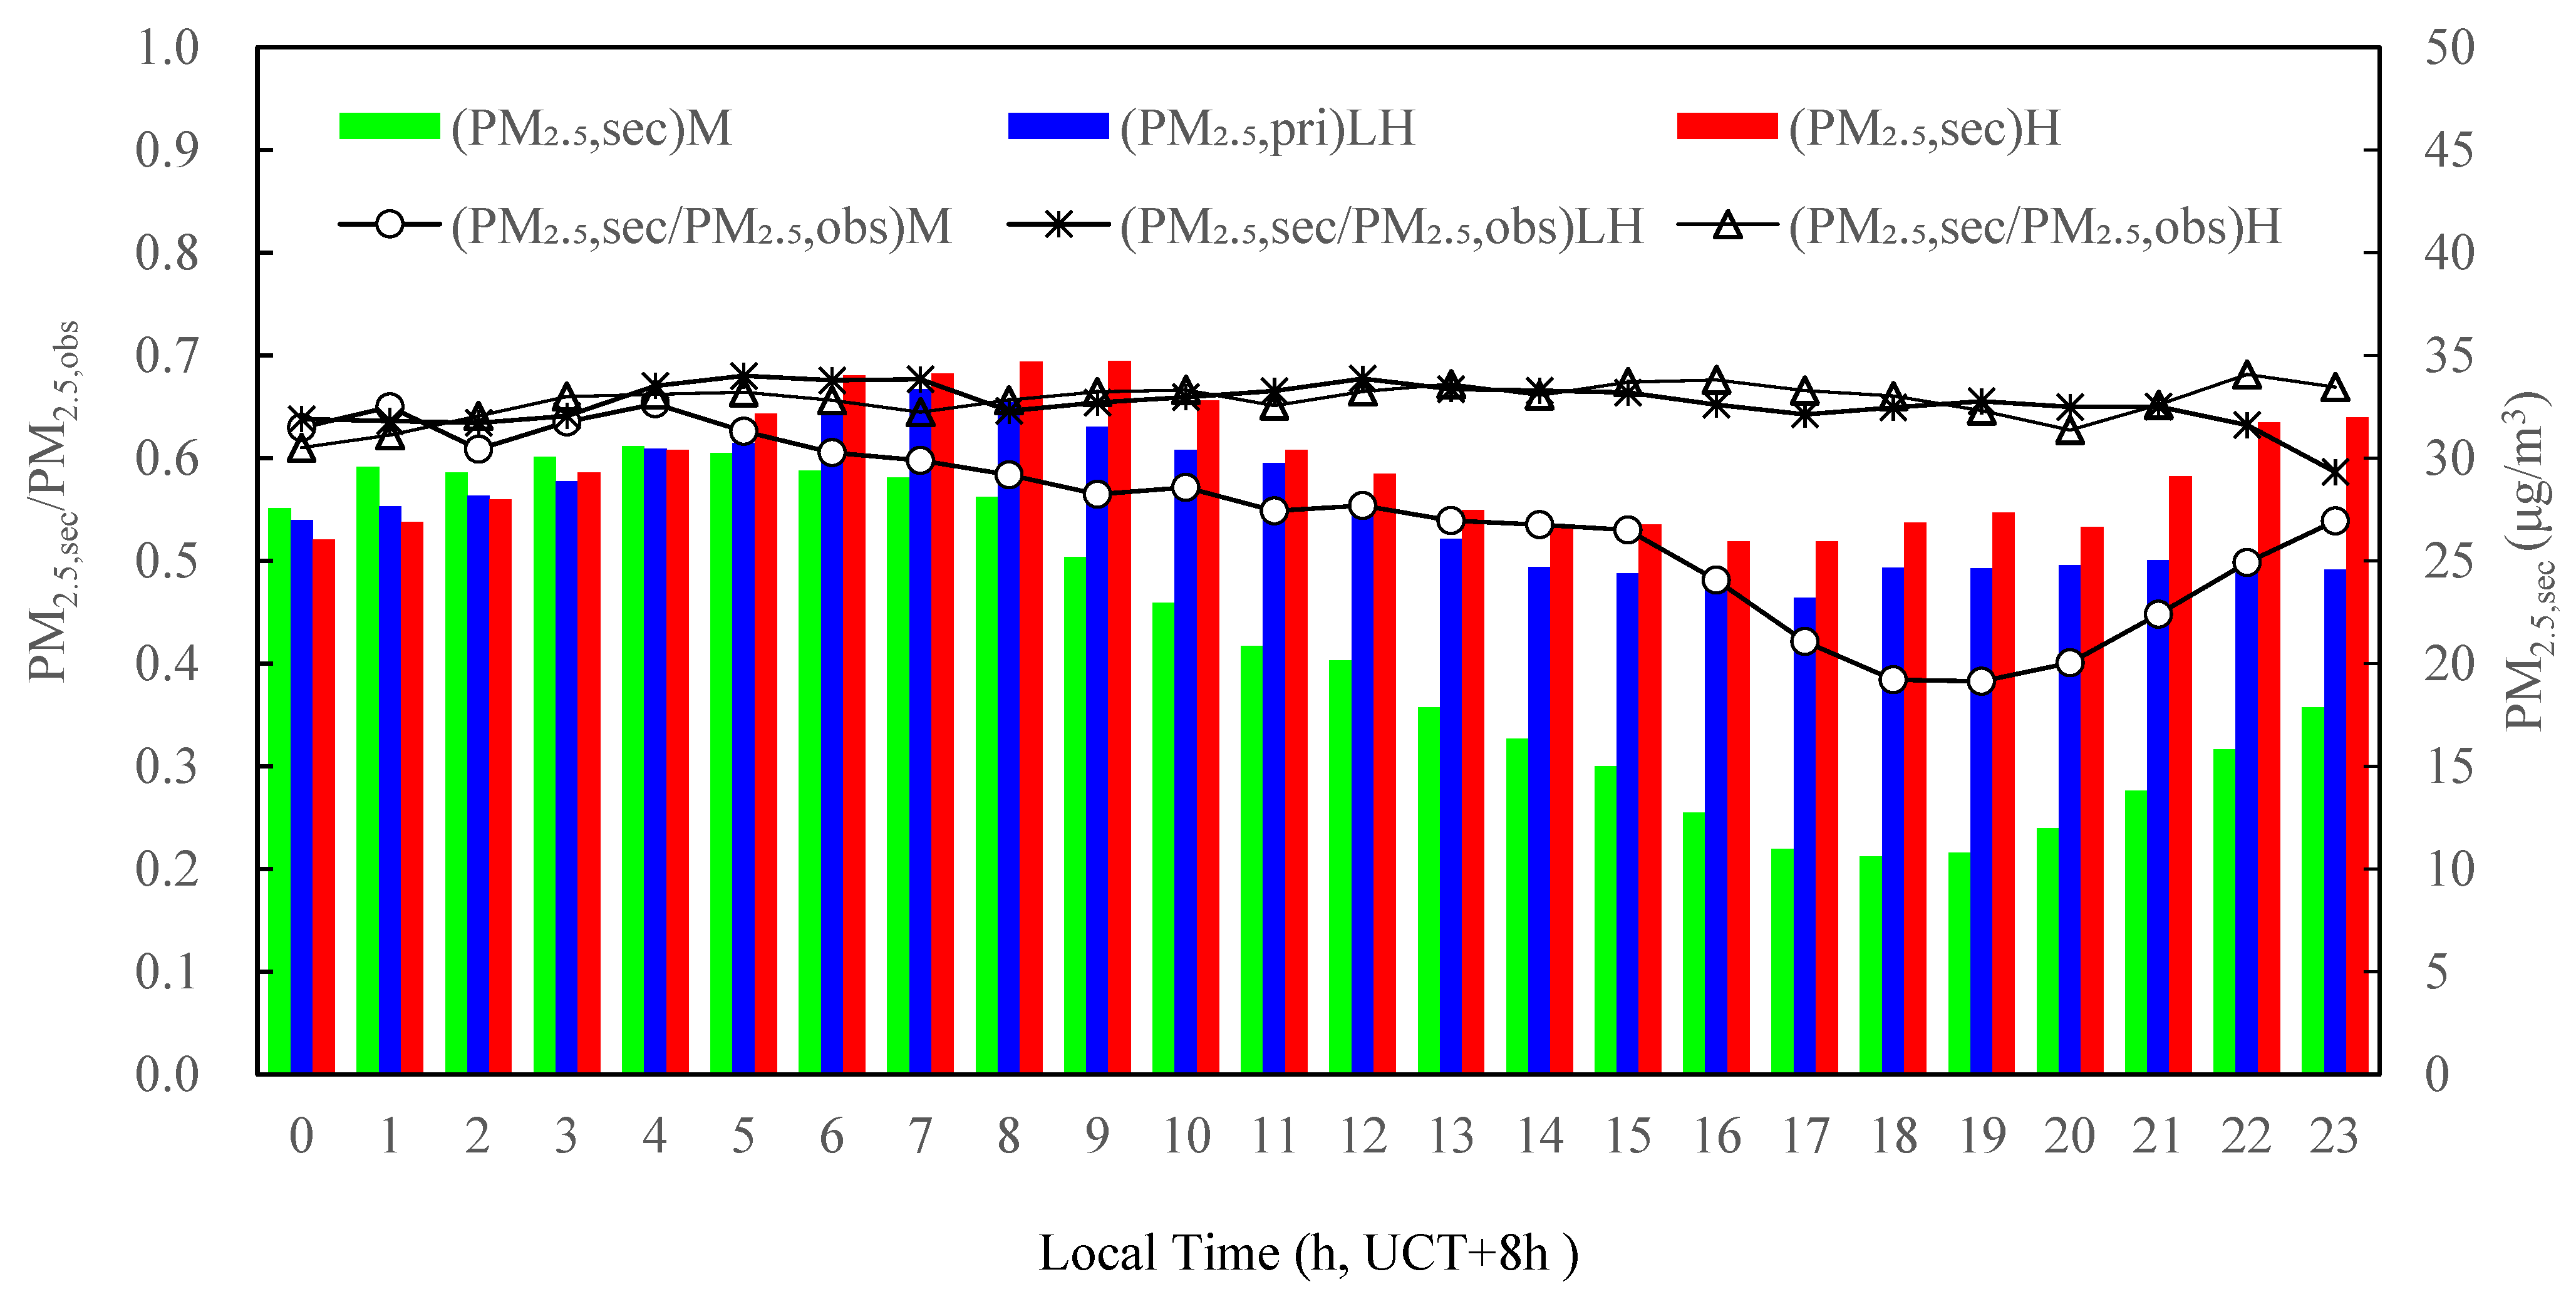
3.4. Secondary Aerosols Estimation

Equations (1)–(3) were used to estimate the primary mass concentrations of PM2.5 for the three O3,max intervals of M, LH, and H. As shown in Figure 6, at the different photochemical activity levels, the diurnal patterns of estimated primary PM2.5 mass concentration were similar with a small fluctuation amplitude. The maximum values appeared at about 8:00 corresponding to the morning rush hours and the minimum values appeared around 15:00–16:00 owing to the joint effect of increasing of the mixing layer height (MLH) and atmospheric temperature. The primary PM2.5 concentrations then increased after 18:00, corresponding to the night rush hours, and then they were relatively steady during the night. Under the photochemical activity level of M, the ratio of estimated primary concentration to the observed mass concentration of PM2.5 (PM2.5,pri/PM2.5,obs) was about 0.30 from 0:00 to 5:00, then it gradually increased and reached a secondary peak value (0.38) at 11:00, lagging the morning rush hours by 2–3 h, then after a slight decrease it rapidly increased and reached the primary peak value (0.49) corresponding to the night rush hours. This indicated that diurnal variation in the primary PM2.5 mass concentration was mainly affected by traffic emission sources under the photochemical activity level M. Under the photochemical activity levels of LH and H, the ratio of PM2.5,pri/PM2.5,obs presented a small variation (between 0.29 and 0.33), with no peaks related to the morning or night rush hours. It could be seen that the proportion trend under the M photochemical level was significantly different from under the photochemical levels of LH and H. Analyzing the reasons for this, it was possible that the secondary aerosol concentrations were lower at the photochemical level of M than that at the photochemical levels of LH and H (see Figure 7). Furthermore, the primary aerosol concentrations also varied at the different photochemical levels. The joint effect led to the different proportion trend.
The secondary PM2.5 concentrations were estimated using Equations (4)–(6) by subtracting the estimated primary PM2.5 from the observed PM2.5, as shown in Figure 7. At the M, LH and H photochemical activity levels, the daily variation trend of the generated secondary aerosols was nearly similar and between 26.0 and 32.2 μg⸳m−3 from 0:00 to 5:00, after which the mass concentration of the secondary aerosol significantly decreased at the M photochemical activity and reached the lowest value (10.6 μg/m3) at 18:00, after which there was an increase. Under the LH photochemical activity, the secondary aerosol reached the first peak (33.4 μg/m3) at 7:00, then gradually decreased and reached the lowest value (23.2 μg/m3) at 17:00, and no significant variations were registered after that. Under the H photochemical activity level, the secondary aerosol reached the first peak (34.7 μg/m3) at 9:00, then gradually decreased and reached the lowest value (25.9 μg/m3) at 17:00, and after that then slightly increased and reached the second peak value (32.0 μg/m3). This showed that the mass concentration of secondary PM2.5 aerosol increased with the increase in photochemical activity. The contribution ratio of the secondary PM2.5 to the observed PM2.5 was more than 58.6% at any hour under the photochemical activities of LH and H.
Because the national standards used by different countries are different, there were certain differences in the specific values selected when defining the photochemical activity level of O3, so there will be differences in the estimated primary aerosol and secondary aerosol. Therefore, there are certain limitations when comparing and analyzing different literatures.
The diurnal patterns of primary organic aerosol (POA) and secondary organic aerosol (SOA) are shown in Figure 8. This indicates that the daily variation in the POA mass concentration was from 0.76 to 1.42 μg/m3 under different photochemical activity levels, with the maximum value occurring at around 7:00 according to the traffic morning rush hour, implying that large amounts of hydrocarbons were emitted from vehicles and were beneficial to the formation of POA. The first and second peaks of the SOA mass concentration appeared at about 11:00–13:00 and 19:00–21:00, lagging about 4 h after morning and night rush hours, respectively. Since the secondary organic aerosol was formed from gaseous organic precursors, SOA was thus an important source of PM2.5 in Tianjin during this measurement period. This phenomenon was observed in the late summer 2002 in Pittsburgh [29] and in Mexico City Metropolitan Area in 2006 [33].

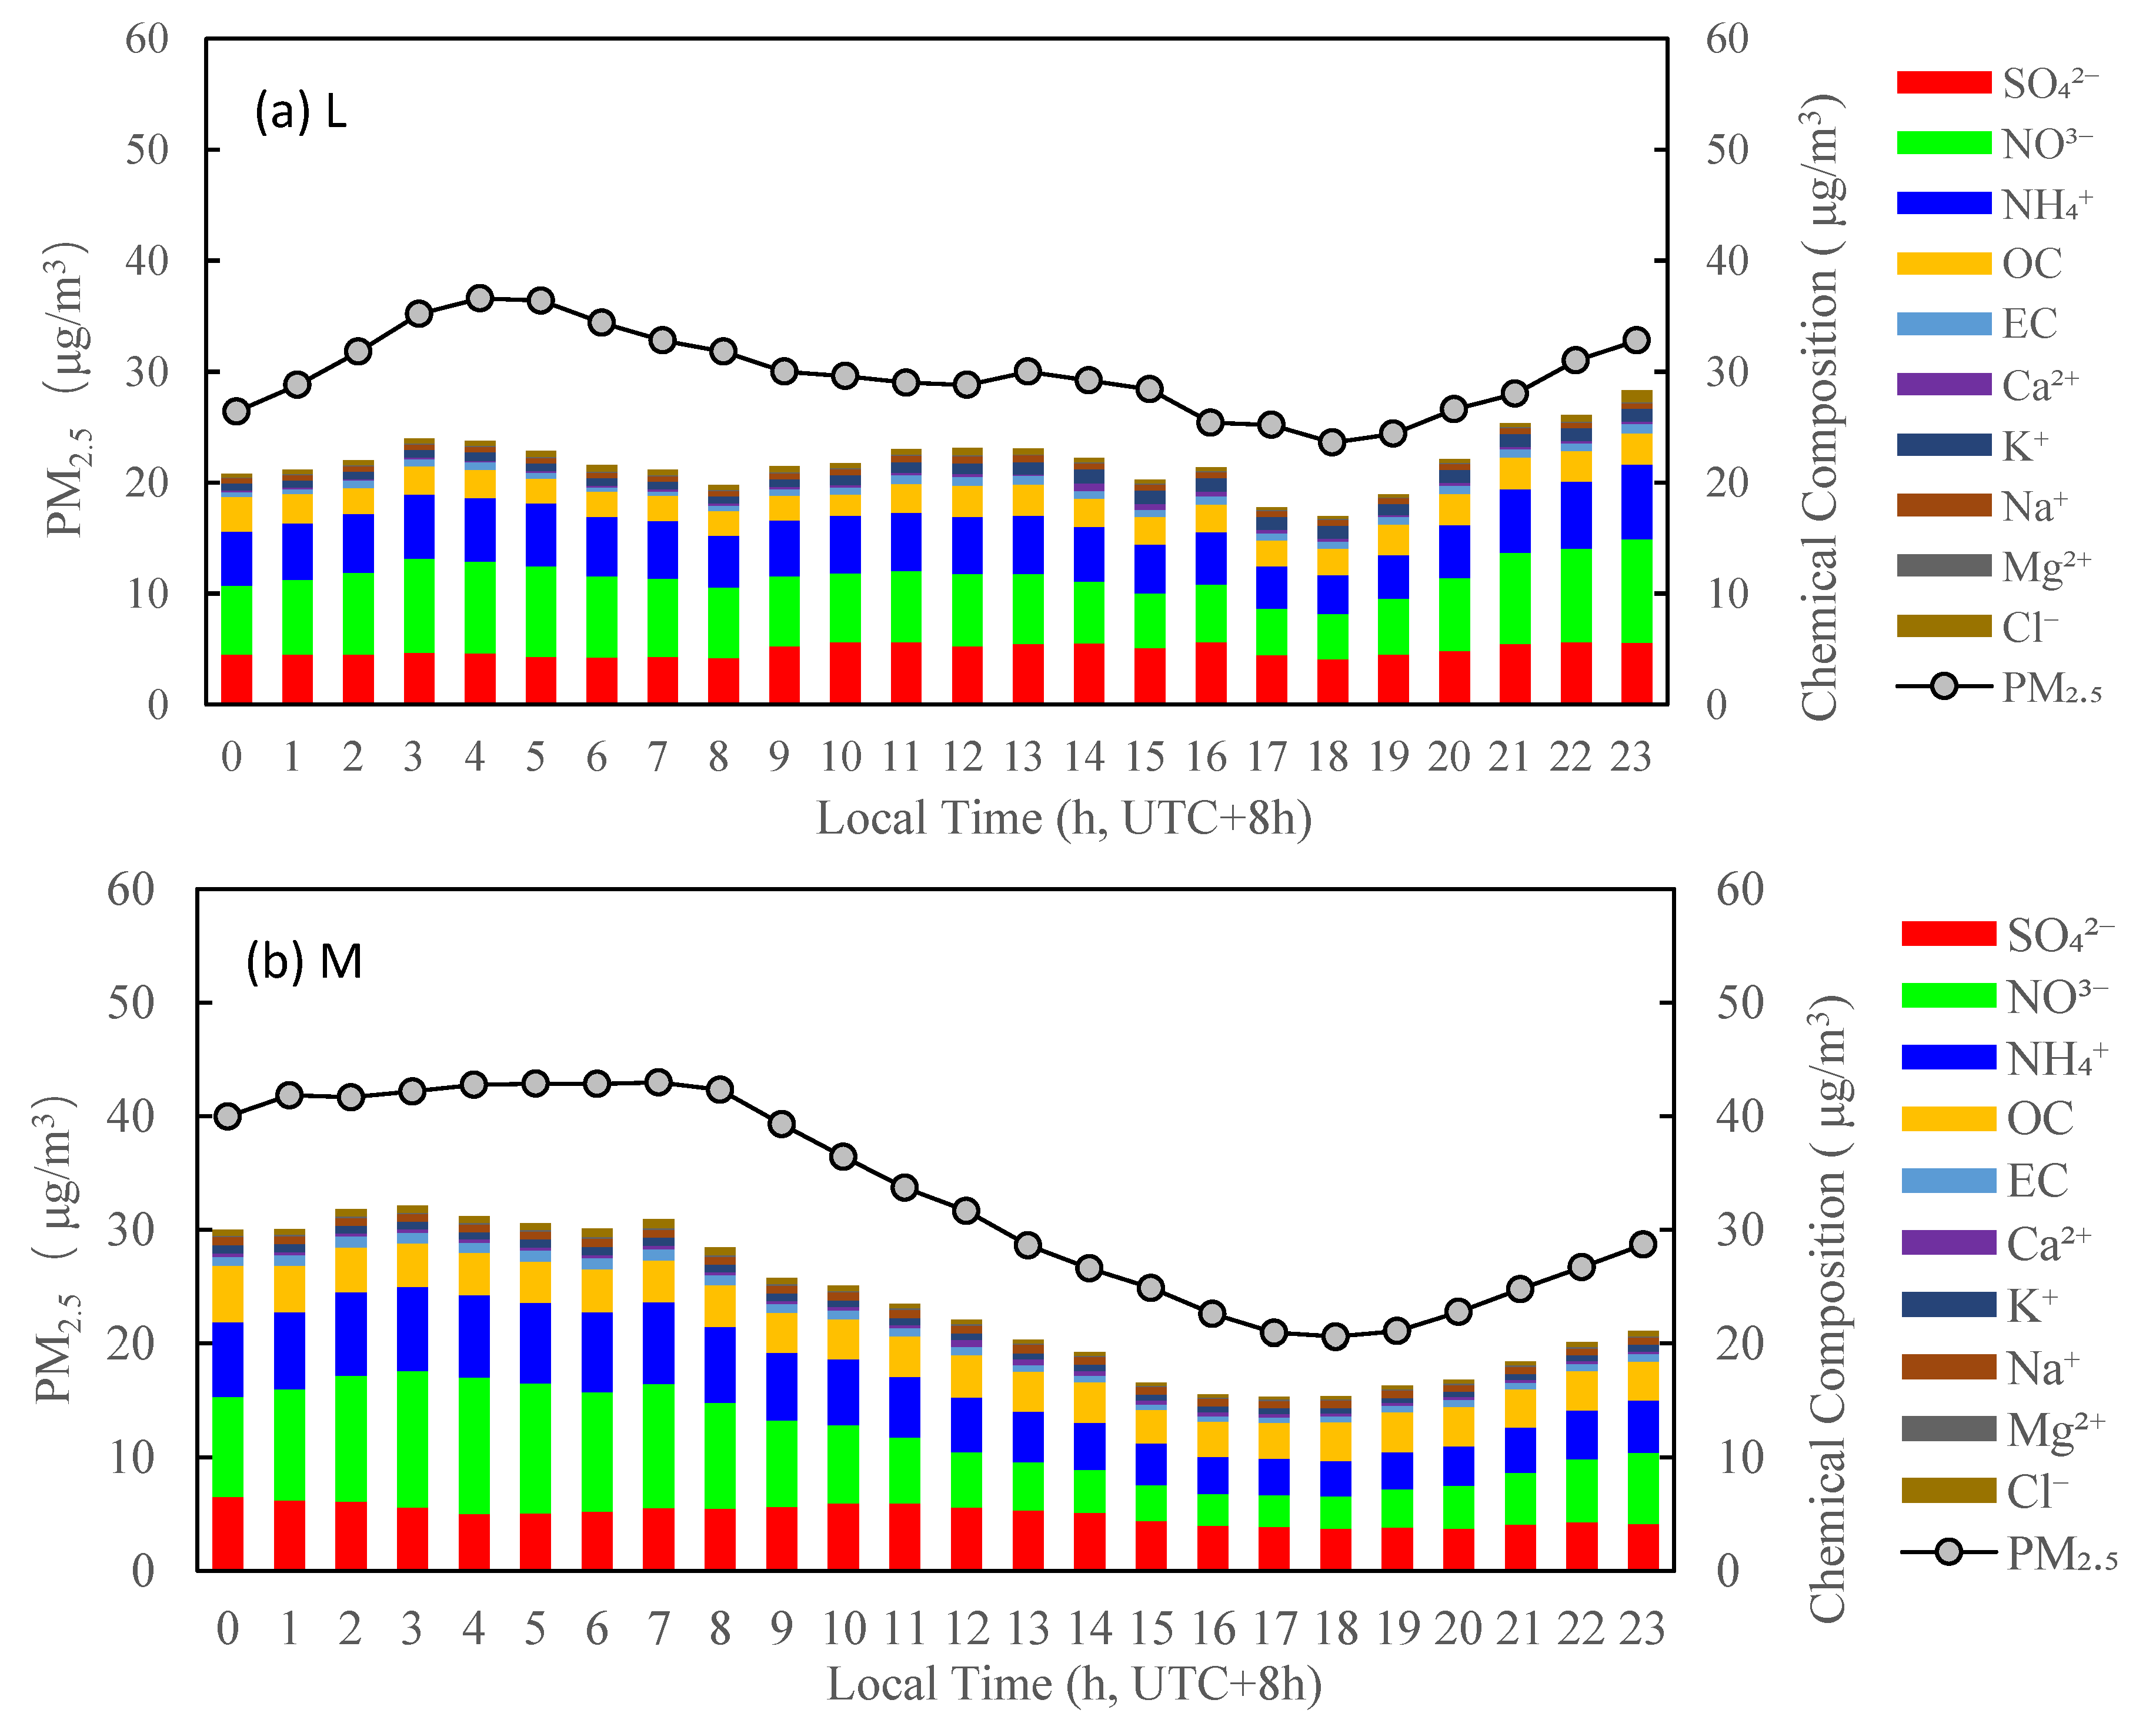
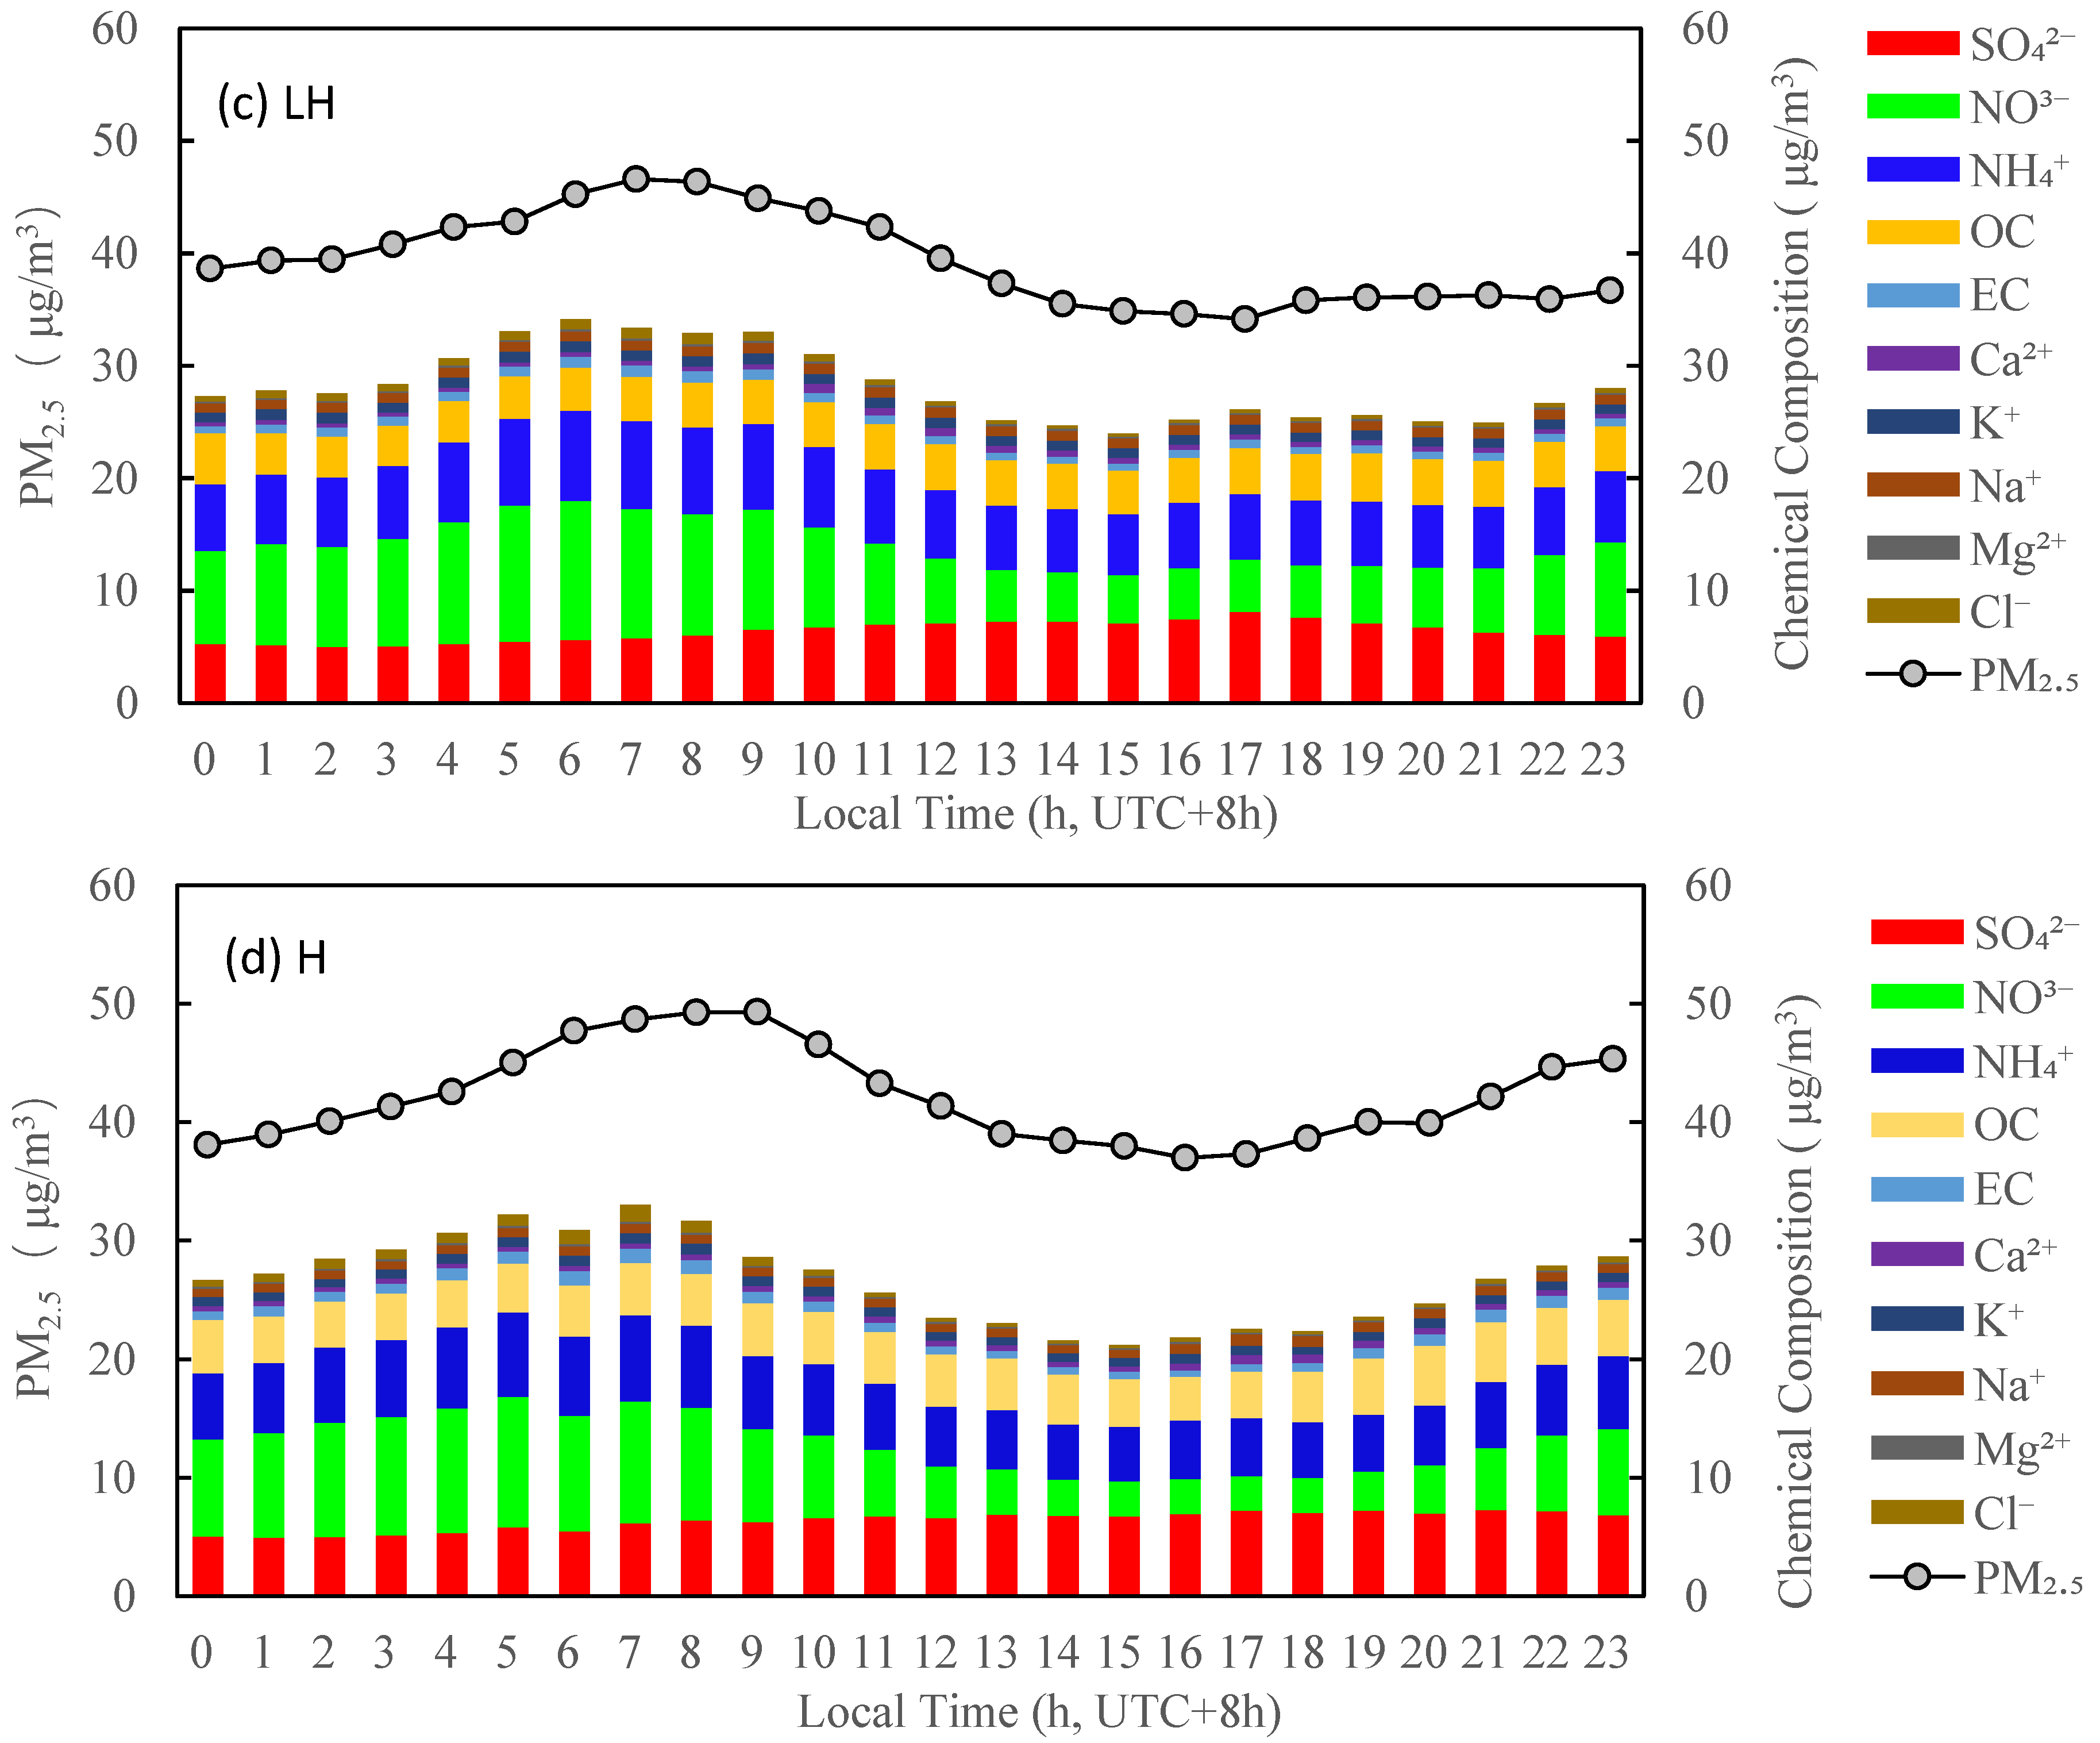
3.5. PM2.5 Chemical Characterization

The main chemical components, including water-soluble inorganic ions, OC, and EC in PM2.5, are shown in Table 1 under the different photochemical activity levels. The total mass concentration of the detected 10 components were 21.4 ± 12.4, 22.5 ± 15.9, 27.6 ± 14.6 and 26.4 ± 13.2 μg/m3, respectively accounted for 73.5 ± 14.9%, 70.3 ± 24.9%, 72.0 ± 21.9%, and 65.8 ± 21.2% in PM2.5 under the photochemical activity levels of L, M, LH, and H. The missed mass could be mainly non-soluble crustal materials and metal species. The statistical analysis of main chemical components was performed by the Kruskal–Wallis test and the p values were smaller than 0.05, indicating the significant difference under the different photochemical activity levels.
The diurnal profiles of the measured PM2.5 and chemical components reconstructed PM2.5 mass concentrations correlated well in Figure 9a showed that the diurnal variations in chemical components were steady, except for slightly elevated OC in the morning which might be resulted from vehicle emissions according to the morning rush hour. The diurnal variation in chemical components in Figure 9b was similar to Figure 9a. However, the mass concentrations of components were slightly enhanced. Figure 9c shows that the mass concentrations of chemical components were even higher and peak value of OC was shifted to 11:00, which was closer to the occurrence time of SOC by higher O3,max (see Figure 7). For the photochemical activity of H, Figure 9d showed that the peak value of the sum over aerosol chemical components occurred at 11:00; however, the peak value of OC and SO42− reaches the summit at 13:00. This was due to the decrease in NO3 after 11:00 which might result from evaporation loss of NO3 at high ambient temperature [34,35,36,37]. The sum of aerosol chemical components was apparently enriched under the photochemical activity level H as shown in Figure 9d. This provided the evidence of secondary aerosol formation under high photochemical activity in Tianjin. The peak values of OC, SO42−, and NO3 were 5.0, 11.0, and 7.3 μg/m3, respectively, under the photochemical activity level of H, which was higher than that of 3.1, 9.4, and 5.6 μg/m3, respectively, under the photochemical activity level L. In summary, under the different photochemical activities, the peak value of PM2.5 was accompanied with the increase in the sum of mass concentrations of SO42−, NO3 and NH4+ (SNA) and OC. The hourly mass concentration maximum value of SNA in PM2.5 were 21.7, 24.9, 26.0 and 24.0 μg/m3 under the photochemical activity levels of L, M, LH, and H, respectively. This indicated that the formation of secondary aerosols contributed significantly to the increase in PM2.5 mass. Furthermore, as shown in Figure 10, under the photochemical activities of L, M, LH, and H, SO42− and NO3 were nearly neutralized by NH4+, with a regression slope of 0.71, 0.77, 0.77, and 0.75 between 2[SO42−] + [NO3] and [NH4+], respectively, where [NH4+], [SO42−], [NO3] refers to the molar concentration (μmol/m3), suggesting that ammonia was abundant and that the formation of particulate nitrate and sulfate was under an ammonia-rich condition in this measurement period. The result was observed at a rural site in eastern Yangtze River Delta of China [38].

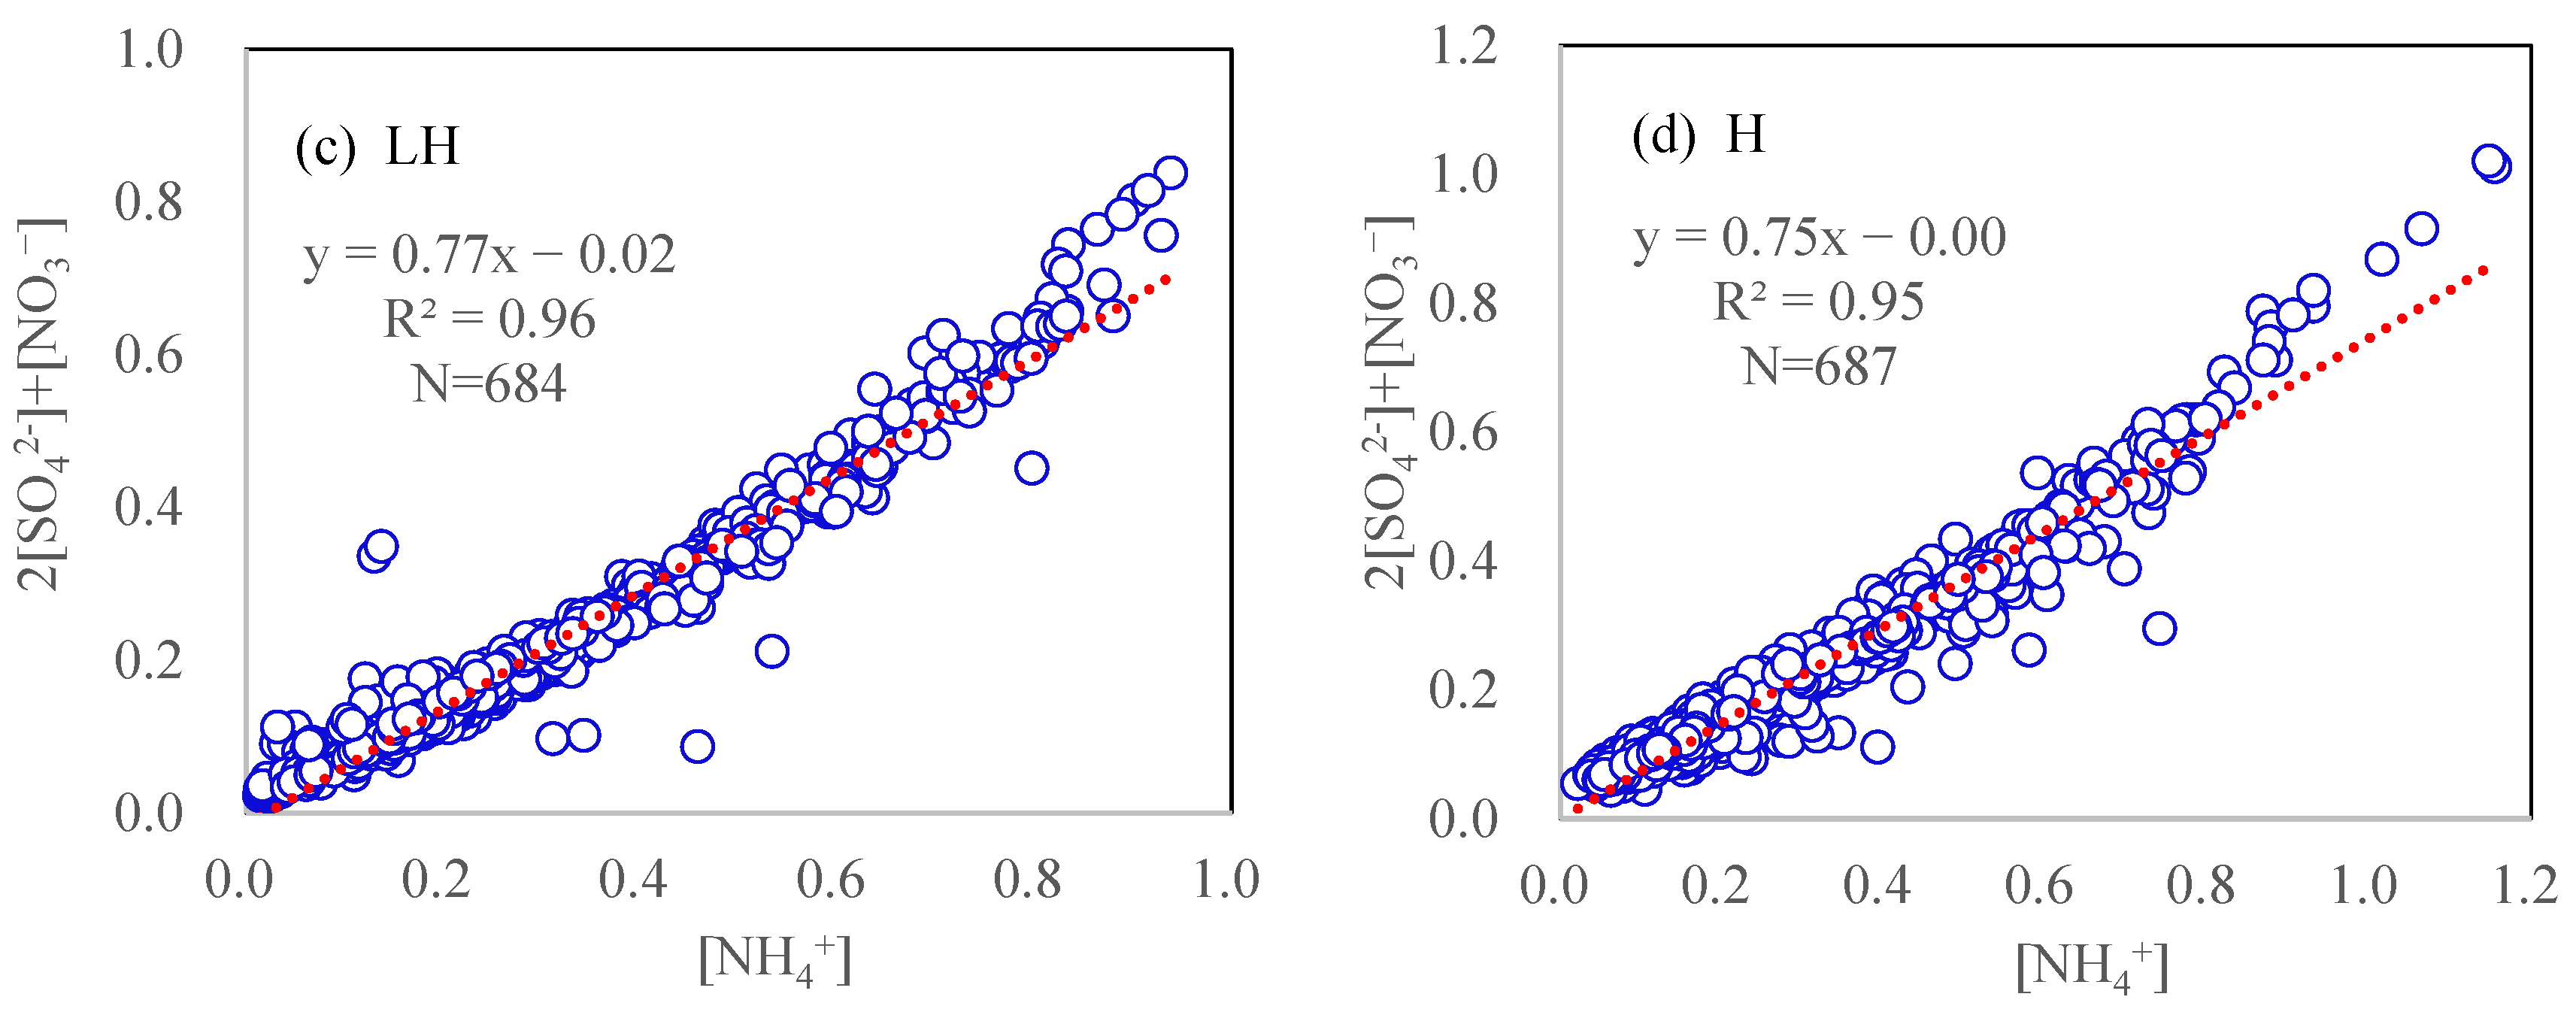
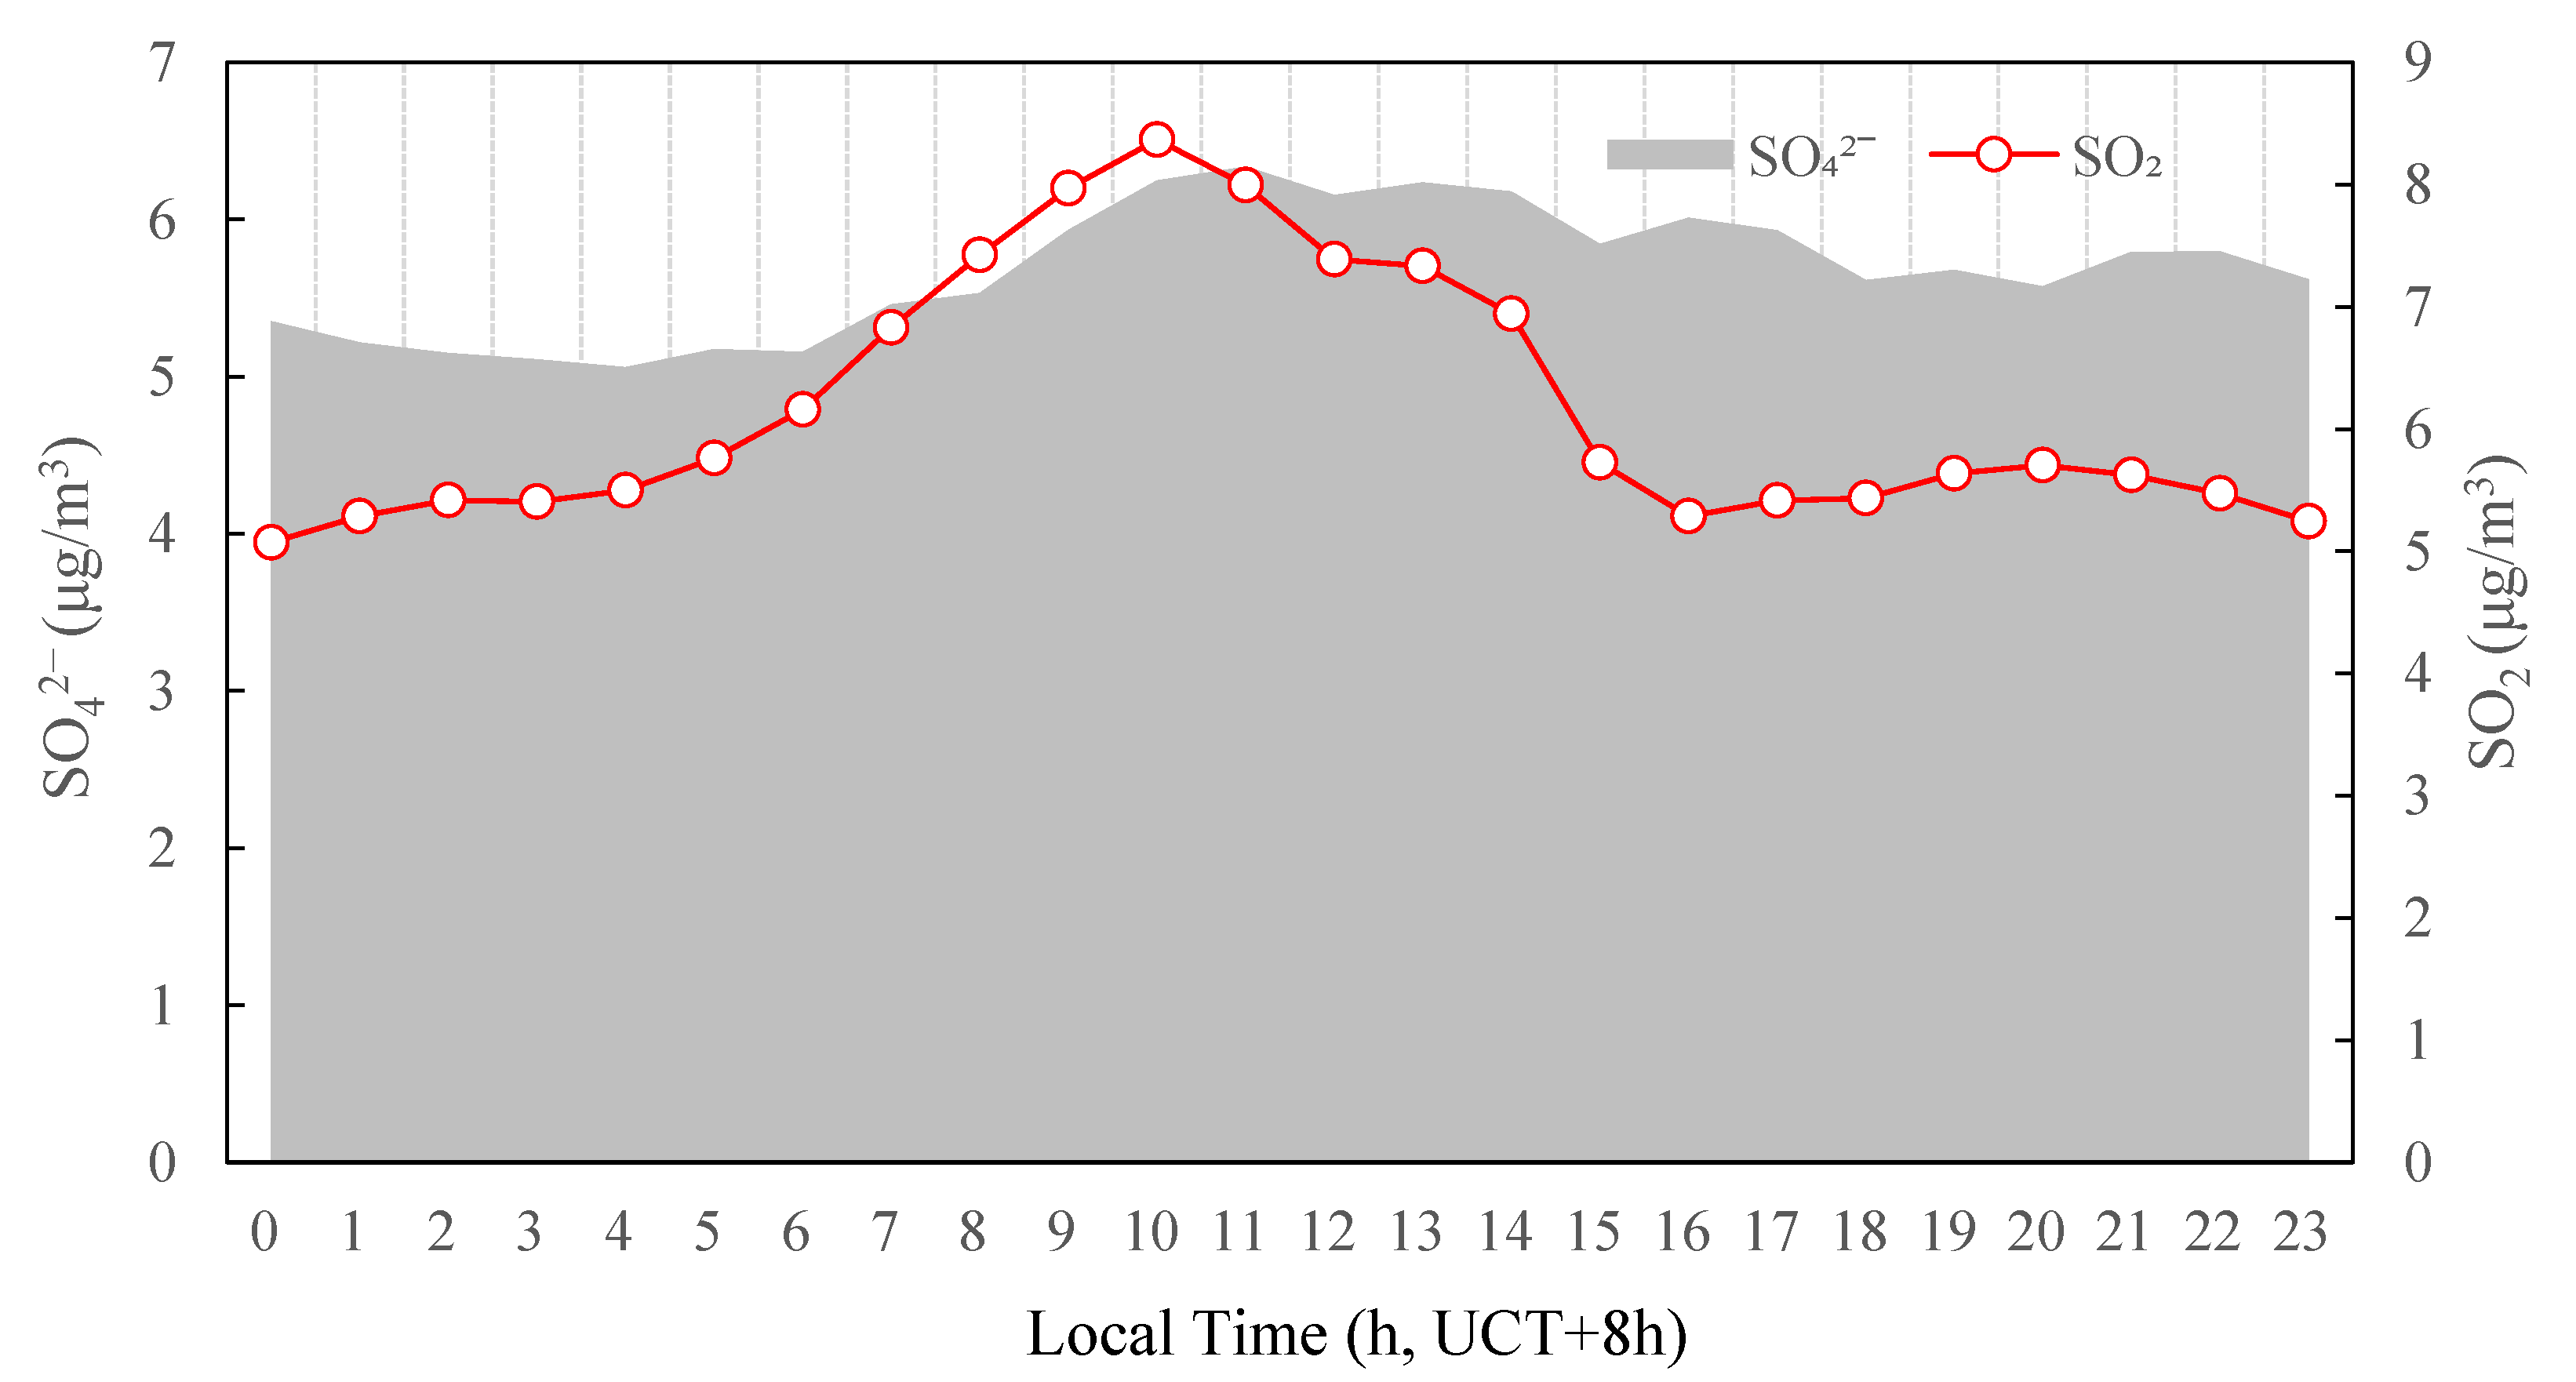
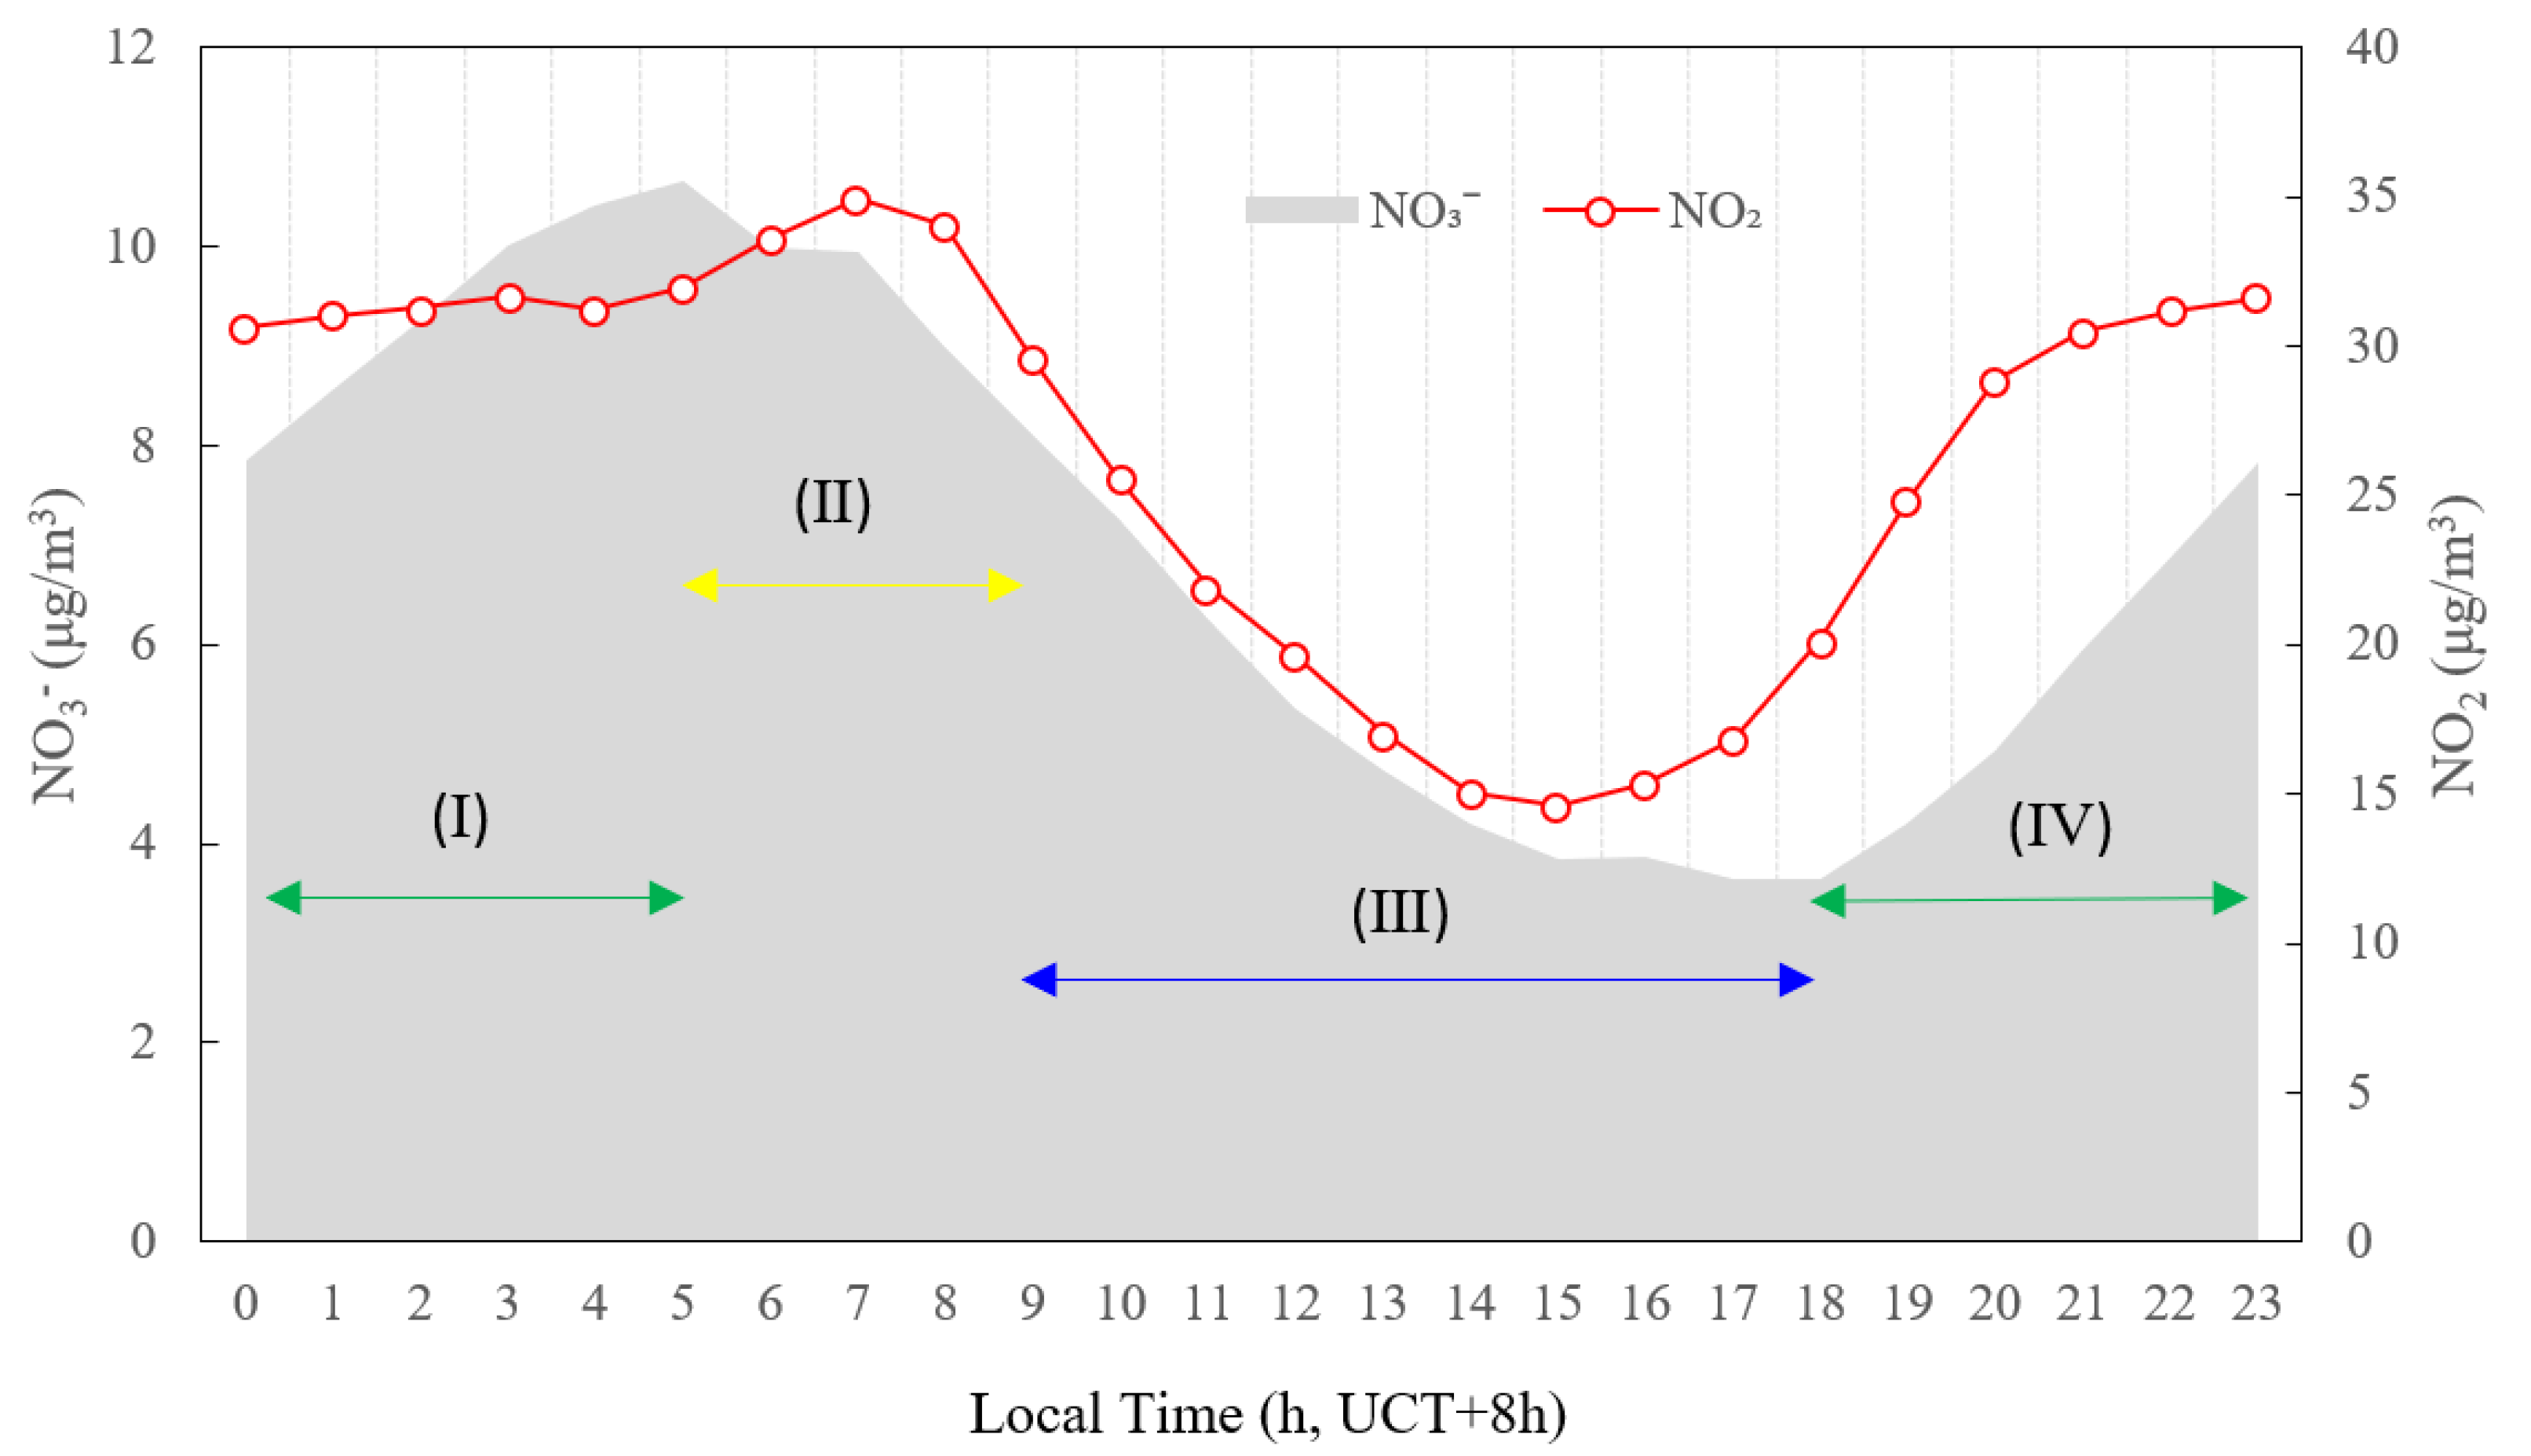
3.6. Insights into the Formation of SO42− and NO3

In order to investigate the formation mechanism of SO42−, the diurnal profiles of SO42− and SO2 mass concentration are shown in Figure 11 under the photochemical activity levels M, LH and H. The mean mass concentration of SO42− showed a rapid increase from 5.2 μg/m3 to 6.3 μg/m3 between 6:00 and 11:00. SO2 increased sharply from 6:00 and peaked at 10:00. The SO2 peak was thus 1 h earlier than the SO42− peak, suggesting rapid formation of secondary sulfate, from the increased concentrations of SO2 probably due to traffic emissions in the morning rush hours, coupled with the propitious photochemical conditions. It suggested that active oxidation of SO2 in the gas phase was mainly responsible for the observed morning production of sulfate. The oxidation of SO2 to sulfuric acid (H2SO4) could occur both in the aqueous phase and in the gas phase [39,40,41]. Recent studies have shown that the gas-phase oxidation of SO2 to H2SO4 had become more and more important [42]. In this pathway, SO2 was first oxidized by OH to sulfur trioxide (SO3) and then to H2SO4 [42,43].
In order to investigate the different formation mechanisms of nitrate, the daytime was divided into four stages, as shown in Figure 12: Stage I, 0:00–5:00; Stage II, 5:00–9:00; Stage III, 9:00–18:00; Stage IV, 18:00–23:00. During Stage I, the mass concentration of NO2 kept on slowly increasing while the temperature was relatively low and RH was relatively high. Moreover, the temperature and RH stayed relatively constant during this stage, as could be seen in Figure 5, implying that the thermal equilibrium entered a steadier state. Some previous studies have shown that nitrate radical (NO3) and/or N2O5 were converted to nitric acid (HNO3) by hydrolysis under high RH [44,45]. During Stage II, the mass concentration of NO2 rapidly increased and peaked at about 7:00, due to the traffic emissions and relatively low mixed layer height (MLH). At the same time, the mass concentration of O3 began to rise due to increasing solar radiation and more active photochemical reactions [46,47]. These observations together indicated that elevated nitrate concentration was primarily due to gas-phase photochemical oxidation. The result was consistent with the observation in Hong Kong [48]. During Stage III, the mass concentrations of NO3 sharply decreased, probably because the NO3 radical was easily destroyed by photolysis under the strong photochemical activity of this period in the day. Furthermore, the decrease in the nitrate concentration could also be attributed to the evaporation of ammonium nitrate due to the increasing temperature and the enhancement of the atmospheric diffusion capacity as the MLH ascends [49]. During Stage IV, the temperature decreased while RH gradually increased (Figure 5). The mass concentration of O3 gradually decreased (Figure 3) and remained relatively high during the period. The mass concentration of NO2 rose after sunset due to traffic emissions during the evening rush hours coupled with lower MLH. Due to the presence of abundant NO2 and O3, as well as the absence of sunlight, the conditions were created for the concentration of NO3 radical to increase gradually [50], leading to a steady increase in NO3 concentration in this period. This observation was consistent with the measurement in August 2011 in the urban area of Shanghai [51].

4. Conclusions

Based on the atmospheric environment monitoring data, the study has performed the chemical characterization of PM2.5 and the estimation of the related secondary aerosol during the summertime 2020 in Tianjin, China. Under the photochemical activities of L, M, LH, and H, the PM2.5 mass concentration increased with the strength of the photochemical activity as ascertained by O3 levels and the diurnal patterns were similar to the maximum and minimum appeared at around 7:00–9:00 and 16:00, respectively. The diurnal patterns of estimated secondary aerosol increased with the strength increase in photochemical activity. In particular, the ratio of estimated secondary aerosol to the observed PM2.5 was more than 58.6% at any hour under the photochemical activity of LH and H, indicating secondary aerosols became the key issue of PM2.5 pollution in Tianjin. The chemical composition, including water-soluble ions, OC and EC, respectively accounted for 73.5 ± 14.9%, 70.3 ± 24.9%, 72.0 ± 21.9%, and 65.8 ± 21.2% of the observed PM2.5 mass. In particular, the SNA significantly contributed to the increase in PM2.5 under an ammonia-rich condition in this observation period. The photochemical oxidation of SO2 to H2SO4 was enhanced by the strong atmospheric photochemical reactions. Nitrate was mainly produced by the photochemical oxidation reactions in the daytime, but high temperature and low RH shifted the gas-to-particle partitioning of NH4NO3 to evaporation, thus led to an extremely low particulate nitrate concentration in the afternoon.

Author Contributions

Data curation, Z.C.; Formal analysis, S.P. and F.C.; Investigation, G.H.; Methodology, S.P. and W.C.; Resources, G.H.; Software, N.Z.; Writing—original draft, J.G. All authors have read and agreed to the published version of the manuscript.

Funding

This study was supported by the Natural Science Foundation of Tianjin, China (Grant No. 19JCYBJC23900) and the Science and Technology Program of Tianjin (Grant No. 19PTZWHZ00070).

Institutional Review Board Statement

Not applicable.

Informed Consent Statement

Not applicable.

Data Availability Statement

The data presented in this study are available on request from the corresponding author.

Conflicts of Interest

The authors declare no conflict of interest.

References

  1. Chen, Z.; Wang, J.N.; Ma, G.X.; Zhang, Y.S. China tackles the health effects of air pollution. Lancet 2013, 382, 1959–1960. [Google Scholar] [CrossRef]
  2. Xu, P.; Chen, Y.; Ye, X. Haze, air pollution, and health in China. Lancet 2013, 382, 2067. [Google Scholar] [CrossRef]
  3. Zheng, Y.; Xue, T.; Zhang, Q.; Geng, G.; Tong, D.; Li, X.; He, K. Air quality improvements and health benefits from China’s clean air action since 2013. Environ. Res. Lett. 2017, 12, 114020. [Google Scholar] [CrossRef]
  4. Wu, Z.; Zhang, Y.; Zhang, L.; Huang, M.; Zhong, L.; Chen, D.; Wang, X. Trends of outdoor air pollution and the impact on premature mortality in the Pearl River Delta region of southern China during 2006–2015. Sci. Total Environ. 2019, 690, 248–260. [Google Scholar] [CrossRef]
  5. Cai, S.; Wang, Y.; Zhao, B.; Wang, S.; Chang, X.; Hao, J. The impact of the “Air Pollution Prevention and Control Action Plan” on PM2.5 concentrations in Jing-Jin-Ji region during 2012–2020. Sci. Total Environ. 2017, 580, 197–209. [Google Scholar] [CrossRef]
  6. Wang, L.; Zhang, F.; Pilot, E.; Yu, J.; Nie, C.; Holdaway, J.; Yang, L.; Li, Y.; Wang, W.; Vardoulakis, S.; et al. Taking Action on Air Pollution Control in the Beijing-Tianjin-Hebei (BTH) Region: Progress; Challenges and Opportunities. Int. J. Environ. Res. Public Health 2018, 15, 306. [Google Scholar] [CrossRef] [Green Version]
  7. Zhang, N.N.; Ma, F.; Qin, C.B.; Li, Y.F. Spatiotemporal trends in PM2.5 levels from 2013 to 2017 and regional demarcations for joint prevention and control of atmospheric pollution in China. Chemosphere 2018, 210, 1176–1184. [Google Scholar] [CrossRef]
  8. Yadav, R.; Sahu, L.K.; Beig, G.; Jaaffrey, S.N.A. Role of long-range transport and local meteorology in seasonal variation of surface ozone and its precursors at an urban site in India. Atmos. Res. 2016, 176–177, 96–107. [Google Scholar] [CrossRef]
  9. Zhao, H.; Zheng, Y.; Li, C. Spatiotemporal Distribution of PM2.5 and O3 and Their Interaction During the Summer and Winter Seasons in Beijing; China. Sustainability 2018, 10, 4519. [Google Scholar] [CrossRef] [Green Version]
  10. Chen, J.; Shen, H.; Li, T.; Peng, X.; Cheng, H.; Ma, C. Temporal and spatial features of the correlation between PM2.5 and O3 concentrations in China. Int. J. Environ. Res. Public Health 2019, 16, 4824. [Google Scholar] [CrossRef] [Green Version]
  11. Li, K.; Jacob, D.J.; Liao, H.; Zhu, J.; Shah, V.; Shen, L.; Bates, K.H.; Zhang, Q.; Zhai, S. A two-pollutant strategy for improving ozone and particulate air quality in China. Nat. Geosci. 2019, 12, 906–910. [Google Scholar] [CrossRef]
  12. Ye, W.F.; Ma, Z.Y.; Ha, X.Z. Spatial-temporal patterns of PM2.5 concentrations for 338 Chinese cities. Sci. Total Environ. 2018, 631–632, 524–533. [Google Scholar] [CrossRef] [PubMed]
  13. Ding, H.; Kumar, K.R.; Boiyo, R.; Zhao, T. The relationships between surface-column aerosol concentrations and meteorological factors observed at major cities in the Yangtze River Delta; China. Environ. Sci. Pollut. Res. 2019, 26, 36568–36588. [Google Scholar] [CrossRef]
  14. Wang, T.; Xue, L.; Brimblecombe, P.; Lam, Y.F.; Li, L.; Zhang, L. Ozone pollution in China: A review of concentrations; meteorological influences; chemical precursors; and effects. Sci. Total Environ. 2016, 575, 1582–1596. [Google Scholar] [CrossRef]
  15. Grosjean, D. Organic acids in Southern California air: Ambient concentrations, mobile source emissions; in situ formation and removal processes. Environ. Sci. Technol. 1989, 23, 1506–1514. [Google Scholar] [CrossRef]
  16. Turpin, B.J.; Huntzicker, J.J. Identification of secondary organic aerosol episodes and quantitation of primary and secondary organic aerosol concentrations during SCAQS. Atmos. Environ. 1995, 29, 3527–3544. [Google Scholar] [CrossRef]
  17. Na, K.; Sawant, A.A.; Song, C.; Cocker, D.R. Primary and secondary carbonaceous species in the atmosphere of Western Riverside County; California. Atmos. Environ. 2004, 38, 1345–1355. [Google Scholar] [CrossRef]
  18. Wang, Z.; Li, Y.; Chen, T.; Zhang, D.; Sun, F.; Wei, Q.; Dong, X.; Sun, R.; Huan, N.; Pan, L. Ground-level ozone in urban Beijing over a 1-year period: Temporal variations and relationship to atmospheric oxidation. Atmos. Res. 2015, 164–165, 110–117. [Google Scholar] [CrossRef]
  19. Jia, M.; Zhao, T.; Cheng, X.; Gong, S.; Zhang, X.; Tang, L.; Liu, D.; Wu, X.; Wang, L.; Chen, Y. Inverse Relations of PM2.5 and O3 in air compound pollution between cold and hot seasons over an urban area of East China. Atmosphere 2017, 8, 59. [Google Scholar] [CrossRef] [Green Version]
  20. Zhang, S.C.; Lee, C.T. Secondary aerosol formation through photochemical reactions estimated by using air quality monitoring data in Taipei City from 1994 to 2003. Atmos. Environ. 2007, 41, 4002–4017. [Google Scholar] [CrossRef]
  21. Zhang, Z.; Zhang, X.; Gong, D.; Quan, W.; Zhao, X.; Ma, Z.; Kim, S.J. Evolution of surface O3 and PM2.5 concentrations and their relationships with meteorological conditions over the last decade in Beijing. Atmos. Environ. 2015, 108, 67–75. [Google Scholar] [CrossRef]
  22. Wang, J.; Zhao, B.; Wang, S.; Yang, F.; Xing, J.; Morawska, L.; Ding, A.; Kulmala, M.; Kerminen, V.; Kujansuu, J. Particulate matter pollution over China and the effects of control policies. Sci. Total Environ. 2017, 584–585, 426–447. [Google Scholar] [CrossRef] [PubMed]
  23. Tinajin Ecology and Environment Bureau. Monthly Report on Ambient Air Quality in Tianjin[EB/OL]. Available online: http://sthj.tj.gov.cn/env/envquality/thequalityofatmosphericenvironment/ (accessed on 1 January 2022).
  24. Rodríguez, S.; Querol, X.; Alastuey, A.; Mantilla, E. Origin of high summer PM10 and TSP concentrations at rural site in Eastern Spain. Atmos. Environ. 2002, 36, 3101–3112. [Google Scholar] [CrossRef]
  25. Cui, X.; Wu, Y.; Duan, Y.; Fu, Q.; Zhang, Y.; Wang, D.; Wang, Q. Secondary aerosol formation through photochemical reactions estimated by using air quality monitoring data in the downtown of Pudong, Shanghai. Environ. Sci. 2013, 34, 2003–2009. (In Chinese) [Google Scholar] [CrossRef]
  26. Tunved, P.; Hansson, H.C.; Kerminen, V.M.; Strom, J.; DalMaso, M.; Lihavainen, H.; Viisanen, Y.; Aalto, P.P.; Komppula, M.; Kulmala, M. High natural aerosol loading over boreal forests. Science 2006, 312, 261–263. [Google Scholar] [CrossRef]
  27. Zhang, Q.; Jimenez, J.L.; Canagaratna, M.R.; Allan, J.D.; Coe, H.; Ulbrich, I.; Alfarra, M.R.; Takami, A.; Middlebrook, A.M.; Sun, Y.L.; et al. Ubiquity and dominance of oxygenated species in organic aerosols in anthropogenically-influenced Northern Hemisphere midlatitudes. Geophys. Res. Lett. 2007, 34, L13801. [Google Scholar] [CrossRef] [Green Version]
  28. Huang, R.J.; Zhang, Y.L.; Bozzetti, C.; Ho, K.F.; Cao, J.J.; Han, Y.M.; Daellenbach, K.R.; Slowik, J.G.; Platt, S.M.; Canonaco, F.; et al. High secondary aerosol contribution to particulate pollution during haze events in China. Nature 2014, 514, 218–222. [Google Scholar] [CrossRef] [Green Version]
  29. Zhang, Q.; Worsnop, D.R.; Canagaratna, M.R.; Jimenez, J.L. Hydrocarbon-like and oxygenated organic aerosols in Pittsburgh: Insights into sources and processes of organic aerosols. Atmos. Chem. Phys. 2005, 5, 3289–3311. [Google Scholar] [CrossRef] [Green Version]
  30. Collier, S.; Zhou, S.; Kuwayama, T.; Forestieri, S.; Brady, J.; Zhang, M.; Kleeman, M.; Cappa, C.; Bertram, T.; Zhang, Q. Organic PM Emissions from Vehicles: Composition; O/C Ratio; and Dependence on PM Concentration. Aerosol Sci. Technol. 2015, 49, 86–97. [Google Scholar] [CrossRef] [Green Version]
  31. Chou, C.C.K.; Lee, C.T.; Cheng, M.T.; Yuan, C.S.; Chen, S.J.; Wu, Y.L.; Hsu, W.C.; Lung, S.C.; Hsu, S.C.; Lin, C.Y.; et al. Seasonal variation and spatial distribution of carbonaceous aerosols in Taiwan. Atmos. Chem. Phys. 2010, 10, 9563–9578. [Google Scholar] [CrossRef] [Green Version]
  32. Carslaw, D.C.; Ropkins, K. Open air—An R package for air quality data analysis. Environ. Model. Softw. 2012, 27–28, 52–61. [Google Scholar] [CrossRef]
  33. Herndon, S.C.; Onasch, T.B.; Wood, E.C.; Kroll, J.H.; Canagaratna, M.R.; Jayne, J.T.; Zavala, M.A.; Knighton, W.B.; Mazzoleni, C.; Dubey, M.K.; et al. Correlation of secondary organic aerosol with odd oxygen in Mexico City. Geophys. Res. Lett. 2008, 35, L15804. [Google Scholar] [CrossRef] [Green Version]
  34. Chow, J.C.; Watson, J.G.; Lowenthal, D.H.; Egami, R.T.; Solomon, P.A.; Thuillier, R.H. Spatial and temporal variations of particulate precursor gases and photochemical reaction products during SJVAQS/AUSPEX ozone episodes. Atmos. Environ. 1998, 32, 2835–2844. [Google Scholar] [CrossRef]
  35. West, J.J.; Ansari, A.S.; Pandis, S.N. Marginal PM2.5 nonlinear aerosol mass response to sulfate reductions in the Eastern United States. J. Air Waste Manag. Assoc. 1999, 49, 1415–1424. [Google Scholar] [CrossRef] [Green Version]
  36. Kim, E.; Hopke, P.K.; Edgerton, E.S. Source identification of Atlanta aerosol by positive matrix factorization. J. Air Waste Manag. Assoc. 2003, 53, 731–739. [Google Scholar] [CrossRef] [Green Version]
  37. Park, S.S.; Ondov, J.M.; Harrison, D.; Nair, N.P. Seasonal and shorter-term variations in particulate atmospheric nitrate in Baltimore. Atmos. Environ. 2005, 39, 2011–2020. [Google Scholar] [CrossRef]
  38. Wang, D.; Zhou, B.; Fu, Q.; Zhao, Q.; Zhang, Q.; Chen, J.; Yang, X.; Duan, Y.; Li, J. Intense secondary aerosol formation due to strong atmospheric photochemical reactions in summer: Observations at a rural site in eastern Yangtze River Delta of China. Sci. Total Environ. 2016, 571, 1454–1466. [Google Scholar] [CrossRef]
  39. Khoder, M.I. Atmospheric conversion of sulfur dioxide to particulate sulfate and nitrogen dioxide to particulate nitrate and gaseous nitric acid in an urban area. Chemosphere 2002, 49, 675–684. [Google Scholar] [CrossRef]
  40. Harris, E.; Sinha, B.; van Pinxteren, D.; Tilgner, A.; Fomba, K.W.; Schneider, J.; Roth, A.; Gnauk, T.; Fahlbusch, B.; Mertes, S.; et al. Enhanced Role of Transition Metal Ion Catalysis during In-Cloud Oxidation of SO2. Science 2013, 340, 727–730. [Google Scholar] [CrossRef]
  41. Harris, E.; Sinha, B.; van Pinxteren, D.; Schneider, J.; Poulain, L.; Collett, J.; D’Anna, B.; Fahlbusch, B.; Foley, S.; Fomba, K.W.; et al. Incloud sulfate addition to single particles resolved with sulfur isotope analysis during HCCT-2010. Atmos. Chem. Phys. 2014, 14, 4219–4235. [Google Scholar] [CrossRef] [Green Version]
  42. Kurtén, T.; Lane, J.R.; Jørgensen, S.; Kjaergaard, H.G. A Computational Study of the Oxidation of SO2 to SO3 by Gas-Phase Organic Oxidants. J. Phys. Chem. A 2011, 115, 8669–8681. [Google Scholar] [CrossRef]
  43. Wang, Y.; Zhang, Q.Q.; He, K.; Zhang, Q.; Chai, L. Sulfate-nitrate-ammonium aerosols over China: Response to 2000–2015 emission changes of sulfur dioxide; nitrogen oxides; and ammonia. Atmos. Chem. Phys. 2013, 13, 2635–2652. [Google Scholar] [CrossRef] [Green Version]
  44. Wang, X.F.; Zhang, Y.P.; Chen, H.; Yang, X.; Chen, J.M.; Geng, F.H. Particulate Nitrate Formation in a Highly Polluted Urban Area: A Case Study by Single-Particle Mass Spectrometry in Shanghai. Environ. Sci. Technol. 2009, 43, 3061–3066. [Google Scholar] [CrossRef]
  45. Yang, F.; Chen, H.; Du, J.F.; Yang, X.; Gao, S.; Chen, J.M.; Geng, F.H. Evolution of the mixing state of fine aerosols during haze events in Shanghai. Atmos. Res. 2012, 104, 193–201. [Google Scholar] [CrossRef]
  46. Seinfeld, J.H.; Pandis, S.N. Atmospheric Chemistry and Physics; John Wiley & Sons; Inc.: New York, NY, USA, 1998. [Google Scholar]
  47. Li, L.; Chen, C.H.; Huang, C.; Huang, H.Y.; Zhang, G.F.; Wang, Y.J.; Wang, H.L.; Lou, S.R.; Qiao, L.P.; Zhou, M.; et al. Process analysis of regional ozone formation over the Yangtze River Delta; China using the Community Multi-scale Air Quality modeling system. Atmos. Chem. Phys. 2012, 12, 10971–10987. [Google Scholar] [CrossRef] [Green Version]
  48. Xue, J.; Yuan, Z.B.; Lau, A.K.H.; Yu, J.Z. Insights into factors affecting nitrate in PM2.5 in a polluted high NOx environment through hourly observations and size distribution measurements. J. Geophys. Res.-Atmos. 2014, 119, 4888–4902. [Google Scholar] [CrossRef]
  49. Hu, D.W.; Chen, J.M.; Ye, X.N.; Li, L.; Yang, X. Hygroscopicity and evaporation of ammonium chloride and ammonium nitrate: Relative humidity and size effects on the growth factor. Atmos. Environ. 2011, 45, 2349–2355. [Google Scholar] [CrossRef]
  50. Heintz, F.; Platt, U.; Flentje, H.; Dubois, R. Long-term observation of nitrate radicals at the Tor Station, Kap Arkona (Rügen). J. Geophys. Res.-Atmos. 1996, 101, 22891–22910. [Google Scholar] [CrossRef]
  51. Wang, S.S.; Shi, C.Z.; Zhou, B.; Zhao, H.; Wang, Z.R.; Yang, S.N.; Chen, L.M. Observation of NO3 radicals over Shanghai; China. Atmos. Environ. 2013, 70, 401–409. [Google Scholar] [CrossRef]
Figure 1. The mass concentrations of PM2.5 and O3 during summertime in Tianjin, China. (a) denotes PM2.5 mass concentration. (b) denotes O3 mass concentration.
Ijerph 19 07956 g001
Figure 2. Box plots of PM2.5 and O3 mass concentrations under different photochemical activity levels during summertime 2020 in Tianjin, China. Box represents 25–75th percentiles, whiskers represent the minimum and maximum values except outliers, and horizontal lines in the middle of the boxes represent the median values.
Ijerph 19 07956 g002
Figure 3. Diurnal variations in mean hourly concentrations of PM2.5 and O3 under different photochemical activities during the summertime 2020 in Tianjin, China.
Ijerph 19 07956 g003
Figure 4. Bivariate polar plot of PM2.5 mass concentration (µg/m3) as a function of wind speed and direction under the different photochemical activity levels. The center of each plot represents a wind speed of zero, which increases radially outward. The concentration of PM2.5 is shown by the color scale. NWR represents non-parametric wind regression statistical approach. (ad) denotes the different photochemical activity levels of L, M, LH and H.
Ijerph 19 07956 g004aIjerph 19 07956 g004b
Figure 5. Diurnal variations in ambient temperature and relative humidity under the different photochemical activity levels.
Ijerph 19 07956 g005
Figure 6. Diurnal variations in estimated primary PM2.5 mass concentrations and ratio of primary to observed PM2.5 mass concentrations at different photochemical activity levels in the summertime 2020 in Tianjin, China.
Ijerph 19 07956 g006
Figure 7. Diurnal variations in estimated secondary PM2.5 mass concentrations and ratio of secondary to observed PM2.5 mass concentrations at different photochemical activity levels in the summertime 2020 in Tianjin, China.
Ijerph 19 07956 g007
Figure 8. Diurnal variations in primary organic aerosol (POA) and secondary organic aerosol (SOA) at different photochemical activity levels in the summertime 2020 in Tianjin, China.
Ijerph 19 07956 g008
Figure 9. Diurnal patterns of PM2.5 and its chemical components concentrations under the different photochemical activity levels, in summertime 2020 in Tianjin, China. (ad) denotes the different photochemical activity levels of L, M, LH and H.
Ijerph 19 07956 g009aIjerph 19 07956 g009b
Figure 10. Scatter plots of 2[SO42−] + [NO3] vs. [NH4+] (μmol/m3) under the different photochemical activity levels in the summertime 2020 in Tianjin, China. (ad) denotes the different photochemical activity levels of L, M, LH and H.
Ijerph 19 07956 g010aIjerph 19 07956 g010b
Figure 11. Diurnal variation in SO42− and SO2 concentrations averaged under the photochemical activity levels M, LH, and H in the summertime 2020 in Tianjin, China.
Ijerph 19 07956 g011
Figure 12. Diurnal variation in NO3 and NO2 concentrations averaged under the photochemical activity levels M, LH and H, in summertime 2020 in Tianjin, China. Stage I, 0:00–5:00; Stage II, 5:00–9:00; Stage III, 9:00–18:00; Stage IV, 18:00–23:00.
Ijerph 19 07956 g012
Table 1. The chemical component concentrations in PM2.5 under the different photochemical activity levels (mean ± SD, μg/m3).
LevelsOCECCa²⁺K⁺NH₄⁺Na⁺Mg²⁺ClNO₃SO₄²Sum
L2.6 ± 0.80.7 ± 0.40.24 ± 0.340.49 ± 0.805.09 ± 3.650.51 ± 0.150.10 ± 0.070.44 ± 0.396.63 ± 5.264.93 ± 3.2921.4 ± 12.4
M3.7 ± 1.70.7 ± 0.50.32 ± 0.560.59 ± 0.485.26 ± 4.100.68 ± 0.390.13 ± 0.070.44 ± 0.476.81 ± 7.565.01 ± 3.3522.5 ± 15.9
LH4.0 ± 1.50.8 ± 0.50.47 ± 0.550.89 ± 0.536.42 ± 3.740.87 ± 0.390.18 ± 0.080.51 ± 0.497.68 ± 6.906.40 ± 3.5427.6 ± 14.6
H4.3 ± 1.60.9 ± 0.50.57 ± 0.570.77 ± 0.545.78 ± 3.610.76 ± 0.580.17 ± 0.080.55 ± 0.696.59 ± 6.296.36 ± 3.7426.4 ± 13.2
Publisher’s Note: MDPI stays neutral with regard to jurisdictional claims in published maps and institutional affiliations.

