
Utilization of Random Forest Classifier and Artificial Neural Network for Predicting Factors Influencing the Perceived Usability of COVID-19 Contact Tracing “MorChana” in Thailand

 ,
,  ,
,  and
and
Abstract
:1. Introduction
2. Related Studies and Theoretical Framework
2.1. Application Usability and Related Studies
2.2. Machine Learning Algorithm and Related Studies
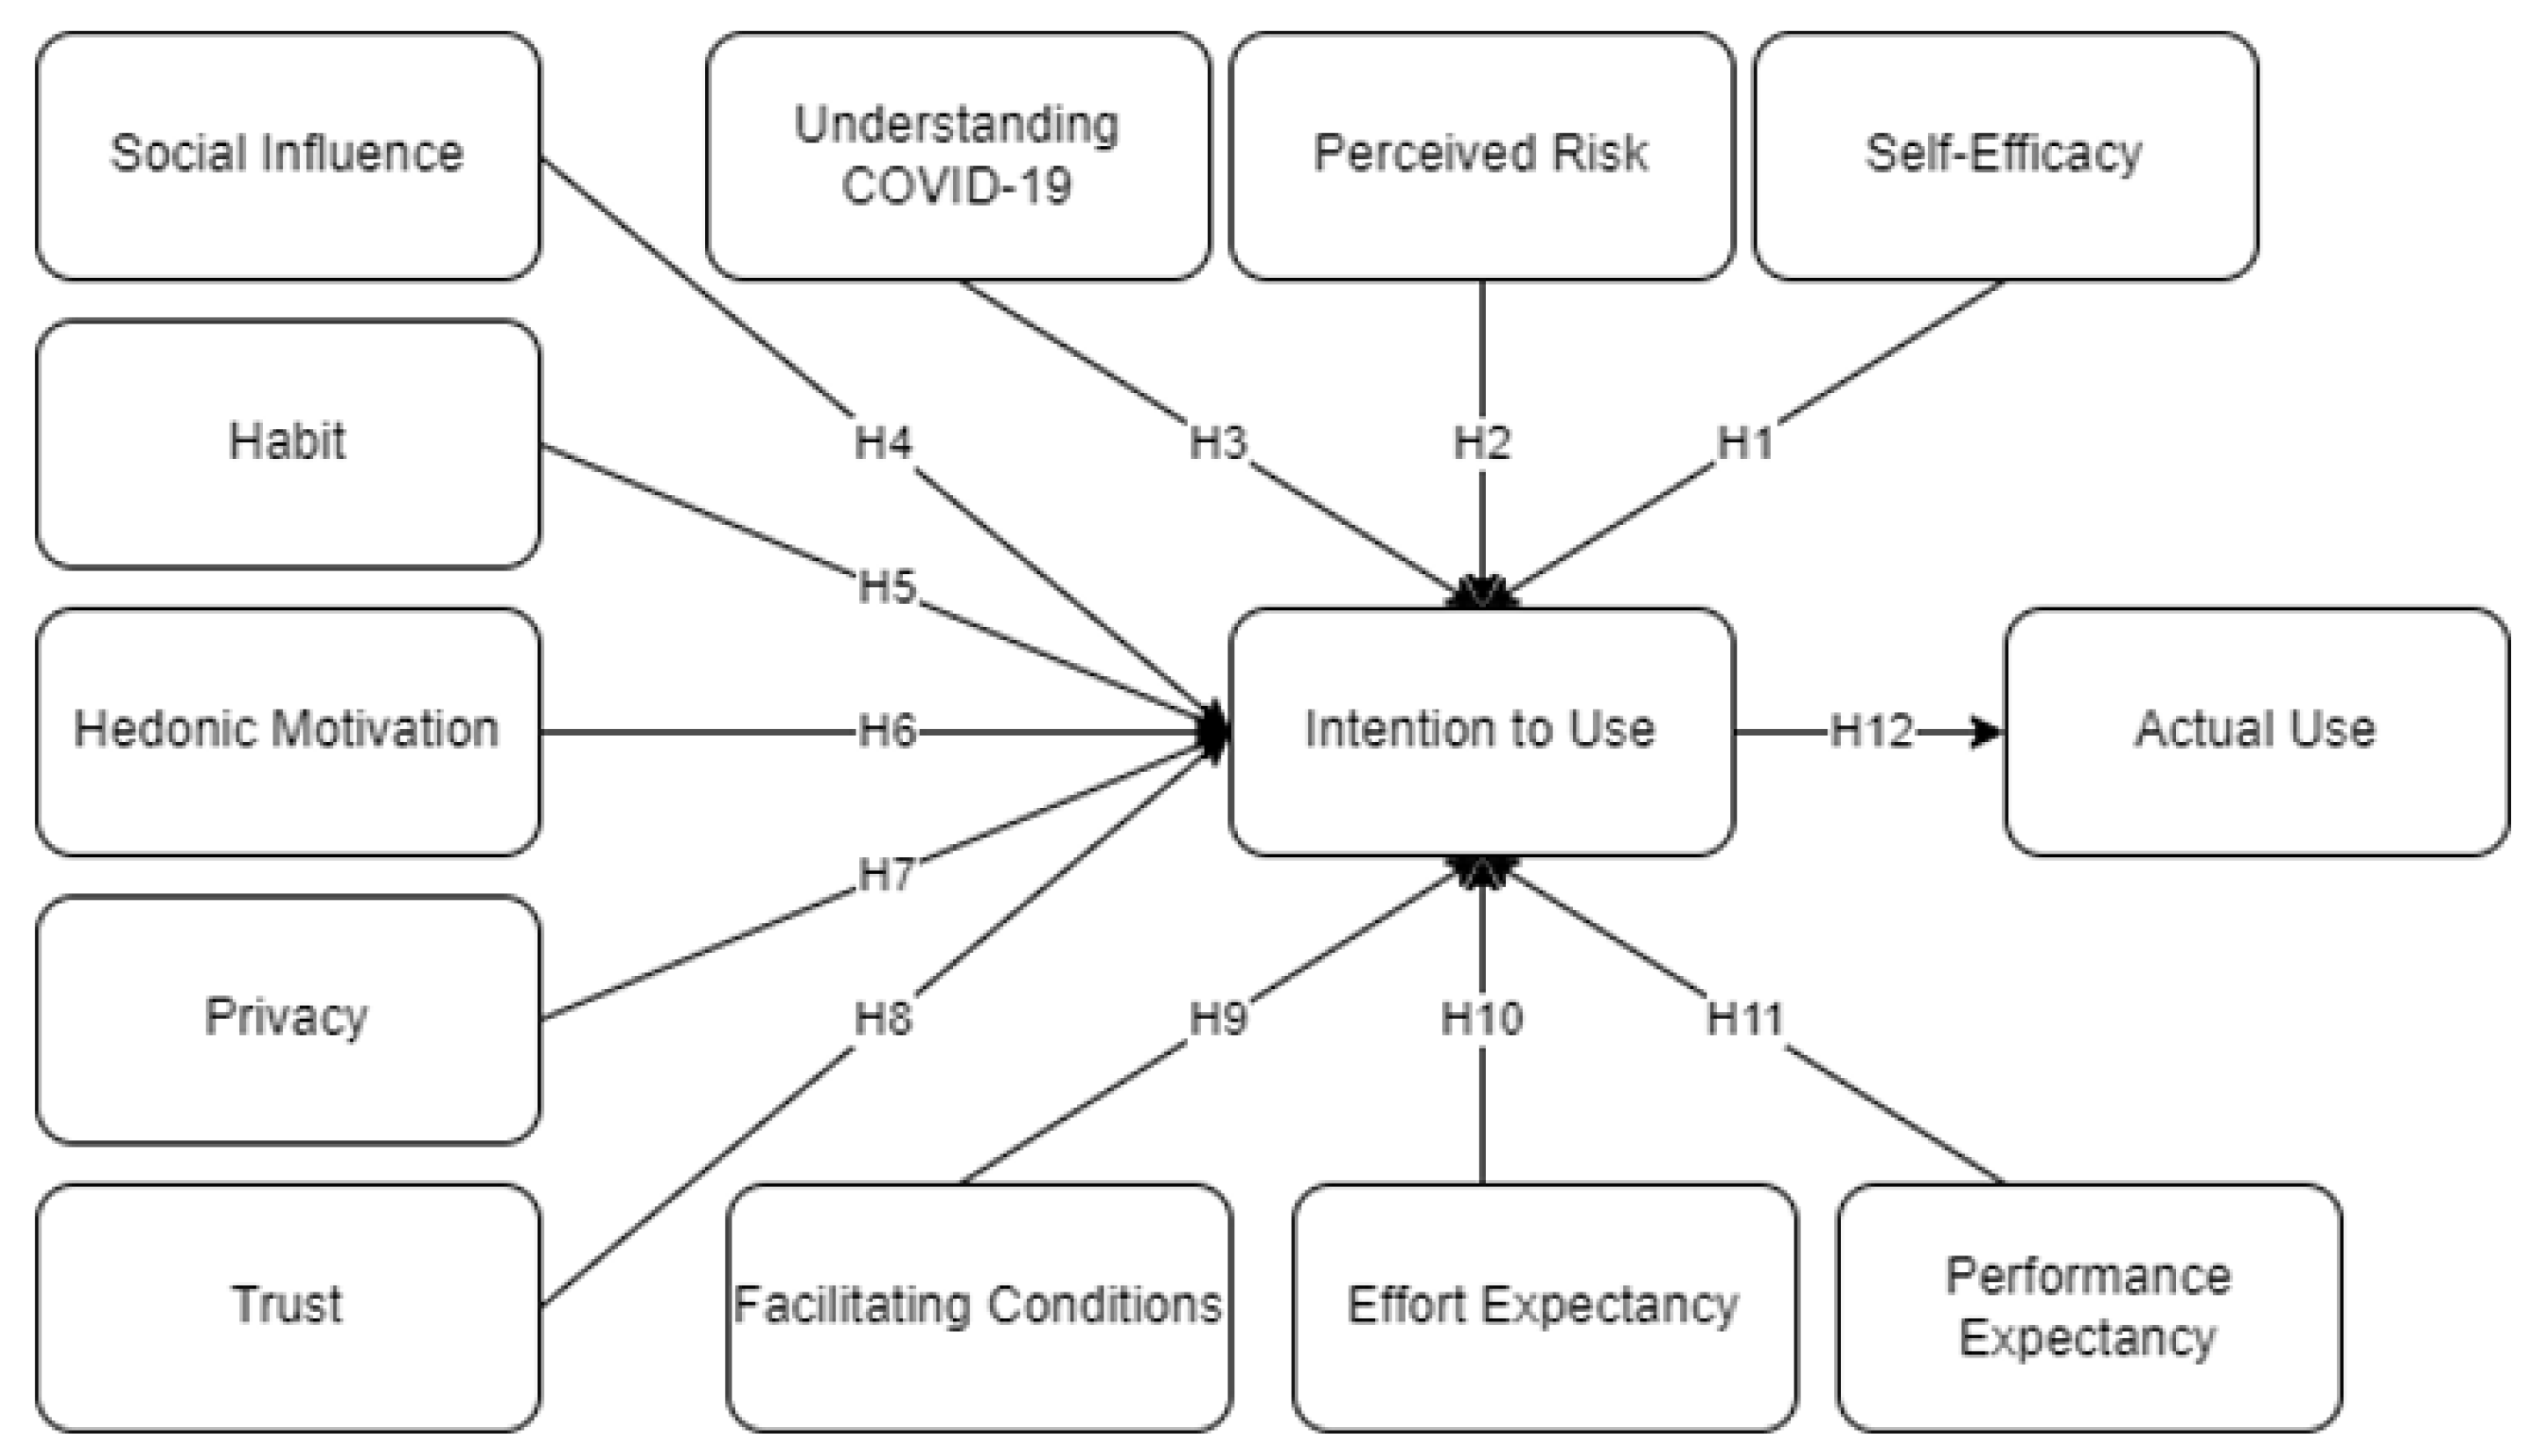
2.3. Theoretical Framework
3. Methodology
3.1. Questionnaire
3.2. Participants
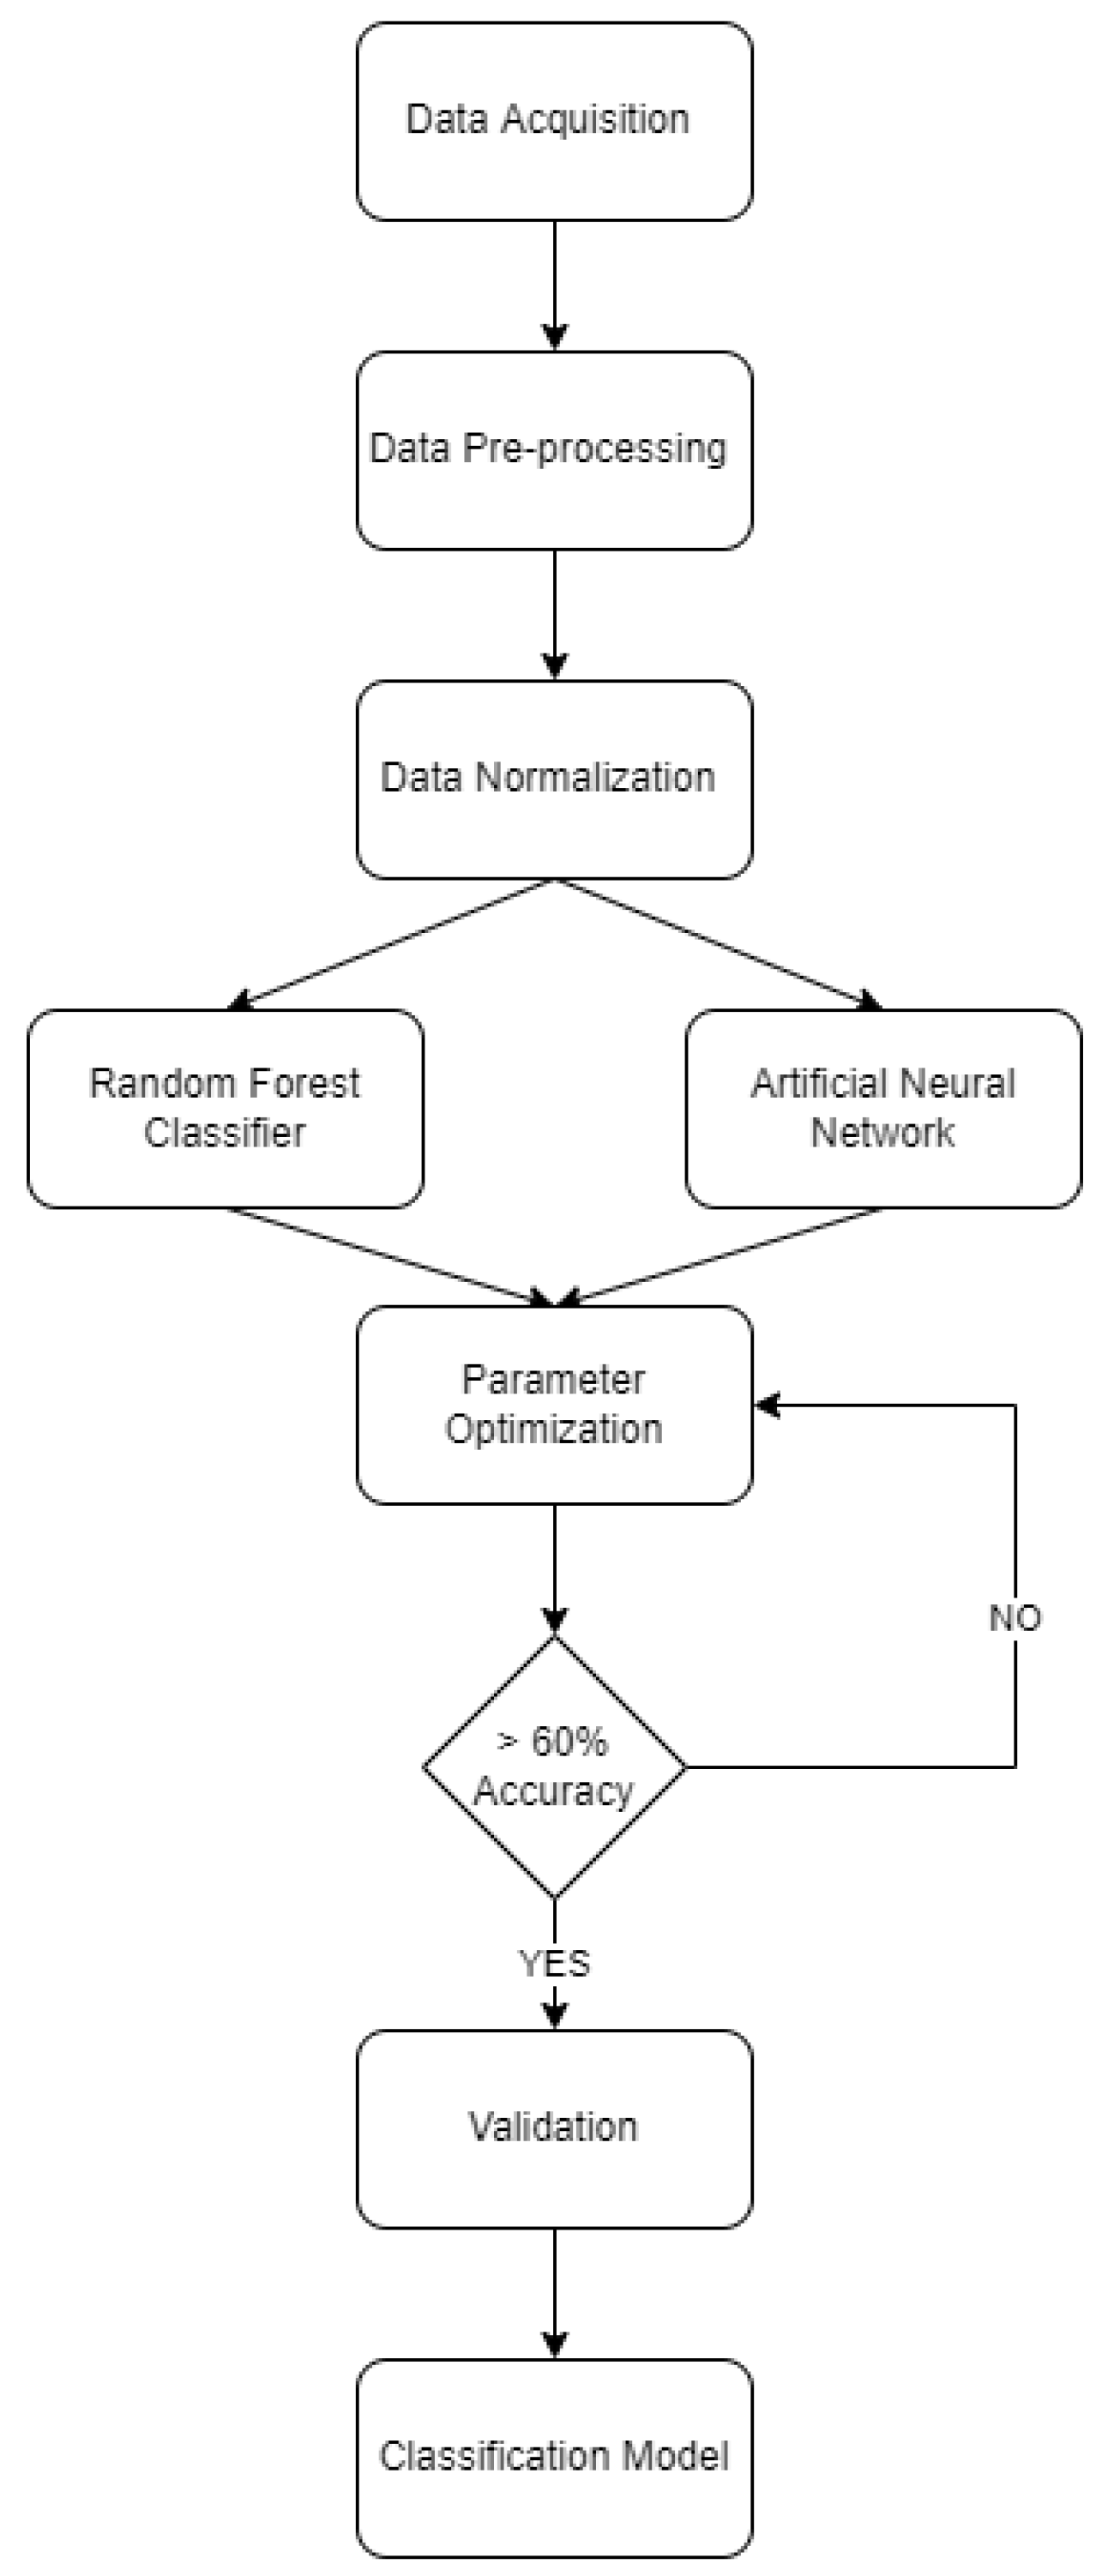
3.3. Machine Learning Algorithm
3.3.1. Random Forest Classifier
| Algorithm 1: Random Forest Classifier |
| Step 1. Loading of pre-processed dataset. |
| Step 2. Setting and Splitting the dataset among training and testing utilizing train_test_split from sklearn.model_selection. |
| Step 3. Setting the tree depth and random state at 0. |
| Step 4. Setting the criterion and splitter parameters with RandomForestClassifier from sklearn.ensemble. For Gini, Equation (1) was utilized while Entropy considered Equation (2). |
| = probability of the factor classified to a particular class from to . |
| For gini index: |
| #The algorithm works at 1 − (probability of the 1st class squared + 2nd class squared + … n) |
| For each split of branch: |
| Percent branch representing the used weight will be calculated |
| For each class: |
| Calculation of probability in the branch given |
| Probability will be squared |
| Take sum of squared probability of class |
| Subtract of summation from 1 to get gini index for each branch |
| Obtain weight of each branch from baseline probability |
| Taking sum of all weighted gini index for each split. |
| For entropy index: |
| #The algorithm works at [p 1st class * log(p(class1),2) + p 2nd class * log(p(class2),2) + … n]. |
| For each split of branch: |
| Percent branch representing the used weight will be calculated |
| For each class: |
| Calculation of probability in the branch given |
| Probability of class will be multiplied with log (probability, base = 2) |
| −1 will be multiplied with the result |
| Taking the sum of the resulting probabilities |
| Obtain weight of each branch from baseline probability |
| Taking sum of all weighted gini index for each split. |
| Step 5. Setting the splitter parameters (random or best) with RandomForestClassifier from sklearn.ensemble. |
| Step 6. Creating the confusion matrix using classification_report, confusion_matrix from sklearn.metrics. |
| Step 7. Printing the classification report and decision tree with random forest classifier using graphviz from sklearn.tree. Generation of training and testing accuracy result, precision, recall values, and run time will be obtained. |
3.3.2. Artificial Neural Network
| Algorithm 2: Artificial Neural Network |
| Step 1. Loading of preprocessed data. |
| Step 2. Feature selection was set for dependent and independent variables. |
| Step 3. Setting and Splitting the dataset among training and testing utilizing train_test_split from sklearn.model_selection with 0 random state. |
| Step 4. Utilizing keras sequential for the number of nodes and parameters for the input layer, hidden layer, and output layer. |
| #For Activation Function |
| #Hidden Layer swish equation |
| Swish (Y) = X * Simgoid (X) |
| Swish is considered a more efficient type of activation function following the popular ReLu since it is a continuous smooth function. This type of activation function follows negative weights with small values for its propagation process. Usually, swish is utilized for a successful nonmonotonic type of activation function. Its trainable parameter offers fine tuning for maximized output of propagation with a smooth gradient. This generates a faster, easier, and efficient generalizability of results [72]. |
| #Hidden Layer ReLu equation |
| Rectifier Linear (ReLu) = (f(x) = max (0, x)) |
| ReLu thresholds all negative values to zeroes and has consistent gains compared to other activation functions. It has been deduced that ReLu is established as an activation function that is consistent even with deep learning neural networks. Especially with nonlinear models, ReLu is an activation functions that can surpass the nonlinearity model and can calculate the relationship with high accuracy. In addition, ReLu has been seen to have low computation complexity when utilized and is versatile [73]. This was also considered and utilized in other studies [74,75,76]. |
| #Hidden Layer Tanh equation |
| Tanh is considered to be a shifted and stretched sigmoid function which performs better since it considers the negative values as compared to the automated zeroes from sigmoid. Gudivada and Rao [77] explained how neural networks consider activation functions such as Tanh to calculate nonlinear relationships provided that the hidden layer and nodes are optimized, suitable to the model considered. Tanh have greater gradients resulting to stronger calculation of updating the weights. With that, a faster optimized result will be obtained. A nonlinear relationship may be easily resolved and identified with Tanh [62]. Several studies [78,79] have utilized Tanh for its effectivity. |
| #Output Layer Sigmoid equation |
| The sigmoid activation function is used for its capabilities to calculate nonlinear and bounded values with a smaller range. Negativity is set and calculated as zeroes. For output layers, processing of data has been accomplished at the hidden layer, and thus are forwarded to the nodes as smaller values [42]. Sigmoid functions are usually utilized to its simple but efficient calculation. It is commonly used in the output layer since its results are interpreted as probabilities [80,81]. |
| #Output Layer Softmax equation |
| Softmax is similar to sigmoid but the denominator is summed. The advantage of using softmax is it takes into account all output compared to the individual one like sigmoid. |
| Step 5. Setting parameter for the optimizer [42,43]. Unlike sigmoid, the softmax results are all interrelated and by design, the result of softmax will be the probability with a sum equal to 1. The likelihood of one class will be decreased if one class needs to be increased. This is ideal for a nonlinear relationship and output layers since it uses a multi-classification calculation. In addition, softmax may also be considered for the activation function in the hidden layer, which shows its versatility [82]. |
| Step 6. Setting parameters for optimizer and number of epochs. |
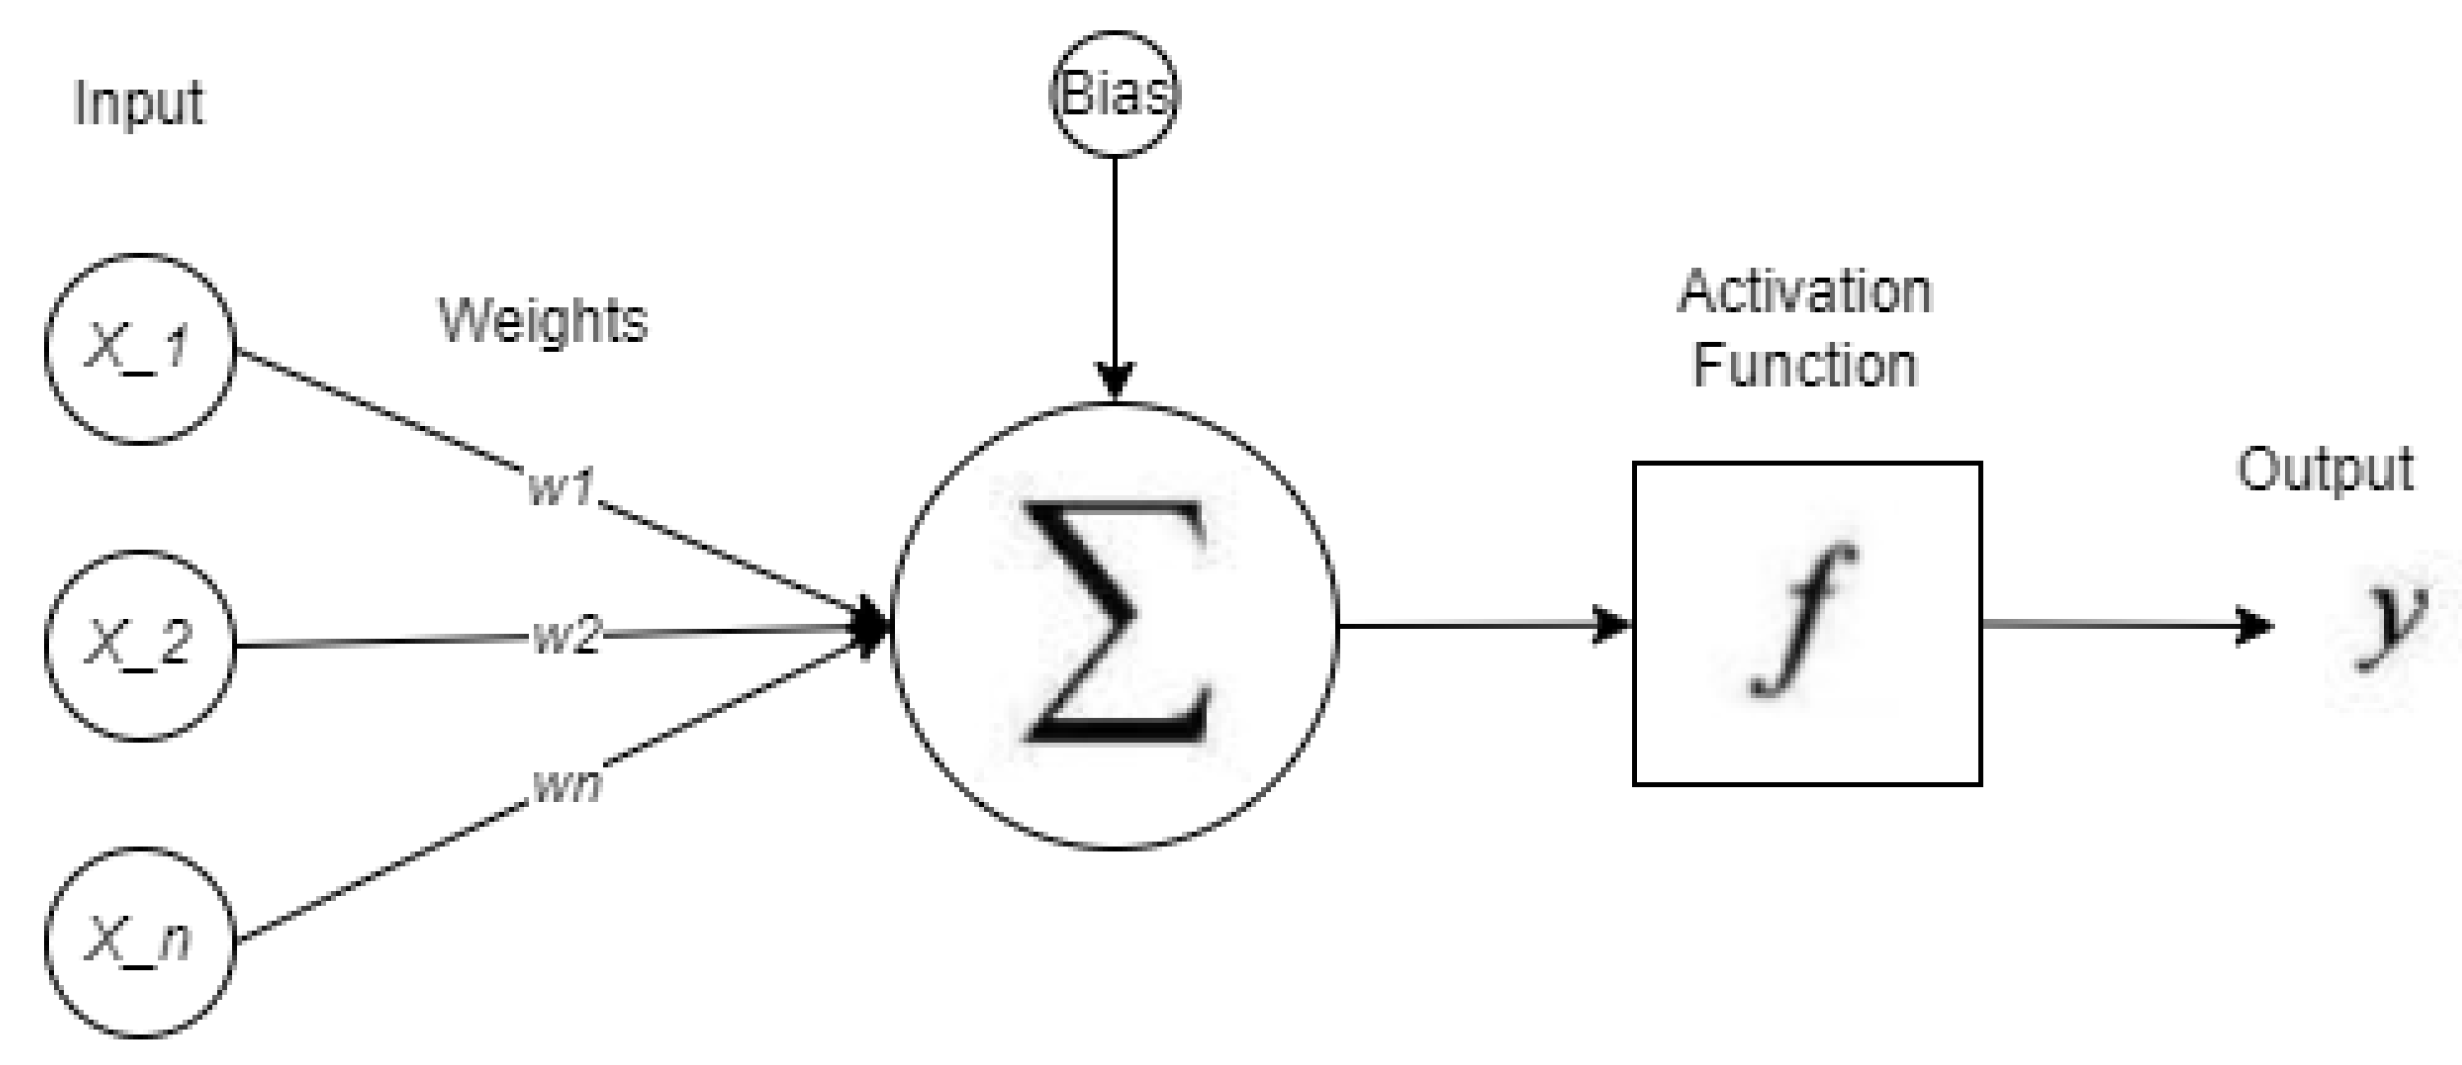
| Step 7. Feedforward process (learning rate, bias, weight (w)) considers the equation, |
| Where: |
| = input features |
| = weights |
| b = bias |
| Then the activation function (f(Y)) is applied for the output, . |
| The calculation pseudocode is as follows: |
| OutputB = 1st input*w [0] + 2nd input*w [1] + bias*w [2] |
| If OutputB > 0: #Activation Function considered |
| OutputB = 1 |
| Else |
| OutputB = 0 |
| Error = output–OutputB |
| W [0] += error * 1st input * learning rate |
| W [1] += error * 2nd input * learning rate |
| W [2] += error * bias * learning rate |
| OutputB = #calculation using the activation function |
| Step 8. Printing of validation test results. Generation of training and testing accuracy result, precision, recall values, loss rate, and run time will be obtained. |
4. Results
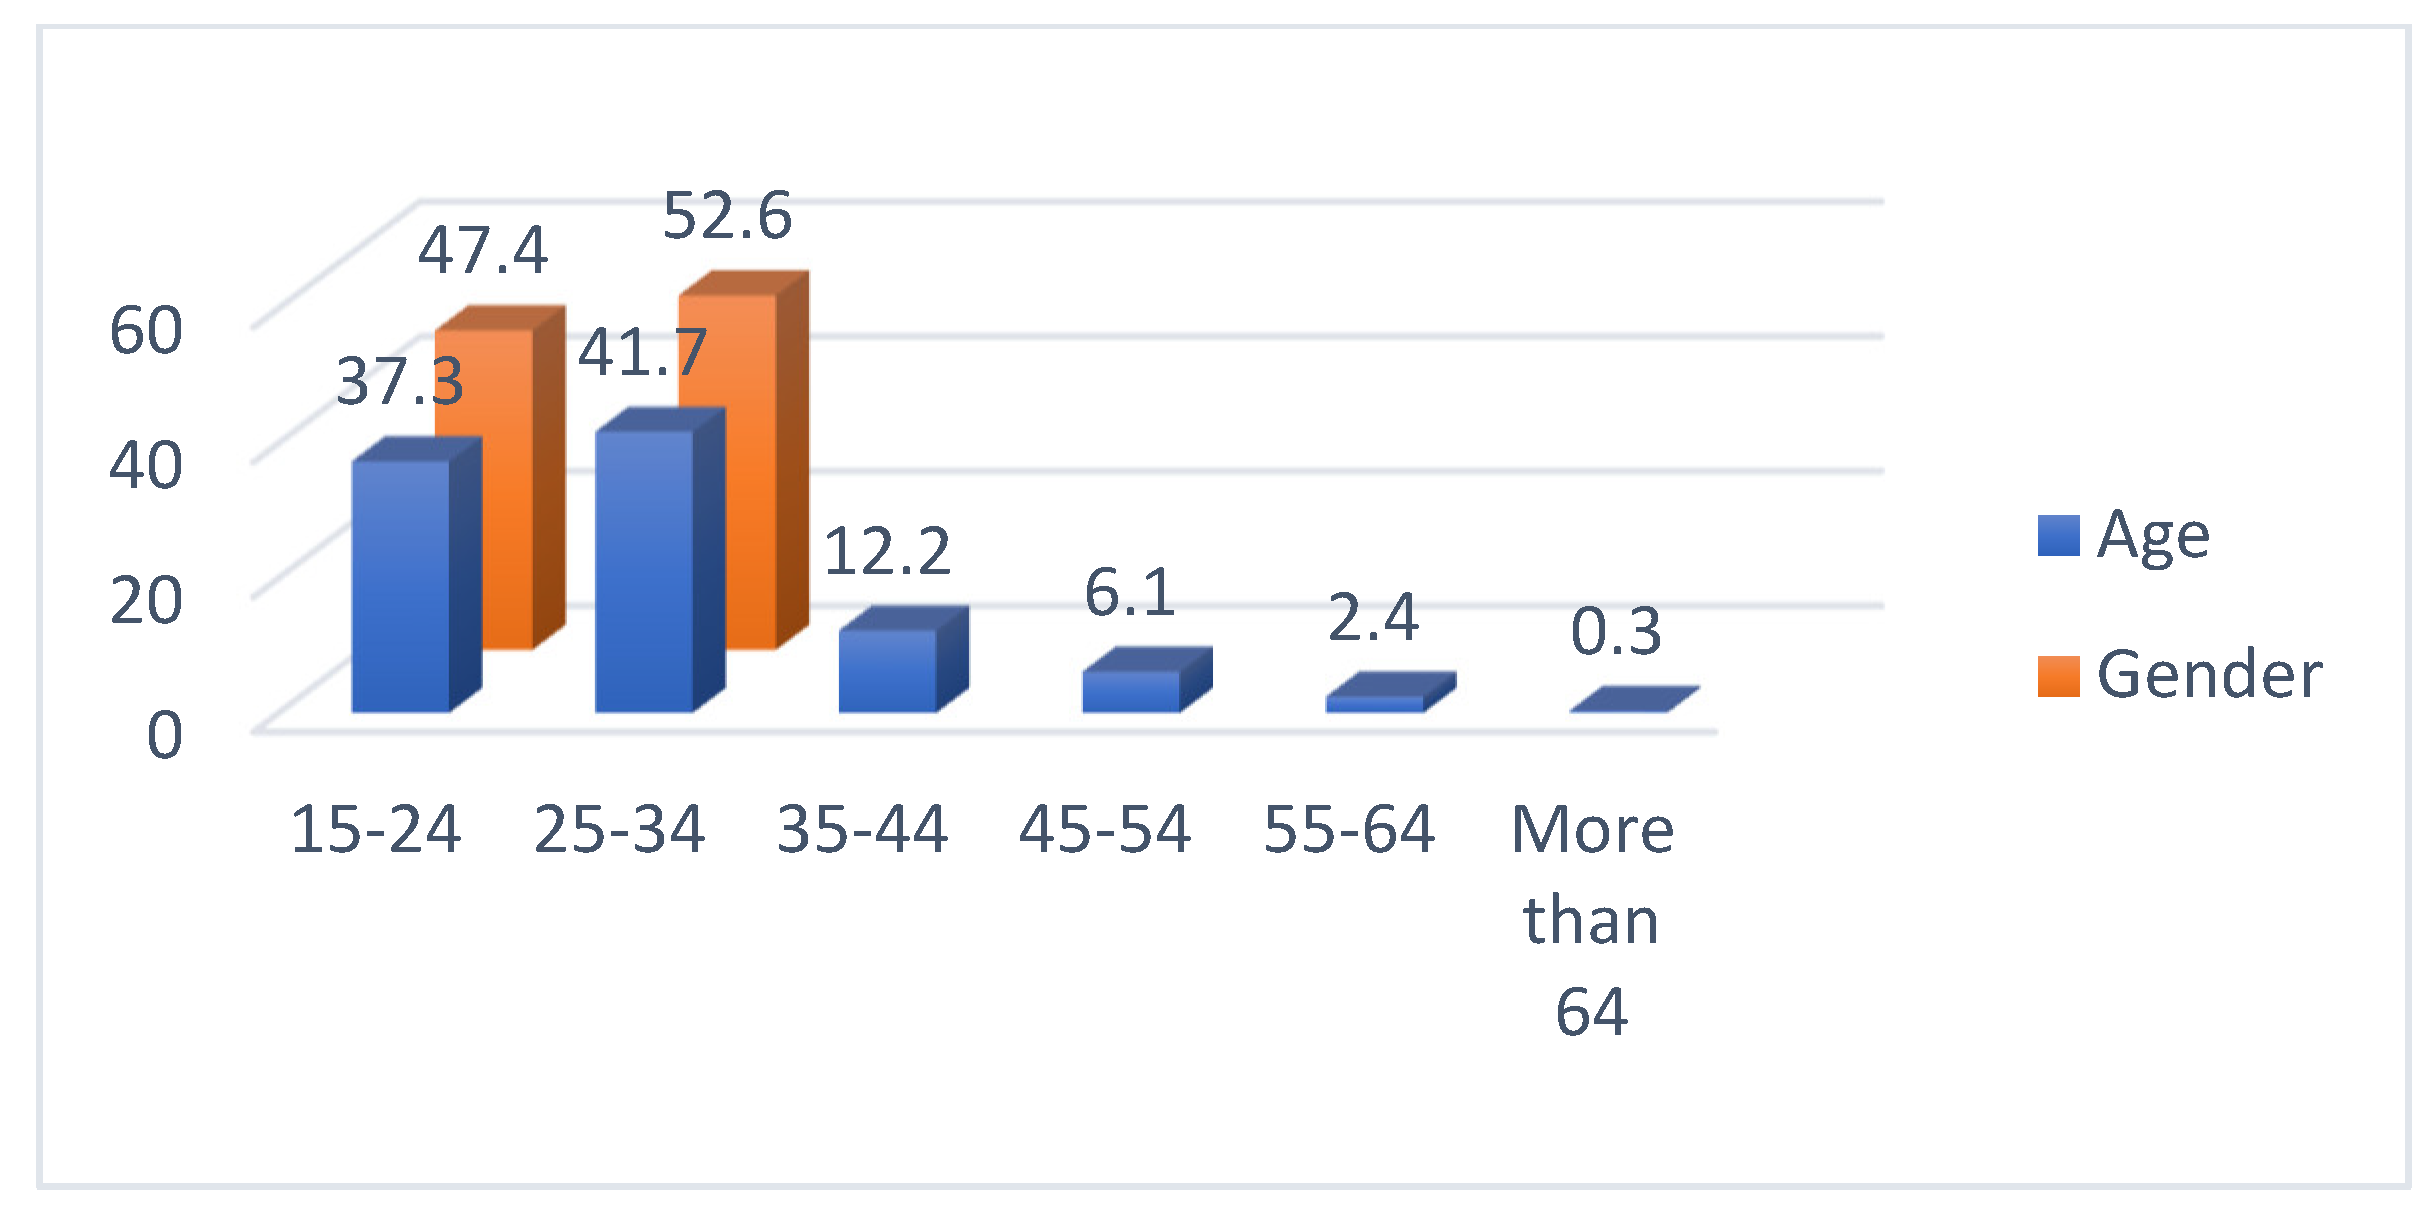
4.1. Participants
4.2. Machine Learning Algorithm
5. Discussion
5.1. General Findings for Usability
5.2. Usability and Willingness among Users
5.3. Practical and Theorertical Implications
5.4. Limitations
6. Conclusions
Author Contributions
Funding
Institutional Review Board Statement
Informed Consent Statement
Data Availability Statement
Acknowledgments
Conflicts of Interest
References
- Ong, A.K.; Prasetyo, Y.T.; Picazo, K.L.; Salvador, K.A.; Miraja, B.A.; Kurata, Y.B.; Chuenyindee, T.; Nadlifatin, R.; Redi, A.A.; Young, M.N. Gym-goers preference analysis of fitness centers during the COVID-19 pandemic: A conjoint analysis approach for business sustainability. Sustainability 2021, 13, 10481. [Google Scholar] [CrossRef]
- Issac, A.; Radhakrishnan, R.V.; Vijay, V.; Stephen, S.; Krishnan, N.; Jacob, J.; Jose, S.; Azhar, S.; Nair, A.S. An examination of Thailand’s health care system and strategies during the management of the COVID-19 pandemic. J. Glob. Health 2021, 11, 03002. [Google Scholar] [CrossRef] [PubMed]
- Thailand Launches Mor Chana Mobile App to Enhance Contact Tracing Efforts to Help Stop the Spread of COVID-19. Available online: https://www.cattelecom.com/cat/content/3754/222/Thailand+launches+Mor+Chana+mobile+app+to+enhance+?lang=en_EN (accessed on 11 April 2022).
- Viwattanakulvanid, P. Ten commonly asked questions about COVID-19 and lessons learned from Thailand. J. Health Res. 2021, 35, 329–344. [Google Scholar] [CrossRef]
- Reinecke, K.; Bernstein, A. Improving performance, perceived usability, and aesthetics with culturally adaptive user interfaces. ACM Trans. Comput.-Hum. Interact. (TOCHI) 2011, 18, 1–29. [Google Scholar] [CrossRef] [Green Version]
- Hidayat-ur-Rehman, I.; Ahmad, A.; Ahmed, M.; Alam, A. Mobile applications to fight against COVID-19 pandemic: The Case of Saudi Arabia. Tem J.-Technol. Educ. Manag. Inform. 2021, 10, 69–77. [Google Scholar] [CrossRef]
- Zhou, S.L.; Jia, X.; Skinner, S.P.; Yang, W.; Claude, I. Lessons on mobile apps for COVID-19 from China. J. Saf. Sci. Resil. 2021, 2, 40–49. [Google Scholar] [CrossRef]
- Chuenyindee, T.; Ong, A.K.; Prasetyo, Y.T.; Persada, S.F.; Nadlifatin, R.; Sittiwatethanasiri, T. Factors affecting the perceived usability of the COVID-19 contact-tracing application “Thai chana” during the early COVID-19 omicron period. Int. J. Environ. Res. Public Health 2022, 19, 4383. [Google Scholar] [CrossRef]
- Venkatesh, V.; Thong, J.Y.; Xu, X. Consumer acceptance and use of information technology: Extending the unified theory of acceptance and use of technology. MIS Q. 2012, 36, 157–178. [Google Scholar] [CrossRef] [Green Version]
- Yuduang, N.; Ong, A.K.; Prasetyo, Y.T.; Chuenyindee, T.; Kusonwattana, P.; Limpasart, W.; Sittiwatethanasiri, T.; Gumasing, M.J.; German, J.D.; Nadlifatin, R. Factors influencing the perceived effectiveness of COVID-19 risk assessment mobile application “Morchana” in Thailand: Utaut2 approach. Int. J. Environ. Res. Public Health 2022, 19, 5643. [Google Scholar] [CrossRef]
- Alam, M.Z.; Hu, W.; Kaium, M.A.; Hoque, M.R.; Alam, M.M.D. Understanding the determinants of mHealth apps adoption in Bangladesh: A SEM-Neural network approach. Technol. Soc. 2020, 61, 101255. [Google Scholar] [CrossRef]
- Badran, M.F. eHealth in Egypt: The demand-side perspective of implementing electronic health records. Telecommun. Policy 2019, 43, 576–594. [Google Scholar] [CrossRef]
- Mamra, A.; Sibghatullah, A.S.; Ananta, G.P.; Alazzam, M.B.; Ahmed, Y.H.; Doheir, M. A proposed framework to investigate the user acceptance of personal health records in Malaysia using UTAUT2 and PMT. Int. J. Adv. Comput. Sci. Appl. 2017, 8, 386–392. [Google Scholar] [CrossRef] [Green Version]
- Prasetyo, Y.T.; Castillo, A.M.; Salonga, L.J.; Sia, J.A.; Seneta, J.A. Factors affecting perceived effectiveness of COVID-19 prevention measures among Filipinos during enhanced community quarantine in Luzon, Philippines: Integrating Protection Motivation Theory and extended Theory of Planned Behavior. Int. J. Infect. Dis. 2020, 99, 312–323. [Google Scholar] [CrossRef]
- Ong, A.K.; Prasetyo, Y.T.; Salazar, J.M.; Erfe, J.J.; Abella, A.A.; Young, M.N.; Chuenyindee, T.; Nadlifatin, R.; Ngurah Perwira Redi, A.A. Investigating the acceptance of the reopening Bataan Nuclear Power Plant: Integrating Protection Motivation Theory and extended theory of planned behavior. Nucl. Eng. Technol. 2021, 54, 1115–1125. [Google Scholar] [CrossRef]
- van Bavel, R.; Rodríguez-Priego, N.; Vila, J.; Briggs, P. Using protection motivation theory in the design of nudges to improve online security behavior. Int. J. Hum.-Comput. Stud. 2019, 123, 29–39. [Google Scholar] [CrossRef]
- Mousavi, R.; Chen, R.; Kim, D.J.; Chen, K. Effectiveness of privacy assurance mechanisms in users’ privacy protection on social networking sites from the perspective of protection motivation theory. Decis. Support Syst. 2020, 135, 113323. [Google Scholar] [CrossRef]
- Yu, C.-W.; Chao, C.-M.; Chang, C.-F.; Chen, R.-J.; Chen, P.-C.; Liu, Y.-X. Exploring Behavioral Intention to Use a Mobile Health Education Website: An Extension of the UTAUT 2 Model. SAGE Open 2021, 11, 21582440211055721. [Google Scholar] [CrossRef]
- Fan, Y.; Chen, J.; Shirkey, G.; John, R.; Wu, S.R.; Park, H.; Shao, C. Applications of structural equation modeling (SEM) in ecological studies: An updated review. Ecol. Processes 2016, 5, 19. [Google Scholar] [CrossRef] [Green Version]
- Woody, E. An SEM perspective on evaluating mediation: What every clinical researcher needs to know. J. Exp. Psychopathol. 2011, 2, 210–251. [Google Scholar] [CrossRef]
- Chen, J.; Li, Q.; Wang, H.; Deng, M. A machine learning ensemble approach based on random forest and radial basis function neural network for risk evaluation of regional flood disaster: A case study of the Yangtze River Delta, China. Int. J. Environ. Res. Public Health 2020, 17, 49. [Google Scholar] [CrossRef] [Green Version]
- Milani, L.; Grumi, S.; Camisasca, E.; Miragoli, S.; Traficante, D.; Di Blasio, P. Familial risk and protective factors affecting CPS Professionals’ Child Removal Decision: A decision tree analysis study. Child. Youth Serv. Rev. 2020, 109, 104687. [Google Scholar] [CrossRef]
- Al-Mashraie, M.; Chung, S.H.; Jeon, H.W. Customer switching behavior analysis in the telecommunication industry via push-pull-mooring framework: A machine learning approach. Comput. Ind. Eng. 2020, 144, 106476. [Google Scholar] [CrossRef]
- Jamshidi, M.; Roshani, S.; Daneshfar, F.; Lalbakhsh, A.; Roshani, S.; Parandin, F.; Malek, Z.; Talla, J.; Peroutka, Z.; Jamshidi, A.; et al. Hybrid deep learning techniques for predicting complex phenomena: A review on COVID-19. AI 2022, 3, 416–433. [Google Scholar] [CrossRef]
- Altmann, S.; Milsom, L.; Zillessen, H.; Blasone, R.; Gerdon, F.; Bach, R.; Kreuter, F.; Nosenzo, D.; Toussaert, S.; Abeler, J. Acceptability of APP-based contact tracing for COVID-19: Cross-country survey study. JMIR Mhealth Uhealth 2020, 8, e19857. [Google Scholar] [CrossRef] [PubMed]
- Shahroz, M.; Ahmad, F.; Younis, M.S.; Ahmad, N.; Kamel Boulos, M.N.; Vinuesa, R.; Qadir, J. COVID-19 digital contact tracing applications and techniques: A review post initial deployments. Transp. Eng. 2021, 5, 100072. [Google Scholar] [CrossRef]
- Nazayer, M.; Madanian, S.; Mirza, F. Contact-Tracing Applications: A review of Technologies. BMJ Innov. 2021, 7, 368–378. [Google Scholar] [CrossRef]
- Zhang, M.; Chow, A.; Smith, H. COVID-19 contact-tracing apps: Analysis of the readability of privacy policies. J. Med. Internet Res. 2020, 22, e21572. [Google Scholar] [CrossRef]
- Seto, E.; Challa, P.; Ware, P. Adoption of COVID-19 contact tracing apps: A balance between privacy and effectiveness. J. Med. Internet Res. 2021, 23, e25726. [Google Scholar] [CrossRef]
- Vogt, F.; Haire, B.; Selvey, L.; Kaldor, J. Effectiveness of digital contact tracing for COVID-19 in New South Wales, Australia. Lancet Public Health 2021, 7, e250–e258. [Google Scholar] [CrossRef]
- Oyibo, K.; Sahu, K.S.; Oetomo, A.; Morita, P.P. Factors influencing the adoption of Contact Tracing Applications: Protocol for a systematic review. JMIR Res. Protoc. 2021, 10, e28961. [Google Scholar] [CrossRef]
- Owusu, P.N. Digital Technology applications for contact tracing: The new promise for COVID-19 and beyond? Glob. Health Res. Policy 2020, 5, 36. [Google Scholar] [CrossRef] [PubMed]
- Zetterholm, M.V.; Lin, Y.; Jokela, P. Digital contact tracing applications during COVID-19: A scoping review about public acceptance. Informatics 2021, 8, 48. [Google Scholar] [CrossRef]
- Gupta, R.; Pandey, G.; Chaudhary, P.; Pal, S.K. Technological and analytical review of contact tracing apps for COVID-19 management. J. Locat. Based Serv. 2021, 15, 198–237. [Google Scholar] [CrossRef]
- Kostka, G.; Habich-Sobiegalla, S. In times of crisis: Public perceptions toward COVID-19 contact tracing apps in China, Germany, and the United States. New Media Soc. 2022, 146144482210832. [Google Scholar] [CrossRef]
- Vogt, F.; Kurup, K.; Mussleman, P.; Habrun, C.; Crowe, M.; Woodward, A.; Jaramillo-Gutierrez, G.; Kaldor, J.; Vong, S.; Del Rio Vilas, V.J. Contact tracing indicators for COVID-19: Rapid scoping review and conceptual framework. PLoS ONE 2022, 17, e0264433. [Google Scholar] [CrossRef]
- Albastaki, Y. Assessing the perceived usability of an intelligent contact tracing app to prevent the spread of COVID-19 using Sus and Tam: Be aware bahrain. J. Decis. Syst. 2022, 1–18. [Google Scholar] [CrossRef]
- Storni, C.; Tsvyatkova, D.; Richardson, I.; Buckley, J.; Abbas, M.; Beecham, S.; Chochlov, M.; Fitzgerald, B.; Glynn, L.; Johnson, K.; et al. Toward a compare and contrast framework for COVID-19 contact tracing mobile applications: A look at usability. In Proceedings of the 14th International Joint Conference on Biomedical Engineering Systems and Technologies, Vienna, Austria, 11–13 February 2021. [Google Scholar]
- Winter, M.; Baumeister, H.; Frick, U.; Tallon, M.; Reichert, M.; Pryss, R. Exploring the usability of the German COVID-19 contact tracing app in a combined eye tracking and retrospective think Aloud Study. In Proceedings of the 2021 43rd Annual International Conference of the IEEE Engineering in Medicine & Biology Society (EMBC), Guadalajara, Mexico, 31 October–4 November 2021. [Google Scholar]
- Blacklow, S.O.; Lisker, S.; Ng, M.Y.; Sarkar, U.; Lyles, C. Usability, inclusivity, and content evaluation of COVID-19 contact tracing apps in the United States. J. Am. Med. Inform. Assoc. 2021, 28, 1982–1989. [Google Scholar] [CrossRef]
- Bente, B.E.; van’t Klooster, J.W.; Schreijer, M.A.; Berkemeier, L.; van Gend, J.E.; Slijkhuis, P.J.; Kelders, S.M.; van Gemert-Pijnen, J.E. The Dutch COVID-19 contact tracing app (the coronamelder): Usability study. JMIR Form. Res. 2021, 5, e27882. [Google Scholar] [CrossRef]
- Ong, A.K.; Chuenyindee, T.; Prasetyo, Y.T.; Nadlifatin, R.; Persada, S.F.; Gumasing, M.J.; German, J.D.; Robas, K.P.; Young, M.N.; Sittiwatethanasiri, T. Utilization of random forest and deep learning neural network for predicting factors affecting perceived usability of a COVID-19 contact tracing mobile application in Thailand “Thaichana”. Int. J. Environ. Res. Public Health 2022, 19, 6111. [Google Scholar] [CrossRef]
- Ong, A.K.; Prasetyo, Y.T.; Velasco, K.E.; Abad, E.D.; Buencille, A.L.; Estorninos, E.M.; Cahigas, M.M.; Chuenyindee, T.; Persada, S.F.; Nadlifatin, R.; et al. Utilization of random forest classifier and artificial neural network for predicting the acceptance of reopening decommissioned nuclear power plant. Ann. Nucl. Energy 2022, 175, 109188. [Google Scholar] [CrossRef]
- Jamshidi, M.; Lalbakhsh, A.; Talla, J.; Peroutka, Z.; Hadjilooei, F.; Lalbakhsh, P.; Jamshidi, M.; Spada, L.L.; Mirmozafari, M.; Dehghani, M.; et al. Artificial Intelligence and COVID-19: Deep learning approaches for diagnosis and treatment. IEEE Access 2020, 8, 109581–109595. [Google Scholar] [CrossRef] [PubMed]
- Daube, C.; Xu, T.; Zhan, J.; Webb, A.; Ince, R.A.A.; Garrod, O.G.B.; Schyns, P.G. Grounding deep neural network pre-dictions of human categorization behavior in understandable functional features: The case of Face Identity. Patterns 2021, 2, 100348. [Google Scholar] [CrossRef] [PubMed]
- Jamshidi, M.B.; Lalbakhsh, A.; Talla, J.; Peroutka, Z.; Roshani, S.; Matousek, V.; Roshani, S.; Mirmozafari, M.; Malek, Z.; La Spada, L.; et al. Deep learning techniques and COVID-19 drug discovery: Fundamentals, state-of-the-art and Future Directions. Stud. Syst. Decis. Control. 2021, 348, 9–31. [Google Scholar]
- Yariyan, P.; Zabihi, H.; Wolf, I.D.; Karami, M.; Amiriyan, S. Earthquake risk assessment using an integrated Fuzzy Analytic Hierarchy Process with Artificial Neural Networks based on GIS: A case study of Sanandaj in Iran. Int. J. Disaster Risk Reduct. 2020, 50, 101705. [Google Scholar] [CrossRef]
- Oktarina, R.; Bahagia, S.N.; Diawati, L.; Pribadi, K.S. Artificial neural network for predicting earthquake casualties and damages in Indonesia. IOP Conf. Series Earth Environ. Sci. 2020, 426, 012156. [Google Scholar] [CrossRef]
- Aggarwal, C.C. Neural Networks and Deep Learning: A Textbook; Springer: New York, NY, USA, 2019. [Google Scholar]
- Kheirollahpour, M.M.; Danaee, M.M.; Merican, A.F.; Shariff, A.A. Prediction of the influential factors on eating behaviors: A hybrid model of structural equation modelling-artificial neural networks. Sci. World J. 2020, 2020, 4194293. [Google Scholar] [CrossRef]
- Featherman, M.S.; Pavlou, P.A. Predicting e-services adoption: A perceived risk facets perspective. Int. J. Hum.-Comput. Stud. 2003, 59, 451–474. [Google Scholar] [CrossRef] [Green Version]
- Thakur, R. The role of self-efficacy and customer satisfaction in driving loyalty to the mobile shopping application. Int. J. Retail. Distrib. Manag. 2018, 46, 283–303. [Google Scholar] [CrossRef]
- Kim, H.; Suh, E.E. The effects of an interactive nursing skills mobile application on nursing students’ knowledge, self-efficacy, and skills performance: A randomized controlled trial. Asian Nurs. Res. 2018, 12, 17–25. [Google Scholar] [CrossRef] [Green Version]
- Ezzaouia, I.; Bulchand-Gidumal, J. A Model to Predict Users’ Intentions to Adopt Contact-Tracing Apps for Prevention from COVID-19. In Information and Communication Technologies in Tourism 2021; Springer: Cham, Switzerland, 2021; pp. 543–548. [Google Scholar]
- Nikolopoulou, K.; Gialamas, V.; Lavidas, K. Habit, hedonic motivation, performance expectancy and technological pedagogical knowledge affect teachers’ intention to use mobile internet. Comput. Educ. Open 2021, 2, 100041. [Google Scholar] [CrossRef]
- Chen, W.; Chan, T.W.; Wong, L.H.; Looi, C.K.; Liao, C.C.; Cheng, H.N.; Wong, S.L.; Mason, J.; So, H.-J.; Murthy, S. IDC theory: Habit and the habit loop. Res. Pract. Technol. Enhanc. Learn. 2020, 15, 1–19. [Google Scholar] [CrossRef]
- Amoroso, D.; Lim, R.; Roman, F.L. Developing and Testing a Smartphone Dependency Scale Assessing Addiction Risk. Int. J. Risk Conting. Manag. 2021, 10, 14–38. [Google Scholar] [CrossRef]
- Cao, Q.; Niu, X. Integrating context-awareness and UTAUT to explain Alipay user adoption. Int. J. Ind. Ergon. 2019, 69, 9–13. [Google Scholar] [CrossRef]
- Martins, C.; Oliveira, T.; Popovič, A. Understanding the Internet banking adoption: A unified theory of acceptance and use of technology and perceived risk application. Int. J. Inf. Manag. 2014, 34, 1–13. [Google Scholar] [CrossRef]
- Mingxing, S.; Jing, F.; Yafang, L. An empirical study on consumer acceptance of mobile payment based on the perceived risk and trust. In Proceedings of the 2014 International Conference on Cyber-Enabled Distributed Computing and Knowledge Discovery, Shanghai, China, 13–15 October 2014; pp. 312–317. [Google Scholar]
- Lallmahomed, M.Z.; Lallmahomed, N.; Lallmahomed, G.M. Factors influencing the adoption of e-Government services in Mauritius. Telemat. Inform. 2017, 34, 57–72. [Google Scholar] [CrossRef]
- Walrave, M.; Waeterloos, C.; Ponnet, K. Ready or not for contact tracing? Investigating the adoption intention of COVID-19 contact-tracing technology using an extended unified theory of acceptance and use of technology model. Cyberpsychol. Behav. Soc. Netw. 2021, 24, 377–383. [Google Scholar] [CrossRef]
- Wu, J.; Du, H. Toward a better understanding of behavioral intention and system usage constructs. Eur. J. Inf. Syst. 2012, 21, 680–698. [Google Scholar] [CrossRef]
- Dehghani, M. Exploring the motivational factors on continuous usage intention of smartwatches among actual users. Behav. Inf. Technol. 2018, 37, 145–158. [Google Scholar] [CrossRef]
- Huang, C.-Y.; Yang, M.-C. Empirical investigation of factors influencing consumer intention to use an artificial intelligence-powered mobile application for weight loss and health management. Telemed. e-Health 2020, 26, 1240–1251. [Google Scholar] [CrossRef]
- Hair, J.F.; Black, W.C.; Babin, B.J.; Anderson, R.E. Multivariate Data Analysis; Pearson: New York, NY, USA, 2010. [Google Scholar]
- Podsakoff, P.M.; MacKenzie, S.B.; Lee, J.-Y.; Podsakoff, N.P. Common method biases in behavioral research: A critical review of the literature and recommended remedies. J. Appl. Psychol. 2003, 88, 879–903. [Google Scholar] [CrossRef]
- Akoglu, H. User’s Guide to Correlation Coefficients. Turk. J. Emerg. Med. 2018, 18, 91–93. [Google Scholar] [CrossRef] [PubMed]
- Yang, W.; Zhou, S. Using decision tree analysis to identify the determinants of residents’ CO2 emissions from different types of trips: A case study of guangzhou, China. J. Clean. Prod. 2020, 277, 124071. [Google Scholar] [CrossRef]
- Pradhan, B.; Lee, S. Landslide susceptibility assessment and factor effect analysis: Backpropagation artificial neural networks and their comparison with frequency ratio and bivariate logistic regression modelling. Environ. Model. Softw. 2010, 25, 747–759. [Google Scholar] [CrossRef]
- Walczak, S.; Cerpa, N. Artificial Neural Networks. In Encyclopedia of Physical Science and Technology; Elsevier: Amsterdam, The Netherlands, 2003. [Google Scholar] [CrossRef]
- Wang, X.; Ren, H.; Wang, A. Smish: A novel activation function for deep learning methods. Electronics 2022, 11, 540. [Google Scholar] [CrossRef]
- Lin, G.; Shen, W. Research on convolutional neural network based on improved relu piecewise activation function. Procedia Comput. Sci. 2018, 131, 977–984. [Google Scholar] [CrossRef]
- Kalinić, Z.; Marinković, V.; Kalinić, L.; Liébana-Cabanillas, F. Neural network modeling of consumer satisfaction in Mobile Commerce: An empirical analysis. Expert Syst. Appl. 2021, 175, 114803. [Google Scholar] [CrossRef]
- Sharma, S.; Sharma, A.; Athaiya, A. Activation Functions in Neural Network. Int. J. Eng. Appl. Sci. Technol. 2020, 4, 310–316. [Google Scholar] [CrossRef]
- Elfwing, S.; Uchibe, E.; Doya, K. Sigmoid-weighted linear units for neural network function approximation in reinforcement learning. Neural Netw. 2018, 107, 3–11. [Google Scholar] [CrossRef]
- Gudivada, V.N.; Rao, C.R. Computational analysis and understanding of natural languages: Principles, methods and applications. In Handbook of Statistics; Elsevier: Amsterdam, The Netherlands, 2018. [Google Scholar]
- Jang, H.-S.; Xing, S. A model to predict ammonia emission using a modified genetic artificial neural network: Analyzing Cement mixed with fly ash from a coal-fired power plant. Constr. Build. Mater. 2020, 230, 117025. [Google Scholar] [CrossRef]
- Yousefzadeh, M.; Hosseini, S.A.; Farnaghi, M. Spatiotemporally explicit earthquake prediction using Deep Neural Network. Soil Dyn. Earthq. Eng. 2021, 144, 106663. [Google Scholar] [CrossRef]
- Costarelli, D.; Spigler, R. Multivariate neural network operators with sigmoidal activation functions. Neural Netw. 2013, 48, 72–77. [Google Scholar] [CrossRef] [PubMed]
- Liébana-Cabanillas, F.; Marinković, V.; Kalinić, Z. A sem-neural network approach for predicting antecedents of M-Commerce Acceptance. Int. J. Inf. Manag. 2017, 37, 14–24. [Google Scholar] [CrossRef]
- Maida, A.S. Cognitive computing and neural networks. In Handbook of Statistics; IEEE: Piscataway, NJ, USA, 2016; pp. 39–78. [Google Scholar]
- Abiodun, O.I.; Jantan, A.; Omolara, A.E.; Dada, K.V.; Mohamed, N.A.; Arshad, H. State-of-the-art in artificial neural network applications: A survey. Heliyon 2018, 4, e00938. [Google Scholar] [CrossRef] [PubMed] [Green Version]
- Wu, P.; Zhang, R.; Zhu, X.; Liu, M. Factors Influencing Continued Usage Behavior on Mobile Health Applications. Healthcare 2022, 10, 208. [Google Scholar] [CrossRef]
- Palau-Saumell, R.; Forgas-Coll, S.; Sánchez-García, J.; Robres, E. User acceptance of mobile apps for restaurants: An expanded and extended UTAUT-2. Sustainability 2019, 11, 1210. [Google Scholar] [CrossRef] [Green Version]
- Shemesh, T.; Barnoy, S. Assessment of the intention to use mobile health applications using a technology acceptance model in an Israeli adult population. Telemed. e-Health 2020, 26, 1141–1149. [Google Scholar] [CrossRef]
- Tuman, M.; Moyer, A. Health intentions and behaviors of health app owners: A cross-sectional study. Psychol. Health Med. 2019, 24, 819–826. [Google Scholar] [CrossRef]
- Wang, C.; Tee, M.; Roy, A.E.; Fardin, M.A.; Srichokchatchawan, W.; Habib, H.A.; Tran, B.X.; Hussain, S.; Hoang, M.T.; Le, X.T. The impact of COVID-19 pandemic on physical and mental health of Asians: A study of seven middle-income countries in Asia. PLoS ONE 2021, 16, e0246824. [Google Scholar] [CrossRef]
- Caldwell, J.; de Lara-Tuprio, E.; Teng, T.R.; Estuar, R.J.; Sarmiento, R.F.R.; Abayawardana, M.; Leong, R.N.F.; Gray, R.T.; Wood, J.; McBryde, E.S. Understanding COVID-19 dynamics and the effects of interventions in the Philippines: A mathematical modelling study. Lancet Reg. Health 2021, 14, 100211. [Google Scholar] [CrossRef]
- Chao, C.-M. Factors determining the behavioral intention to use mobile learning: An application and extension of the UTAUT model. Front. Psychol. 2019, 10, 1652. [Google Scholar] [CrossRef] [Green Version]
- Tomczyk, S.; Barth, S.; Schmidt, S.; Muehlan, H. Utilizing health behavior change and technology acceptance models to predict the adoption of COVID-19 contact tracing apps: Cross-sectional Survey Study. J. Med. Internet Res. 2021, 23, e25447. [Google Scholar] [CrossRef] [PubMed]
- German, J.D.; Redi, A.A.; Prasetyo, Y.T.; Persada, S.F.; Ong, A.K.; Young, M.N.; Nadlifatin, R. Choosing a package carrier during COVID-19 pandemic: An integration of pro-environmental planned behavior (PEPB) theory and Service Quality (SERVQUAL). J. Clean. Prod. 2022, 346, 131123. [Google Scholar] [CrossRef] [PubMed]
- Kurata, Y.B.; Prasetyo, Y.T.; Ong, A.K.; Nadlifatin, R.; Chuenyindee, T. Factors affecting perceived effectiveness of typhoon vamco (Ulysses) flood disaster response among Filipinos in Luzon, Philippines: An integration of protection motivation theory and extended theory of planned behavior. Int. J. Disaster Risk Reduct. 2022, 67, 102670. [Google Scholar] [CrossRef]
- Gumasing, M.J.; Prasetyo, Y.T.; Ong, A.K.; Nadlifatin, R. Determination of factors affecting the response efficacy of Filipinos under Typhoon Conson 2021 (jolina): An extended protection motivation theory approach. Int. J. Disaster Risk Reduct. 2022, 70, 102759. [Google Scholar] [CrossRef]
- Garrett, P.M.; Wang, Y.-W.; White, J.P.; Kashima, Y.; Dennis, S.; Yang, C.-T. High acceptance of COVID-19 Tracing Technologies in Taiwan: A nationally representative survey analysis. Int. J. Environ. Res. Public Health 2022, 19, 3323. [Google Scholar] [CrossRef]
- Abella, A.A.; Prasetyo, Y.T.; Young, M.N.; Nadlifatin, R.; Persada, S.F.; Perwira Redi, A.A.; Chuenyindee, T. The effect of positive reinforcement of behavioral-based safety on safety participation in Philippine coal-fired power plant workers: A partial least square structural equation modeling (PLS-SEM) approach. Int. J. Occup. Saf. Ergon. 2022, 1–27. [Google Scholar] [CrossRef] [PubMed]

| Author | COVID-19 Contact Tracing/Country | Method | Purpose | Findings |
|---|---|---|---|---|
| Altman et al. [25] | France, Germany, Italy, United Kingdom, and United States | Multivariate regression analysis | Investigated the user acceptability of a contact-tracing app in five countries hit by the pandemic. | -strong support for the app under both regimes, in all countries, across all subgroups of the population, and irrespective of regional-level COVID-19 mortality rates -concerns about cybersecurity and privacy, together with a lack of trust in the government, are the main barriers to adoption |
| Shahroz et al. [26] | General COVID-19 contact tracing. | Comprehensive review analysis | To conduct a comprehensive analysis of digital contact tracing and its supporting IoT framework. | -Different countries and applications have made different trade-offs and have therefore experienced different amounts of success in effectively combating COVID-19. - It was noted that while digital contact tracing apps have their strengths, it is not a panacea. Merging techniques with mobile contact tracing should be considered since others do not attempt to highly utilize it. |
| Nazayer et al. [27] | General COVID-19 contact tracing. | Comprehensive review analysis | Examine design decisions related to COVID-19 contact-tracing applications and the implications of these decisions. | -Based on the used technology and the software architecture, different contact-tracing applications offer different possible trade-offs that should be taken into account based on government’s objectives on contact tracing. |
| Zhang et al. [28] | COVIDSafe (Australia); BeAware (Bahrain); CoronApp (Chile); GH COVID-19 Tracker (Ghana); Rakning C-19 (Iceland); NZ COVID Tracer (New Zealand); TraceTogether (Singapore) | Readability analysis | Examined the readability of privacy policies of contact-tracings apps | -Explanation used in the privacy policies of these apps require considerably higher than the reading ability of the average individual. |
| Seto et al. [29] | General COVID-19 contact tracing. | Comprehensive review analysis | Analyzed how characteristics of contract tracing and exposure notification apps contribute to the perceived levels of privacy awarded to citizens and how this affects an app’s effectiveness | -Striking the right balance between privacy and effectiveness requires careful consideration, especially as the urgency to reduce transmission of the virus evolves based on fluctuating case numbers and vaccination efforts. -contact tracing and exposure notification app will depend on factors including whether it is voluntary, the underlying technology, and degree of data centralization, translation of those important safeguards into a user’s perception of privacy will occur within the context of the norms and values of their country. |
| Vogt et al. [30] | COVIDSafe (New South Wales, Australia) | Prospective study | To assess the effectiveness of the app to detect close contacts and prevent public exposure events, and its usefulness during the contact identification and risk assessment process | -COVIDSafe generated a substantial additional perceived workload for public health staff and was not considered useful. - COVIDSafe was not sufficiently effective to make a meaningful contribution to the COVID-19 response in Australia’s most populous state over a 6-month period. |
| Oyibo et al. [31] | General COVID-19 contact tracing. | Comprehensive review analysis | To uncover the key factors that facilitate or militate against the adoption of CTAs, which researchers, designers and other stakeholders should focus on in future iterations to increase their adoption and effectiveness | -Priority to privacy protection through minimal data collection and transparency, improving contact tracing benefits (personal and social), and fostering trust through laudable gestures such as delegating contact tracing to public health authorities, making source code publicly available and stating who will access user data, when, how, and what it will be used for. -the results suggest that data security and tailored persuasive design, involving reward, self-monitoring, and social-location monitoring features, have the potential of improving CTA adoption. -future designs of CTAs to improve their motivational appeal, adoption, and the user experience should be considered. |
| Owusu [32] | General COVID-19 contact tracing. | Comprehensive review analysis | To review and recommend evaluation of COVID-19 contact tracing applications. | -as with any new system, strong regulatory frameworks are necessary to ensure that individual information is not used for surveillance purposes, and user privacy will be maintained. Having safeguarded this, perhaps the global health community will witness the beginning of a new era of implementing mass health programs through the medium of digital technology. |
| Zetterholm et al. [33] | General COVID-19 contact tracing. | Comprehensive review analysis | To describe the current knowledge about public acceptance of CTAs and identify individual perspectives, which are essential to consider concerning CTA acceptance and adoption | -Public acceptance varies across national cultures and sociodemographic strata. Lower acceptance among people who are mistrusting, socially disadvantaged, or those with low technical skills suggest a risk that CTAs may amplify existing inequities. -Regarding determinants of acceptance, eight themes emerged, covering both attitudes and behavioral perspectives that can influence acceptance, including trust, privacy concerns, social responsibility, perceived health threat, experience of and access to technologies, performance expectancy and perceived benefits, and understanding. |
| Gupta et al. [34] | General COVID-19 contact tracing. | Structured research review-based framework | -To review various components of the framework that are related to technological working, design architecture, and feature analysis of the applications, along with the analysis of the acceptance of such applications worldwide. -Components focusing on the security features and analysis of these applications based on Data Privacy, Security Vetting, and different attacks have been included in the research framework. | This study acted as a guide for the users researching contact tracings applications using the proposed four-layered framework for their app assessment. |
| Kostka and Habich-Sobiegalla [35] | China, Germany, and the United States. | Linear Regression | Analyze public perceptions toward CTAs and the factors that drive CTA acceptance in China, Germany, and the United States. | -Citizens are willing to accept digital contact tracing despite concerns about privacy infringement and government surveillance, as long as the apps are perceived as effective in lowering infection rates and providing health information. -A high citizen adoption rate is necessary for CTAs to be effective, but CTAs are only effective if adoption rates are high. |
| Vogt et al. [36] | General COVID-19 contact tracing. | Systematic Review | To present a protocol for a systematic review of the main factors, including facilitators and barriers, that influence the adoption of contact tracing apps. | Focus on the principal adoption factors necessary to create better and more effective contact tracing apps. |
| Albastaki [37] | Bahrain | Structural Equation Modeling | Considered human task performance measures, technology acceptance model, and system usability scale to evaluate perceived usability. | Usability in general rather than factors affecting behavior for utility was the most significant factor. |
| Storni et al. [38] | General COVID-19 contact tracing. | Systematic Review | Evaluated frameworks used to assess the usability of contact tracing applications. | Highlighted that usability pillars such as satisfaction, availability, accessibility, flexibility, effectiveness, interaction, and ongoing application evaluations were factors that needed to be considered. |
| Winter et al. [39] | Germany | Eye-tracking and a retrospective think-aloud approach | Evaluated eye tracking and think aloud approach for perceived usability. | They have only concluded that the application is promising and privacy policy has the most significant factor affecting its usability. |
| Blacklow et al. [40] | United States. | Thematic Analysis | To evaluate the usability using thematic analysis. | Lacked a lot of analysis to be generalized among other contact tracing mobile applications. |
| Chuenyindee et al. [8] | ThaiChana (Thailand) | Structural Equation Modeling | To determine factors affecting the perceived usability of Thai Chana by integrating protection motivation theory, the extended technology acceptance model, and the system usability scale. | -understanding of COVID-19 has significant effects on perceived severity and perceived vulnerability, which subsequently leads to perceived usefulness. In addition, perceived usefulness and perceived ease of use have significant direct effects on attitude, which subsequently leads to the intention to use, actual use, and perceived usability. |
| Yuduang et al. [10] | MorChana (Thailand) | Structural Equation Modeling | To evaluate the factors affecting the actual usage of the MorChana mobile application. | Intention was seen to be the most significant indicator. Further evaluation was recommended due to limitations set by the method utilized. |
| Bente et al. [41] | CoronaMedler application (Netherlands) | Think-aloud usability test and eye-tracking. | To assess usability of the COVID-19 contact tracing application in Netherlands. | -Easy to use, but several demographics found it difficult to interpret, had low trust in privacy, and has been evaluated as underprepared. -Presented ungeneralizable results. |
| This study | ThaiChana (Thailand) | Machine Learning Ensemble | To evaluate factors affecting perceived usability of the COVID-19 contact tracing application. | Comapred to the results obtained from Yuduang et al. [10], this study highlighted how other factors that were affected from the mediating effect from structural equation modeling was highly significant. In addition, a comparison to other studies, usability of contact tracing, and application has been discussed. |
| Construct | Cronbach’s Alpha | VIF |
|---|---|---|
| HB | 0.904 | 4.576 |
| HM | 0.889 | 4.312 |
| PR | 0.951 | 3.628 |
| FC | 0.856 | 3.111 |
| U | 0.851 | 1.341 |
| PE | 0.753 | 2.166 |
| SEF | 0.875 | 2.160 |
| IU | 0.802 | 3.084 |
| TR | 0.855 | 2.605 |
| EE | 0.885 | 2.071 |
| PCR | 0.705 | 1.161 |
| SI | 0.946 | 3.323 |
| Category | 60:40 | 70:30 | 80:20 | 90:10 |
|---|---|---|---|---|
| Random | ||||
| Gini | 84.00 | 80.00 | 83.20 | 83.60 |
| Std. Dev | 4.301 | 4.743 | 4.438 | 6.542 |
| Precision | 81.40 | 77.00 | 82.80 | 83.20 |
| Recall | 75.40 | 73.20 | 80.00 | 72.80 |
| Entropy | 85.00 | 80.60 | 86.00 | 84.80 |
| Std. Dev | 1.732 | 2.510 | 1.225 | 7.430 |
| Precision | 84.80 | 81.00 | 85.80 | 79.80 |
| Recall | 83.40 | 74.20 | 81.80 | 63.80 |
| Best | ||||
| Gini | 88.80 | 83.80 | 93.00 | 91.00 |
| Std. Dev | 0.447 | 1.095 | 0.000 | 0.000 |
| Precision | 86.80 | 82.80 | 92.80 | 91.40 |
| Recall | 84.60 | 81.40 | 90.60 | 89.80 |
| Entropy | 83.20 | 84.60 | 89.40 | 92.00 |
| Std. Dev | 1.095 | 0.894 | 0.547 | 0.000 |
| Precision | 83.00 | 82.80 | 89.80 | 90.00 |
| Recall | 83.00 | 83.80 | 89.60 | 91.00 |
| Latent | HB | HM | PCR | FC | U | PE | SEF | IU | TR | EE | PR | SI |
|---|---|---|---|---|---|---|---|---|---|---|---|---|
| HM | 0.866 | |||||||||||
| PCR | 0.344 | 0.329 | ||||||||||
| FC | 0.787 | 0.777 | 0.305 | |||||||||
| U | 0.479 | 0.487 | 0.193 | 0.417 | ||||||||
| PE | 0.694 | 0.681 | 0.309 | 0.625 | 0.381 | |||||||
| SEF | 0.693 | 0.678 | 0.247 | 0.612 | 0.399 | 0.567 | ||||||
| IU | 0.787 | 0.764 | 0.306 | 0.701 | 0.418 | 0.620 | 0.592 | |||||
| TR | 0.745 | 0.740 | 0.269 | 0.657 | 0.385 | 0.607 | 0.594 | 0.678 | ||||
| EE | 0.692 | 0.657 | 0.274 | 0.607 | 0.393 | 0.534 | 0.579 | 0.602 | 0.616 | |||
| PR | 0.812 | 0.789 | 0.337 | 0.719 | 0.446 | 0.639 | 0.642 | 0.726 | 0.691 | 0.616 | ||
| SI | 0.800 | 0.777 | 0.310 | 0.708 | 0.426 | 0.639 | 0.625 | 0.715 | 0.664 | 0.617 | 0.749 | |
| AU | 0.847 | 0.831 | 0.602 | 0.760 | 0.761 | 0.702 | 0.675 | 0.568 | 0.363 | 0.432 | 0.460 | 0.333 |
Publisher’s Note: MDPI stays neutral with regard to jurisdictional claims in published maps and institutional affiliations. |
© 2022 by the authors. Licensee MDPI, Basel, Switzerland. This article is an open access article distributed under the terms and conditions of the Creative Commons Attribution (CC BY) license (https://creativecommons.org/licenses/by/4.0/).
Share and Cite
Ong, A.K.S.; Prasetyo, Y.T.; Yuduang, N.; Nadlifatin, R.; Persada, S.F.; Robas, K.P.E.; Chuenyindee, T.; Buaphiban, T. Utilization of Random Forest Classifier and Artificial Neural Network for Predicting Factors Influencing the Perceived Usability of COVID-19 Contact Tracing “MorChana” in Thailand. Int. J. Environ. Res. Public Health 2022, 19, 7979. https://doi.org/10.3390/ijerph19137979
Ong AKS, Prasetyo YT, Yuduang N, Nadlifatin R, Persada SF, Robas KPE, Chuenyindee T, Buaphiban T. Utilization of Random Forest Classifier and Artificial Neural Network for Predicting Factors Influencing the Perceived Usability of COVID-19 Contact Tracing “MorChana” in Thailand. International Journal of Environmental Research and Public Health. 2022; 19(13):7979. https://doi.org/10.3390/ijerph19137979
Chicago/Turabian StyleOng, Ardvin Kester S., Yogi Tri Prasetyo, Nattakit Yuduang, Reny Nadlifatin, Satria Fadil Persada, Kirstien Paola E. Robas, Thanatorn Chuenyindee, and Thapanat Buaphiban. 2022. "Utilization of Random Forest Classifier and Artificial Neural Network for Predicting Factors Influencing the Perceived Usability of COVID-19 Contact Tracing “MorChana” in Thailand" International Journal of Environmental Research and Public Health 19, no. 13: 7979. https://doi.org/10.3390/ijerph19137979
APA StyleOng, A. K. S., Prasetyo, Y. T., Yuduang, N., Nadlifatin, R., Persada, S. F., Robas, K. P. E., Chuenyindee, T., & Buaphiban, T. (2022). Utilization of Random Forest Classifier and Artificial Neural Network for Predicting Factors Influencing the Perceived Usability of COVID-19 Contact Tracing “MorChana” in Thailand. International Journal of Environmental Research and Public Health, 19(13), 7979. https://doi.org/10.3390/ijerph19137979