
Tap Water Consumption Is Associated with Schoolchildren’s Cognitive Deficits in Afghanistan

 , and
, and
Abstract
:1. Introduction
2. Material and Method
2.1. Children’s Cohort
2.2. Cognitive Abilities
2.3. Main Predictors
2.4. Statistical Analysis
3. Results
3.1. Descriptive Analysis
3.2. Statistical Analysis
4. Discussion
5. Conclusions
Supplementary Materials
Author Contributions
Funding
Institutional Review Board Statement
Informed Consent Statement
Data Availability Statement
Acknowledgments
Conflicts of Interest
References
- Engle, P.; Grantham-McGregor, S.; Black, M.M.; Walker, S.; Wachs, T. How to Avoid the Loss of Potential in over 200 Million Young Children in the Developing World. Child Health Educ. 2009, 1, 68–87. [Google Scholar]
- Garkal, K.D.; Shete, A.N. Influence of Nutrition and Socio-Economic Status on Intellectual Development in School Children. Natl. J. Physiol. Pharm. Pharmacol. 2015, 5, 145–148. [Google Scholar] [CrossRef] [Green Version]
- Poh, B.K.; Lee, S.T.; Yeo, G.S.; Tang, K.C.; Afifah, A.R.N.; Hanisa, A.S.; Parikh, P.; Wong, J.E.; Ng, A.L.O.; Norimah, A.K.; et al. Low Socioeconomic Status and Severe Obesity Are Linked to Poor Cognitive Performance in Malaysian Children. BMC Public Health 2019, 19 (Suppl. S4), 541. [Google Scholar] [CrossRef] [Green Version]
- Walker, S.P.; Wachs, T.D.; Meeks Gardner, J.; Lozoff, B.; Wasserman, G.A.; Pollitt, E.; Carter, J.A. Child Development: Risk Factors for Adverse Outcomes in Developing Countries. Lancet 2007, 369, 145–157. [Google Scholar] [CrossRef]
- Bayat, A.; Louw, W.; Rena, R. The Impact of Socio-Economic Factors on the Performance of Selected High School Learners in the Western Cape Province, South Africa. J. Hum. Ecol. 2014, 45, 183–196. [Google Scholar] [CrossRef]
- Bellinger, D.; Dietrich, K.N. Low-Level Lead Exposure and Cognitive Function in Children. Pediatric Ann. 1994, 23, 600–605. [Google Scholar] [CrossRef] [PubMed]
- Ghazi, H.F.; Isa, Z.M.; Aljunid, S.; Shah, S.A.; Tamil, A.M.; Abdalqader, M.A. The Negative Impact of Living Environment on Intelligence Quotient of Primary School Children in Baghdad City, Iraq: A Cross-Sectional Study. BMC Public Health 2012, 12, 562. [Google Scholar] [CrossRef] [Green Version]
- Goldstein, G.W. Neurologic Concepts of Lead Poisoning in Children. Pediatric Ann. 1992, 21, 384–388. [Google Scholar] [CrossRef]
- Joshi, P.T.; O’Donnell, D.A. Consequences of Child Exposure to War and Terrorism. Clin. Child Fam. Psychol. Rev. 2003, 6, 275–292. [Google Scholar] [CrossRef]
- Korenman, S.; Miller, J.E.; Sjaastad, J.E. Long-Term Poverty and Child Development in the United States: Results from the NLSY. Child. Youth Serv. Rev. 1995, 17, 127–155. [Google Scholar] [CrossRef]
- Muñoz-Quezada, M.T.; Lucero, B.A.; Barr, D.B.; Steenland, K.; Levy, K.; Ryan, P.B.; Iglesias, V.; Alvarado, S.; Concha, C.; Rojas, E.; et al. Neurodevelopmental Effects in Children Associated with Exposure to Organophosphate Pesticides: A Systematic Review. Neurotoxicology 2013, 39, 158–168. [Google Scholar] [CrossRef] [PubMed] [Green Version]
- Nell, V.; Myers, J.; Colvin, M.; Rees, D. Neuropsychological Assessment of Organic Solvent Effects in South Africa: Test Selection, Adaptation, Scoring, and Validation Issues. In Neurobehavioral Methods and Effects in Occupational and Environmental Health; Academic Press: Cambridge, MA, USA, 1994; pp. 163–180. [Google Scholar] [CrossRef]
- Panter-Brick, C.; Eggerman, M.; Gonzalez, V.; Safdar, S. Violence, Suffering, and Mental Health in Afghanistan: A School-Based Survey. Lancet 2009, 374, 807–816. [Google Scholar] [CrossRef] [Green Version]
- Rodríguez-Barranco, M.; Lacasaña, M.; Aguilar-Garduño, C.; Alguacil, J.; Gil, F.; González-Alzaga, B.; Rojas-García, A. Association of Arsenic, Cadmium and Manganese Exposure with Neurodevelopment and Behavioural Disorders in Children: A Systematic Review and Meta-Analysis. Sci. Total Environ. 2013, 454–455, 562–577. [Google Scholar] [CrossRef] [PubMed]
- Roels, H.A.; Bowler, R.M.; Kim, Y.; Henn, B.C.; Mergler, D.; Hoet, P.; Gocheva, V.V.; Bellinger, D.C.; Wright, R.O.; Harris, M.G.; et al. Manganese Exposure and Cognitive Deficits: A Growing Concern for Manganese Neurotoxicity. Neurotoxicology 2012, 33, 872–880. [Google Scholar] [CrossRef] [PubMed] [Green Version]
- Rowe, C.; Gunier, R.; Bradman, A.; Harley, K.G.; Kogut, K.; Parra, K.; Eskenazi, B. Residential Proximity to Organophosphate and Carbamate Pesticide Use during Pregnancy, Poverty during Childhood, and Cognitive Functioning in 10-Year-Old Children. Environ. Res. 2016, 150, 128–137. [Google Scholar] [CrossRef] [Green Version]
- Karri, V.; Schuhmacher, M.; Kumar, V. Heavy Metals (Pb, Cd, As and MeHg) as Risk Factors for Cognitive Dysfunction: A General Review of Metal Mixture Mechanism in Brain. Environ. Toxicol. Pharmacol. 2016, 48, 203–213. [Google Scholar] [CrossRef] [Green Version]
- Yáñez, L.; Ortiz, D.; Calderón, J.; Batres, L.; Carrizales, L.; Mejía, J.; Martínez, L.; García-Nieto, E.; Díaz-Barriga, F. Overview of Human Health and Chemical Mixtures: Problems Facing Developing Countries. Environ. Health Perspect. 2002, 110 (Suppl. S6), 901–909. [Google Scholar] [CrossRef] [Green Version]
- Delaney-Black, V.; Covington, C.; Ondersma, S.J.; Nordstrom-Klee, B.; Templin, T.; Ager, J.; Janisse, J.; Sokol, R.J. Violence Exposure, Trauma, and IQ and/or Reading Deficits among Urban Children. Arch. Pediatr. Adolesc. Med. 2002, 156, 280–285. [Google Scholar] [CrossRef] [Green Version]
- Davis, J.M.; Svendsgaard, D.J. Lead and Child Development. Nature 1987, 329, 297–300. [Google Scholar] [CrossRef]
- UNICEF. Afghanistan, the Nutritional Situation of Children Is Alarming; UNICEF: New York, NY, USA, 2019. [Google Scholar]
- Sandjaja, S.; Poh, B.K.; Rojroonwasinkul, N.; Le Nyugen, B.K.; Budiman, B.; Ng, L.O.; Soonthorndhada, K.; Xuyen, H.T.; Deurenberg, P.; Parikh, P. Relationship between Anthropometric Indicators and Cognitive Performance in Southeast Asian School-Aged Children. Br. J. Nutr. 2013, 110 (Suppl. S3), S57–S64. [Google Scholar] [CrossRef]
- Amuta, E.U.; Houmsou, R.S. Assessment of Nutritional Status of School Children in Makurdi, Benue State. Pakistan J. Nutr. 2009, 8, 691–694. [Google Scholar] [CrossRef] [Green Version]
- Bhowal, K.; Mukherjee, I.; Chaudhuri, D. A Study on the Assessment of BMI and Its Association with IQ among Rural Primary School Children in West Bengal, India. Int. J. Curr. Res. 2015, 7, 26–29. [Google Scholar]
- Hein, S.; Reich, J.; Thuma, P.E.; Grigorenko, E.L. Physical Growth and Nonverbal Intelligence: Associations in Zambia. J. Pediatr. 2014, 165, 1017–1023.e1. [Google Scholar] [CrossRef] [PubMed] [Green Version]
- Ardi, N.M.S.M.; Putra, I.W.G.A.E.; Pinatih, G.N.I. Hubungan Status Gizi Dengan Tingkat Intelegensi Pada Siswa Sekolah Menengah Pertama Di Denpasar. Public Health Prev. Med. Arch. 2016, 4, 29. [Google Scholar] [CrossRef]
- Tabriz, A.A.; Sohrabi, M.R.; Parsay, S.; Abadi, A.; Kiapour, N.; Aliyari, M.; Ahmadi, F.; Roodaki, A. Relation of Intelligence Quotient and Body Mass Index in Preschool Children: A Community-Based Cross-Sectional Study. Nutr. Diabetes 2015, 5, e176. [Google Scholar] [CrossRef] [PubMed]
- Ranabhat, C.; Kim, C.-B.; Park, M.; Kim, C.; Freidoony, L. Determinants of Body Mass Index and Intelligence Quotient of Elementary School Children in Mountain Area of Nepal: An Explorative Study. Children 2016, 3, 3. [Google Scholar] [CrossRef] [Green Version]
- Asawa, K.; Pujara, P.; Thakkar, J.P.; Pandya, B.G.; Sharma, A.R.; Pareek, S.; Tak, A.; Tak, M.; Maniar, R. Assessment of Intelligence Quotient among Schoolchildren of Fishermen Community of Kutch, Gujarat, India. Int. Marit. Health 2014, 65, 73–78. [Google Scholar] [CrossRef] [Green Version]
- Ivanovic, D.M.; Leiva, B.P.; Pérez, H.T.; Almagià, A.F.; Toro, T.D.; Urrutia, M.S.C.; Inzunza, N.B.; Bosch, E.O. Nutritional Status, Brain Development and Scholastic Achievement of Chilean High-School Graduates from High and Low Intellectual Quotient and Socio-Economic Status. Br. J. Nutr. 2002, 87, 81–92. [Google Scholar] [CrossRef] [Green Version]
- Aschner, M.; Guilarte, T.R.; Schneider, J.S.; Zheng, W. Manganese: Recent Advances in Understanding Its Transport and Neurotoxicity. Toxicol. Appl. Pharmacol. 2007, 221, 131–147. [Google Scholar] [CrossRef] [Green Version]
- Cecil, K.M.; Brubaker, C.J.; Adler, C.M.; Dietrich, K.N.; Altaye, M.; Egelhoff, J.C.; Wessel, S.; Elangovan, I.; Hornung, R.; Jarvis, K.; et al. Decreased Brain Volume in Adults with Childhood Lead Exposure. PLoS Med. 2008, 5, 0741–0749. [Google Scholar] [CrossRef]
- Finkelstein, Y.; Markowitz, M.E.; Rosen, J.F. Low-Level Lead-Induced Neurotoxicity in Children: An Update on Central Nervous System Effects. Brain Res. Rev. 1998, 27, 168–176. [Google Scholar] [CrossRef]
- Rai, A.; Maurya, S.K.; Khare, P.; Srivastava, A.; Bandyopadhyay, S. Characterization of Developmental Neurotoxicity of As, Cd, and Pb Mixture: Synergistic Action of Metal Mixture in Glial and Neuronal Functions. Toxicol. Sci. 2010, 118, 586–601. [Google Scholar] [CrossRef] [PubMed]
- Sadiq, S.; Ghazala, Z.; Chowdhury, A.; Büsselberg, D. Metal Toxicity at the Synapse: Presynaptic, Postsynaptic, and Long-Term Effects. J. Toxicol. 2012, 2012, 132671. [Google Scholar] [CrossRef] [PubMed]
- Hunt, E. What Makes Nations Intelligent? Perspect. Psychol. Sci. 2012, 7, 284–306. [Google Scholar] [CrossRef] [PubMed]
- Rindermann, H. The G-Factor of International Cognitive Ability Comparisons: The Homogeneity of Results in PISA, TIMSS, PIRLS and IQ-Tests across Nations. Eur. J. Pers. 2007, 21, 667–706. [Google Scholar] [CrossRef]
- Kraay, A. The World Bank Human Capital Index: A Guide. World Bank Res. Obs. 2019, 34, 1–33. [Google Scholar] [CrossRef]
- UNDP. 2020 HDR Technical Notes; UNDP: New York, NY, USA, 2020. [Google Scholar]
- World Bank. The Human Capital Index 2020 Update: Human Capital in the Time of COVID-19; The World Bank: Washington, DC, USA, 2020. [Google Scholar] [CrossRef]
- UNEP. Post-Conflict Environmental Assessment Afghanistan; UNEP: Nairobi, Kenya, 2003. [Google Scholar]
- Brown, L.; Sherbenou, R.J.; Johnsen, S. Examiner’s Manual: Test of Nonverbal Intelligence, 3rd ed.; PRO-ED: Austin, TX, USA, 1997. [Google Scholar]
- Edmonton, A.C. Community-University Partnership for the Study of Children, Youth, and Families. Rev. Test Nonverbal Intell. 2011, 4, 1–4. [Google Scholar]
- Bostantjopoulou, S.; Kiosseoglou, G.; Katsarou, Z.; Alevriadou, A. Concurrent Validity of The Test of Nonverbal Intelligence in Parkinson’s Disease Patients. J. Psychol. Interdiscip. Appl. 2001, 135, 205–212. [Google Scholar] [CrossRef]
- Sroythong, W.; Chulakdabba, S.; Kowasint, C. The Validity Study of the Test of Nonverbal Intelligence, Third Edition (TONI-3). J. Psychiatr. Assoc. Thail. 2009, 54, 115–124. [Google Scholar]
- DeThorne, L.S.; Schaefer, B.A. A Guide to Child Nonverbal IQ Measures. Am. J. Speech-Lang. Pathol. 2004, 13, 275–290. [Google Scholar] [CrossRef]
- World Health Organization. BMI-for-Age (5–19 Years). Available online: https://www.who.int/tools/growth-reference-data-for-5to19-years/indicators/bmi-for-age (accessed on 27 January 2022).
- Chowdhury, S.; Mazumder, M.A.J.; Al-Attas, O.; Husain, T. Heavy Metals in Drinking Water: Occurrences, Implications, and Future Needs in Developing Countries. Sci. Total Environ. 2016, 569–570, 476–488. [Google Scholar] [CrossRef] [PubMed]
- Vijayakumar, S.; Sasikala, M.; Ramesh, R. Lead Poisoning-an Overview. Int. J. Pharmacol. Toxicol. 2012, 2, 70–82. [Google Scholar]
- WHO. Lead Poisoning and Health. Saudi Med. J. 2013, 34, 1090–1091. [Google Scholar]
- Alidadi, H.; Sany, S.B.T.; Oftadeh, B.Z.G.; Mohamad, T.; Shamszade, H.; Fakhari, M. Health Risk Assessments of Arsenic and Toxic Heavy Metal Exposure in Drinking Water in Northeast Iran. Environ. Health Prev. Med. 2019, 24, 59. [Google Scholar] [CrossRef] [Green Version]
- Gao, J.; Liu, Q.; Song, L.; Shi, B. Risk Assessment of Heavy Metals in Pipe Scales and Loose Deposits Formed in Drinking Water Distribution Systems. Sci. Total Environ. 2019, 652, 1387–1395. [Google Scholar] [CrossRef] [PubMed]
- Gonzalez, S.; Lopez-Roldan, R.; Cortina, J.L. Presence of Metals in Drinking Water Distribution Networks Due to Pipe Material Leaching: A Review. Toxicol. Environ. Chem. 2013, 95, 870–889. [Google Scholar] [CrossRef]
- Manga, M.; Ngobi, T.G.; Okeny, L.; Acheng, P.; Namakula, H.; Kyaterekera, E.; Nansubuga, I.; Kibwami, N. The Effect of Household Storage Tanks/Vessels and User Practices on the Quality of Water: A Systematic Review of Literature. Environ. Syst. Res. 2021, 10, 18. [Google Scholar] [CrossRef]
- Obeng-Gyasi, E. Sources of Lead Exposure in Various Countries. Rev. Environ. Health 2019, 34, 25–34. [Google Scholar] [CrossRef]
- WHO; UNICE. Drinking Water Equity, Safety and Sustainability: JMP Thematic Report on Drinking Water; WHO: Geneva, Switzerland, 2011. [Google Scholar]
- IBM. IBM SPSS Statistics for Windows; IBM: Armonk, NY, USA, 2012. [Google Scholar]
- Lynn, R.; Meisenberg, G. National IQs Calculated and Validated for 108 Nations. Intelligence 2010, 38, 353–360. [Google Scholar] [CrossRef]
- Lynn, R.; Vanhanen, T.; Stuart, M. IQ and the Wealth of Nations. Econ. J. 2002, 113, F406–F408. [Google Scholar] [CrossRef]
- Lynn, R.; Vanhanen, T. IQ and Global Inequality; Washington Summit Publishers: Augusta, GA, USA, 2006. [Google Scholar]
- Hamilton, K.; Markandya, A.; Pedroso-Galinato, S.; Silva, P.; Ordoubadi, M.S.; Lange, G.-M.; Zhou, L.; Martin-Hurtado, R. Where Is the Wealth of Nations? Measuring Capital for the 21st Century; The World Bank: Washington, DC, USA, 2006. [Google Scholar]
- Wicherts, J.M. The Impact of Papers Published in Intelligence 1977–2007 and an Overview of the Citation Classics. Intelligence 2009, 37, 443–446. [Google Scholar] [CrossRef]
- Hindley, R. Growing Up in Five Countries: A Comparison of Data on Weaning, Elimination Training, Age of Walking and IQ in Relation to Social Class from European Longitudinal Studies. Develop. Med. Child Neurol. 1968, 10, 715–724. [Google Scholar] [CrossRef] [PubMed]
- Hutton, G.; Chase, C. The Knowledge Base for Achieving the Sustainable Development Goal Targets on Water Supply, Sanitation and Hygiene. Int. J. Environ. Res. Public Health 2016, 13, 536. [Google Scholar] [CrossRef] [PubMed] [Green Version]
- Jordanova, T.; Cronk, R.; Obando, W.; Medina, O.Z.; Kinoshita, R.; Bartram, J. Water, Sanitation, and Hygiene in Schools in Low Socio-Economic Regions in Nicaragua: A Cross-Sectional Survey. Int. J. Environ. Res. Public Health 2015, 12, 6197–6217. [Google Scholar] [CrossRef] [Green Version]
- Eqrar, N. Groundwater Quantity and Quality Problems in Kabul City-University of Kabul. 2015. [Google Scholar]
- Zaryab, A.; Reza Noori, A.; Wegerich, K.; Kløve, B. Assessment of Water Quality and Quantity Trends in Kabul Aquifers with an Outline for Future Drinking Water Supplies. Cent. Asian J. Water Res. 2017, 3, 3–11. [Google Scholar]
- Brati, M.Q.; Ishihara, M.I.; Higashi, O. Groundwater Level Reduction and Pollution in Relation to Household Water Management in Kabul, Afghanistan. Sustain. Water Resour. Manag. 2019, 5, 1315–1325. [Google Scholar] [CrossRef]
- Eqrar, M.N. Water Supply and Sanitation of Kabul Basin Background. In Proceedings of the Coupling Sustainable Sanitation & Groundwater Protection Symposium, Hannover, Deutschland, 14–17 October 2008. [Google Scholar]
- Barton, H. Predicted Intake of Trace Elements and Minerals via Household Drinking Water by 6-Year-Old Children from Kraków, Poland. Part 2: Cadmium, 1997–2001. Food Addit. Contam. 2005, 22, 816–828. [Google Scholar] [CrossRef]
- Barton, H.; Zachwieja, Z.; Folta, M. Predicted Intake of Trace Elements and Minerals via Household Drinking Water by 6-Year-Old Children from Kraków (Poland). Part 1: Lead (Year 2000). Food Addit. Contam. 2002, 19, 906–915. [Google Scholar] [CrossRef]
- Barton, H. Predicted Intake of Trace Elements and Minerals via Household Drinking Water by 6-Year-Old Children from Krakow, Poland. Part 5: Zinc. Food Addit. Contam. Part A Chem. Anal. Control. Expo. Risk Assess. 2010, 27, 315–326. [Google Scholar] [CrossRef] [Green Version]
- Boyd, G.R.; Pierson, G.L.; Kirmeyer, G.J.; Britton, M.D.; English, R.J. Lead Release from New End-Use Plumbing Components in Seattle Public Schools. J. Am. Water Work. Assoc. 2008, 105, 114. [Google Scholar]
- Deshommes, E.; Laroche, L.; Nour, S.; Cartier, C.; Prévost, M. Source and Occurrence of Particulate Lead in Tap Water. Water Res. 2010, 44, 3734–3744. [Google Scholar] [CrossRef] [PubMed]
- Dudi, A.; Schock, M.; Murray, N.; Edwards, M. Lead Leaching from Inline Brass Devices: A Critical Evaluation of the Existing Standard. J. Am. Water Work. Assoc. 2005, 97, 66–78. [Google Scholar] [CrossRef]
- Kimbrough, D.E. Brass Corrosion as a Source of Lead and Copper in Traditional and All-Plastic Distribution Systems. J. Am. Water Work. Assoc. 2007, 99, 70–76. [Google Scholar] [CrossRef]
- Hamdard, M.H.; Soliev, I.; Xiong, L.; Kløve, B. Drinking Water Quality Assessment and Governance in Kabul: A Case Study from a District with High Migration and Underdeveloped Infrastructure. Cent. Asian J. Water Res. 2015, 6, 66–81. [Google Scholar] [CrossRef]
- Al-Bahry, S.N.; Elshafie, A.E.; Victor, R.; Mahmoud, I.Y.; Al-Hinai, J.A. Opportunistic Pathogens Relative to Physicochemical Factors in Water Storage Tanks. J. Water Health 2011, 9, 382–393. [Google Scholar] [CrossRef] [Green Version]
- Al-Bahry, S.N.; Al-Hinai, J.A.; Mahmoud, I.Y.; Al-Musharafi, S.K. Opportunistic and Microbial Pathogens in Municipal Water Distribution Systems. APCBEE Procedia 2013, 5, 339–343. [Google Scholar] [CrossRef]
- Chalchisa, D.; Megersa, M.; Beyene, A. Assessment of the Quality of Drinking Water in Storage Tanks and Its Implication on the Safety of Urban Water Supply in Developing Countries. Environ. Syst. Res. 2018, 6, 12. [Google Scholar] [CrossRef] [Green Version]
- Mohanan, N.; Manju, E.K.; Jacob, S. The Effect of Different Types of Storage Vessels on Water Quality. Int. J. Innvative Res. Sci. Eng. Technol. 2017, 6, 20362–20368. [Google Scholar] [CrossRef]
- Nnaji, C.C.; Nnaji, I.V.; Ekwule, R.O. Storage-Induced Deterioration of Domestic Water Quality. J. Water Sanit. Hyg. Dev. 2019, 9, 329–337. [Google Scholar] [CrossRef]
- Varghese, J.; Jaya, D.S. Drinking Water Quality Assessment of Rain Water Harvested in Ferrocement Tanks in Alappuzha District, Kerala (India). J. Environ. Sci. Eng. 2008, 50, 115–120. [Google Scholar]
- Ziadat, A.H. Impact of Storage Tanks on Drinking Water Quality in Al-Karak Province-Jordan. J. Appl. Sci. 2005, 5, 634–638. [Google Scholar] [CrossRef] [Green Version]
- Al-Ghanim, K.A.; El-Salam, M.M.A.; Mahboob, S. Assessment of Water Quality for Some Roof Tanks in Alkharj Governorate, KSA. Pak. J. Zool. 2014, 46, 1003–1012. [Google Scholar]
- Rodrigo, S.; Sinclair, M.; Leder, K. A Survey of the Characteristics and Maintenance of Rainwater Tanks in Urban Areas of South Australia. Water Sci. Technol. 2010, 61, 1569–1577. [Google Scholar] [CrossRef] [PubMed]
- Jawad, I.M.; Al-Ghazali, M.R.; Khorshid, M.S.H. Effect of domestic storage tanks on the quality of drinking waters part 1:chemical analysis. Environ. Monit. Assess. 1988, 11, 79–87. [Google Scholar] [CrossRef] [PubMed]
- Lanphear, B.P.; Hornung, R.; Khoury, J.; Yolton, K.; Baghurst, P.; Bellinger, D.C.; Canfield, R.L.; Dietrich, K.N.; Bornschein, R.; Greene, T.; et al. Low-Level Environmental Lead Exposure and Children’s Intellectual Function: An International Pooled Analysis. Environ. Health Perspect. 2005, 113, 894–899. [Google Scholar] [CrossRef] [PubMed]
- Needleman, H.L.; Gatsonis, C.A. Low-Level Lead Exposure and the IQ of Children: A Meta-Analysis of Modern Studies. JAMA J. Am. Med. Assoc. 1990, 263, 673–678. [Google Scholar] [CrossRef]
- Bellinger, D.; Needleman, H. Intellectual Impairment in Children with Blood Lead Concentrations below 10 Μg per Deciliter. J. Dev. Behav. Pediatr. 2004, 25, 73. [Google Scholar] [CrossRef]
- Canfield, R.L.; Henderson, C.R.; Cory-Slechta, D.A.; Cox, C.; Jusko, T.A.; Lanphear, B.P. Intellectual Impairment in Children with Blood Lead Concentrations below 10 Μg per Deciliter. N. Engl. J. Med. 2003, 348, 1517–1526. [Google Scholar] [CrossRef] [Green Version]
- Wang, G.; Fowler, B.A. Roles of Biomarkers in Evaluating Interactions among Mixtures of Lead, Cadmium and Arsenic. Toxicol. Appl. Pharmacol. 2008, 233, 92–99. [Google Scholar] [CrossRef]
- Wasserman, G.A.; Liu, X.; Parvez, F.; Ahsan, H.; Factor-Litvak, P.; van Geen, A.; Slavkovich, V.; Lolacono, N.J.; Cheng, Z.; Hussain, I.; et al. Water Arsenic Exposure and Children’s Intellectual Function in Araihazar, Bangladesh. Environ. Health Perspect. 2004, 112, 1329–1333. [Google Scholar] [CrossRef] [Green Version]
- Brown, M.J.; Margolis, S. Lead in Drinking Water and Human Blood Lead Levels in the United States; Morbidity and Mortality Weekly Report, Surveillance Summaries; Centers for Disease Control & Prevention (CDC): Washington, DC, USA, 2002; pp. 1–9. [Google Scholar]
- Denham, S.A.; Neal, K.; Wilson, B.J.; Pickering, S.; Boyatzis, C.J. Emotional Development and Forgiveness in Children: Emerging Evidence. In Handbook of Forgiveness; Worthington, E.L., Jr., Ed.; Routledge: New York, NY, USA, 2005; pp. 127–142. [Google Scholar] [CrossRef]
- Ris, M.D.; Dietrich, K.N.; Succop, P.A.; Berger, O.G.; Bornschein, R.L. Early Exposure to Lead and Neuropsychological Outcome in Adolescence. J. Int. Neuropsychol. Soc. 2004, 10, 261–270. [Google Scholar] [CrossRef] [PubMed]
- Bowen, N.K.; Bowen, G.L. Effects of Crime and Violence in Neighborhoods and Schools on the School Behavior and Performance of Adolescents. J. Adolesc. Res. 1999, 14, 319–342. [Google Scholar] [CrossRef]
- Lipschitz, D.S.; Rasmusson, A.M.; Anyan, W.; Cromwell, P.; Southwick, S.M. Clinical and Functional Correlates of Posttraumatic Stress Disorder in Urban Adolescent Girls at a Primary Care Clinic. J. Am. Acad. Child Adolesc. Psychiatry 2000, 39, 1104–1111. [Google Scholar] [CrossRef]
- Saigh, P.A.; Mroueh, M.; Bremner, J.D. scholastic impairment among adolescents traumatized. Behav. Res. Ther. 1997, 35, 429–436. [Google Scholar] [CrossRef]
- Dahl, R.E. Adolescent Brain Development: A Period of Vulnerabilities and Opportunu. Neurosci. Biobehav. Rev. 2013, 70, 32–35. [Google Scholar]
- McFadyen, R.G.; Kitson, W.J.H. Language Comprehension and Expression among Adolescents Who Have Experienced Childhood Physical Abuse. J. Child Psychol. Psychiatry Allied Discip. 1996, 37, 551–562. [Google Scholar] [CrossRef] [PubMed]
- Paus, T.; Keshavan, M.; Giedd, J.N. Why Do Many Psychiatric Disorders Emerge during Adolescence? Nat. Rev. Neurosci. 2008, 9, 947–957. [Google Scholar] [CrossRef] [PubMed] [Green Version]
- Catani, C.; Schauer, E.; Elbert, T.; Missmahl, I.; Bette, J.P.; Neuner, F. War Trauma, child labor, and Family Violence: Life Adversities and PTSD in a Sample of School Children in Kabul. J. Trauma. Stress 2009, 22, 163–171. [Google Scholar] [CrossRef]
- Eggerman, M.; Panter-Brick, C. Suffering, Hope, and Entrapment: Resilience and Cultural Values in Afghanistan. Soc. Sci. Med. 2010, 71, 71–83. [Google Scholar] [CrossRef] [Green Version]
- Mashal, T.; Takano, T.; Nakamura, K.; Kizuki, M.; Hemat, S.; Watanabe, M.; Seino, K. Factors Associated with the Health and Nutritional Status of Children under 5 Years of Age in Afghanistan: Family Behaviour Related to Women and Past Experience of War-Related Hardships. BMC Public Health 2008, 8, 301. [Google Scholar] [CrossRef] [Green Version]
- Panter-Brick, C.; Goodman, A.; Tol, W.; Eggerman, M. Mental Health and Childhood Adversities: A Longitudinal Study in Kabul, Afghanistan. J. Am. Acad. Child Adolesc. Psychiatry 2011, 50, 349–363. [Google Scholar] [CrossRef] [PubMed] [Green Version]
- Alemi, Q.; Stempel, C.; Koga, P.M.; Montgomery, S.; Smith, V.; Sandhu, G.; Villegas, B.; Requejo, J. Risk and Protective Factors Associated with the Mental Health of Young Adults in Kabul, Afghanistan. BMC Psychiatry 2018, 18, 71. [Google Scholar] [CrossRef] [PubMed] [Green Version]
- Trani, J.F.; Biggeri, M.; Mauro, V. The Multidimensionality of Child Poverty: Evidence from Afghanistan. Soc. Indic. Res. 2013, 112, 391–416. [Google Scholar] [CrossRef]
- Evans, G.W.; Kim, P.; Ting, A.H.; Tesher, H.B.; Shannis, D. Cumulative Risk, Maternal Responsiveness, and Allostatic Load among Young Adolescents. Dev. Psychol. 2007, 43, 341–351. [Google Scholar] [CrossRef] [PubMed] [Green Version]
- Miller, K.E.; Rasmussen, A. Mental Health and Armed Conflict: The Importance of Distinguishing between War Exposure and Other Sources of Adversity: A Response to Neuner. Soc. Sci. Med. 2010, 71, 1385–1389. [Google Scholar] [CrossRef]
- Guimbert, S.; Miwa, K.; Nguyen, D.T. Back to School in Afghanistan: Determinants of School Enrollment. Int. J. Educ. Dev. 2008, 28, 419–434. [Google Scholar] [CrossRef]
- Sherani, K.S.; Samuelsson, M.J. Public and Private Schools in Afghanistan Comparing Some Aspects of Public and Private Schools in Kabul City. Master’s Thesis, Art and Social Science Faculty, Karltads University, Karlstad, Sweden, 2014. [Google Scholar]
- Mansory, A.M. Do Children Learn in Afghan Schools?—Assessment of Math and Language Achievements of Sstudent; Swedish Committee for Afghanistan: Kabul, Afghanistan, 2010. [Google Scholar]
- Carnoy, M.; Mcewan, P.J. Privatization Through Vouchers in Developing Countries: The Cases of Chile and Colombia. In Privatizing Education; Routledge: New York, NY, USA, 2018; pp. 151–177. [Google Scholar] [CrossRef]
- Downes, T.A.; Figlio, D.N. School Finance Reforms, Tax Limits, and Student Performance: Do Reforms Level Up or Dumb Down? Institute for Research on Poverty, University of Wisconsin-Madison: Madisson, WI, USA, 1997. [Google Scholar]
- Goyal, S. Inside the House of Learning: The Relative Performance of Public and Private Schools in Orissa. Educ. Econ. 2009, 17, 315–327. [Google Scholar] [CrossRef]
- Al-Shehab, A. The Impact of Private Sector Competition on Public Schooling in Kuwait: Some Socio-Educational Implications. Education 2010, 131, 181–195. [Google Scholar]
- Thapa, A. Does Private School Competition Improve Public School Performance? The Case of Nepal. Int. J. Educ. Dev. 2013, 33, 358–366. [Google Scholar] [CrossRef] [Green Version]
- Andrabi, T.; Das, J.; Khwaja, A.I. The Rise of Private Schooling in Pakistan: Catering to the Urban Elite or Educating the Rural Poor? Working Paper. 2002. Available online: https://www.researchgate.net/publication/228758859_The_rise_of_private_schooling_in_Pakistan_Catering_to_the_urban_elite_or_educating_the_rural_poor (accessed on 25 May 2022).
- Karlsson, P.; Mansory, A. Islamic and Modern Education in Afghanistan—Conflictual or Complementary? Institute of International Education, Stockholm University: Stockholm, Sweden, 2008; pp. 1–24. [Google Scholar]
- Packer, S.; Allsop, T.; Dvorak, E.; Stanley, T.P.; Wirak, A. Afghanistan Education Sector Analysis, Kabul, Afghanistan; Adam Smith International: London, UK, 2010. [Google Scholar]
- Hunte, P. Household Decision-Making and School Enrolment in Afghanistan: Chahar Asyab District, Kabul Province; Case Study Series; Afghanistan Research and Evaluation Unit: Kabul, Afghanistan, 2005; Volume 3. [Google Scholar]
- Kissane, C. The Way Forward for Girls’ Education in Afghanistan. J. Int. Womens. Stud. 2012, 13, 10–28. [Google Scholar]
- Noori, A. Issues Causing Girls Dropout from Schools in Afghanistan. Int. J. Innov. Res. Multidiscip. Field 2017, 3, 111–116. [Google Scholar]

| S1 | S2 | S3 | S4 | S5 | p-Value | ||
|---|---|---|---|---|---|---|---|
| Number of students | 55 | 41 | 57 | 50 | 45 | ||
| Age | 11.4 ±2.0 | 10.8 ±2.1 | 12.4 ±1.9 | 12.1 ±2.0 | 11.4 ±1.9 | 0.001 | |
| Gender | male | 38 (69.1) | 41 (100) | 0 | 50 (100) | 45 (100) | <0.0005 |
| female | 17 (30.9) | 0 | 57 (100) | 0 | 0 | ||
| Home near major road | 32 (58) | 30 (73) | 35 (61) | 41 (82) | 28 (62) | 0.06 | |
| Use of surma | 18 (32) | 6 (14) | 20 (35) | 22 (44) | 10 (22) | <0.05 | |
| Tap water use | 40 (72.7) | 29 (70.7) | 34 (59.6) | 18 (36) | 12 (26.6) | <0.0005 | |
| Height for age z-score | −0.52 ± 1.44 | -0.30 ± 1.47 | −0.28 ± 1.39 | −0.76 ± 1.09 | −0.46 ± 1.25 | 0.37 | |
| BMI for age z-score | −0.15 ± 0.77 | −0.39 ±0.78 | 0.24 ± 1.07 | 0.13 ±1.10 | 0.10 ±1.12 | <0.05 | |
| Overweight | 4 (7.3) | 3 (7.3) | 11 (19.3) | 10 (20.4) | 9 (20.5) | 0.12 | |
| Below poverty | 19 (34.5) | 13 (31.7) | 23 (40.4) | 23 (46) | 11 (24.4) | 0.23 | |
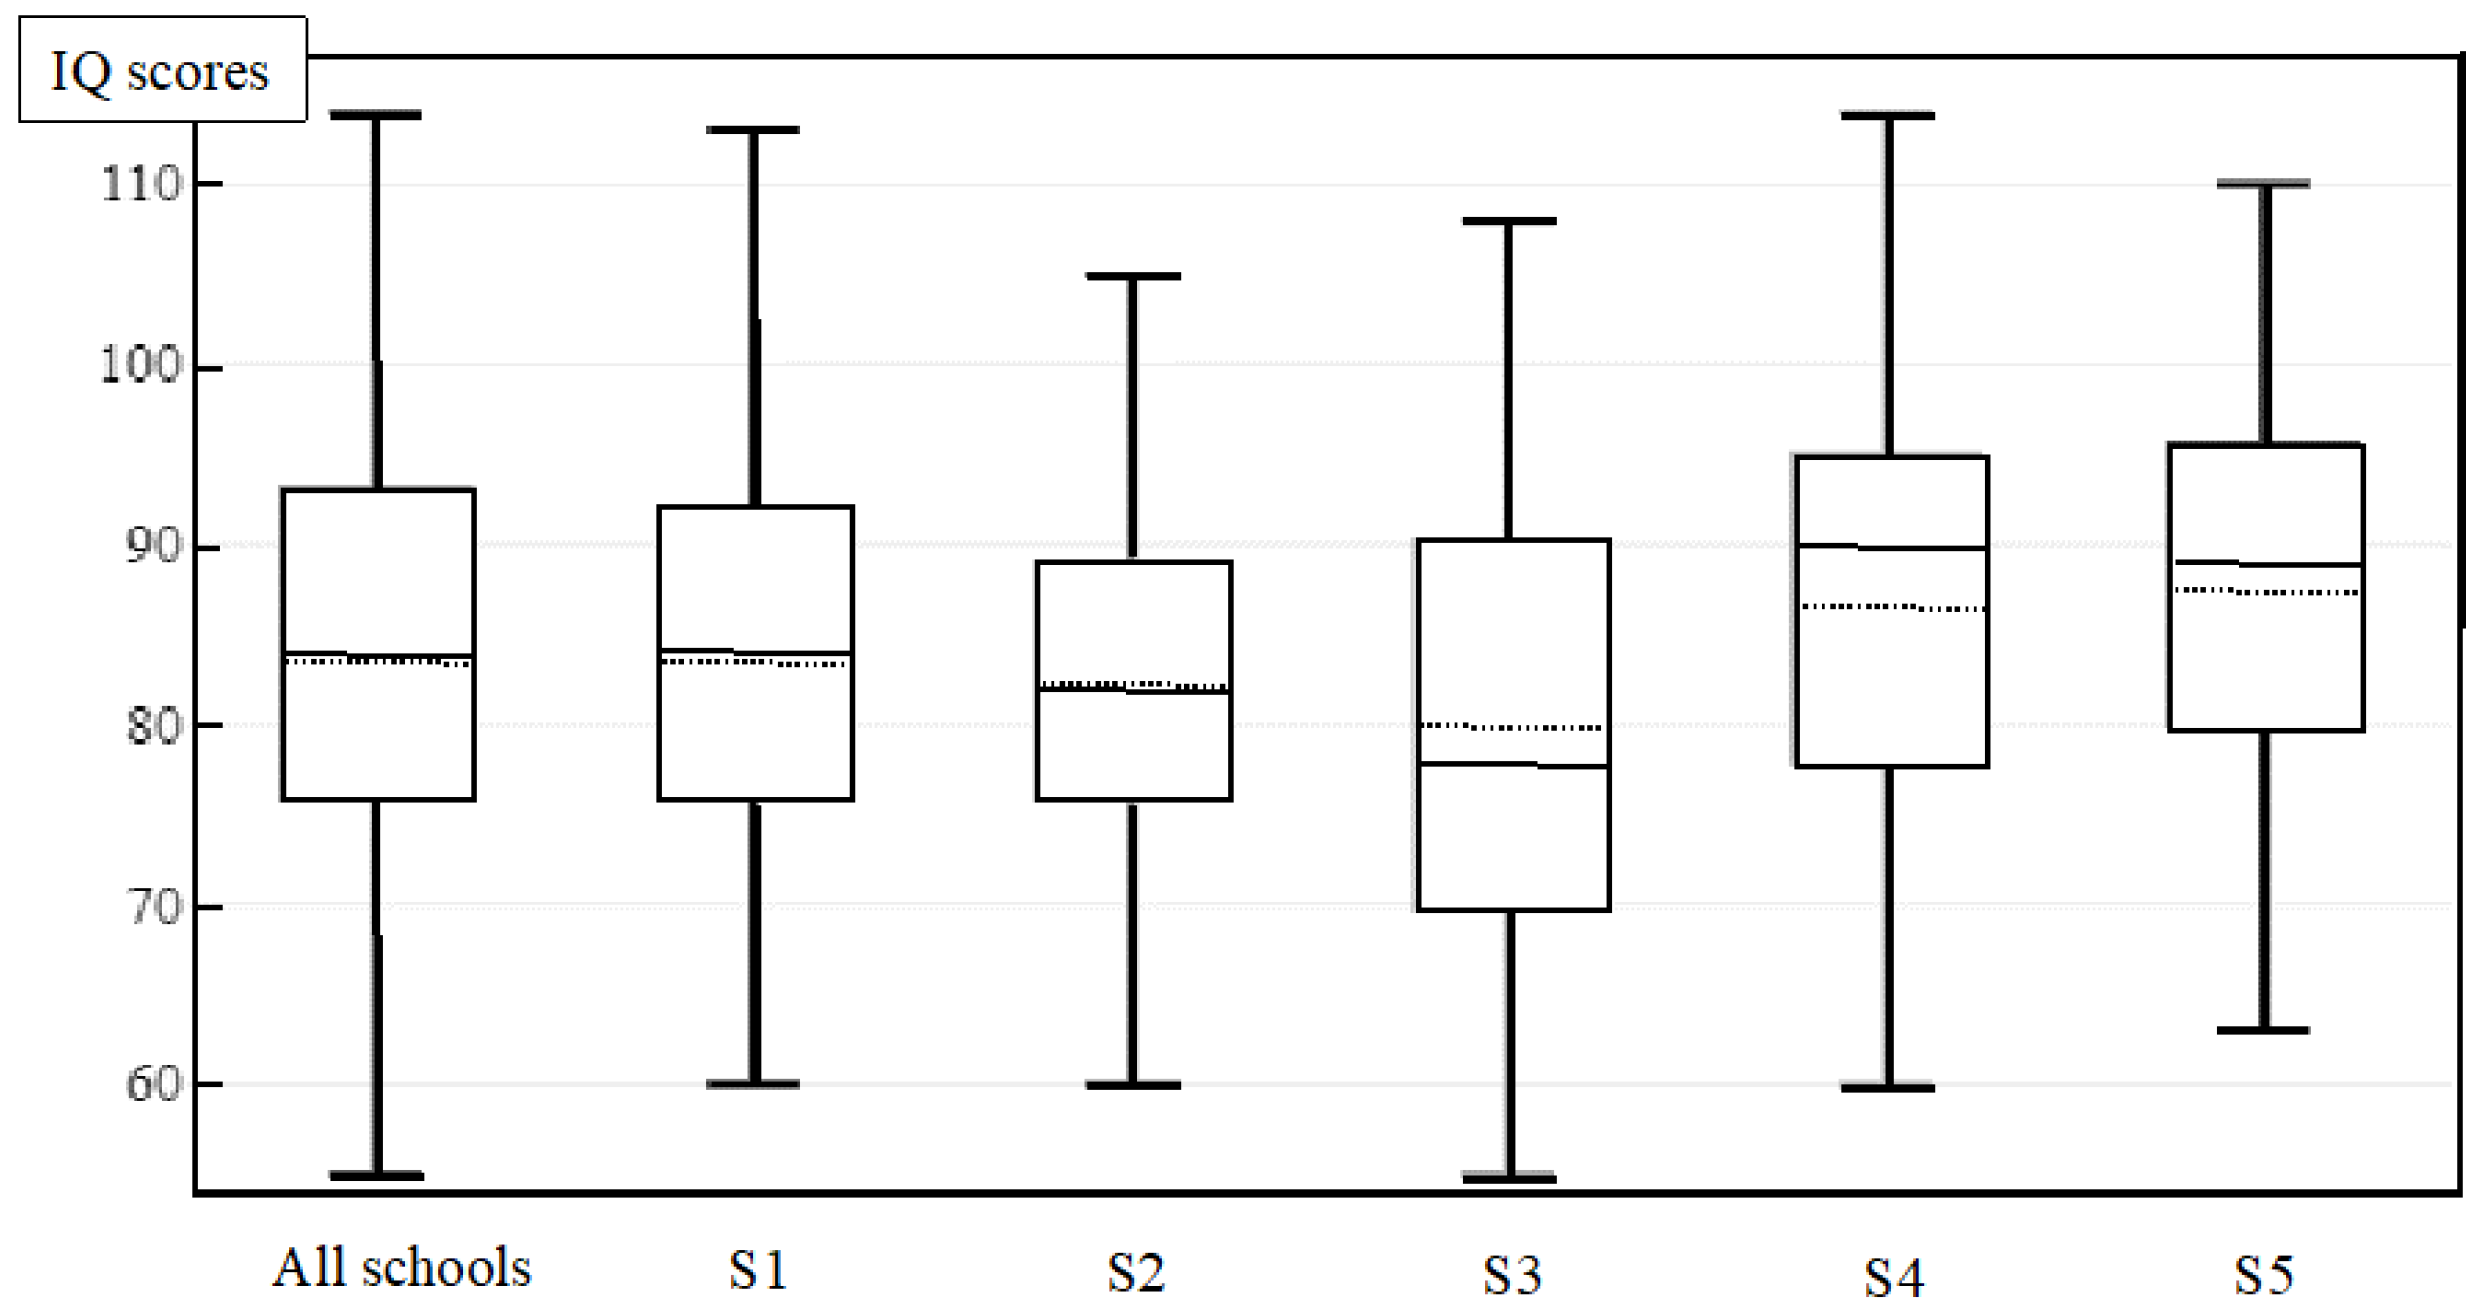
| IQ | 83.7 ± 11.7 | 82.1 ± 10.2 | 79.9 ± 12.7 | 86.6 ± 13.7 | 87.2 ± 13.1 | <0.05 | |
| Bivariate Analyses | Multivariate Model | |||
|---|---|---|---|---|
| Predictors | Coefficient [95% CI] | p-Value | Coefficient [95% CI] | p-Value |
| Intercept | Not shown | 105.1 [94.1; 116.1] | <0.001 | |
| Male | −1.8 [−8.0; 4.3] | 0.528 | −0.9 [−6.7; 4.9] | 0.729 |
| Poverty | −3.2 [−6.5; −0.01] | 0.049 | −2.6 [−5.8; 0.6] | 0.116 |
| Tap water use | −3.1 [−6.3; 0.1] | 0.058 | −3.9 [−7.1; −0.6] | 0.019 |
| Heavy traffic road | −1.5 [−4.8; 1.8] | 0.380 | −1.6 [−5.0; 1.8] | 0.351 |
| Age (years) | −1.3 [−2.0; −0.5] | 0.002 | −1.4 [−2.2; −0.6] | 0.001 |
| Surma use | −2.0 [−5.4; 1.4] | 0.252 | −2.4 [−6.0; 1.0] | 0.166 |
| Overweight | −2.6 [−10.7; 5.4] | 0.518 | −0.2 [−8.2; 7.8] | 0.956 |
Publisher’s Note: MDPI stays neutral with regard to jurisdictional claims in published maps and institutional affiliations. |
© 2022 by the authors. Licensee MDPI, Basel, Switzerland. This article is an open access article distributed under the terms and conditions of the Creative Commons Attribution (CC BY) license (https://creativecommons.org/licenses/by/4.0/).
Share and Cite
Shinwari, A.; Véron, A.; Abdianwall, M.H.; Jouve, E.; Laporte, R. Tap Water Consumption Is Associated with Schoolchildren’s Cognitive Deficits in Afghanistan. Int. J. Environ. Res. Public Health 2022, 19, 8252. https://doi.org/10.3390/ijerph19148252
Shinwari A, Véron A, Abdianwall MH, Jouve E, Laporte R. Tap Water Consumption Is Associated with Schoolchildren’s Cognitive Deficits in Afghanistan. International Journal of Environmental Research and Public Health. 2022; 19(14):8252. https://doi.org/10.3390/ijerph19148252
Chicago/Turabian StyleShinwari, Abdullah, Alain Véron, Mohammad Haris Abdianwall, Elisabeth Jouve, and Remi Laporte. 2022. "Tap Water Consumption Is Associated with Schoolchildren’s Cognitive Deficits in Afghanistan" International Journal of Environmental Research and Public Health 19, no. 14: 8252. https://doi.org/10.3390/ijerph19148252