Abstract
The quantitative analysis of the urban-rural integration development (URID) level and its driving factors is of great significance for the new-type urbanization of urban agglomerations. This study constructed a multidimensional framework in the perspective of a population–space–economy–society–ecology framework to measure the URID level from 2000 to 2020 and further explored the driving mechanism of the URID changes by a geographical detector model in the Hangzhou Bay urban agglomeration (HBUA). The results showed that the land-use change in the HBUA from 2000 to 2020 showed a typical characteristic of the transition between cultivated and construction land. The URID level in the HBUA improved from 0.294 in 2000 to 0.563 in 2020, and the year 2005 may have been the inflection point of URID in the HBUA. The URID level showed a significant spatial aggregation with high values. Hangzhou, Jiaxing, and Ningbo were hot spots since 2015, and the cold spots were Huzhou and Shaoxing. The population and spatial integration had more important impacts on URID levels in 2000, 2005, and 2020, while economic and social integration had more significant impacts on URID levels in 2010 and 2015. This study provided a deeper understanding of the evolution of URID in an urban agglomeration and could be used as a reference for decision makers.
1. Introduction
Urbanization and industrialization play important roles in the urban-rural relationship and have significantly widened the gap between urban and rural areas. Rural decline, such as depopulation and poverty, has become a common phenomenon in many countries around the world [1,2,3,4,5]. Therefore, the contrast between rural decline and urban prosperity has been obvious, causing countries to revitalize their countryside [6]. For example, the European Union’s common agricultural policy, launched in 1962, aimed to support farmers, improve agricultural productivity, and keep the rural economy alive, as well as foster rural development in terms of ecosystems and sustainable management [7]. The concept of urban-rural equalized development was proposed in Germany in 1950 and stated that “inhabitants in rural and urban areas may have different lifestyles, but enjoy an equivalent standard of living” [8]. Moreover, the urban-rural interactions and urban-rural teleconnections have been key themes in the Global Land Programme, which aimed to understand the feedback between urban and rural environments [9]. Many research fields have been driven and fostered to build better relationships and development between urban and rural areas [10,11,12]. China, with the largest population in the world, still has a dual economy, namely, an economically advanced sector and an economically underdeveloped sector, which was revealed by the British economist W. Arthur Lewis in 1954. The ratio of urban to rural income was 1.86:1 in 1985, it peaked in 2009 at 3.33:1 [2], and was 2.39 in the first quarter of 2022 [13]. The disparities between rural and urban areas in China have been obvious and significant, including housing [14], infrastructure [15], environment management [16], planning [17], social services [18], and quality of life [19]. Therefore, narrowing the gap between urban and rural areas is an urgent problem in China.
Urban-rural development in a megacity or urban agglomeration has been the focus as it indicates the future development of the whole country [2]. URID is the solution to the disparities between rural and urban areas and has been a priority task in China [20]. It has also been beneficial to high-quality development and the goal of common prosperity [21,22]. The government at each level in China has released a related policy to foster the development of urban-rural integration. China’s national government issued the “Opinions on Establishing and Improving the Institutional Mechanism and Policy System for Urban-rural Integrated Development” in 2019. The “Outline of the 14th Five-Year Plan (2021–2025) for National Economic and Social Development and Vision 2035 of the People’s Republic of China” was released in 2021 and further indicated that it is necessary to “strengthen the systems and mechanisms of integrated urban-rural development” [23]. The “Key Tasks for a New-type of Urbanization and Urban-rural Integration Development in 2021” specifically indicated that it was necessary to change the development mode of megacities and accelerate the promotion of urban-rural integration development [24]. The “Key Tasks for a New-type of Urbanization and Urban-rural Integration Development in 2022” were to improve the integrated development mechanism of urban agglomerations [25]. Moreover, 11 areas were selected to develop as national pilot zones for urban-rural integrated development [26]. Creating a new pattern of high-quality development in urban-rural integration is a major strategic need in China to promote the coordinated and sustainable development of urban and rural societies, economies, and environments so as to meet the growing needs of the people for a better life. Therefore, it is urgent to understand the changing tendency of urban-rural integration development and its driving mechanism, which can provide reference for the sustainable planning and decision-making in China and other developing countries.
Previous research has mainly focused on the characteristic of URID. The quantitative measurement of the URID level is a key first step. A basis–driver–goal framework was built and applied to make the evaluation index system, which further measured the regional differentiation and explored the spatiotemporal evolution of the URID levels in China from 2000 to 2018 [27]. Another multidimensional evaluation index system based on the people–space–economy–society–ecology for urban-rural integration analyzed the URID levels in China from 1999 to 2016 [28]. Moreover, researchers quantitatively analyzed the evolution rules and spatiotemporal patterns of land-use transitions and URID in China, which revealed that land-use transitions negatively impacted URID [29]. Furthermore, studies also focused on the difference in URID from different perspectives, such as quality of life [19] and equity [30]. These studies provide a helpful basis to understand the URID, but the spatiotemporal variation and driving mechanism of URID in developed urban agglomerations have not yet been fully explored.
The HBUA is located in the Yangtze River Delta region, which is the most dynamic and economically developed area after China’s reform and opening. Furthermore, the HBUA is an optimized development area in the “Outline of integrated development of Yangtze River Delta” [31] and includes one of the 11 national pilot zones for the URID. Therefore, how to take the lead in optimizing the development model and build a new pattern of the URID in this region has a typical demonstration and is of great significance for promoting the integration development of the Yangtze River Delta. Therefore, the objectives of this study were to analyze the characteristic of urbanization according to land-use change, quantitatively measure the URID level, explore the spatiotemporal pattern of URID, and further reveal the driving mechanism of the variation in URID levels. Finally, some suggestions for promoting the URID were discussed.
The rest of this paper is organized as follows. Section 2 is a theoretical analysis that describes the connotation of URID as well as the literature on the measurement of URID in the context of China, which provides a reference for the measurement indicator system of URID in Section 3. Section 3 discusses the methodology as well as the data source. Section 4 presents our results, and Section 5 discusses the significance of our findings as well as the implications and limitations. Section 6 presents the conclusions of this study.
2. Theoretical Analysis and Hypothesis
2.1. Theoretical Framework
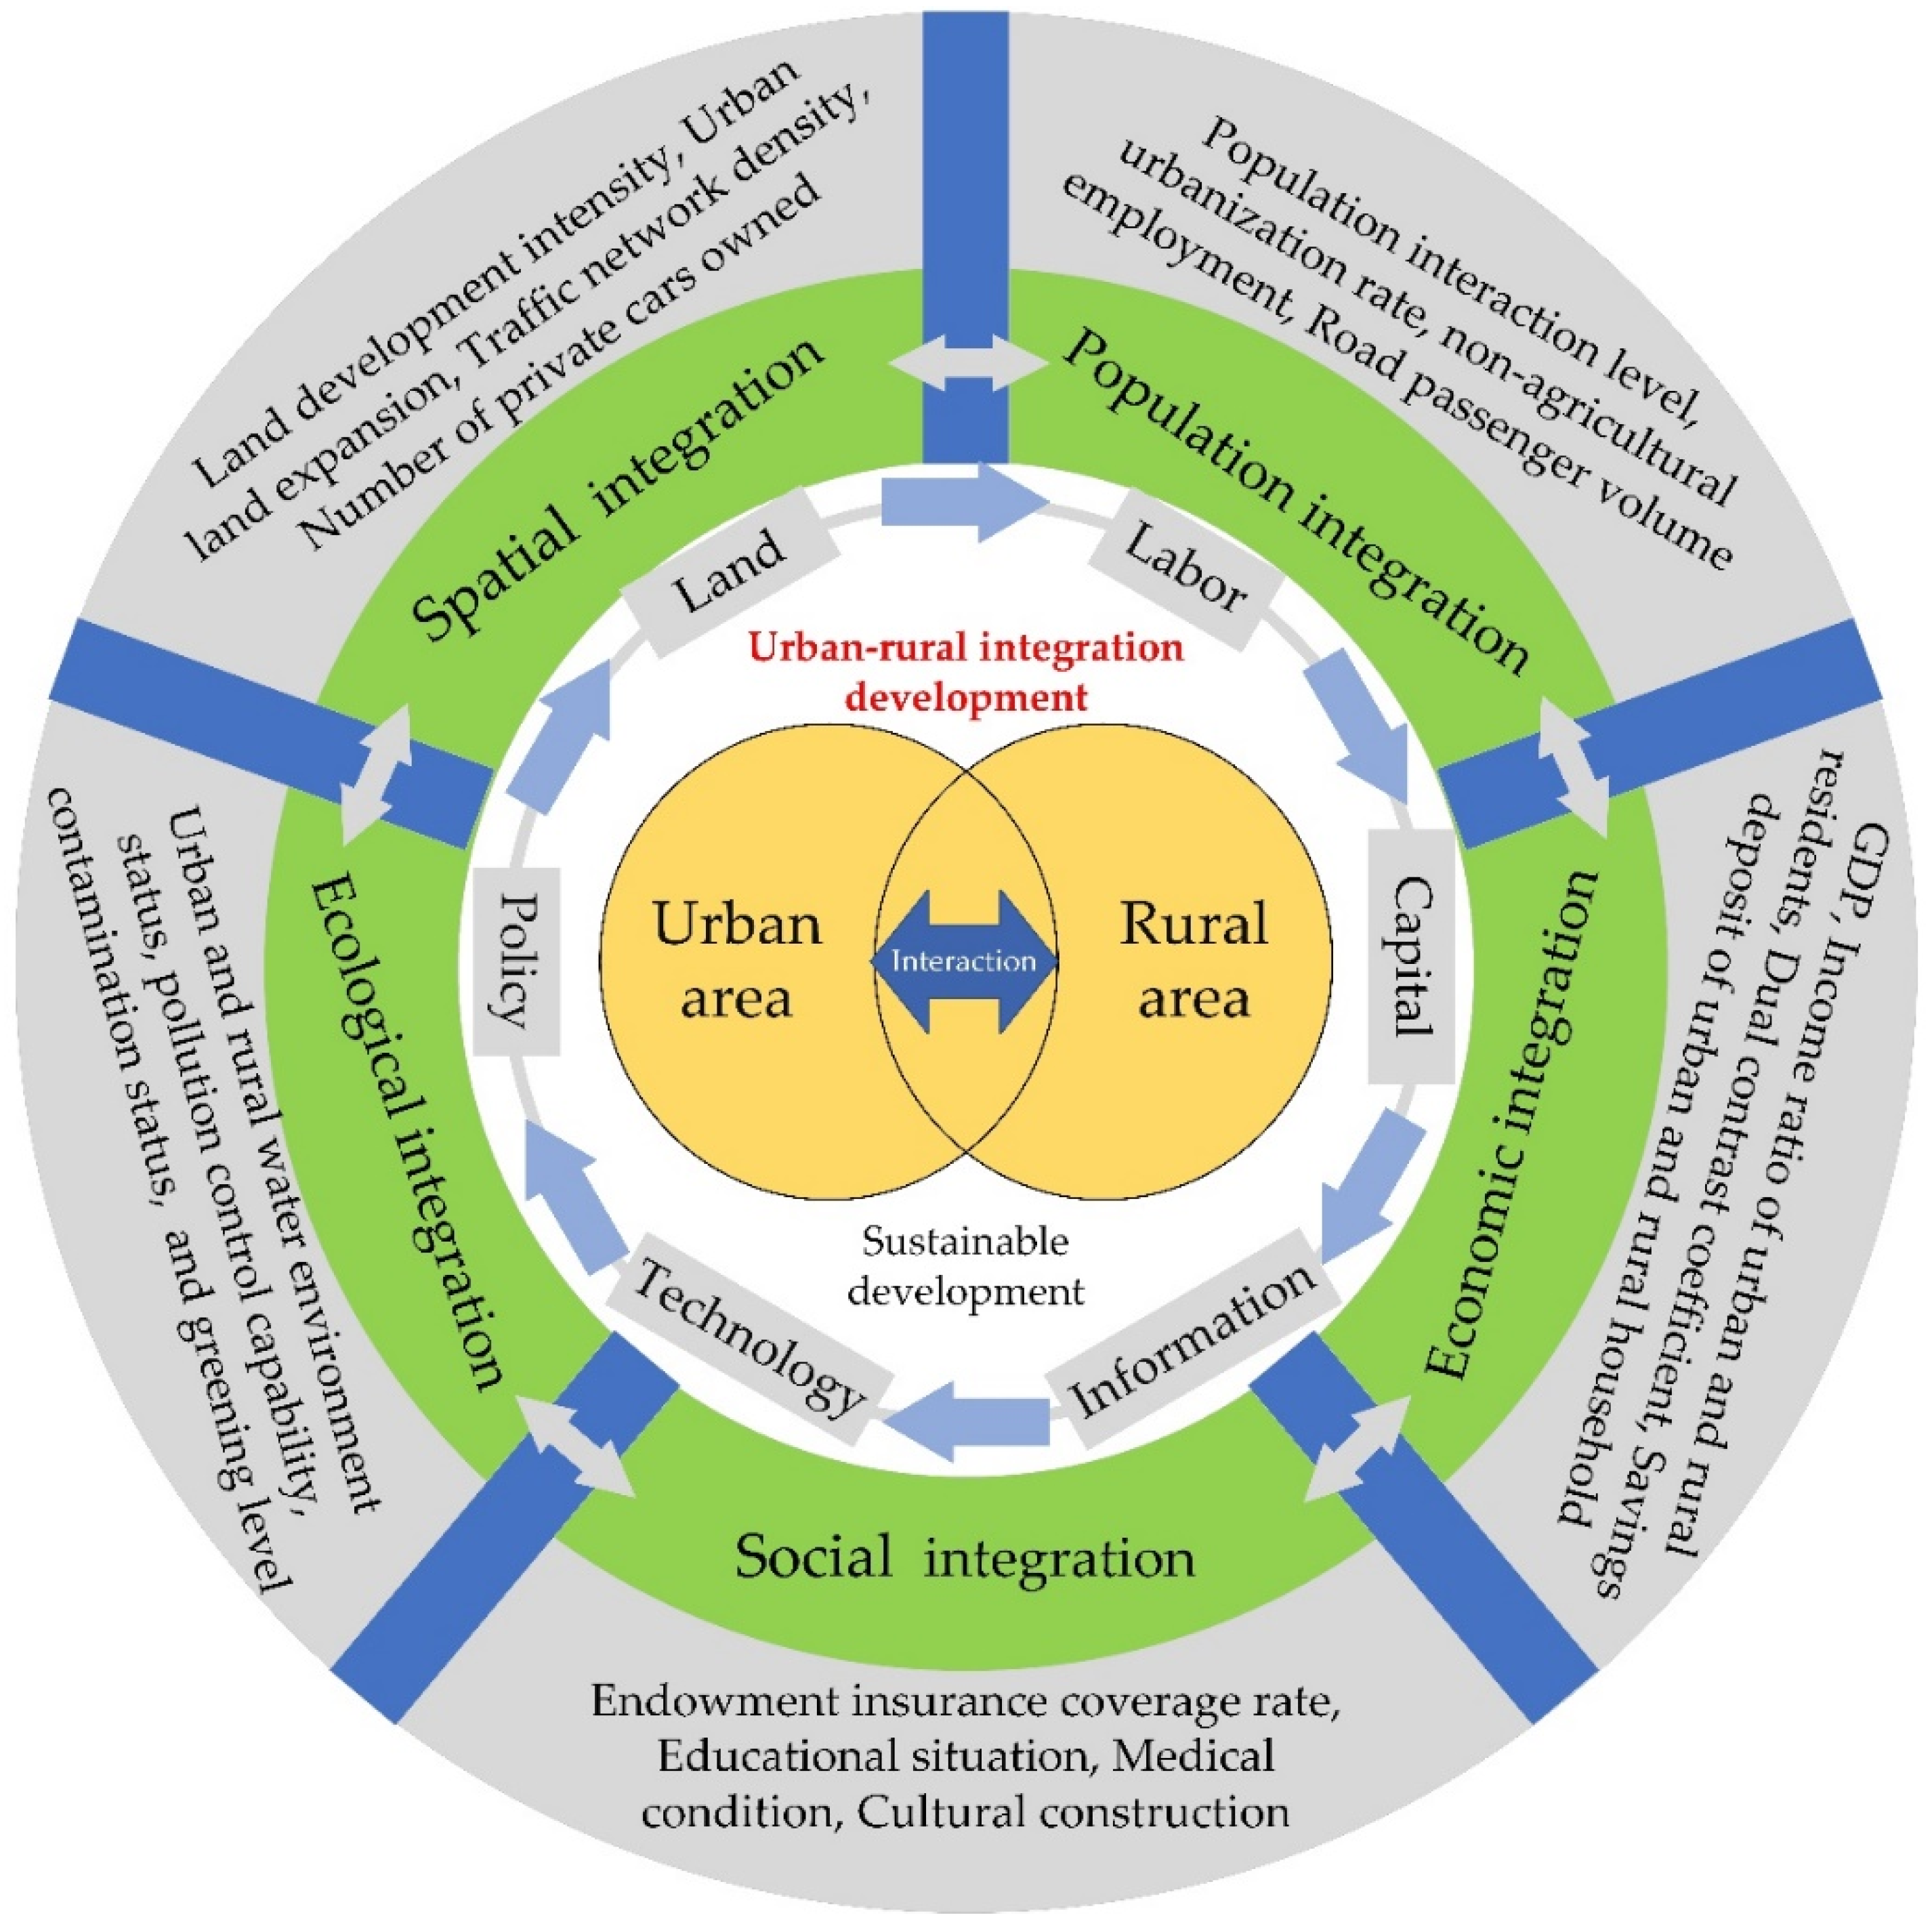
URID was intended to solve the problem of insufficient and unbalanced development during urbanization, that is, to pursue an equalized development between urban and rural areas [8]. The policies of new-type urbanization and rural revitalization in China [32] aimed to make the society more sustainable and ultimately achieve common prosperity. Therefore, the process of urban-rural integration should close the urban-rural divide in order to achieve equity, where urban and rural areas are regarded as a single area, foster the sufficient and balanced flow of the diverse resources and elements between urban and rural areas, and build an effective urban-rural connection through the integration of the economy, the society, and the ecological environment (Figure 1).
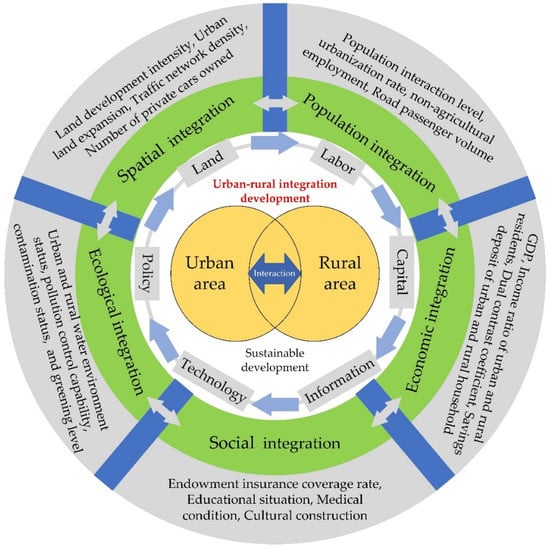
Figure 1.
The theoretical framework of URID. GDP represents the gross domestic product.
The strategy of people-centered urbanization confirmed that the target of URID was to meet the growing needs of the people for a better life [25]. Talent has been a key factor in the integrated development of urban and rural areas. Off-farm employment for rural labor has been driven by urban growth and has significantly contributed to rural development [33]. Furthermore, migrant workers impact the economic, social, and cultural conditions in the urban areas [34]. It is necessary to fully revitalize the human resources in urban and rural areas and ensure a bidirectional flow of talent for the benefit of both areas. Urban-rural integration should promote a society toward equality, rather than artificial social stratification. Therefore, the immigrant and the emigrant population, the proportion of the urban population, and the proportion of employees in the secondary and tertiary industries should be benchmarks for the population integration between urban and rural areas.
Continuously optimizing the spatial layout and pattern of urbanization and rural construction can ensure land for equal and orderly development. Research demonstrates that land-use transition plays a negative role in the URID in China from 2005 to 2016 [29]. Furthermore, as an important land-use type, roads can provide access to local and regional job markets for migrant farmers and they have a positive influence on narrowing the income gap between urban and rural areas [35] and economic development [36]. Therefore, the land development intensity, urban land expansion, traffic network density, and the number of private cars owned could be used to describe the spatial integration between urban and rural areas.
The main body of URID contains equalized social services and sufficient cooperation in economic development. Social services, such as healthcare, education, and recreational infrastructure have high heterogeneity between urban and rural areas [18,37]. The migrants from rural to urban areas have resulted in school disruptions for children [38], vulnerability to social exclusion [39], and other social issues. This has been attributed to fewer employment opportunities and the lack of public service facilities in urban fringe and rural areas, which play negative roles in quality of life [40]. Moreover, the wealth and income gaps between urban and rural areas have been significant due to the heterogeneous social services available [41], as well as the impact of income level on mental health [42]. Studies have found that building a more civilized and harmonious society is beneficial in terms of sustainable development [43]. Therefore, the endowment insurance coverage rate, educational situations, medical condition, and cultural construction could be used to describe the social integration between urban and rural areas. The GDP, the income ratio of urban and rural residents, the dual contrast coefficients, and the financial stability of urban and rural households could be selected to describe the economic integration between urban and rural areas.
Lastly, constraining development activities within the capacity of the resources and the environment is important for sustainability. Urbanization commonly has damaged the ecological environment [44]. The typical surface urban heat island, the household waste, and the non-point-source pollution from agriculture have been confirmed in the process of urban-rural transition and integration [45,46,47]. Therefore, the urban and rural water environment status, pollution control capability, contamination status, and greening level could be used to describe the ecological integration between urban and rural areas.
Overall, the URID is a long-term evolution view, which was based on the preservation of the basic characteristics of urban and rural areas and driven by new-type urbanization and rural revitalization strategies to promote the integrated development of urban and rural areas in terms of people, space, economy, society, and ecology, and ultimately achieve common prosperity [25]. Therefore, the URID represents the interaction and integration of population, space, economy, society, and ecology between urban and rural areas (Figure 1).
2.2. Hypothesis
The URID in China has been promoted during the process of rapid urbanization and industrialization, especially after their reform and opening. As for the URID level, research has demonstrated that the overall URID level in China from 2000 to 2018 exhibited a U-shaped curve, with 2006 as the inflection point that was characterized by significant spatial agglomeration [27]. Another study in China from 2005 to 2016 indicated that the URID level had improved since 2005 and was characterized by spatial agglomeration [29]. Through the above analysis, three hypotheses were proposed, as follows:
Hypothesis 1.
The URID level of the HBUA has improved from 2000 to 2020.
Hypothesis 2.
The year 2005 may be the inflection point of the URID evolution of the HBUA.
Hypothesis 3.
The URID level in the HBUA has been characterized by significant spatial agglomeration.
The URID should be driven by environmental conditions and socio-economic factors. In the Pearl River Delta Region, traffic location was the most significant factor in the urban-rural spatial transformation process [48]. Land-use transition had a negative impact on URID in China [29]. Other research revealed that policies and institutional structures, economic growth, and urbanization were the driving factors [8]. In the five-dimension framework (Figure 1), the URID was influenced by various factors. Through the above analysis, another hypothesis was proposed.
Hypothesis 4.
The driving factor of the URID evolution in the HBUA was different at different stages of development.
3. Materials and Methods
3.1. Study Area
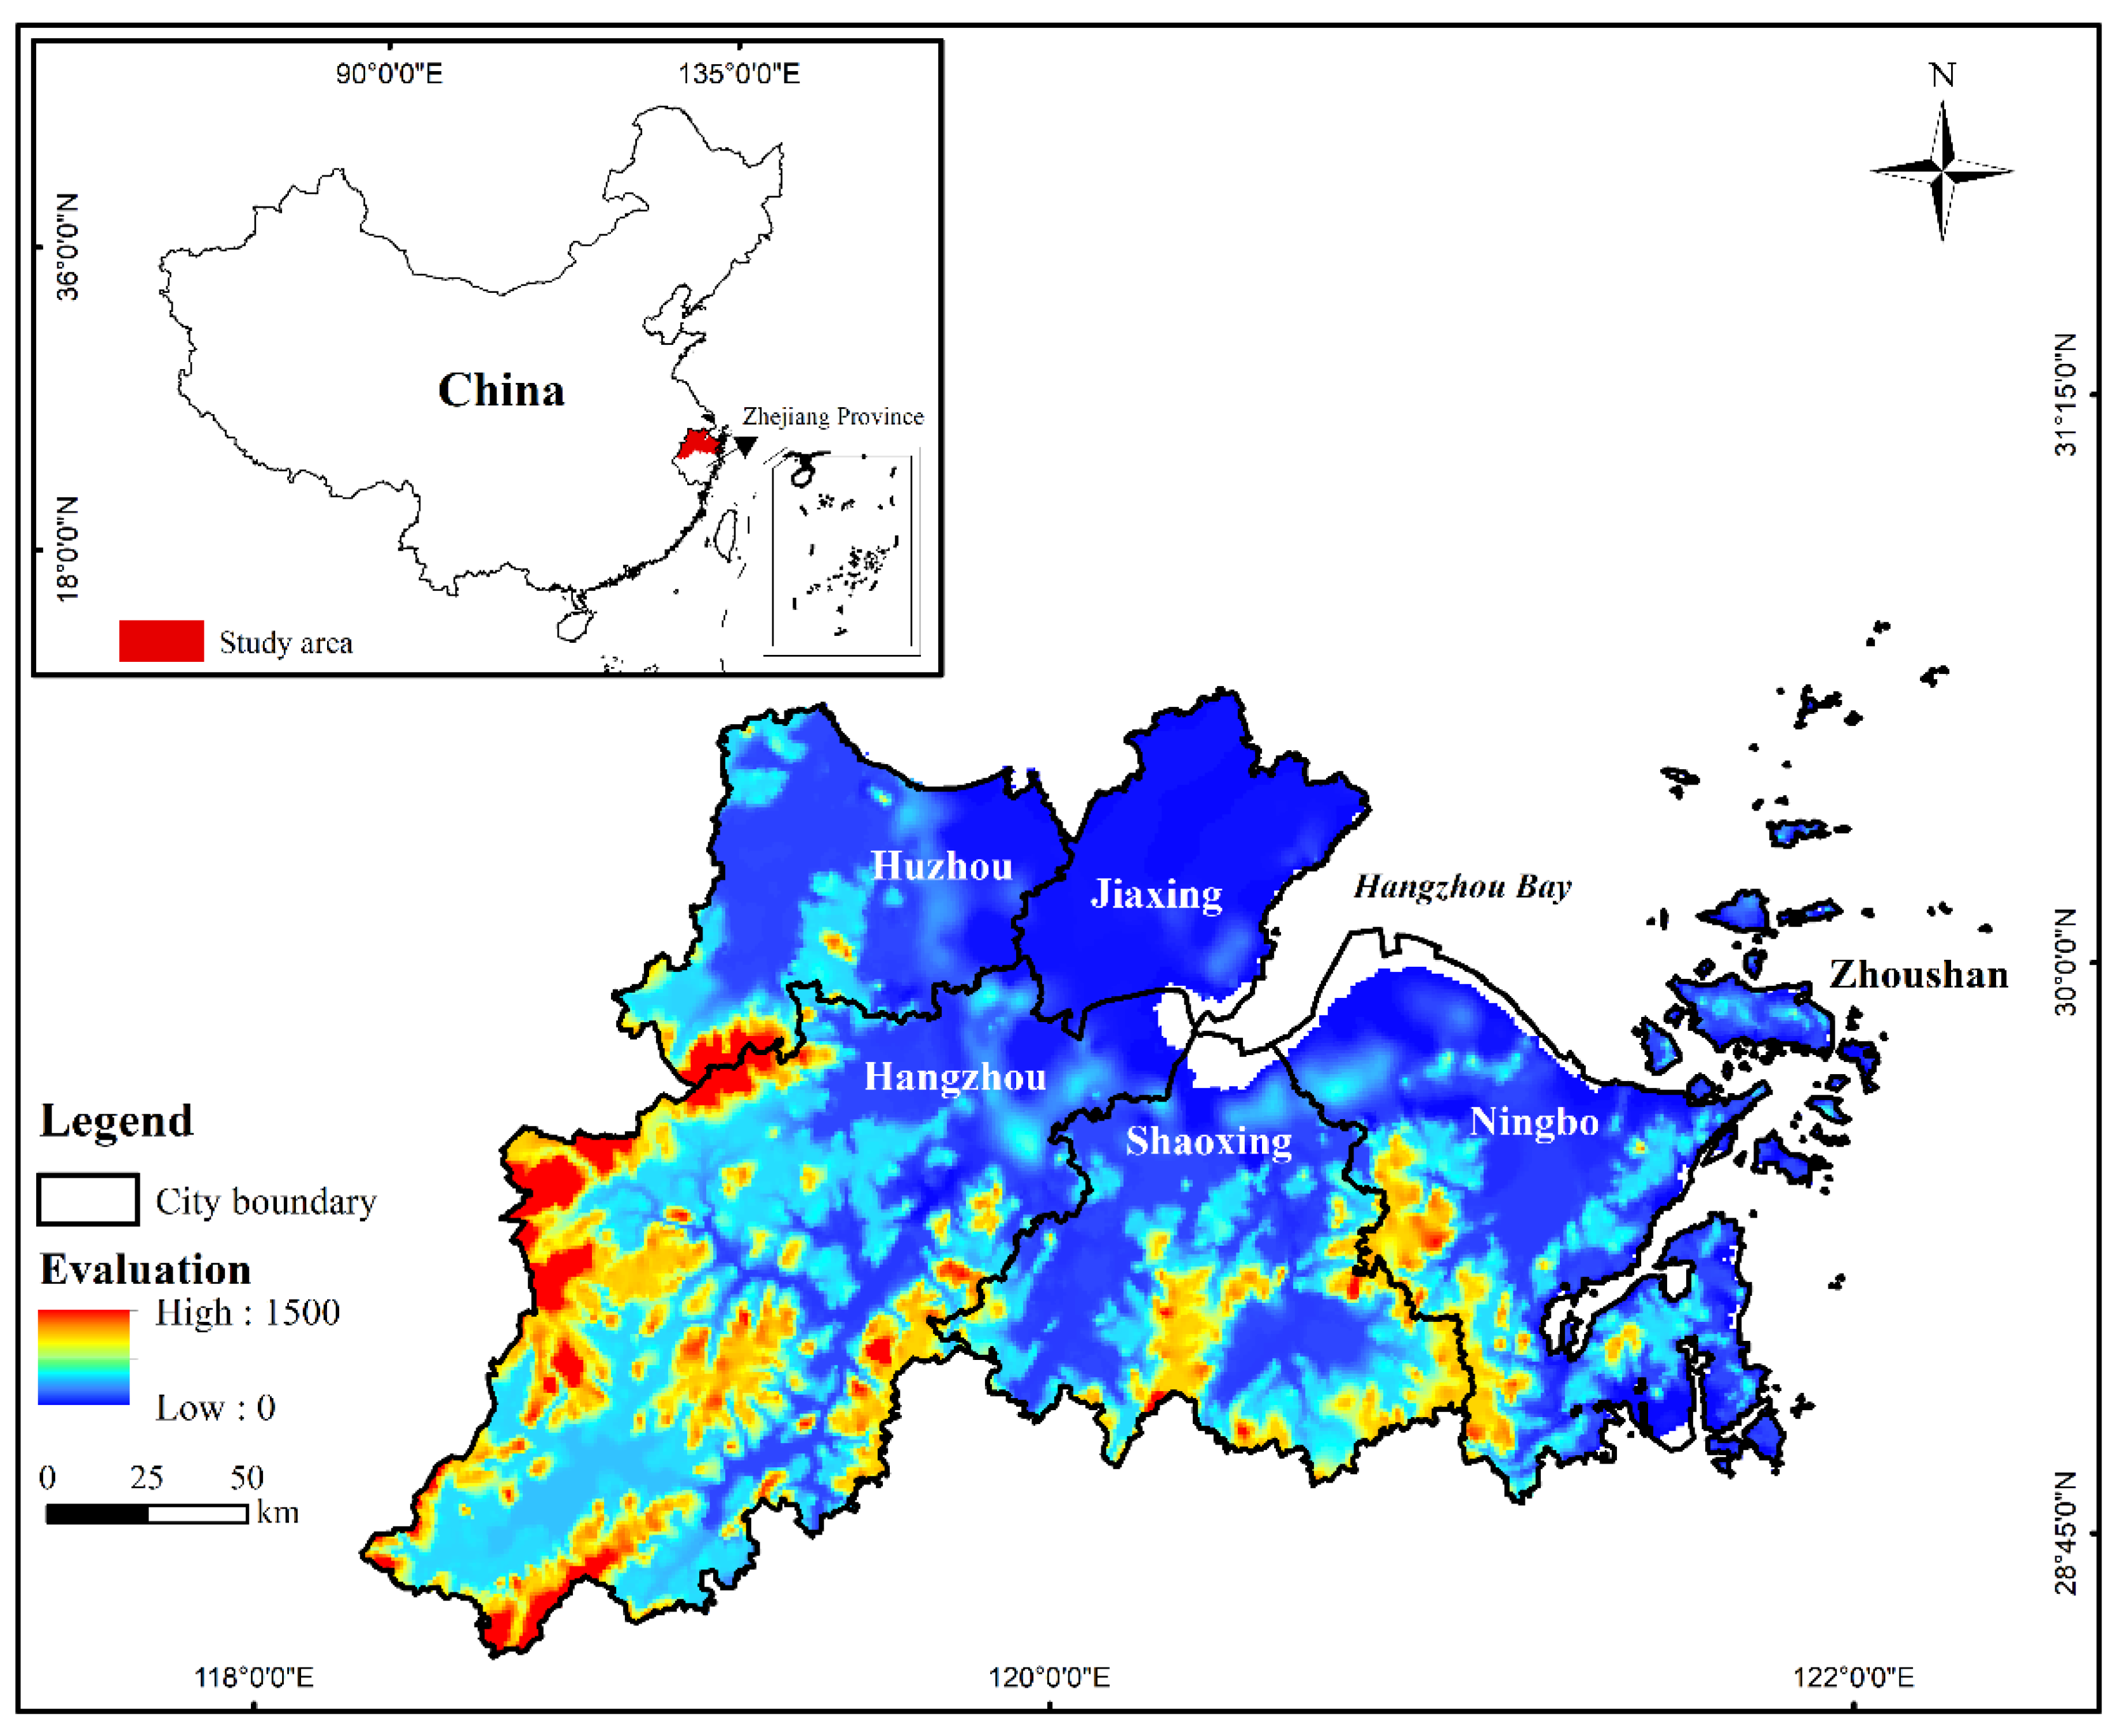
The study area, the Hangzhou Bay urban agglomeration (HBUA), is located in Zhejiang Province (Figure 2) and includes six megacities (Hangzhou, Huzhou, Jiaxing, Ningbo, Shaoxing, and Zhoushan), two (Jiaxing and Huzhou) of which are the national pilot zones for urban-rural integrated development in China [49]. The HBUA has a total population of approximately 36.6 million, a total GDP of CYN 4473.9 billion, and an area of 46,447 km2 as of 2020 [50]. Hangzhou and Ningbo have a total GDP of more than CYN 1 trillion in 2020. The Outline of the 14th Five-Year Plan (2021–2025) for the National Economic and Social Development and Vision 2035 of the Zhejiang Province [51] was released in 2021 and promoted the construction of Hangzhou Bay as a large, modernized bay and the integrated development of urban and rural areas in Zhejiang Province. The plans for Hangzhou Bay aimed to strengthen its core, leading position of economic development in Zhejiang Province [52], such as “The Industrial Zone Development Plan of HBUA” (released in 2003) [53], “Strategic Planning for Spatial Development of HBUA (2004–2020)” (released in 2003) [54], and “Development Plan for High-tech Industrial Belt around HBUA” (released in 2020) [55], which made the HBUA a typical area to explore the spatiotemporal pattern of urban-rural integration development and its driving mechanisms.

Figure 2.
The location of the study area.
3.2. Data Collection and Processing
Land-use data from 2000 to 2020 was acquired from the Resource and Environment Science and Data Center (https://www.resdc.cn/ (accessed on 4 July 2022). Socio-economic data from 2000 to 2020 were extracted from the statistical yearbook of the six cities (Hangzhou, Huzhou, Jiaxing, Ningbo, Shaoxing, and Zhoushan) and Zhejiang Province [50,56,57,58,59].
3.3. Methodology
3.3.1. Measurement of the Urban-rural Integration Development
The indicator system for measuring the level of URID was constructed based on the theoretical analysis in Section 2 and the related research [27,28,60,61], including five first-level indicators such as population integration, economic integration, social integration, spatial integration, ecological integration, and 20 second-level indicators (Table 1). The data source was at the city level, and the study periods included 2000, 2005, 2010, 2015, and 2020; so, the total number of each variable sample was 30.

Table 1.
The measurement indicator system of URID and the summary statistics of variables.
The urban–rural integration development index (URIDI) was built by using the entropy weight method [62] and Equation (3) after the standardization of indicators to quantitatively analyze the level of URID of the HBUA in 2005, 2010, 2015, and 2020.
The standardization of indicators is as follows:
where Ri is the standardized value of indicator i, Xi is the actual value of indicator i in Table 1 (i = 1~20), Xmax is the maximum value of indicator i, and Xmin is the minimum value of the indicator i.
The calculation of the URIDI is as follows:
where wi is the weight of indicator i.
3.3.2. Hotspot Analysis
Based on the ArcGIS 10.5 software platform, a 5 km × 5 km grid was created, and a total of 1681 grid points were obtained to extract the URIDI values. Hotspot analysis (Getis-Ord Gi*) was applied to explore the spatial pattern of the URIDI values of the HBUA in 2000, 2005, 2010, 2015 and 2020. The equation of Gi* is given as [63]:
where Gi* is a z-score, xj is the attribute value of feature j, wi,j is the spatial weight between feature i and feature j, n is the total number of features, and s is the standard deviation.
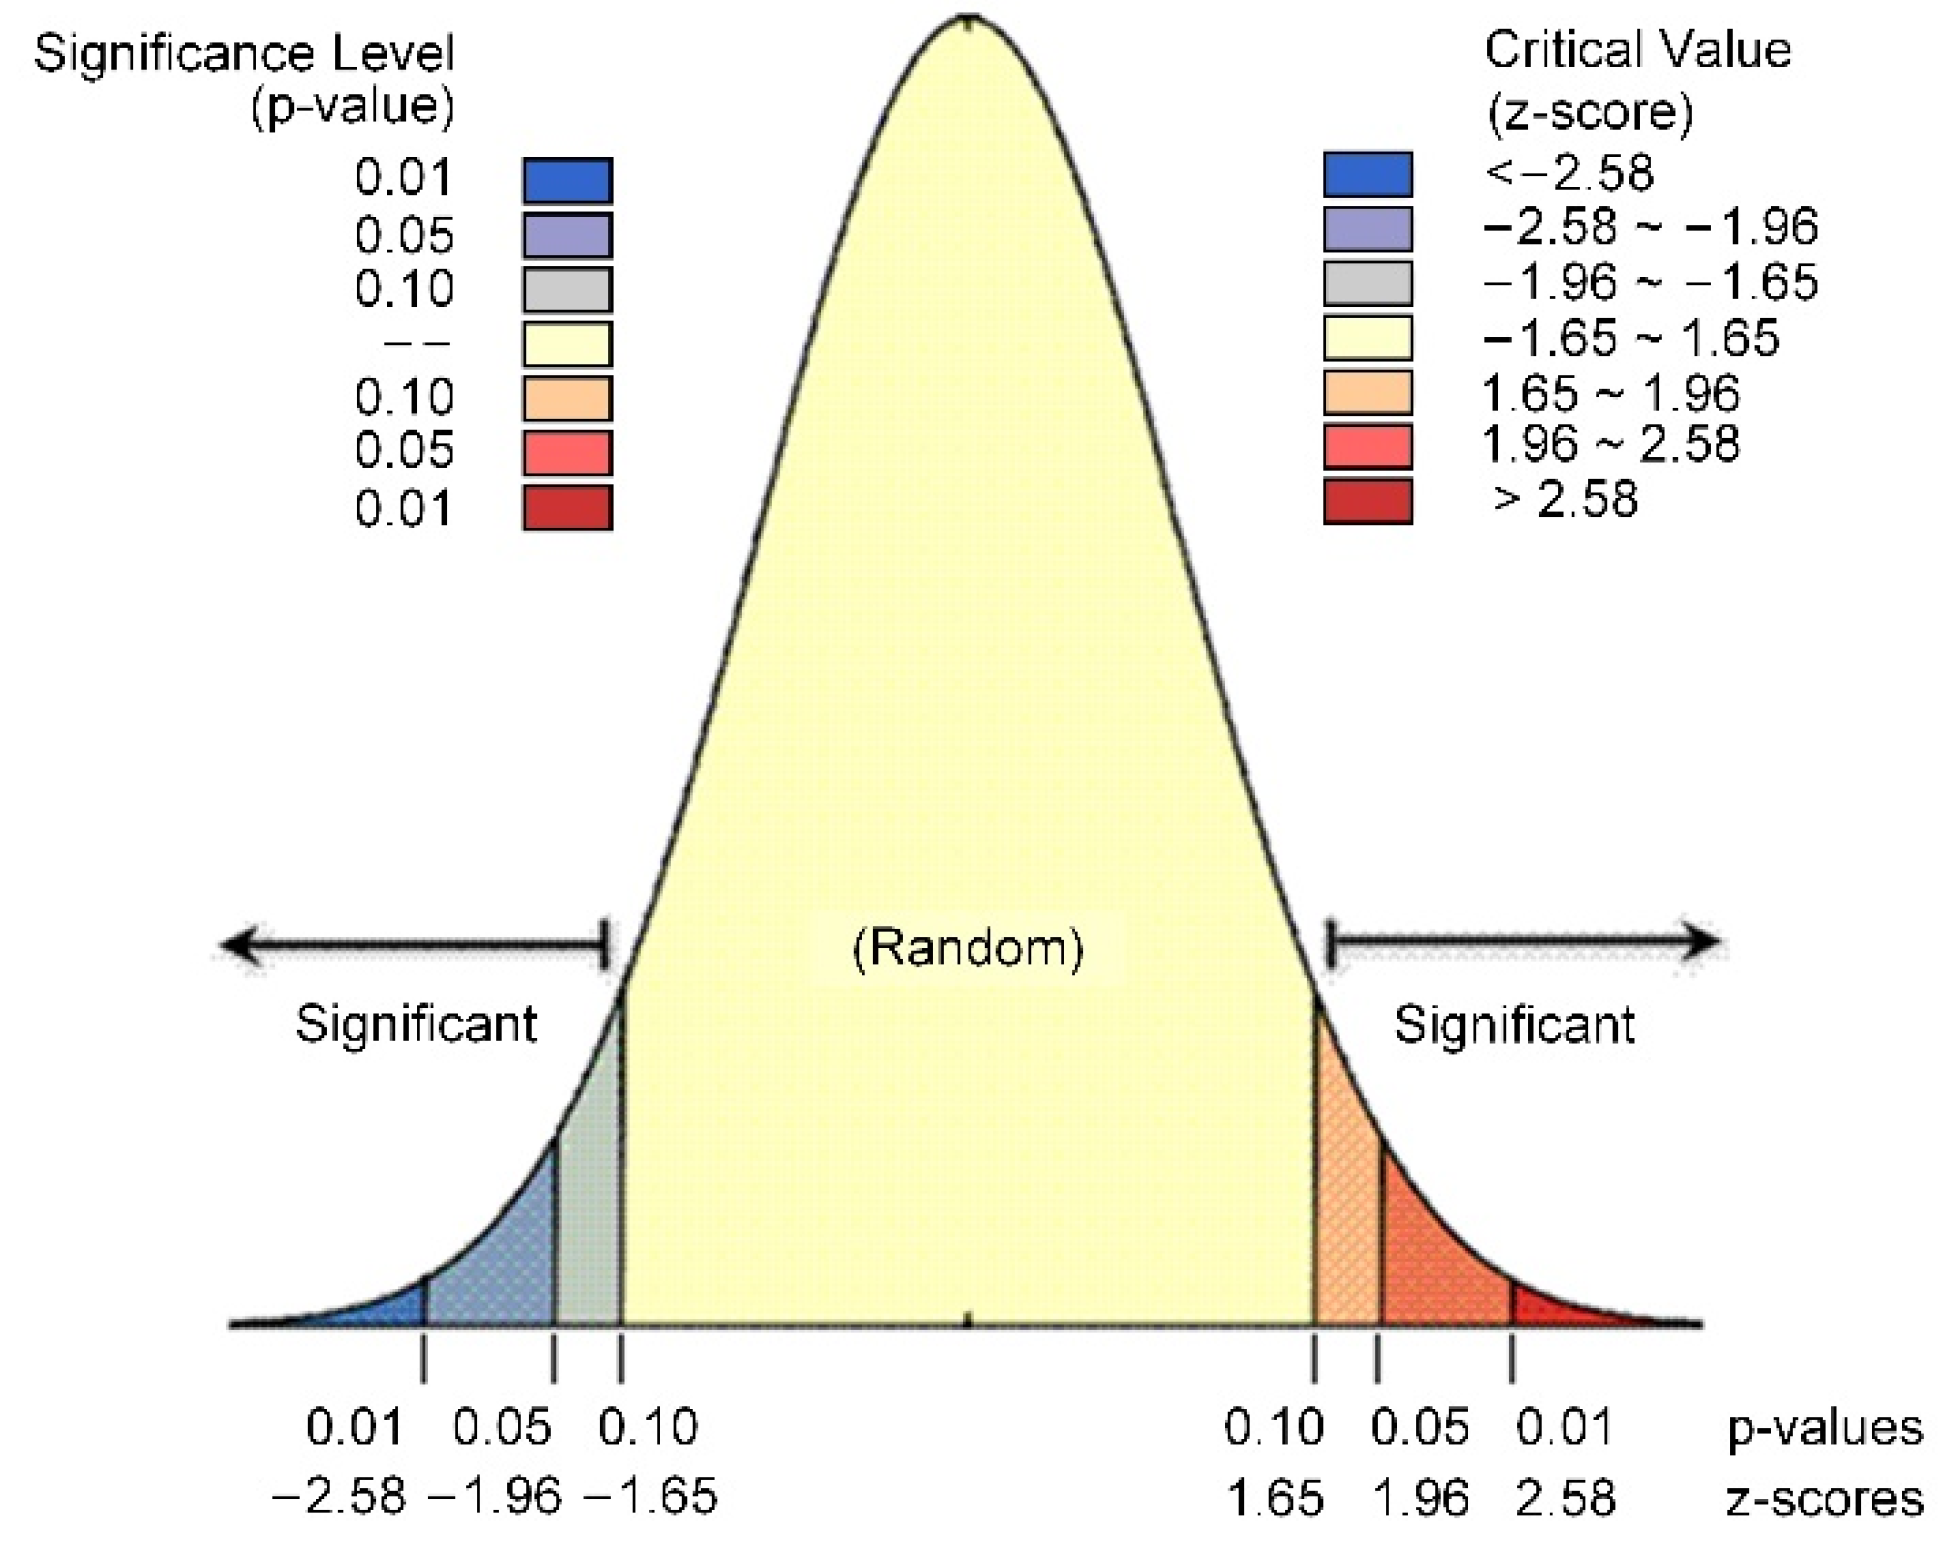
Table 2.
The critical p-values and z-scores for different confidence levels.
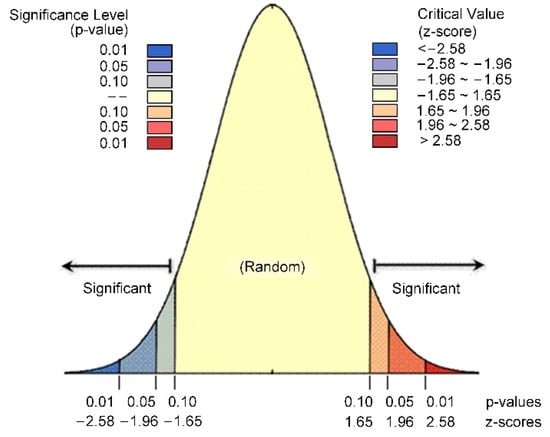
Figure 3.
The result of statistical significance testing for Gi*.
3.3.3. Geographical Detector Model
The geographical detector model is a statistical tool to measure regional spatial stratified heterogeneity that was built by Jinfeng Wang et al. [64] and further applied in many kinds of research [65,66,67,68,69]. The geographical detector model includes a factor detector, interaction detector, risk detector, and ecological detector.
The factor detector contains the detection of spatial differentiation of Y; the detection of variable X explains the spatial differentiation of Y. The result of the factor detector revealed the relative importance of explanatory variables with a Q-statistic [64,70,71].
where h is the strata of Y (i.e., URIDI) or variables X, h = 1, …, L. Nh and N represent the number of units in the strata h and the whole study area, respectively. The and are the variance of Y (i.e., URIDI) in the strata h and the whole study area, respectively. SSW and SST are within the sum of squares and the total sum of squares, respectively. The Q value, which is between 0 and 1, indicates that X explains 100 × Q% of Y. If the Q value of variable X is 1, then X completely controls the spatial distribution of Y; if the Q value is 0, then X has no relationship with Y.
The interaction detector determines the interactive impacts of two overlapped spatial variables based on the relative importance of interactions computed with Q values of the factor detector [64,70,71]. The types of the interaction detector are shown in Table 3.
Table 3.
Types of interaction between two variables.
The ecological detector is used to compare whether the influence of two explanatory variables, X1 and X2, on the spatial distribution of Y (i.e., URIDI) is significantly different, which is measured by F statistic [64,70,71].
where NX1 and NX2 represent the number of samples of variables X1 and X2, respectively. SSWX1 and SSWX2 are within the sum of the squares of the variables X1 and X2, respectively. L1 and L2 are the number of strata of X1 and X2, respectively.
The package GD in R (version 4.1.2, R Development Core Team) was applied to implement the geographical detector model and draw the figures [71].
4. Results
4.1. Characteristics of Urbanization Based on Land-Use Change
The characteristics of land-use change and the area ratio of each land-use type at the city-level scale in the HBUA from 2000 to 2020 are depicted in Figure 4 and Figure 5, respectively, showing the characteristics of the continuous encroachment of cultivated land by construction land. Specifically, the area of cultivated land decreased from 40.774% in 2000 to 30.844% in 2020, while the area of construction land increased from 8.081% in 2000 to 18.092% in 2020. The other land-use types, such as woodland, water area, grassland, and unused land, were relatively stable, and their area proportions remained at 38.2%, 11.3%, 1.4%, and 0.1%, respectively.
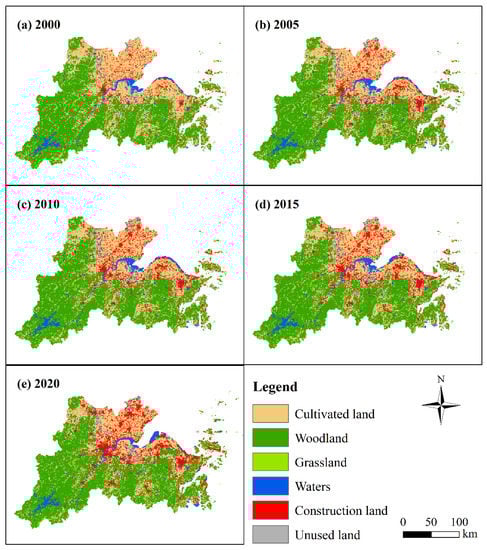
Figure 4.
Characteristics of land-use change in HBUA from 2000 to 2020.
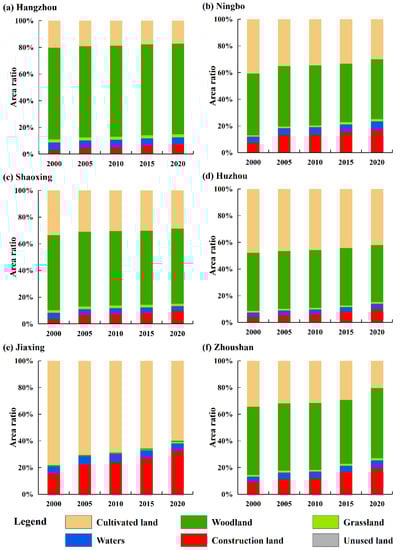
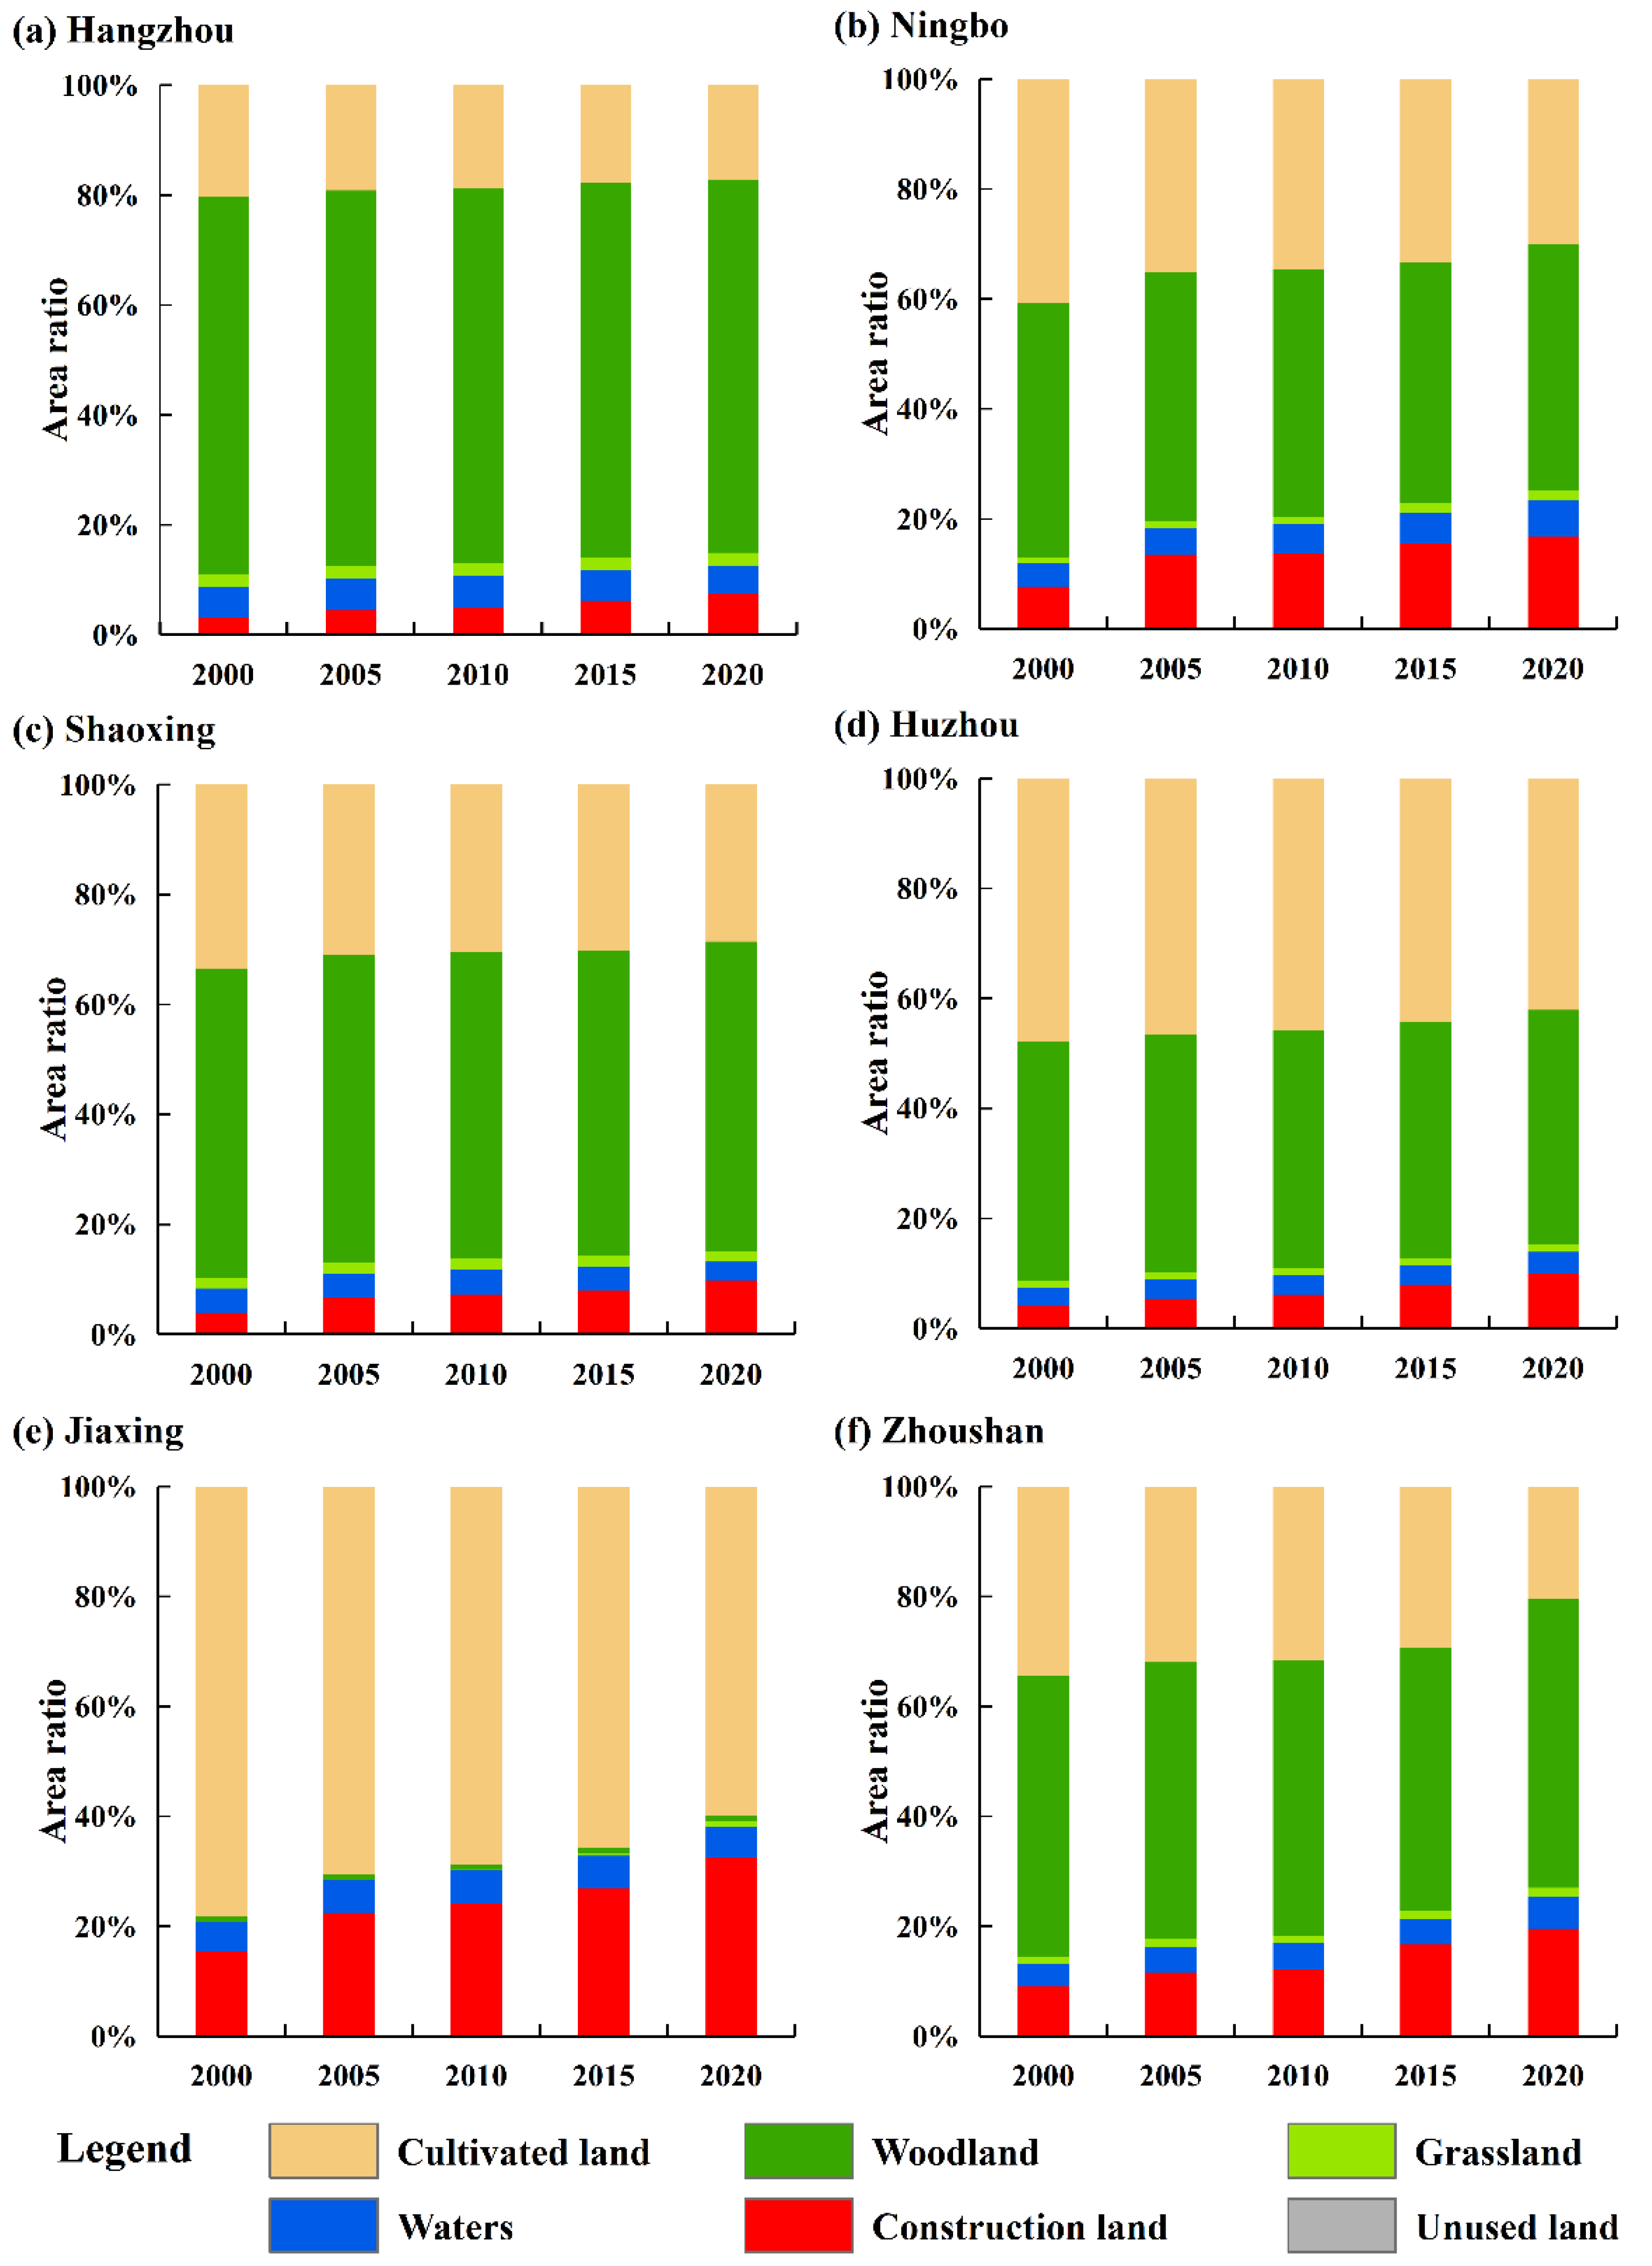
Figure 5.
Area proportion of different land-use types in HBUA from 2000 to 2020.
At a city-level scale, the main land-use type in Hangzhou was woodland, and its area proportion remained at approximately 68% from 2000 to 2020. The area proportion of cultivated land decreased from 20.368% in 2000 to 17.192% in 2020, and the area of construction land increased from 3.177% in 2000 to 7.448% in 2020 (Figure 5a). The main land-use type in Ningbo was woodland, and its area proportion remained at about 45% from 2000 to 2020. The area ratio of cultivated land decreased from 40.773% in 2000 to 29.955% in 2020, and the area of construction land rose from 7.719% in 2000 to 16.683% in 2020 (Figure 5b). The main land-use type in Shaoxing was woodland, and its area proportion remained at about 56% from 2000 to 2020. The area proportion of cultivated land decreased from 33.410% in 2000 to 28.573% in 2020, and the area ratio of construction land increased from 3.873% in 2000 to 9.852% in 2020 (Figure 5c). The land-use type in Huzhou was dominated by cultivated land and forest land. The area proportion of forest land remained at approximately 43%, and the proportion of cultivated land area decreased from 47.786% in 2000 to 42.103% in 2020. The area of construction land increased from 4.119% in 2000 to 10% in 2020 (Figure 5d). Cultivated land was the main land-use type in Jiaxing, and its area proportion decreased from 78.252% in 2000 to 59.902% in 2020. The proportion of construction land in Jiaxing increased from 15.513% in 2000 to 32.479% in 2020, and the proportion of woodland was approximately 1%. The main land-use type in Zhoushan was woodland, and its area ratio fluctuated from 47.993% (2015) to 52.513% (2020). The proportion of cultivated land decreased from 34.390% in 2000 to 20.436% in 2020, and the proportion of construction land increased from 9.040% in 2000 to 19.514% in 2020.
4.2. Temporal Characteristics of Urban-rural Integration Development Level
The overall URID level of the HBUA showed a growing trend from 2000 to 2020 (Figure 6a), increasing from 0.294 in 2000 to 0.563 in 2020. There was a significant difference among 2000, 2010, and 2015 (p < 0.05); there was no significant difference between 2015 and 2020 (p > 0.05). From the perspective of the city-level area (Figure 6b), Hangzhou’s URIDI value increased from 0.280 in 2000 to 0.621 in 2020, with an increase of 121.98%. The URIDI value of Huzhou increased from 0.264 in 2000 to 0.522 in 2020, with an increase of 97.81%. The URIDI value of Jiaxing increased from 0.277 in 2000 to 0.584 in 2020, with an increase of 110.71%. Ningbo’s URIDI value increased from 0.311 in 2000 to 0.576 in 2020, with an increase of 85.11%. The URIDI value of Shaoxing increased from 0.263 in 2000 to 0.511 in 2020, with an increase of 94.13%. Zhoushan’s URIDI value increased from 0.372 in 2000 to 0.562 in 2020, with an increase of 51.26%. Among the URIDI values of these six cities, Hangzhou has ranked first since 2010.
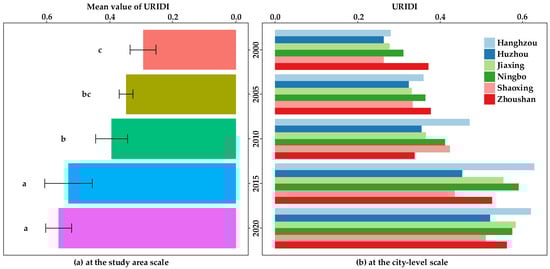
Figure 6.
Temporal characteristics of URID level at study-area scale (a) and city-level scale (b). In (a), the same lowercase letter indicates that the URIDI has no significant difference between different years (p > 0.05) and different lowercase letters indicate that the URIDI has a significant difference between different years (p < 0.05). The error bars represent the standard deviation.
4.3. Spatial Pattern of Urban-Rural Integration Development Level
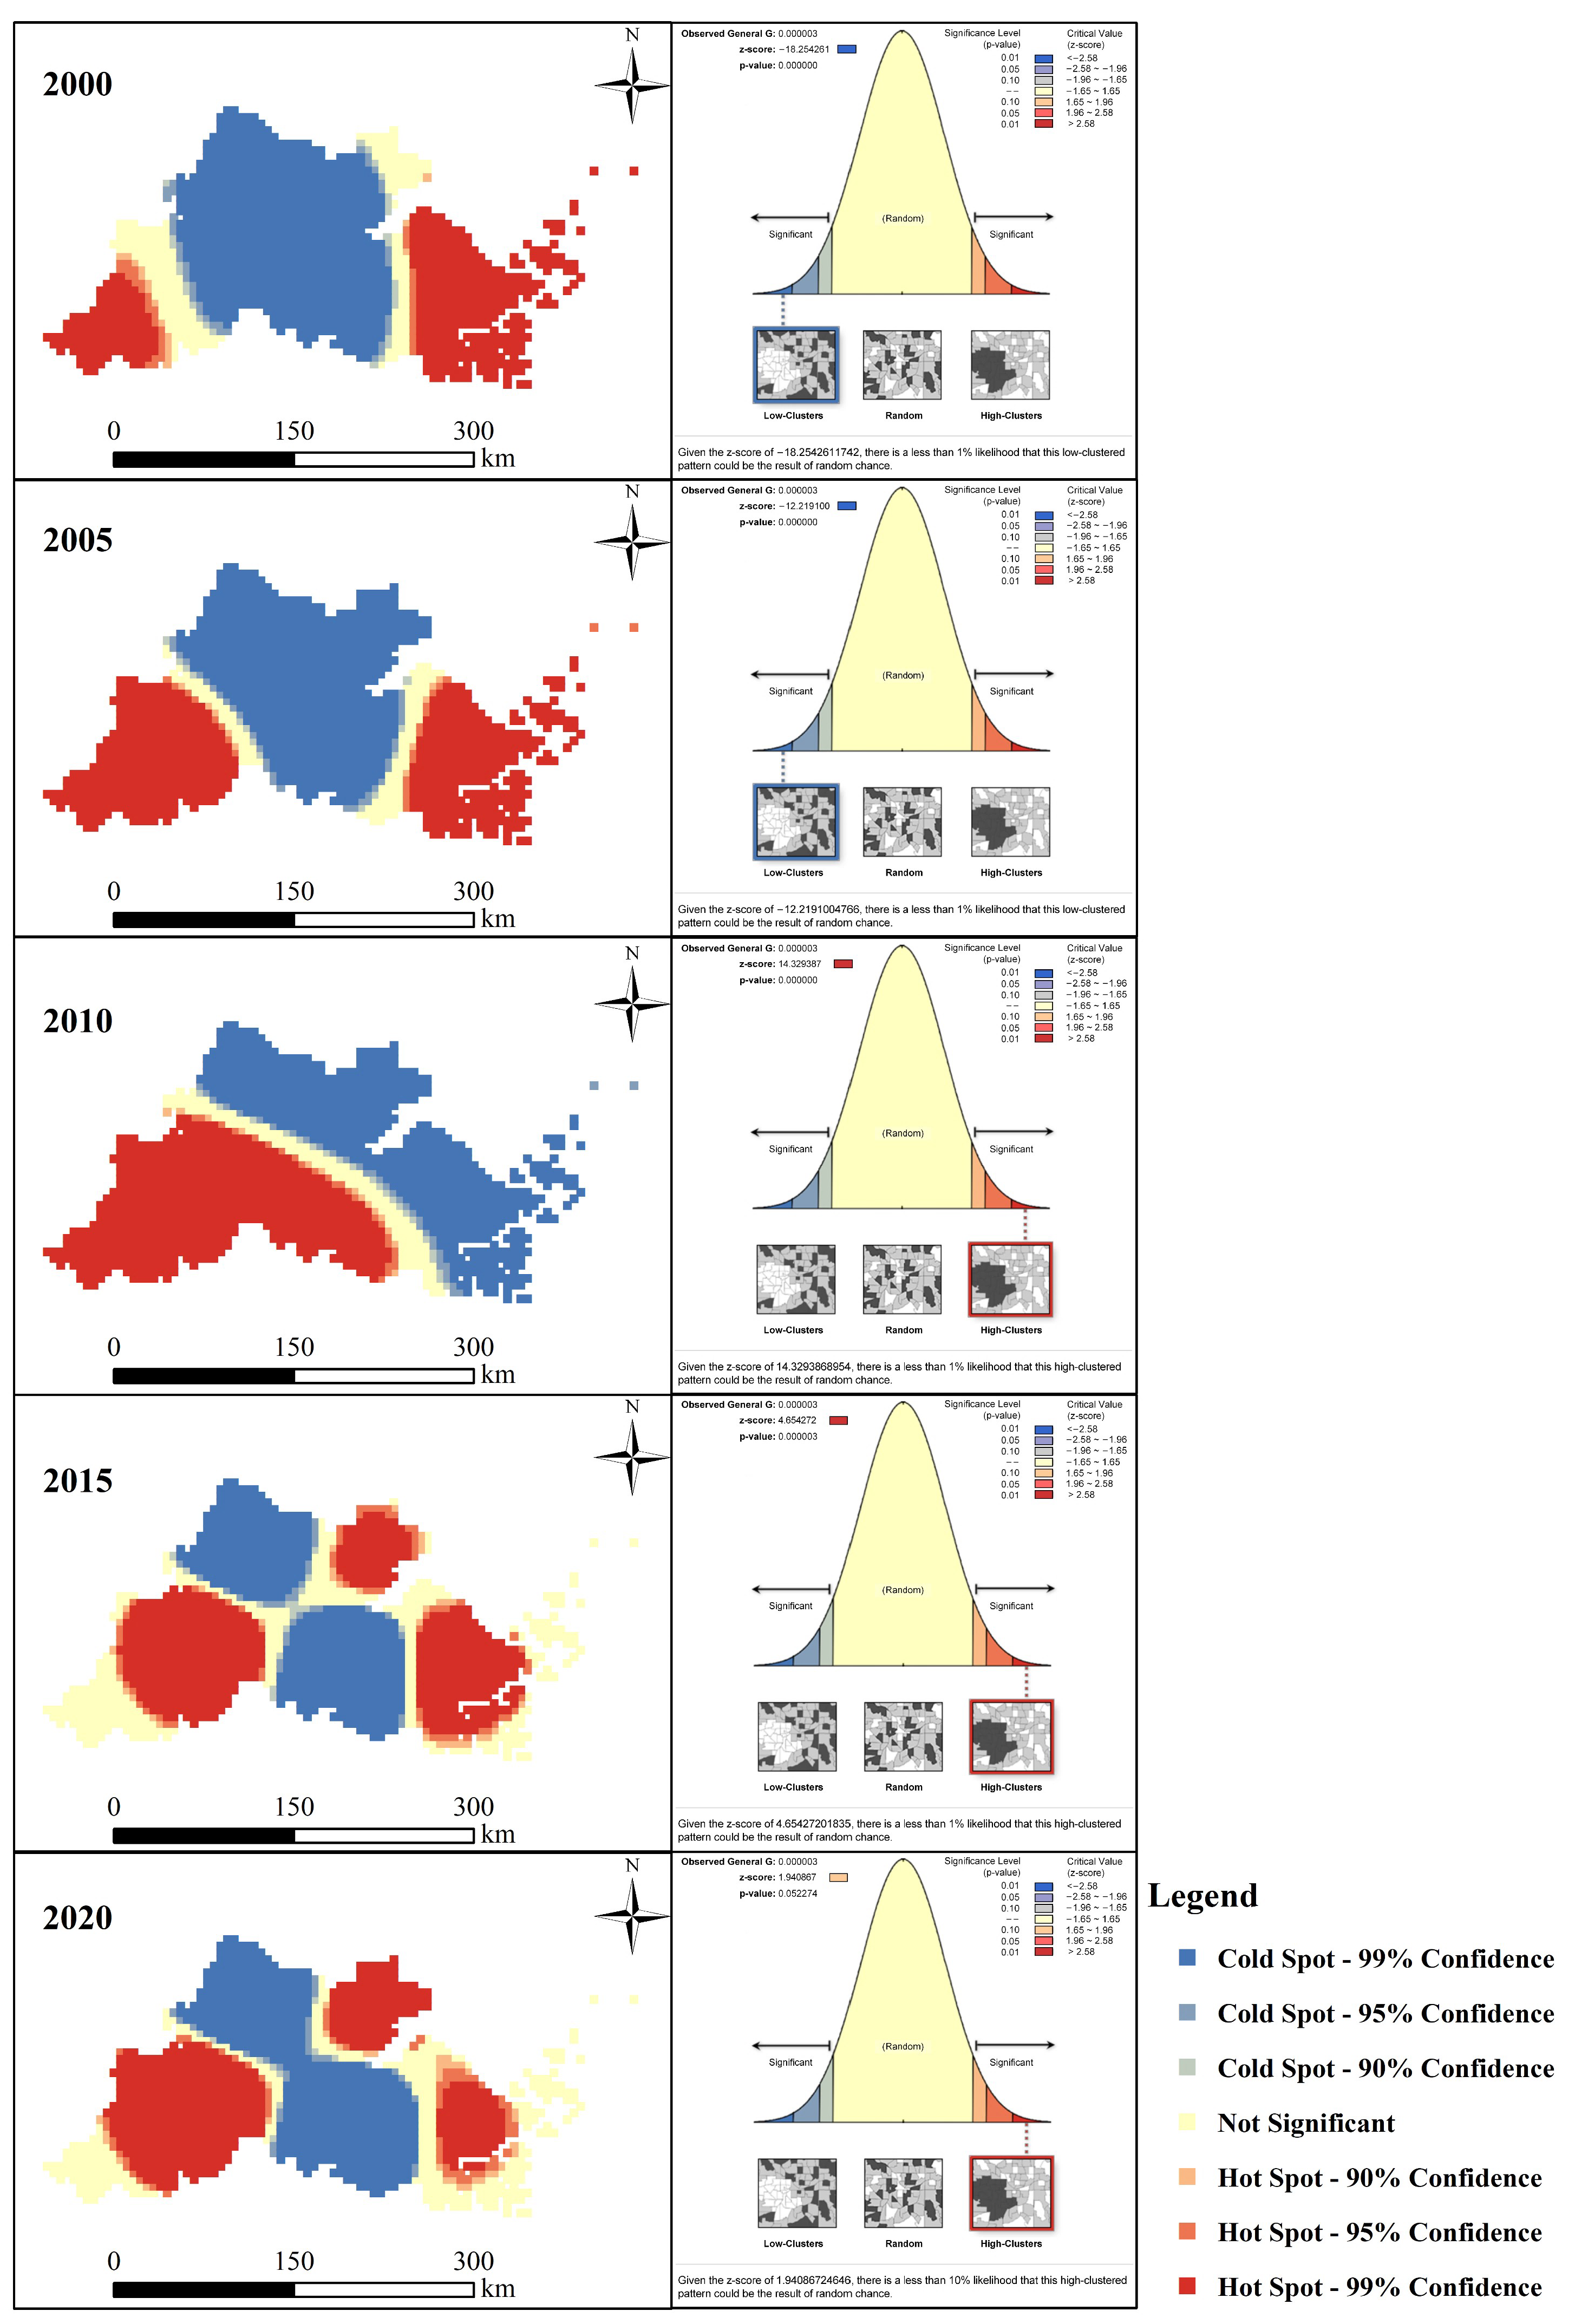
The results of the spatial pattern characteristics of the urban-rural integration development level of the HBUA in 2000, 2005, 2010, 2015, and 2020 are shown in Figure 7. The URID level of the HBUA showed an obvious spatial aggregation. The URID level in 2000 and 2005 showed the characteristics of significant low-value clustering (p < 0.01). Low values were concentrated in Huzhou, Shaoxing, and Jiaxing. The URID level in 2010 (p < 0.01), 2015 (p < 0.01), and 2020 (p < 0.1) showed the characteristics of significant high-value clustering. Among them, in 2010, it showed the characteristics of “low-value aggregation in the northeast and high-value aggregation in the southwest”, which mainly showed that the high value was concentrated in Hangzhou and Shaoxing and the low value was concentrated in Jiaxing, Zhoushan, Huzhou, and Ningbo. In 2015 and 2020, the low-value agglomeration areas were Shaoxing and Huzhou and the high-value agglomeration areas were Hangzhou, Jiaxing, and Ningbo.
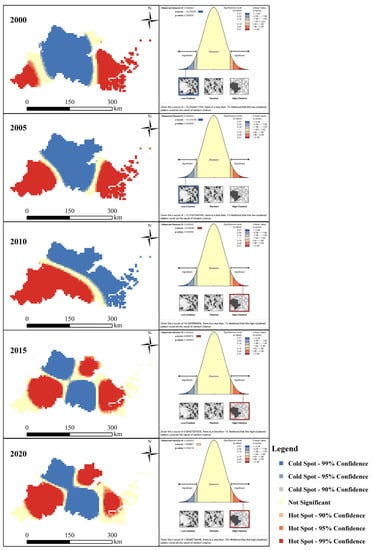
Figure 7.
Spatial pattern characteristics of URID in HBUA from 2000 to 2020.
4.4. Driving Mechanism of Urban-Rural Integration Development-Level Change
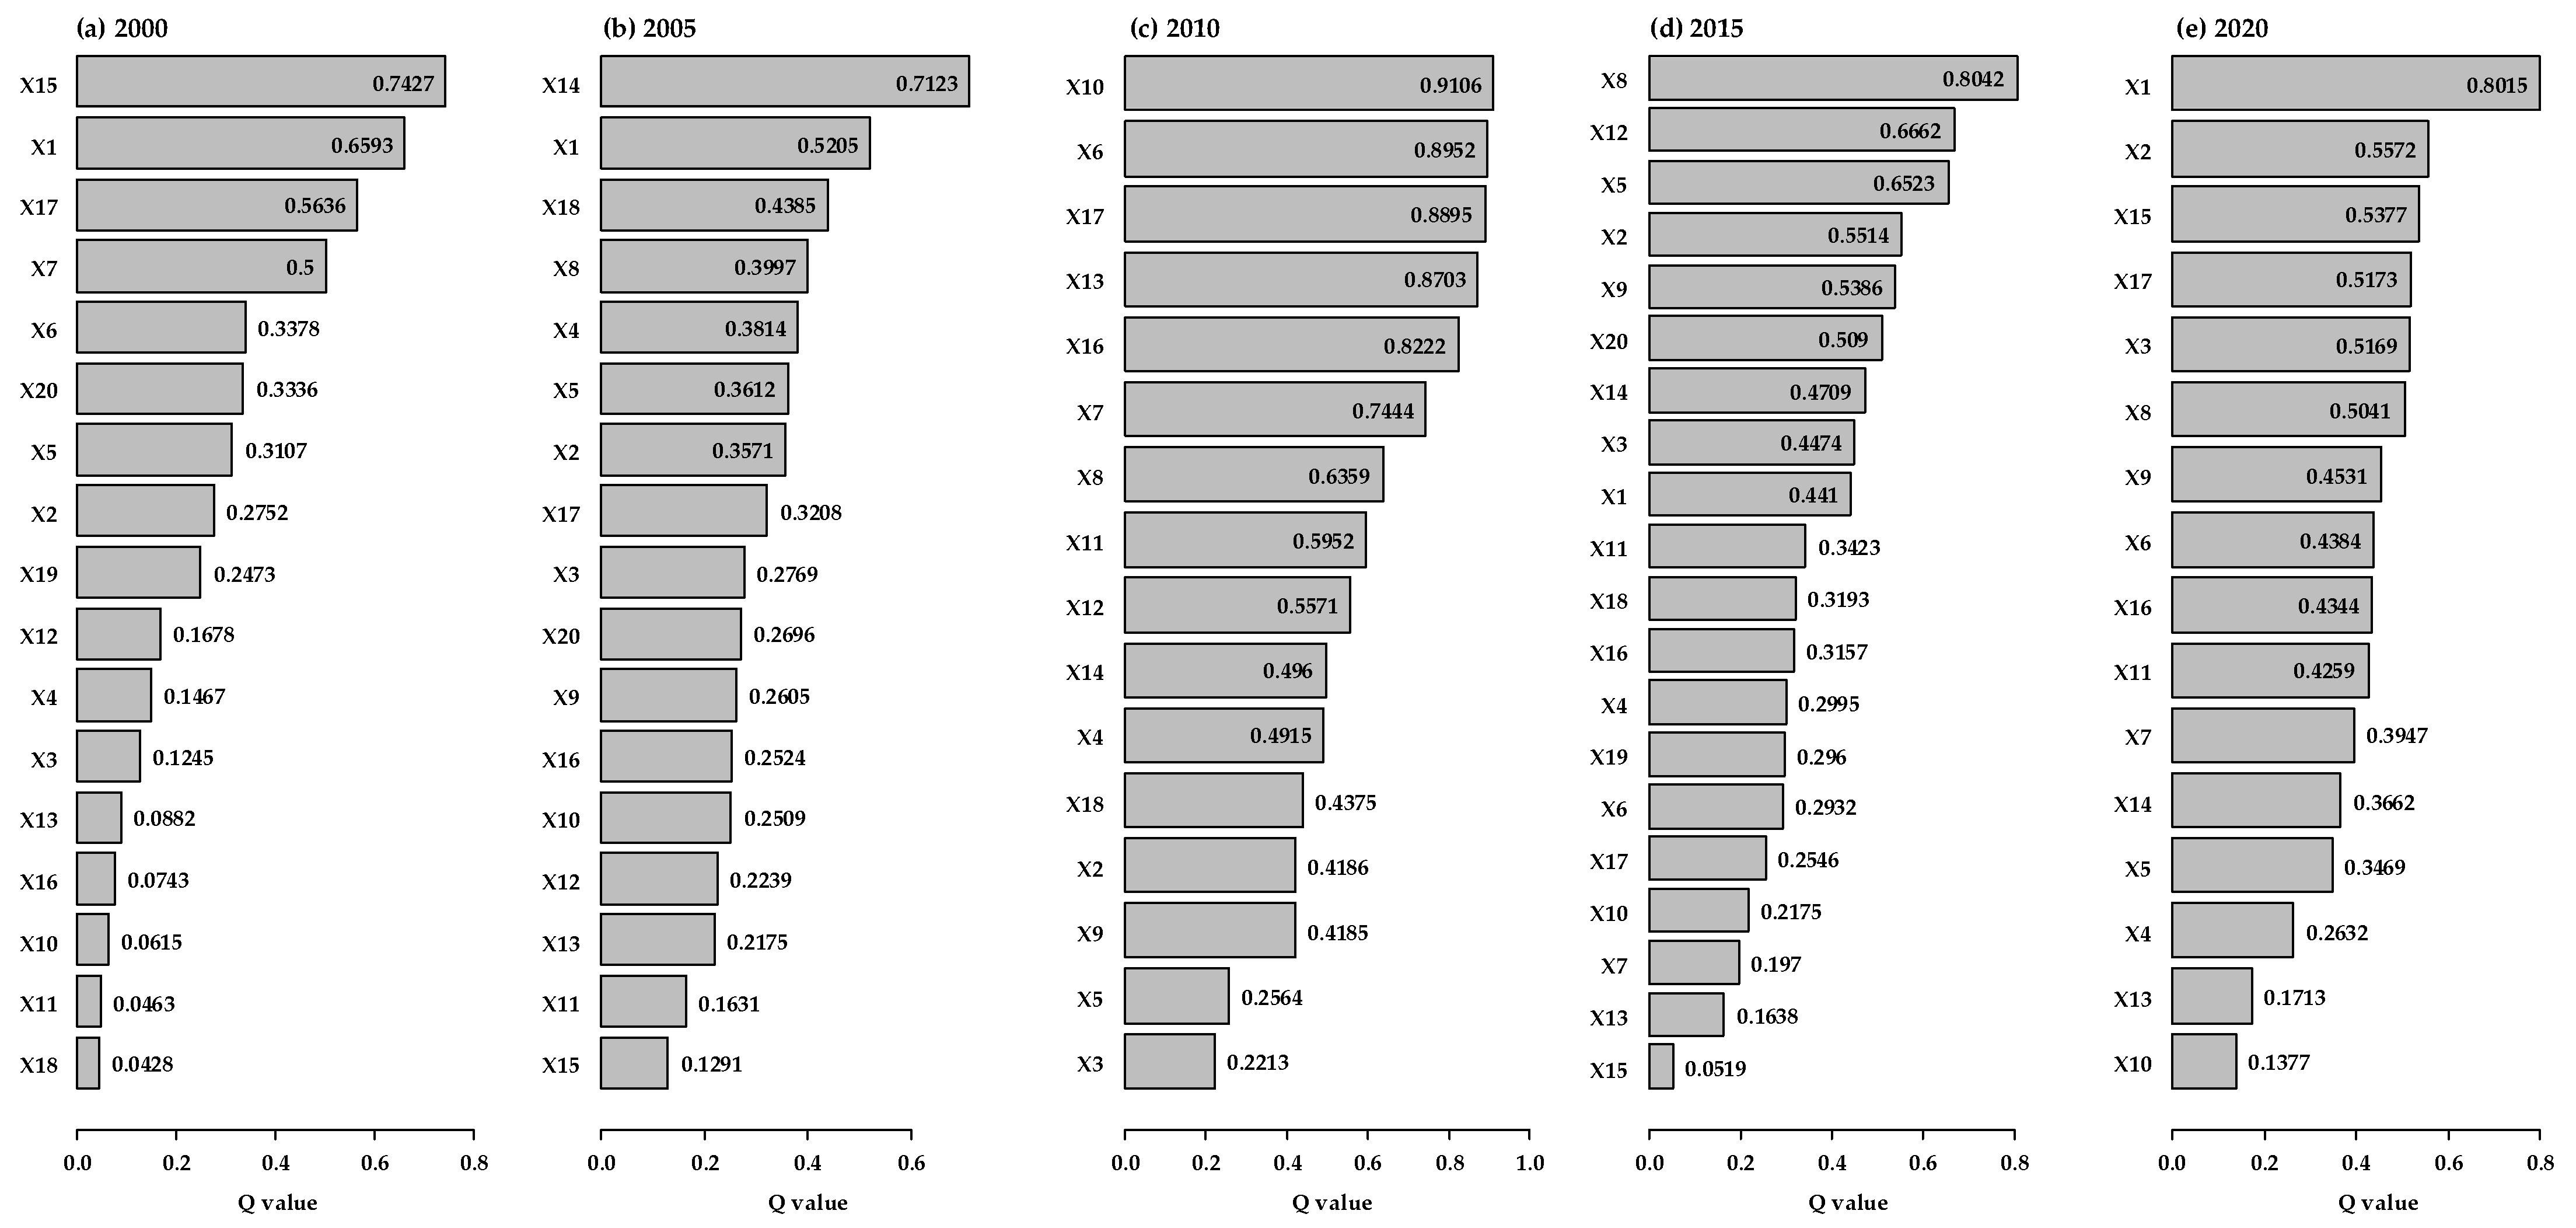
The Q values and ranks of variables investigated by the factor detector from 2000 to 2020 are described in Figure 8. The main driving factors of urban-rural integration development in the HBUA varied in different years. The indicators of population integration (X1) and spatial integration (X13, X14, and X15) had more important impacts on the URID level in 2000, 2005, and 2020, while economic integration (X8, X6, X5) and social integration (X10, X12) had more significant impacts on the URID level in 2010 and 2020. In addition, the Q value of X1 decreased from 0.6593 in 2000 to 0.5205 in 2005 and increased to 0.8015 in 2020.
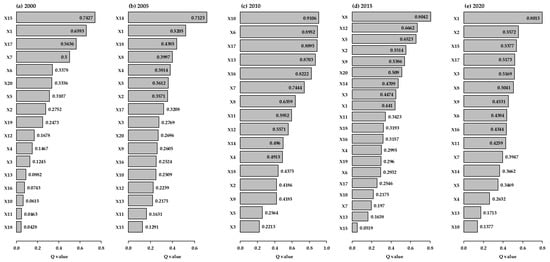
Figure 8.
Contributions of variables to URID changes investigated by the factor detector from 2000 to 2020.
The interactions between variables on URID in the HBUA from 2000 to 2020 were explored by the interaction detector (Figure 9) and further analyzed by using the F-statistic of the ecological detector (Figure 10) to reveal the significance of the different influence of variables. Overall, the interaction values of the two factors were greater than the maximum value of a single factor (Figure 8), indicating that the impact of each variable on URID was not independent but synergistically enhanced. The interaction with the highest Q value (0.9342) in 2000 was between X11 and X15 (p < 0.05), and the interaction values between X15 and X13, X7, X12, X17, X10, and X18 were more than 0.87 (p < 0.05). In 2005, the interaction with the highest Q value (0.9254) was between X4 and X14 (p < 0.05), and the interaction values between X14 and X3, X2, X5, X17, and X9 were more than 0.85 (p < 0.05). In 2010, the Q values of X6 and X10 were the largest (0.974, p < 0.05), and the interactions between X6 and X17, X11, X3, X7, and X20 were also strong (p < 0.05), the Q value of which were more than 0.95. In 2015, the interaction with the highest Q value (0.8989) was between X3 and X12 (p < 0.05). There were also strong interactions between X8 and X20, X12, X19, X5, X17, and X2, the Q values of which were more than 0.87 (p < 0.05). In 2020, the interaction value between X4 and X10 was the largest (0.9111, p < 0.05) and there were strong interactions between X1, and X19, X3, X10, X20, X5, X2, and X16 (p < 0.05), the Q values of which were more than 0.86.
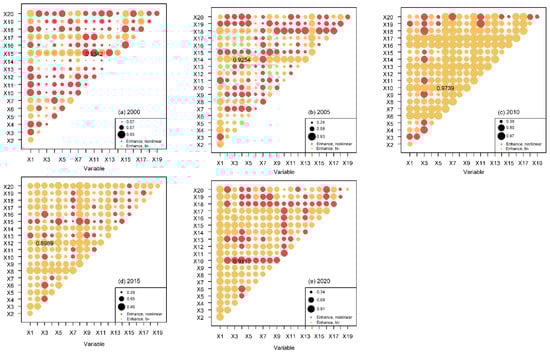
Figure 9.
Interaction detection of influencing factors of URID level in HBUA from 2000 to 2020. The interaction with the highest Q value in each year is marked. The size of the dots represents the Q value of the interaction between two variables. The different colors indicate the interaction types of each two variables (Table 3). The variables X8 and X9 in 2000 were excluded because their variances both were 0.
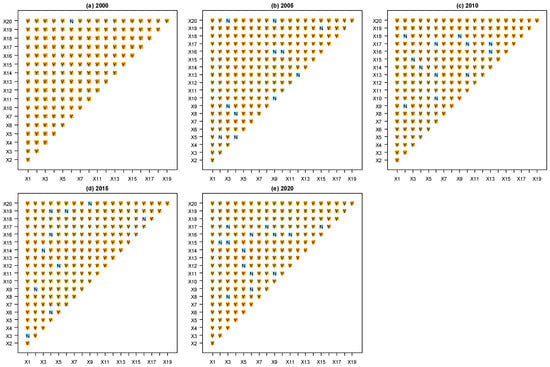
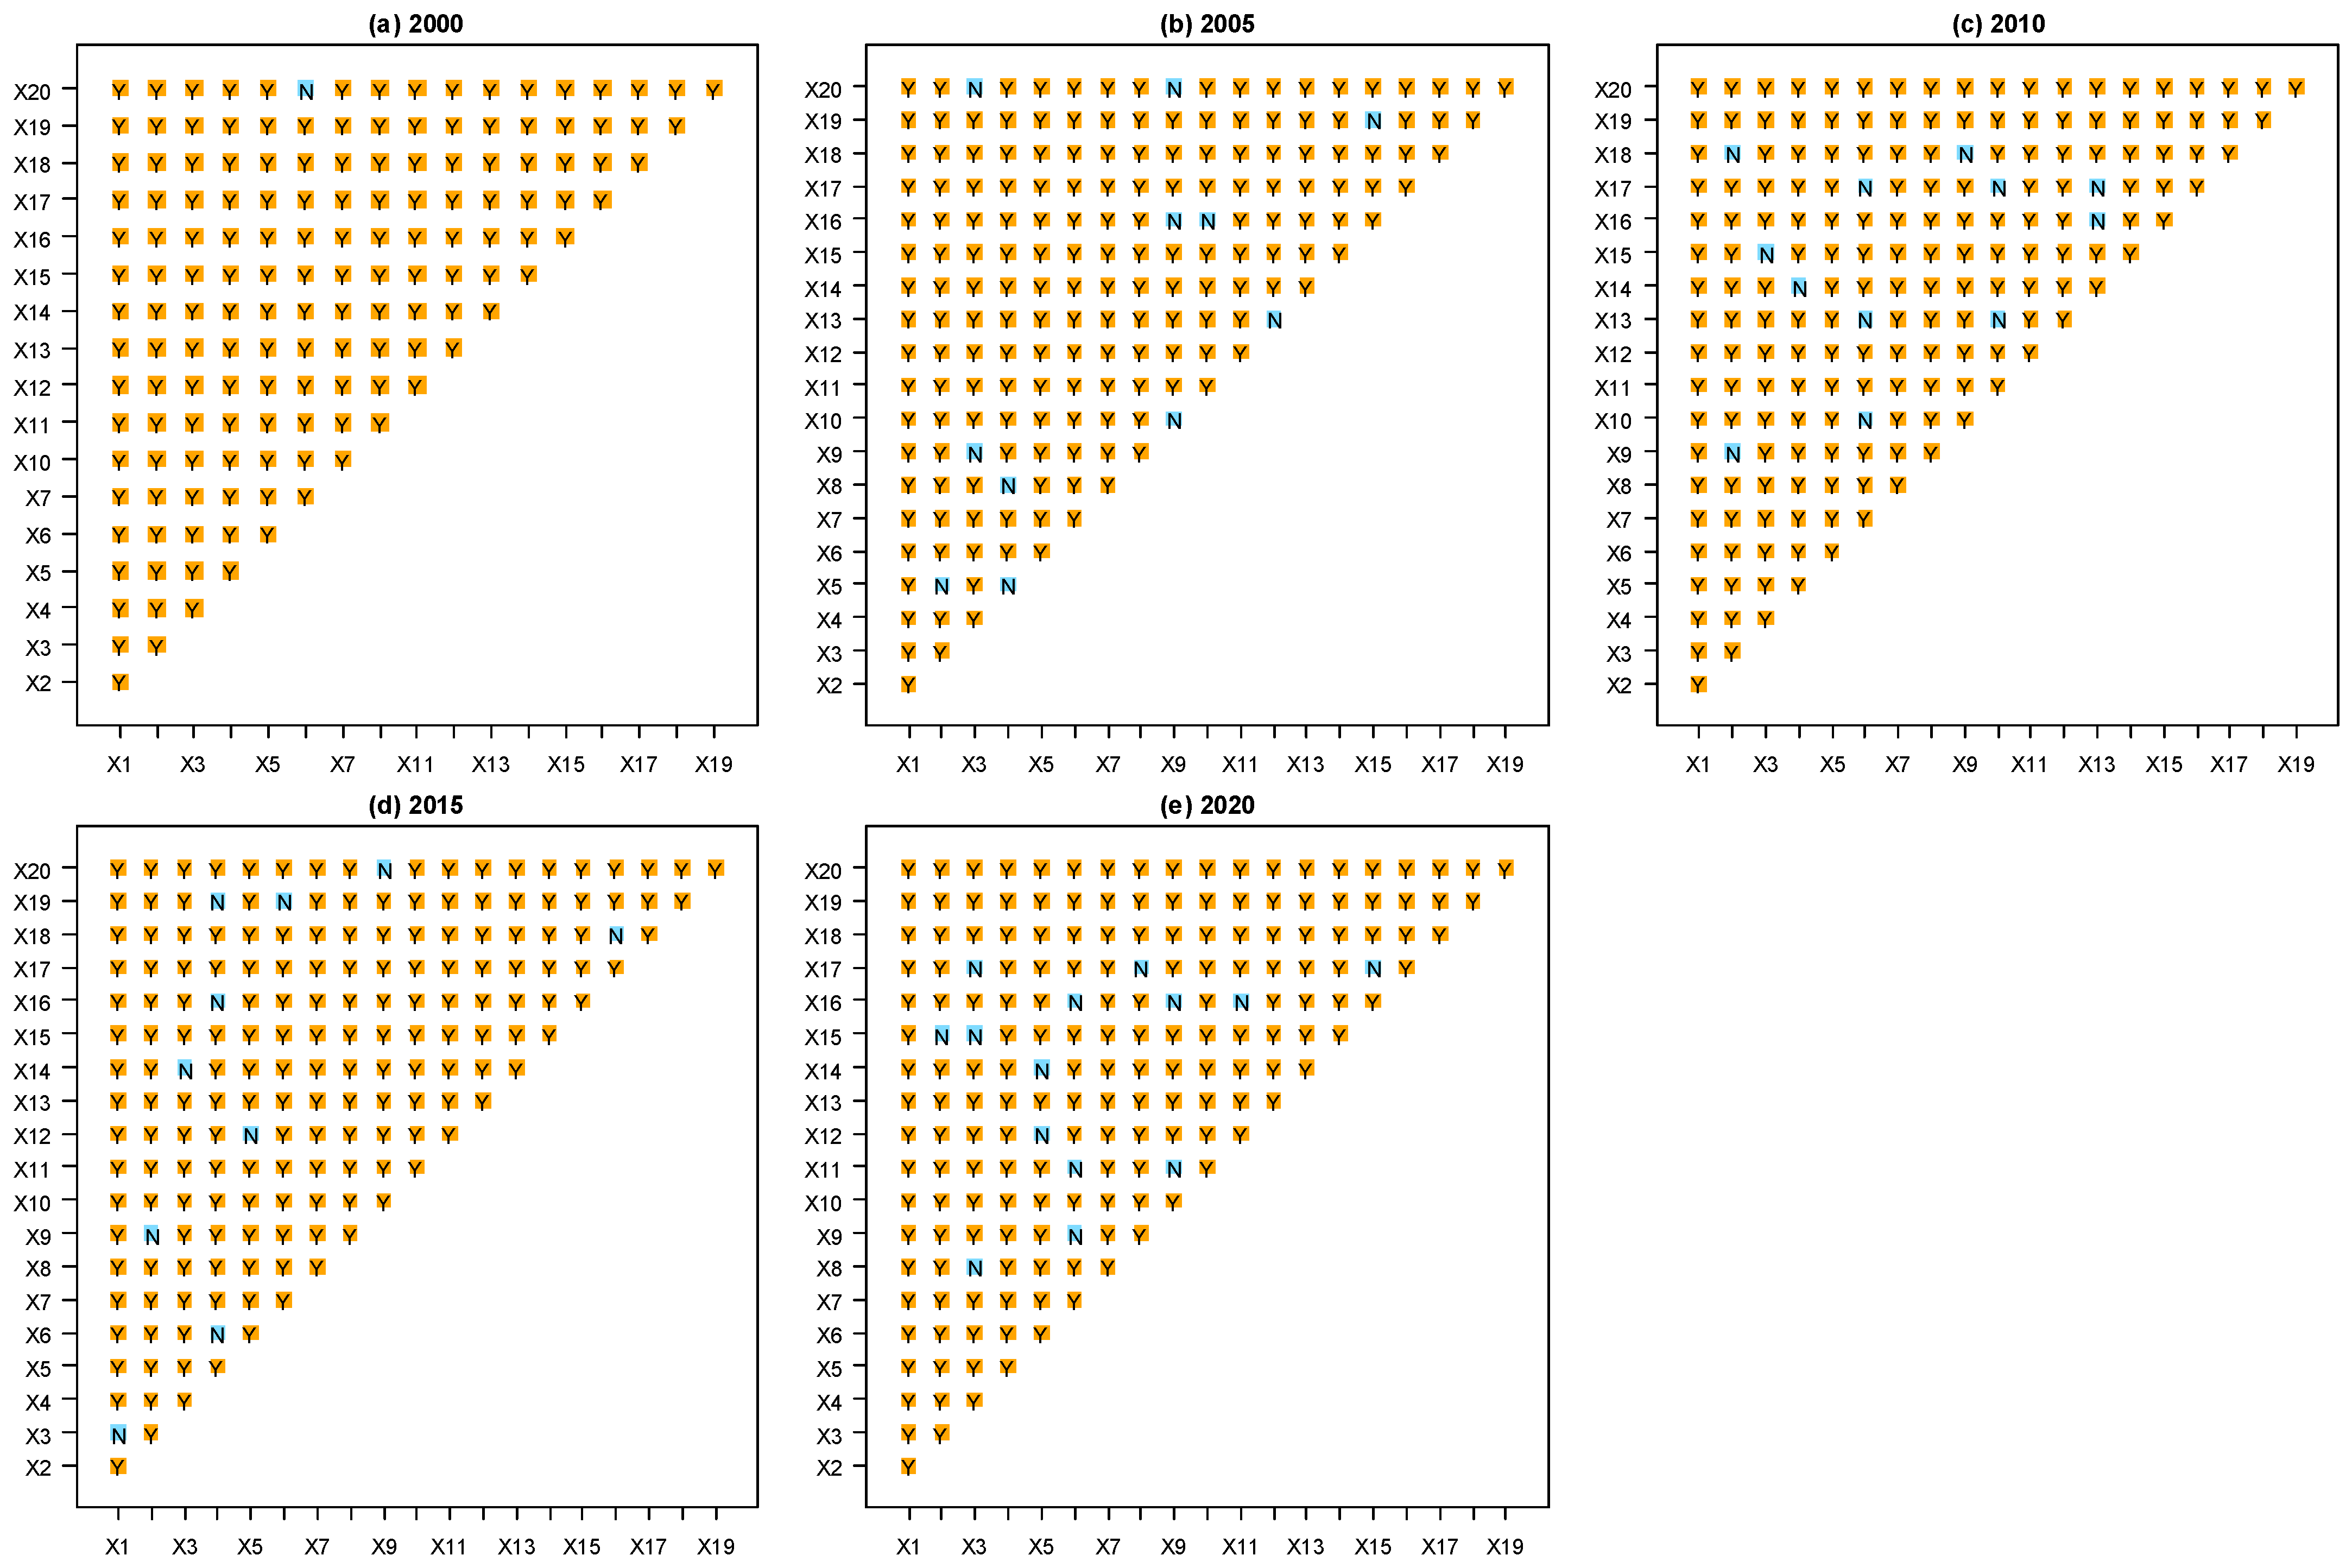
Figure 10.
The ecological detector result of influencing factors of URID level of HBUA from 2000 to 2020. “Y” represents a statistically significant difference between the two variables with the confidence of 95%; “N” indicates that the two variables had no significant difference. The variables X8 and X9 in 2000 were excluded because their variances both were 0.
5. Discussion
5.1. Characteristics of Urban-Rural Integration Development in Urban Agglomeration
A population–space–economy–society–ecology framework was constructed in this study to depict the URID and measure it with the URIDI. The URID level in the HBUA improved from 2000 (the URIDI value was 0.294) to 2020 (the URIDI value was 0.563). This result validated Hypothesis 1. Considering the significant differences among 2000, 2010, and 2015, 2005 could have been the inflection points of URID, similar to the results of studies on the URID level in China [27,29]. This result validated Hypothesis 2. According to the classification and discrimination criteria of the URID level in a previous study [72], in 2020, Hangzhou remained in a state of primary integration, while the remaining five prefecture-level cities were close to the state of integration. Therefore, the URID level of the HBUA was still low. As for the URID in China, it was lower than that of the HBUA [27]. Overall, the URID level of urban agglomeration was superior compared to small cities. Promoting the URID level of urban agglomeration and leading the URID level of small cities has been identified as a new task in China, which was indicated in the “Key Tasks for New-type Urbanization and Urban-rural Integration Development in 2022” [25].
The URID level of the HBUA showed a significant feature of spatial aggregation. This result validated Hypothesis 3. The three high-clustering areas of the URID level since 2015 were Hangzhou, Jiaxing, and Ningbo, which was a marked characteristic in the HBUA. The pattern of URID further verified the planning that was released by Zhejiang Province in 2003 [53,54], which was consistent with the result of the previous study [52]. The formulation of reasonable and effective planning and policy systems was of great significance to the overall development of urban agglomerations.
Land-use transition accelerated the spatial development and utilization between urban and rural areas, which affected the process of URID [29]. The land-use change in the HBUA from 2000 to 2020 showed a typical characteristic of the transition between cultivated land and construction land; other land-use types (i.e., woodland, waters, grassland, and unused land) were in stable states. This feature of land-use change indicated to some extent that the economic development and urbanization in the HBUA were promoted without sacrificing the environment. However, the farmland loss and the subsequent issue of food security were a concern, which was confirmed in another study of this region [73]. This phenomenon was obvious in the urbanization of China, and the “structure–function” transformation was indicated as a concern in the protection of cultivated land [74].
5.2. Driving Mechanism of Urban-Rural Integration Development Level Change
Urban agglomeration, as an important development mode in the process of urbanization, is a complex system with diverse interactions among the subsystems involving economy, society, and ecology [75]. These interactions are driven by human needs and can also change the quality of life. Therefore, a novel and people-oriented urbanization strategy was implemented in China [25]. All these developmental activities were based on land resources and constrained by land capacity. This study confirmed that the main driving factor of the URID level was different at the different stages of development. This result validated Hypothesis 4. The spatial integration had the most important impact on the URID level in 2000 and 2005, which could explain over 70% of URIDI. Convenient transportation is critical to a region and has been shown to reduce the time and cost to individuals and for goods [35]. Therefore, in the early stage of our URID analysis (i.e., the years 2000 and 2005), improving the spatial integration between urban and rural areas could not be ignored, as it could build a foundation for the development of economic and social integration. The social, economic, ecological, and spatial integrations were simultaneous in 2010, which could explain over 60% or even more than 90% of the URIDI. The economic and social integrations impacted more on the URIDI in 2015, which could explain over 65% of the URIDI. Population integration played the most important role in the URID process of the HBUA in 2020, which could explain over 80% of the URIDI. Migrant workers from rural areas impacted the economic, social, and cultural conditions of urban areas [34], which could also have related to the phenomenon of “village hollowing” in China [76]. Furthermore, the high-level talent flow between the areas could significantly improve the regional development, while an uneven flow would likely aggravate the existing disparity between urban and rural areas [77]. Since the “Development Plan for a High-tech Industrial Belt Around HBUA” was released in 2020 by the government of Zhejiang Province [55], population integration could play a more vital role in the URID in the future. Furthermore, reclamation activities on the coast of Hangzhou Bay have been conducted for decades, which has been harmful to the health of the coastal wetland ecosystem [78,79]. Research demonstrated that the urbanization in Hangzhou Bay has damaged the ecosystem services [80]. The protection of the fragile coastal wetland ecosystem should be a concern during the process of URID. Moreover, there was a strong synergy between the driving factors.
In summary, the evolution of URID in the HBUA included spatial integration at the early stages (from 2000 to 2005), comprehensive integration (including social, economic, ecological, and spatial integrations) at the middle stage (i.e., 2010), economic and social integrations in 2015, and primarily population integration in 2020.
5.3. Implication and Limitation
The URID is a new way to balance the gaps between urban and rural areas; this includes the interaction and integration of population, space, economy, society, and ecology (Figure 1). First, we must balance the population flow between urban and rural areas. The “two-entry, two-return” mechanism has been promoted in Zhejiang Province, which refers to technology entering the countryside, capital entering the countryside, youth returning to the countryside, and rural elites returning to the countryside [81]. This mechanism could promote rural revitalization. The second part is to further improve infrastructure in the HBUA, such as the infrastructure pipeline network, the living environment, and the urban renewal of old communities. In addition, actively building a large scientific and technological innovation corridor and a modern metropolitan area are also key tasks in the HBUA. The third is to achieve a diverse social integration between urban and rural areas, such as fully mobilizing the leading role of central cities (i.e., Hangzhou, Ningbo, and Jiaxing) and comprehensively promoting the construction of beautiful towns, traditional villages, small cities, and future communities. Public service facilities such as education, medical care, and information platforms should be synchronized. The fourth is to optimize the industrial structure and facilitate economic integration. It should cultivate and develop new industries and new formats. Innovating the path to realize the value of ecological products is a novel approach to the economic development of rural areas. Fifthly, urban-rural ecological integration is to promote the improvement of urban and rural living environments and the efficient use of resources when maintaining the ecological health of the region, so as to realize the equal symbiosis of urban and rural regional systems.
This study quantitatively evaluated URID levels according to the URIDI and analyzed the spatiotemporal pattern of the URIDI as well as the driving mechanisms of URID changes. Limitations were identified during the research. First, the indicators were selected based on the population–space–economy–society–ecology framework. Restricted by basic data, many other indicators were not selected in the index system. Second, only the years 2000, 2005, 2010, 2015, and 2020 were selected. The inflection points of the URID level between 2010 and 2015 could be pinpointed. Therefore, further research should investigate the changes in the URID levels and the driving mechanisms over a longer time period based on more detailed data (i.e., time-series data) in an effort to provide more comprehensive results.
6. Conclusions
This study constructed a population–space–economy–society–ecology framework to measure URID levels and further explore the driving mechanisms of URID changes. The results showed that the land-use change in the HBUA from 2000 to 2020 showed a typical characteristic of the transition between cultivated land and construction land, and other land-use types (i.e., woodland, waters, grassland, and unused land) were stable. The URID level in the HBUA improved from 2000 (the URIDI value is 0.294) to 2020 (the URIDI value is 0.563), and the year 2005 could have been the inflection point for URID. The URID level of the HBUA showed a significant feature of spatial aggregation with a high value. The three high-clustering areas of the URID levels since 2015 were Hangzhou, Jiaxing, and Ningbo. The population and spatial integrations had more important impacts on the URID level in 2000, 2005, and 2020, while economic and social integrations had more significant impacts on the URID levels in 2010 and 2015. This study provided a clear understanding of the evolution and the driving mechanisms of URID of urban agglomeration and may be used as a reference for the integration of urban and rural areas for decision makers.
Author Contributions
Conceptualization, C.X.; methodology, C.X.; software, C.X.; validation, C.X. and B.L.; formal analysis, C.X. and L.K.; data curation, C.X., C.Q. and W.Y.; writing—original draft preparation, C.X.; writing—review and editing, C.X. and F.K.; visualization, C.X.; funding acquisition, C.X. All authors have read and agreed to the published version of the manuscript.
Funding
This research was supported by the Special Project of Cultivating Leading Talents in Philosophy and Social Science of Zhejiang Province (Grant No. 21YJRC12-2YB).
Institutional Review Board Statement
Not applicable.
Informed Consent Statement
Not applicable.
Data Availability Statement
Not applicable.
Acknowledgments
Thanks to the anonymous reviewers and editors for their comments and suggestions, which helped improve the manuscript.
Conflicts of Interest
The authors declare no conflict of interest.
References
- López-Penabad, M.C.; Iglesias-Casal, A.; Rey-Ares, L. Proposal for a sustainable development index for rural municipalities. J. Clean. Prod. 2022, 357, 131876. [Google Scholar] [CrossRef]
- Chen, C.; LeGates, R.; Zhao, M.; Fang, C. The changing rural-urban divide in China’s megacities. Cities 2018, 81, 81–90. [Google Scholar] [CrossRef]
- Haider, L.J.; Boonstra, W.J.; Peterson, G.D.; Schlüter, M. Traps and Sustainable Development in Rural Areas: A Review. World Dev. 2018, 101, 311–321. [Google Scholar] [CrossRef] [Green Version]
- McGuire, R.; Longo, A.; Sherry, E. Tackling poverty and social isolation using a smart rural development initiative. J. Rural Stud. 2022, 89, 161–170. [Google Scholar] [CrossRef]
- Markey, S.; Halseth, G.; Manson, D. Challenging the inevitability of rural decline: Advancing the policy of place in northern British Columbia. J. Rural Stud. 2008, 24, 409–421. [Google Scholar] [CrossRef]
- Liu, Y.; Li, Y. Revitalize the world’s countryside. Nature 2017, 548, 275–277. [Google Scholar] [CrossRef]
- Noack, E.M.; Schüler, S. Rural development and human well-being: Do pillar-II-programmes take into account ecosystem services? A study in Lower Saxony, Germany. Environ. Sci. Policy 2020, 106, 191–200. [Google Scholar] [CrossRef]
- Liu, Y.; Lu, S.; Chen, Y. Spatio-temporal change of urban-rural equalized development patterns in China and its driving factors. J. Rural Stud. 2013, 32, 320–330. [Google Scholar] [CrossRef]
- Verburg, P.H.; Crossman, N.; Ellis, E.C.; Heinimann, A.; Hostert, P.; Mertz, O.; Nagendra, H.; Sikor, T.; Erb, K.-H.; Golubiewski, N.; et al. Land system science and sustainable development of the earth system: A global land project perspective. Anthropocene 2015, 12, 29–41. [Google Scholar] [CrossRef] [Green Version]
- Zhu, C.; Zhang, X.; Wang, K.; Yuan, S.; Yang, L.; Skitmore, M. Urban-rural construction land transition and its coupling relationship with population flow in China’s urban agglomeration region. Cities 2020, 101, 102701. [Google Scholar] [CrossRef]
- Shafiei Sabet, N.; Azharianfar, S. Urban-rural reciprocal interaction potential to develop weekly markets and regional development in Iran. Habitat Int. 2017, 61, 31–44. [Google Scholar] [CrossRef]
- Van Vliet, J.; Verburg, P.H.; Grădinaru, S.R.; Hersperger, A.M. Beyond the urban-rural dichotomy: Towards a more nuanced analysis of changes in built-up land. Comput. Environ. Urban Syst. 2019, 74, 41–49. [Google Scholar] [CrossRef]
- National Bureau of Statistics of the People’s Republic of China. Data Overview: Revenue-Related Data for the First Quarter of 2022. Available online: https://www.ndrc.gov.cn/fzggw/wld/hzc/lddt/202205/t20220512_1324549.html?code=&state=123 (accessed on 28 June 2022).
- Wang, Y.; Li, Y.; Huang, Y.; Yi, C.; Ren, J. Housing wealth inequality in China: An urban-rural comparison. Cities 2020, 96, 102428. [Google Scholar] [CrossRef]
- Zhang, G.; Zheng, D.; Wu, H.; Wang, J.; Li, S. Assessing the role of high-speed rail in shaping the spatial patterns of urban and rural development: A case of the Middle Reaches of the Yangtze River, China. Sci. Total Environ. 2020, 704, 135399. [Google Scholar] [CrossRef] [PubMed]
- Zhang, M.; Wang, L.; Ma, P.; Wang, W. Urban-rural income gap and air pollution: A stumbling block or stepping stone. Environ. Impact Asses 2022, 94, 106758. [Google Scholar] [CrossRef]
- Zhou, Q.; Shi, W. How does town planning affect urban-rural income inequality: Evidence from China with simultaneous equation analysis. Landsc. Urban Plan. 2022, 221, 104380. [Google Scholar] [CrossRef]
- Ouyang, Y.; Cai, H.; Yu, X.; Li, Z. Capitalization of social infrastructure into China’s urban and rural housing values: Empirical evidence from Bayesian Model Averaging. Econ. Model. 2022, 107, 105706. [Google Scholar] [CrossRef]
- Ma, L.; Liu, S.; Fang, F.; Che, X.; Chen, M. Evaluation of urban-rural difference and integration based on quality of life. Sustain. Cities Soc. 2020, 54, 101877. [Google Scholar] [CrossRef]
- Pu, X. A Research Review on the Development of Urban-Rural Integration. OALib 2020, 7, 1–6. [Google Scholar] [CrossRef]
- Xia, L. Common Prosperity: A Challenge and a Contribution. Available online: https://news.cgtn.com/news/2021-09-14/Common-prosperity-A-challenge-and-a-contribution-13ytz1UWcZW/index.html#:~:text=As%20a%20specific%20category%2C%20common%20prosperity%20literally%20means,rich%20-%20the%20foundation%20for%20a%20brighter%20future (accessed on 28 June 2022).
- Koty, A.C. How to Understand China’s Common Prosperity Policy. Available online: https://www.china-briefing.com/news/china-common-prosperity-what-does-it-mean-for-foreign-investors/ (accessed on 28 June 2022).
- Xinhua News Agency. Outline of the People’s Republic of China 14th Five-Year Plan for National Economic and Social Development and Long-Range Objectives for 2035. Available online: https://cset.georgetown.edu/publication/china-14th-five-year-plan/ (accessed on 28 June 2022).
- National Development and Reform Commission of the People’s Republic of China. Key Tasks for New-Type Urbanization and Urban-Rural Integration Development in 2021. Available online: https://www.ndrc.gov.cn/xwdt/tzgg/202104/t20210413_1272201.html?code=&state=123 (accessed on 28 June 2022).
- National Development and Reform Commission of the People’s Republic of China. Key Tasks for New-Type Urbanization and Urban-Rural Integration Development in 2022. Available online: http://www.gov.cn/zhengce/zhengceku/2022-03/22/content_5680416.htm (accessed on 28 June 2022).
- National Development and Reform Commission of the People’s Republic of China. 11 National Urban-Rural Integrated Development Pilot Zones Announced. Available online: http://www.gov.cn/guowuyuan/2019-12/28/content_5464649.htm (accessed on 28 June 2022).
- Yang, Y.; Bao, W.; Wang, Y.; Liu, Y. Measurement of urban-rural integration level and its spatial differentiation in China in the new century. Habitat Int. 2021, 117, 102420. [Google Scholar] [CrossRef]
- Jianing, Z.; Fucang, Q.; Jia, L.; Gaoli, Z.; Wei, Z. Measurement, spatial-temporal evolution and influencing mechanism of urban-rural integration level in China from a multidimensional perspective. China Popul. Resour. Environ. 2019, 29, 166–176, (In Chinese with English abstract). [Google Scholar]
- Chen, K.; Long, H.; Liao, L.; Tu, S.; Li, T. Land use transitions and urban-rural integrated development: Theoretical framework and China’s evidence. Land Use Policy 2020, 92, 104465. [Google Scholar] [CrossRef]
- Ren, Y.; Zhou, Z.; Cao, D.; Ma, B.H.; Shen, C.; Lai, S.; Chen, G. Did the Integrated Urban and Rural Resident Basic Medical Insurance Improve Benefit Equity in China? Value Health 2022. [Google Scholar] [CrossRef]
- Communist Party of China Central Committee and the State Council. Outline of Integrated Development of Yangtze River Delta. Available online: http://www.gov.cn/zhengce/2019-12/01/content_5457442.htm (accessed on 28 June 2022).
- Huang, Y.; Hui, E.C.M.; Zhou, J.; Lang, W.; Chen, T.; Li, X. Rural Revitalization in China: Land-Use Optimization through the Practice of Place-making. Land Use Policy 2020, 97, 104788. [Google Scholar] [CrossRef]
- Sheng, Y.; Zhao, Y.; Zhang, Q.; Dong, W.; Huang, J. Boosting rural labor off-farm employment through urban expansion in China. World Dev. 2022, 151, 105727. [Google Scholar] [CrossRef]
- Sun, J.; Ling, L.; Huang, Z. Tourism migrant workers: The internal integration from urban to rural destinations. Ann. Tour. Res. 2020, 84, 102972. [Google Scholar] [CrossRef]
- Lu, H.; Zhao, P.; Hu, H.; Zeng, L.; Wu, K.S.; Lv, D. Transport infrastructure and urban-rural income disparity: A municipal-level analysis in China. J. Transp. Geogr. 2022, 99, 103292. [Google Scholar] [CrossRef]
- Burghardt, K.; Uhl, J.H.; Lerman, K.; Leyk, S. Road network evolution in the urban and rural United States since 1900. Comput. Environ. Urban Syst. 2022, 95, 101803. [Google Scholar] [CrossRef]
- Huang, X.; Wu, B. Impact of urban-rural health insurance integration on health care: Evidence from rural China. China Econ. Rev. 2020, 64, 101543. [Google Scholar] [CrossRef]
- Tang, Z.; Wang, N. School disruption of children in China: The influence of parents’ rural-urban migration. Child. Youth Serv. Rev. 2021, 129, 106167. [Google Scholar] [CrossRef]
- Zhao, J.; Pan, H.; Wahid, M.; Liu, F. Vulnerability of Chinese rural-to-urban migrants to social exclusion: Spatial pattern and mechanism. Front. Archit. Res. 2021, 10, 572–583. [Google Scholar] [CrossRef]
- Zhao, P.; Wan, J. Land use and travel burden of residents in urban fringe and rural areas: An evaluation of urban-rural integration initiatives in Beijing. Land Use Policy 2021, 103, 105309. [Google Scholar] [CrossRef]
- Jiang, C.; Li, J.; Liu, J. Does urbanization affect the gap between urban and rural areas? Evidence from China. Socio-Econ. Plan. Sci. 2022, 101271. [Google Scholar] [CrossRef]
- Said, M.A.; Thangiah, G.; Majid, H.A.; Ismail, R.; Pin, T.M.; Rizal, H.; Zaidi, M.A.S.; Reidpath, D.; Su, T.T. Income Disparity and Mental Wellbeing among Adults in Semi-Urban and Rural Areas in Malaysia: The Mediating Role of Social Capital. Int. J. Environ. Res. Public Health 2022, 19, 6604. [Google Scholar] [CrossRef] [PubMed]
- Long, H.; Liu, Y.; Li, X.; Chen, Y. Building new countryside in China: A geographical perspective. Land Use Policy 2010, 27, 457–470. [Google Scholar] [CrossRef]
- Luo, W.; Bai, H.; Jing, Q.; Liu, T.; Xu, H. Urbanization-induced ecological degradation in Midwestern China: An analysis based on an improved ecological footprint model. Resour. Conserv. Recycl. 2018, 137, 113–125. [Google Scholar] [CrossRef]
- Wang, Y.; Yao, Y.; Chen, S.; Ni, Z.; Xia, B. Spatiotemporal evolution of urban development and surface urban heat island in Guangdong-Hong Kong-Macau greater bay area of China from 2013 to 2019. Resour. Conserv. Recycl. 2022, 179, 106063. [Google Scholar] [CrossRef]
- Xue, J.; Wang, Q.; Zhang, M. A review of non-point source water pollution modeling for the urban-rural transitional areas of China: Research status and prospect. Sci. Total Environ. 2022, 826, 154146. [Google Scholar] [CrossRef]
- Shi, J.-G.; Xu, K.; Si, H.; Song, L.; Duan, K. Investigating intention and behaviour towards sorting household waste in Chinese rural and urban-rural integration areas. J. Clean. Prod. 2021, 298, 126827. [Google Scholar] [CrossRef]
- Yang, R.; Zhang, J.; Xu, Q.; Luo, X. Urban-rural spatial transformation process and influences from the perspective of land use: A case study of the Pearl River Delta Region. Habitat Int. 2020, 104, 102234. [Google Scholar] [CrossRef]
- chinadaily.com.cn. Jiaxing among National Pilot Zones for Integrated Urban-Rural Development. Available online: http://zhejiang.chinadaily.com.cn/jiaxing/2020-01/02/c_445755.htm (accessed on 28 June 2022).
- Zhejiang Provincial Bureau of Statistics. Zhejiang Statistical Yearbook 2021; China Statistics Press: Beijing, China, 2021.
- The People’s Government of Zhejiang Province. Outline of the 14th Five-Year Plan (2021–2025) for National Economic and Social Development and Vision 2035 of Zhejiang Province. Available online: http://www.zj.gov.cn/art/2021/2/5/art_1229463129_59083059.html (accessed on 28 June 2022).
- Zhou, D.; Xu, J.; Wang, L.; Lin, Z. Assessing urbanization quality using structure and function analyses: A case study of the urban agglomeration around Hangzhou Bay (UAHB), China. Habitat Int. 2015, 49, 165–176. [Google Scholar] [CrossRef]
- The People’s Government of Zhejiang Province. The Industrial Zone Development Plan of the Hangzhou Bay Urban Agglomeration. Available online: http://www.110.com/fagui/law_99535.html (accessed on 28 June 2022).
- The People’s Government of Zhejiang Province. Strategic Planning for Spatial Development of the Hangzhou Bay Urban Agglomeration. Available online: https://zjnews.zjol.com.cn/05zjnews/system/2003/12/11/002199161.shtml (accessed on 28 June 2022).
- The People’s Government of Zhejiang Province. Development Plan for High-Tech Industrial Belt Around the Hangzhou Bay Urban Agglomeration. Available online: http://kjt.zj.gov.cn/art/2020/1/15/art_1229247517_2385661.html (accessed on 28 June 2022).
- Zhejiang Provincial Bureau of Statistics. Zhejiang Statistical Yearbook 2016; China Statistics Press: Beijing, China, 2016.
- Zhejiang Provincial Bureau of Statistics. Zhejiang Statistical Yearbook 2011; China Statistics Press: Beijing, China, 2011.
- Zhejiang Provincial Bureau of Statistics. Zhejiang Statistical Yearbook 2006; China Statistics Press: Beijing, China, 2006.
- Zhejiang Provincial Bureau of Statistics. Zhejiang Statistical Yearbook 2001; China Statistics Press: Beijing, China, 2001.
- Jianing, Z.; Wei, Z.; Fucang, Q. Review of urban-rural multi-dimensional integration and influencing factors in China based on the concept of equivalence. Geogr. Res. 2020, 39, 1836–1851, (In Chinese with English abstract). [Google Scholar] [CrossRef]
- Jiangang, S.; Kaifeng, D.; Guangdong, W.; Jiajia, L.; Ke, X. Efficiency of Urban-rural Integration Development in the Yangtze River Delta Under the Background of Carbon Emission Constraint. Econ. Geogr. 2021, 41, 57–67, (In Chinese with English abstract). [Google Scholar] [CrossRef]
- Zhu, Y.; Tian, D.; Yan, F. Effectiveness of Entropy Weight Method in Decision-Making. Math Probl. Eng. 2020, 2020, 3564835. [Google Scholar] [CrossRef]
- Getis, A.; Ord, J.K. The Analysis of Spatial Association by Use of Distance Statistics. Geogr. Anal. 1992, 24, 189–206. [Google Scholar] [CrossRef]
- Wang, J.-F.; Zhang, T.-L.; Fu, B.-J. A measure of spatial stratified heterogeneity. Ecol. Indic. 2016, 67, 250–256. [Google Scholar] [CrossRef]
- Chen, Y.; Zhang, D. Multiscale assessment of the coupling coordination between innovation and economic development in resource-based cities: A case study of Northeast China. J. Clean. Prod. 2021, 318, 128597. [Google Scholar] [CrossRef]
- Li, S.; Liu, C.; Sun, P.; Ni, T. Response of cyanobacterial bloom risk to nitrogen and phosphorus concentrations in large shallow lakes determined through geographical detector: A case study of Taihu Lake, China. Sci. Total Environ. 2022, 816, 151617. [Google Scholar] [CrossRef]
- Liu, C.; Wang, C.; Li, Y.; Wang, Y. Spatiotemporal differentiation and geographic detection mechanism of ecological security in Chongqing, China. Glob. Ecol. Conserv. 2022, 35, e02072. [Google Scholar] [CrossRef]
- Qiao, P.; Yang, S.; Lei, M.; Chen, T.; Dong, N. Quantitative analysis of the factors influencing spatial distribution of soil heavy metals based on geographical detector. Sci. Total Environ. 2019, 664, 392–413. [Google Scholar] [CrossRef]
- Zhou, C.; Chen, J.; Wang, S. Examining the effects of socioeconomic development on fine particulate matter (PM2.5) in China’s cities using spatial regression and the geographical detector technique. Sci. Total Environ. 2018, 619–620, 436–445. [Google Scholar] [CrossRef] [PubMed]
- Wang, J.F.; Li, X.H.; Christakos, G.; Liao, Y.L.; Zhang, T.; Gu, X.; Zheng, X.Y. Geographical Detectors-Based Health Risk Assessment and its Application in the Neural Tube Defects Study of the Heshun Region, China. Int. J. Geogr. Inf. Sci. 2010, 24, 107–127. [Google Scholar] [CrossRef]
- Song, Y.; Wang, J.; Ge, Y.; Xu, C. An optimal parameters-based geographical detector model enhances geographic characteristics of explanatory variables for spatial heterogeneity analysis: Cases with different types of spatial data. Gisci. Remote Sens. 2020, 57, 593–610. [Google Scholar] [CrossRef]
- Ying, W.; Pingjun, S.; Chenggu, L.; Hang, L.; Jia, Z. Spatial-Temporal Evolution Features of Urban and Rural Harmonious in Northeast China Since 2003. Econ. Geogr. 2018, 38, 59–66, (In Chinese with English abstract). [Google Scholar] [CrossRef]
- Xiao, R.; Liu, Y.; Huang, X.; Shi, R.; Yu, W.; Zhang, T. Exploring the driving forces of farmland loss under rapidurbanization using binary logistic regression and spatial regression: A case study of Shanghai and Hangzhou Bay. Ecol. Indic. 2018, 95, 455–467. [Google Scholar] [CrossRef]
- Ma, L.; Long, H.; Tu, S.; Zhang, Y.; Zheng, Y. Farmland transition in China and its policy implications. Land Use Policy 2020, 92, 104470. [Google Scholar] [CrossRef]
- Li, X.; Lu, Z. Quantitative measurement on urbanization development level in urban Agglomerations: A case of JJJ urban agglomeration. Ecol. Indic. 2021, 133, 108375. [Google Scholar] [CrossRef]
- Long, H.; Li, Y.; Liu, Y.; Woods, M.; Zou, J. Accelerated restructuring in rural China fueled by ‘increasing vs. decreasing balance’ land-use policy for dealing with hollowed villages. Land Use Policy 2012, 29, 11–22. [Google Scholar] [CrossRef]
- Zhou, Y.; Guo, Y.; Liu, Y. High-level talent flow and its influence on regional unbalanced development in China. Appl. Geogr. 2018, 91, 89–98. [Google Scholar] [CrossRef]
- Qiu, L.; Zhang, M.; Zhou, B.; Cui, Y.; Yu, Z.; Liu, T.; Wu, S. Economic and ecological trade-offs of coastal reclamation in the Hangzhou Bay, China. Ecol. Indic. 2021, 125, 107477. [Google Scholar] [CrossRef]
- Xiao, R.; Liu, Y.; Fei, X.; Yu, W.; Zhang, Z.; Meng, Q. Ecosystem health assessment: A comprehensive and detailed analysis of the case study in coastal metropolitan region, eastern China. Ecol. Indic. 2019, 98, 363–376. [Google Scholar] [CrossRef]
- Xiao, R.; Lin, M.; Fei, X.; Li, Y.; Zhang, Z.; Meng, Q. Exploring the interactive coercing relationship between urbanization and ecosystem service value in the Shanghai–Hangzhou Bay Metropolitan Region. J. Clean. Prod. 2020, 253, 119803. [Google Scholar] [CrossRef]
- General Office of the People’s Government of Zhejiang Province. Opinions on the Implementation of the “Two-Entry, Two-Return” Action. Available online: http://www.zj.gov.cn/art/2019/10/28/art_1229017139_56699.html (accessed on 28 June 2022).


Publisher’s Note: MDPI stays neutral with regard to jurisdictional claims in published maps and institutional affiliations. |
© 2022 by the authors. Licensee MDPI, Basel, Switzerland. This article is an open access article distributed under the terms and conditions of the Creative Commons Attribution (CC BY) license (https://creativecommons.org/licenses/by/4.0/).