Article

Re-Visiting Maximal Heart Rate Prediction Using Cross-Validation in Population Aged 7–55 Years

1
Department of Physical Education, Kyung Hee University (Global Campus), 1732 Deokyoungdaero, Giheung-gu, Yongin-si 17014, Gyeonggi-do, Korea
2
Department of Coaching, Kyung Hee University (Global Campus), 1732 Deokyoungdae-ro, Giheung-gu, Yongin-si 17014, Gyeonggi-do, Korea
3
Center for Sports Science in Gyeonggi, 134 Jangan-ro, Jangan-gu, Suwon-si 16312, Gyeonggi-do, Korea
4
Divison of Sport Medicine, Graduate School of Physical Education, Kyung Hee University (Global Campus), 1732 Deokyoungdae-ro, Giheung-gu, Yongin-si 17014, Gyeonggi-do, Korea
5
Sports Science Research Center, Kyung Hee University (Global Campus), 1732 Deokyoungdaero, Giheung-gu, Yongin-si 17014, Gyeonggi-do, Korea
*
Author to whom correspondence should be addressed.
Int. J. Environ. Res. Public Health 2022, 19(14), 8509; https://doi.org/10.3390/ijerph19148509
Submission received: 9 June 2022 / Revised: 11 July 2022 / Accepted: 11 July 2022 / Published: 12 July 2022
(This article belongs to the Special Issue New Trends in Sport Healthcare)

Abstract

:
The primary purpose of the present study was to re-visit HRmax prediction by two commonly used equations (i.e., Fox′s and Tanaka′s equation) compared to the direct measured HRmax using the large sample size of Asians. The second aim of the study was to focus on suggesting new equations for the Asian population by separating gender and specific age groups. A total of 672 participants aged from 7 to 55 years were recruited for the study (male: 280 and female: 392), and the maximal graded exercise test with Bruce protocol was used to measure HRmax. All data obtained from the study were analyzed by SPSS 25.0. Additionally, three statistical analysis methods (i.e., Mean Absolute Percent Errors (MAPE), Bland–Altman plots, and equivalence testing) were utilized to confirm the consistency between the measured HRmax and the two prediction equations. The main finding was that two equations showed significant differences in predicting the HRmax of Korean aged from 7 to 55 years. The outcome of children aged from 7 to 14 was a different fit in the agreement compared to other age groups. Fox′s equation had the best fit in the average of the difference closer to zero and completely included within the equivalence zone, but females over 15 years old revealed higher errors than males in the values calculated by the two equations compared to the direct measured HRmax. Consequently, the study demonstrated that both equations tended to overestimate the HRmax for males and females over 15 years old, and the two universal equations were not suitable to predict the HRmax of Koreans except for children aged from 7 to 14 years. The new HRmax prediction equations suggested in this study will more accurately predict the HRmax of Asians, and additional analyses should be examined the cross-validity of the developed HRmax equation by age and gender in the future study.

1. Introduction

Maximal heart rate (HRmax) is the highest heart rate of beats per minute measured by a maximal effort graded exercise test (GXT), and it is known as an important indicator for examining individuals’ cardio-respiratory fitness [1,2]. HRmax has been used as a basis for determining the upper limit of cardiovascular function and prescribing appropriate exercise intensity, along with other variables [3,4]. To prescribe effective and accurate exercise intensity, the American College of Sports Medicine (ACSM) has provided exercise prescription guidelines based on individuals’ HRmax. For instance, the ACSM has recommended reaching 50~85% of an individual’s HRmax during exercise to improve aerobic fitness [5].
The most accurate method to measure HRmax is to be obtained by direct measure of HR at the highest exercise intensity during GXT [6]. Although it is difficult to evaluate whether the tested individuals have achieved maximal effort performance or near maximal effort performance, most previous studies used several physiological criteria to minimize this issue during GXT, such as subjective feeling (i.e., Rate of Perceived Exertion (RPE) > 17) and objective values (i.e., Respiratory Exchange Ratio (RER) > 1.10, post-exercise blood lactate levels ≥ 8 mmol·L1, achievement of some percentage of an age-adjusted estimate of HRmax, Plateau of ≤150 mL·O2·min−1 [7,8]). Nevertheless, even if GXT is the best way to measure the HRmax, occasionally, it was not feasible or desirable to perform GXT because most participants were reluctant to suffer from fatigue induced during GXT. Therefore, when measuring the HRmax using GXT, we have to understand that recruiting participants for GXT is not only time-consuming but also costly [9].
Instead, one of the alternative methods for estimating HRmax is to predict it by using age-based regression equations. Several previous studies have demonstrated a decline in HRmax with increasing age, so individuals’ age has been used as a primary determinant for predicting HRmax [10], and using the age-based HRmax equations has become a common practice. Age-based formulas have been developed from a variety of studies [11,12,13,14,15,16], but perhaps the most commonly used equations are the Fox equation (HRmax = 220 − age) [17] and Tanaka equation (HRmax = 208 − 0.7 × age) [18] among the suggested equations. Fox equation has developed in 1971 and has been extensively investigated within the specific population (i.e., healthy, obese, and athlete) for adults [4,19,20], and especially, the HRmax prediction equation devised by Fox was widely utilized for physical activity and heart diseases study [21]. Later in 2001, the Tanaka equation was developed using a meta-analysis of 351 studies and showed high accuracy (r = −0.90) that there was no significant difference in gender, physical activity, sedentary behavior, or endurance-trained participants [22].
Although the abovementioned two equations (i.e., Fox and Tanaka) are ubiquitous equations for estimating HRmax, some aspects need further research. A major limitation of these equations is that numerous studies for developing HRmax prediction equations and/or demonstrating validity recruited their participants as adults, especially males, in the last three decades [22,23]. Few studies have examined the pediatric population [3,24], but the studies had a common limitation on small sample sizes of less than 100 participants. Furthermore, Gulati’s study has found that the general age-based HRmax equations tended to be overestimated in females [13], and even the female athletes’ HRmax indicated significantly lower HRmax values compared to non-athletes [25]. Additionally, although several studies have revealed obvious differences in genetic factors that determine the physical indicators (i.e., height, weight, and body mass index) of Asians, Europeans, and/or Americans [26,27,28], most studies recruited Americans or Europeans for developing and/or validating HRmax formulas, so developed universal formulas may be difficult to predict the HRmax in Asians.
Therefore, the primary aim of the present study was to determine which equation (Fox and Tanaka) most accurately predicts HRmax in Korean compared to the direct measured HRmax using the large sample size of Asians. Additionally, the secondary aim was to focus on suggesting new equations for the Asian population by separating gender and age (i.e., 7–14 years, 15–24 years, 25–39 years, and 40–55 years [29]).

2. Methods

2.1. Study Protocol

The present study used the Bruce protocol and Metabolic Gas Analyzer Test System for the maximal GXT. Before the test, the metabolic gas analyzer was sufficiently operated, and the respiratory sensitivity transducer and gas concentration were checked. The measurement started at an initial speed of 1.7 mph and a grade of 10%, increasing the intensity every three minutes. Although all participants were encouraged to achieve maximum capability, the GXT was terminated when participants met at least three or more of the following five criteria: (1) increased exercise intensity but did not increase heart rate, (2) greater RER than 1.10, (3) higher RPE than 17 of Borg scale, (4) heart rate within ± 10 beats/min of age-predicted HRmax (Predicted HRmax was determined with the following equations of “220 − age” and “208 − 0.7 × age”), and (5) stagnant oxygen intake despite increased exercise intensity [2]. This study adopted the HRmax among the HR measured between the start and end of the GXT, and our study observed that participants’ HR did not exceed their HRmax for one minute immediately after GXT was terminated.

2.2. Study Participants

Table 1 presents a total of 672 participants aged from 7 to 55 years who were recruited for the study (male: 280 and female: 392). Participants aged from 7 to 14 years accounted for 30.21% (n = 203, 9.71 ± 2.11 years), aged from 15 to 24 was recruited by 23.21% (n = 156, 20.59 ± 2.35 years), aged from 25 to 39 indicated 22.62% (n = 152, 34.59 ± 4.57 years), and aged from 40 to 55 were 23.96% (n = 161, 43.71 ± 3.11 years). Before the test for the present study, we informed all participants regarding the study’s purpose, procedure, and possible occurrence of discomfort and risks. All participants aged above 18 years submitted written informed consent for participation in this study, and participants under the age of 18 years were asked to submit consent from each participant’s parent or legal guardian. All participants were aware that they could withdraw at any time without any prejudice. This study was approved by the Institutional Review Board (IRB) of Kyung Hee University (KHU IRB 2014-G06).

2.3. Measures

2.3.1. Anthropometric Measurements

Body height (SECA S-208M, Chino, CA, USA) and weight (TANITA BC-581, Tokyo, Japan) were measured before the GXT began and were recorded in units of 0.1 cm and 0.1 kg, respectively. Additionally, body mass index (BMI) was calculated by dividing the weight (kg) by the square of the height (m2).

2.3.2. Metabolic Gas Analyzer Test

Oxygen uptake was measured by Quark b2 (COSMED, Rome, Italy) during the GXT, which is a standard laboratory metabolic cart. The Quark b2 is a valid instrument to measure respiratory and metabolic parameters at the various intensity of exercise in the laboratory setting [30], and all participants completed the GXT test on the treadmill (Series 2000, Marquettem Electronic, Milwaukee, WI, USA) with the Bruce protocol [31].

2.3.3. Maximal Heart Rate (HRmax)

Heart rate was measured during the GXT using a wearable chest monitor and heart rate monitor (Polar RS400, Polar Electro Oy, Kempele, Finland). The Polar RS series was a chest strap, which in earlier studies has been demonstrated to have high validity and was well suited for measuring individuals’ heart rate during participation in physical activity and exercise training [32,33,34]. When participants reached at least three VO2max criteria ((RPE > 17, RER > 1.10, achieved some percentage of an age-adjusted estimate of HRmax, and Plateau of ≤ 150 mL·O2·min−1), the highest heart rate value was recorded as observed HRmax.

2.4. Statistical Analysis

All data obtained from the present study were analyzed by SPSS 25.0 version (IBM SPSS, Chicago, IL, USA). Participants’ demographic information (i.e., gender, age, height, weight, and BMI) and maximal exercise response variables (i.e., RER, HRmax, and VO2max) were summarized as mean and standard deviation (SD) by descriptive statistics. To compare with measured HRmax and the values calculated by the HRmax prediction equations (i.e., Fox equation and Tanaka equation), values were analyzed by one-way analysis of variance (ANOVA), two-way ANOVA (males × age categories, females × age categories), and Bonferroni post hoc test. Furthermore, to perform the cross-validation procedure, we utilized the following three statistical analysis methods (i.e., mean absolute percent errors, Bland–Altman plots, and equivalence testing) to confirm the consistency between the measured HRmax and the two prediction equations: (1) The Bland–Altman plot was performed with corresponding parameters (i.e., intercept and slope) to demonstrate the general agreement with corresponding ± 95% limit of agreement with fitted lines (from regression analyses between mean and difference). (2) Equivalence testing was performed to examine the equivalence between the measured HRmax and the predicted HRmax. HRmax measured in each different method was demonstrated to be equivalent when the 90% confidence interval (CI) for the mean of the predicted HRmax was within the proposed equivalence limit (±10%) of the measured HRmax. Lastly, the current study conducted multiple regression methods to develop HRmax prediction equations. (3) To estimate errors between the HRmax calculated by two equations (i.e., Fox and Tanaka′s equation) and direct measured HRmax, Mean Absolute Percent Errors (MAPE) was used, which is a performance evaluation index that has been widely used to predict errors between the criterion method and other methods. In the simple regression, the dependent variable for the analysis was measured HRmax, and the independent variable was age. We investigated each separate different equation and used a Monte Carlo cross-validation procedure.

3. Results

Table 2 presents the comparison of average HRmax divided by gender and age in each different HRmax estimation method (i.e., direct measurement, Fox′s equation, and Tanaka′s equation). The overall HRmax of participants aged from 7 to 55 was significantly different from Fox′s prediction equation (p < 0.001). However, the measured HRmax of male participants showed significant differences compared to those obtained by Tanaka′s prediction equation (p < 0.001), and the measured HRmax of females indicated significant differences from both equations (i.e., Fox′s equation and Tanaka′s equation) (p < 0.001). In addition, when the measured HRmax and the HRmax predicted by formulas (i.e., Fox′s equation and Tanaka′s equation) were compared by age, the HRmax predicted by Fox′s equation significantly differed from measured HRmax in all age groups (p < 0.001) except for the boys aged from 7 to 14 (p = 1.000), and the HRmax predicted by Tanaka equation revealed significant differences with measured HRmax in all ages (p < 0.01). Specifically, the measured HRmax in boys aged from 7 to 14 was a significant difference from the Tanaka prediction formula (p < 0.001), while the male adults aged from 40 to 55 indicated a significant difference from Fox′s prediction formula (p < 0.05). Additionally, the measured HRmax of youth in males aged from 15 to 24 was a significant difference from both equations (p < 0.001 and p < 0.01), but adults aged from 25 to 39 had no significant difference from the two equations (p = 1.000 and p = 1.000). In females, only the measured HRmax of children aged from 7 to 14 had no significant difference from Fox′s prediction formula (p = 1.000).
Figure 1 illustrates the Bland–Altman plot, which is the extent of agreement between the criterion (i.e., directly measured HRmax) and each equation (i.e., Fox′s equation and Tanaka′s equation) by using the mean difference values to demonstrate the proportional systematic bias, and the 95% limits of agreement and line of best fit were marked. The Tanaka′s HRmax prediction equation had the best fit in mean of the difference closer to zero (mean = −0.1, difference = 40.2) compared to the Fox′s HRmax prediction equation (mean = −4.2, difference = 35.7). However, there was a different outcome of fit in the agreement of children aged from 7 to 14, in which Fox′s prediction equation had the best fit in the average of the difference closer to zero (mean = 0.1, difference = 3.1). The slope of the fitted line tended to increase in the positive direction in all age groups, and the measured HRmax of participants aged 15 or older and the HRmax predicted by each equation showed a significant difference (p < 0.001).
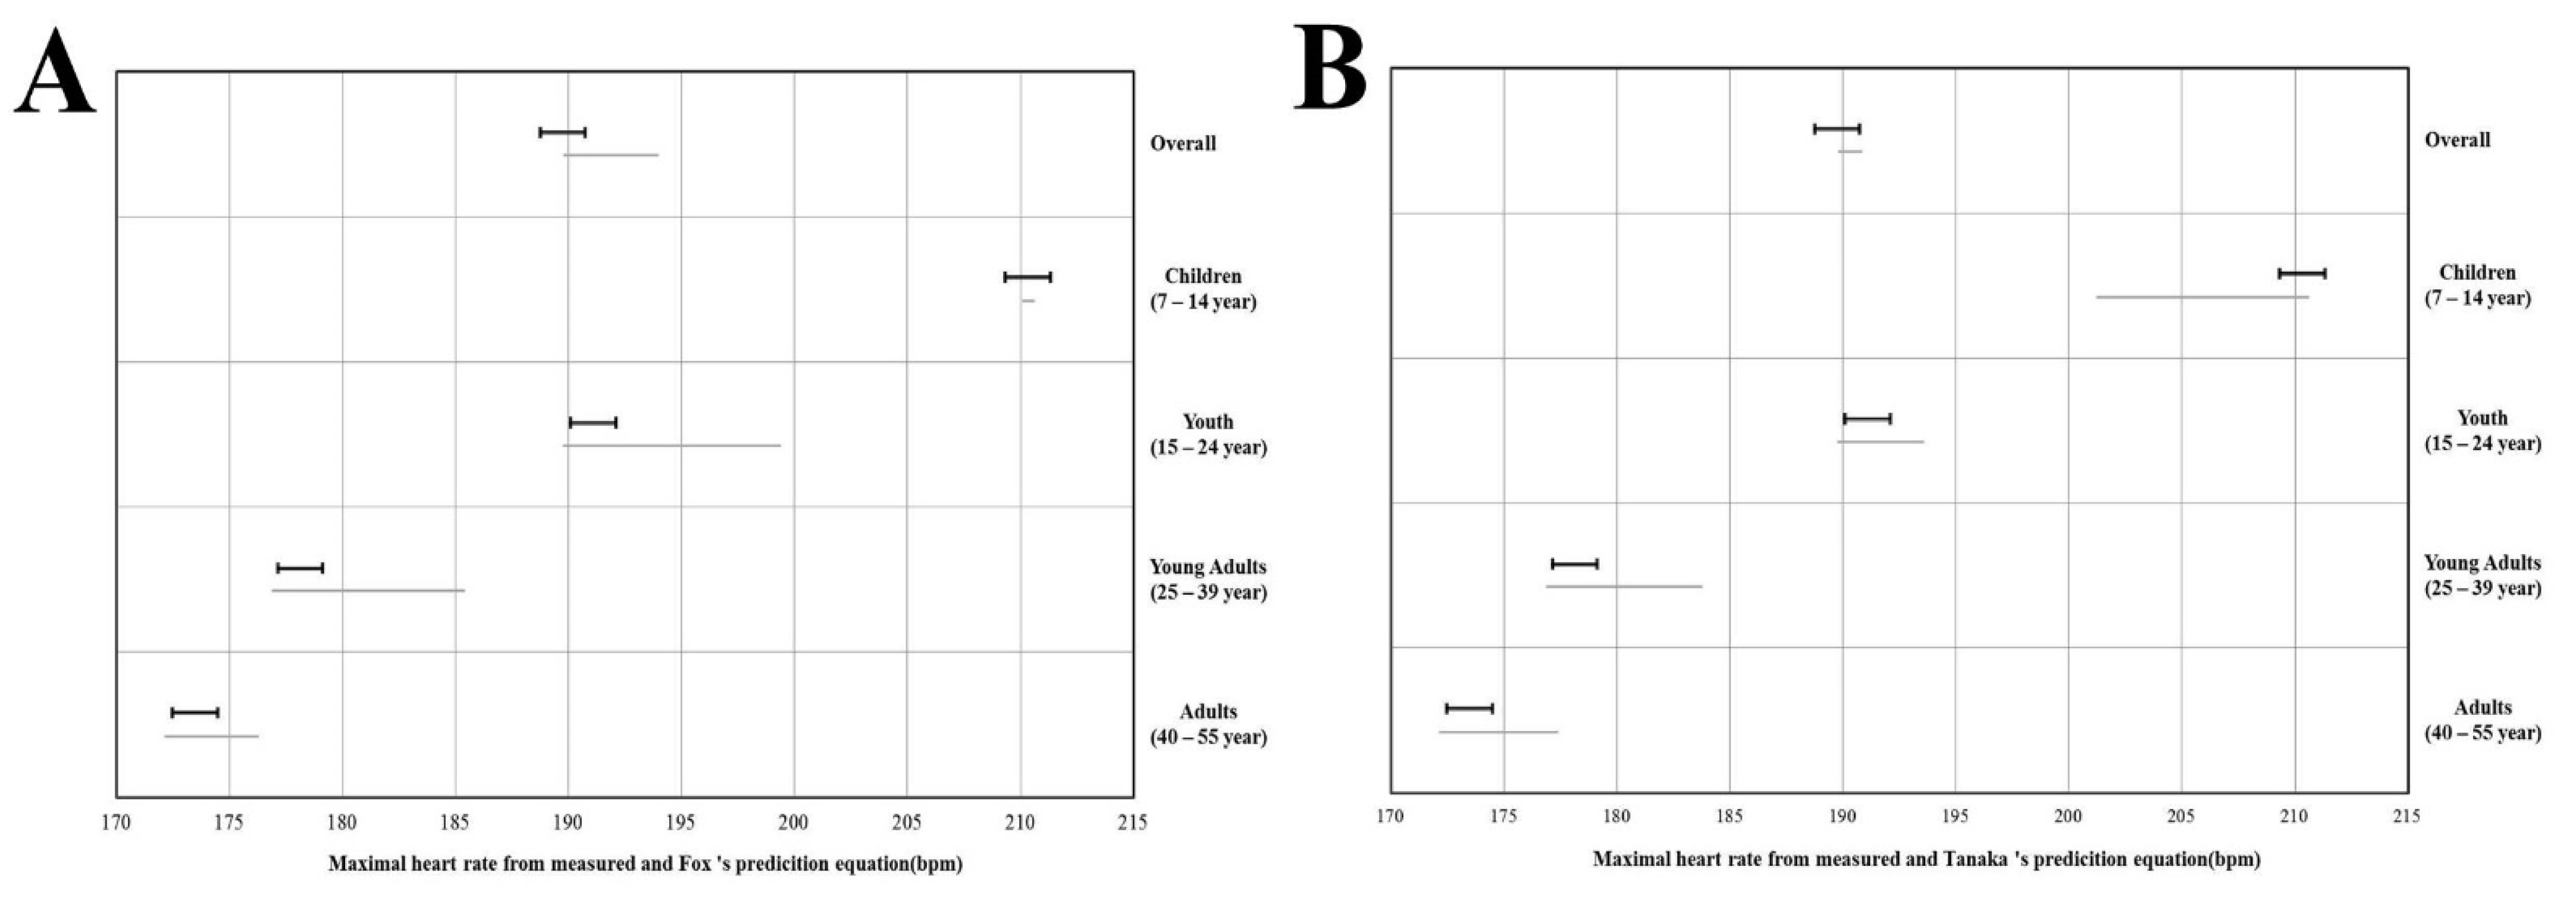
Figure 2 shows the equivalence testing, and it can be examined whether each prediction equation estimates were equivalent to the criterion HRmax. The HRmax evaluated by Fox′s prediction equation was completely included within the equivalence zone (±10% of the criterion measurement) only in children aged from 7 to 14, and all estimated values by Tanaka′s prediction equation were not fully included within the equivalence zone (±10% of the criterion measurement).
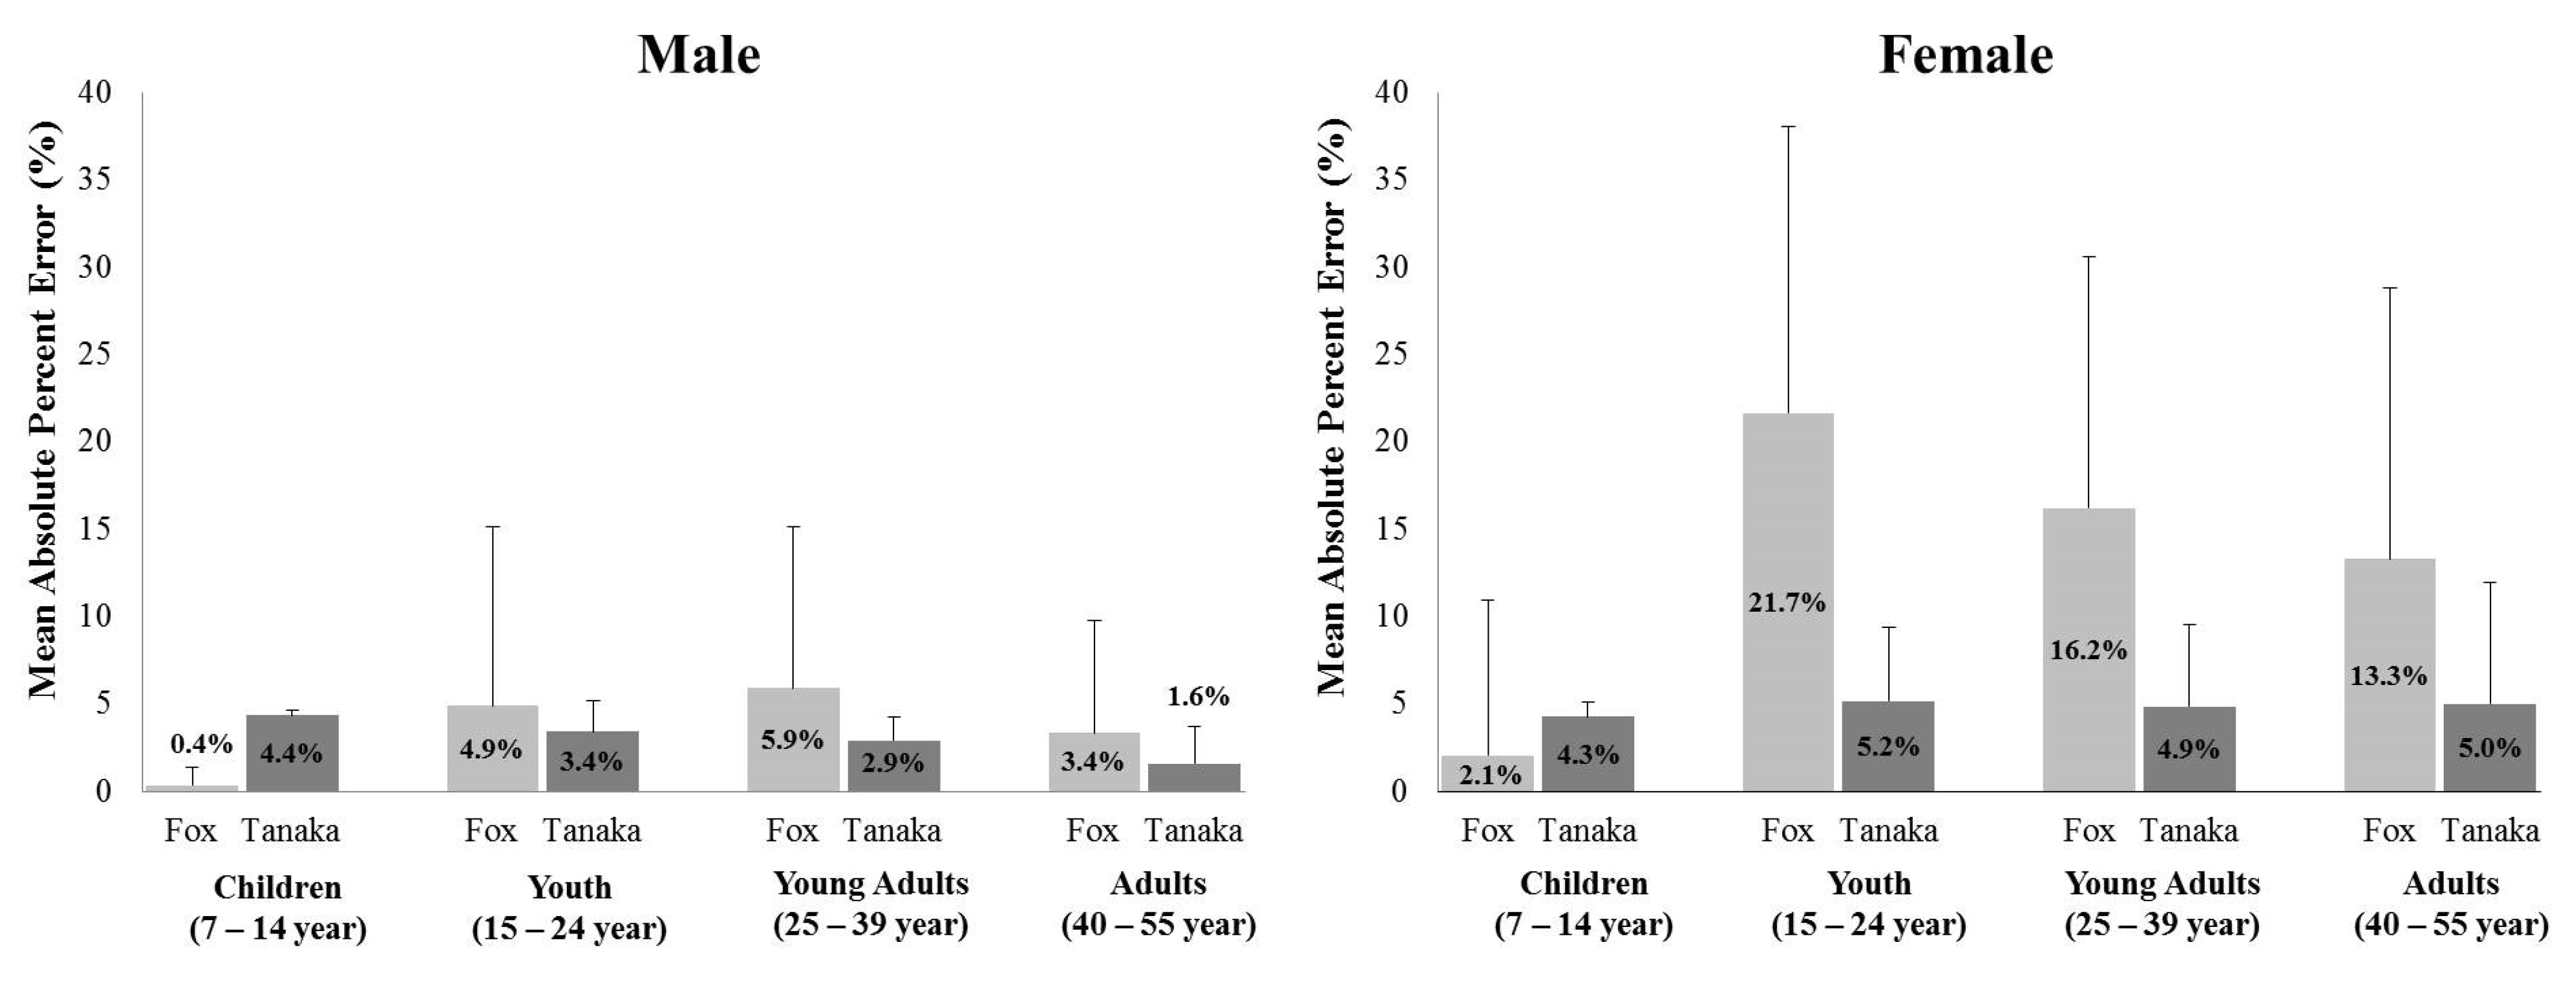
Specifically, Figure 3 reveals the Mean Absolute Percent Errors (MAPE) calculated to investigate the difference between the criterion and the equations for gender groups (males, n = 280 and females, n = 392). For both males and females, the measured HRmax of children aged from 7 to 14 indicated a higher MAPE in Tanaka′s formula (males: 4.4% and females: 4.3%) than the HRmax predicted by Fox′s formula (males: 0.4% and females: 2.1%), and the HRmax predicted by Fox′s formula in participants aged 15 or older showed a higher MAPE. In particular, the MAPE of females over 15 years of age revealed higher MAPE than that of males in both the values calculated by Fox′s prediction equation and Tanaka′s prediction equation.
Table 3 indicated the regression coefficients for the measured HRmax equations. While, the overall HRmax equation in male was F = 2037.760 (p < 0.001, adj R2 = 0.880, SEE = 4.154, Durbin–Watson = 0.940), the overall HRmax equation in female was F = 355.193 (p < 0.001, adj R2 = 0.475, SEE = 10.319, Durbin–Watson = 1.726). To be specific, boys aged from 7 to 14 indicated F = 8443.111 (p < 0.001, adj R2 = 0.980, SEE = 0.311, Durbin–Watson = 1.087), but girls aged from 7 to 14 indicated F = 17.603 (p < 0.001, adj R2 = 0.364, SEE = 1.869, Durbin–Watson = 2.191). Furthermore, HRmax equation of youth aged from 15 to 24 in male had F = 6.376 (p < 0.001, adj R2 = 0.081, SEE = 6.914, Durbin–Watson = 0.636) and in female was F = 5.796 (p < 0.001, adj R2 = 0.049, SEE = 10.170, Durbin–Watson = 1.590). Both young male and female adults in male and in female aged from 25 to 39 revealed F = 3.456 (p < 0.001, adj R2 = 0.260, SEE = 6.462, Durbin–Watson = 1.844) and F = 2.748 (p < 0.001, adj R2 = 0.012, SEE = 9.146, Durbin–Watson = 1.884), respectively. Male adults aged from 40 to 55 showed F = 4.447 (p < 0.001, adj R2 = 0.087, SEE = 4.994, Durbin–Watson = 1.943) and female adults aged from 40 to 55 indicated F = 1.838 (p < 0.001, adj R2 = 0.007, SEE = 10.968, Durbin–Watson = 2.200).

4. Discussion

The current study demonstrated the validity of HRmax predicted by Fox′s formula and Tanaka′s formula based on direct measured HRmax and developed new HRmax prediction equations for gender and age (i.e., 7–14 years, 15–24 years, 25–39 years, and 40–55 years) by using direct measured HRmax as a criterion.
When predicting HRmax with Fox′s equation, the present study found significant differences in all gender and age groups except for boys and girls and only male young adults. The most noticeable finding was a significant difference in females′ HRmax predicted by Fox′s equation and the measured HRmax. The reason is that since Fox′s HRmax prediction equation often has been applied to non-athletic males of a wide range of ages [35], females may have been underrepresented to predict HRmax based on the formula. Furthermore, the majority of research regarding Fox′s equation has reported that the equation had a standard deviation of about 7–13 bpm [2,20,21], which is consistent with the outcome overestimated approximately 9 bpm in the current study. This may not be suitable for predicting HRmax of the general population because Fox′s equation was determined based on a review of 10 studies without proper regression analysis and developed in older adults (over 60 years of age) with cardiovascular diseases. Even some studies have demonstrated equation had significantly over and/or underestimated HRmax in healthy younger and older adults [36,37,38], and our result was also consistent with the previous studies′ outcome by finding overestimating HRmax. Although Fox′s equation may seem appropriate for boys and girls aged from 7 to 14 years, the present study suggests that Fox′s equation developed in older adult populations with cardiovascular diseases should be applied with caution to the general population, especially healthy people.
Tanaka′s equation, one of the HRmax prediction equations, seemed to be suitable for predicting HRmax of the general population aged from 7 to 55 years who participated in the present study (p > 0.05), which is similar to previous studies [39]. Unfortunately, Tanaka′s equation is difficult to predict for specific populations as an equation of age-based HRmax. Unlike male adults over the age of 25, this study found that there were significant differences between HRmax measured directly and predicted by Tanaka′s equation in children (p < 0.001) and youth (p < 0.001). The finding might be because Tanaka′s equation was derived from adult populations aged from 20 to 81, excluding those younger than 20 years of age. In addition, HRmax predicted by Tanaka′s equation showed significant differences from the actual HRmax of females in all age groups, which indicated a discrepancy in the results of some existing literature [13,40]. Since the previous studies have investigated the validity of the existing formula on female athletes in America and/or Europe, and there were no studies that had developed the HRmax formula for females, an explanation of this discrepancy might be the different samples’ characteristics (i.e., general population and race). Therefore, our finding indicated that applying Tanaka′s equation to predict the HRmax of females needs to be careful and demonstrated that new equations for predicting the HRmax of females should be devised.
Overall, our study found significant differences between the direct measured HRmax and predicted HRmax by two equations in each different gender and most age groups, proving that it is not appropriate for the previously developed HRmax prediction equation to be applied equally to all age groups and each different gender. According to some studies, the fact that HRmax decreased with age may affect only adults more than children or adolescents [24,41,42]. However, the current study proved that HRmax in children, youth, and young adults had an association with age closely, but rather, HRmax in middle-aged adults over 40 years of age had a slightly low association with age compared to the other age groups. The finding might be suggested that not only age but also other factors such as gender, body fat percentage, and VO2max may affect HRmax in middle-aged adults.
The present study has the following positive strengths and limitations. To the best of our knowledge, no other studies have developed HRmax prediction equations separately by gender and specific age groups in the Asian population despite the HRmax prediction equation having been developed in several studies. Furthermore, the main findings of this study proved the need to develop new equations through cross-validity based on existing formulas (i.e., Fox′s equation and Tanaka′s equation) and provided new insights into the HRmax prediction equation. However, since our study demonstrated the validity between HRmax predicted by two different equations compared to the direct measured HRmax and developed new equations, future studies need to verify the validity of the HRmax prediction equation regarding gender and age groups developed in the current study. Additionally, the participants in this study were limited to Korean participants. Therefore, it is necessary to examine more evidence from various ethnicities and adequate sample sizes from the same perspective.

5. Conclusions

The study proved that both Fox and Tanaka′s equations tended to overestimate the HRmax for males and females over 15 years old, and two universal equations were not suitable to predict the HRmax of Koreans except for children aged from 7 to 14. Since most studies have developed and examined HRmax for Americans or Europeans, the new HRmax prediction equations suggested in this study will more accurately predict the HRmax for Asians. Additional analyses should explore the cross-validity based on the HRmax prediction equation by gender and age presented in the study.

Author Contributions

Data curation, J.-H.P. and H.C.J.; formal analysis, J.-H.P. and J.-M.L.; investigation, H.C.J. and Y.-S.J.; methodology, J.-H.P. and J.-K.S.; project administration, J.-M.L.; writing—original draft, J.-H.P.; writing—review and editing, H.C.J., Y.-S.J., J.-K.S. and J.-M.L. All authors have read and agreed to the published version of the manuscript.

Funding

This research was supported by Culture, Sports and Tourism R&D Program through the Korea Creative Content Agency grant funded by the Ministry of Culture, Sports, and Tourism in 2022 (SR202107004).

Institutional Review Board Statement

The study was approved by the Institutional Review Board at Kyung Hee University (KHU IRB 2014-G06).

Informed Consent Statement

All participants realized enough for the study′s purpose and signed written informed consent before participation.

Data Availability Statement

The datasets used and/or analyzed during the current study are available from the corresponding author on reasonable request.

Conflicts of Interest

The authors declare no conflict of interest.

References

  1. Hui, S.S.; Chan, J.W. The relationship between heart rate reserve and oxygen uptake reserve in children and adolescents. Res. Q Exerc. Sport 2006, 77, 41–49. [Google Scholar] [CrossRef] [PubMed]
  2. American College of Sports Medicine. ACSM’s Guidelines for Exercise Testing and Prescription; Lippincott Williams & Wilkins: Philadelphia, PA, USA, 2013. [Google Scholar]
  3. Mahon, A.D.; Marjerrison, A.D.; Lee, J.D.; Woodruff, M.E.; Hanna, L.E. Evaluating the prediction of maximal heart rate in children and adolescents. Res. Q. Exerc. Sport 2010, 81, 466–471. [Google Scholar] [CrossRef] [PubMed]
  4. Nes, B.M.; Janszky, I.; Wisløff, U.; Støylen, A.; Karlsen, T. Age-predicted maximal heart rate in healthy subjects: The HUNT fitness study. Scand. J. Med. Sci. Sports 2013, 23, 697–704. [Google Scholar] [CrossRef] [PubMed]
  5. Taylor, J.L.; Holland, D.J.; Spathis, J.G.; Beetham, K.S.; Wisløff, U.; Keating, S.E.; Coombes, J.S. Guidelines for the delivery and monitoring of high intensity interval training in clinical populations. Prog. Cardiovasc. Dis. 2019, 62, 140–146. [Google Scholar] [CrossRef] [PubMed]
  6. Albouaini, K.; Egred, M.; Alahmar, A.; Wright, D.J. Cardiopulmonary exercise testing and its application. Postgrad. Med. J. 2007, 83, 675–682. [Google Scholar] [CrossRef] [PubMed]
  7. Paridon, S.M.; Alpert, B.S.; Boas, S.R.; Cabrera, M.E.; Caldarera, L.L.; Daniels, S.R.; Kimball, T.R.; Knilans, T.K.; Nixon, P.A.; Rhodes, J. Clinical stress testing in the pediatric age group: A statement from the American Heart Association Council on Cardiovascular Disease in the Young, Committee on Atherosclerosis, Hypertension, and Obesity in Youth. Circulation 2006, 113, 1905–1920. [Google Scholar] [CrossRef] [Green Version]
  8. Washington, R.L.; Bricker, J.T.; Alpert, B.S.; Daniels, S.R.; Deckelbaum, R.J.; Fisher, E.A.; Gidding, S.S.; Isabel-Jones, J.; Kavey, R.E.; Marx, G.R. Guidelines for exercise testing in the pediatric age group. From the Committee on Atherosclerosis and Hypertension in Children, Council on Cardiovascular Disease in the Young, the American Heart Association. Circulation 1994, 90, 2166–2179. [Google Scholar] [CrossRef] [Green Version]
  9. Nikolaidis, P.T.; Rosemann, T.; Knechtle, B. Age-Predicted Maximal Heart Rate in Recreational Marathon Runners: A Cross-Sectional Study on Fox’s and Tanaka’s Equations. Front. Physiol. 2018, 9, 226. [Google Scholar] [CrossRef] [Green Version]
  10. Robinson, S. Experimental studies of physical fitness in relation to age. Arbeitsphysiologie 1938, 10, 251–323. [Google Scholar] [CrossRef]
  11. Åstrand, P.-O. Experimental Studies of Physical Working Capacity in Relation to Sex and Age; Munksgaard Forlag: Copenhagen, Denmark, 1952. [Google Scholar]
  12. Fairbarn, M.S.; Blackie, S.P.; McElvaney, N.G.; Wiggs, B.R.; Paré, P.D.; Pardy, R.L. Prediction of Heart Rate and Oxygen Uptake During Incremental and Maximal Exercise in Healthy Adults. Chest 1994, 105, 1365–1369. [Google Scholar] [CrossRef]
  13. Gulati, M.; Shaw, L.J.; Thisted, R.A.; Black, H.R.; Bairey Merz, C.N.; Arnsdorf, M.F. Heart rate response to exercise stress testing in asymptomatic women: The St. James women take heart project. Circulation 2010, 122, 130–137. [Google Scholar] [CrossRef] [PubMed] [Green Version]
  14. Blair, S.; Lavey, R.; Goodyear, N.; Gibbons, L.; Cooper, K. Physiologic responses to maximal graded exercise testing in apparently healthy white women aged 18 to 75 years. J. Card. Rehabil. 1984, 4, 459–468. [Google Scholar]
  15. Engels, H.-J.; Zhu, W.; Moffatt, R.J. An Empirical Evaluation of the Prediction of Maximal Heart Rate. Res. Q. Exerc. Sport 1998, 69, 94–98. [Google Scholar] [CrossRef] [PubMed]
  16. Whaley, M.H.; Kaminsky, L.A.; Dwyer, G.B.; Getchell, L.H.; Norton, J.A. Predictors of over-and underachievement of age-predicted maximal heart rate. Med. Sci. Sports Exerc. 1992, 24, 1173–1179. [Google Scholar] [CrossRef]
  17. Fox, S., 3rd; Naughton, J.P.; Haskell, W. Physical activity and the prevention of coronary heart disease. Ann. Clin. Res. 1971, 3, 404–432. [Google Scholar]
  18. Tanaka, H.; Monahan, K.D.; Seals, D.R. Age-predicted maximal heart rate revisited. J. Am. Coll. Cardiol. 2001, 37, 153–156. [Google Scholar] [CrossRef] [Green Version]
  19. Franckowiak, S.C.; Dobrosielski, D.A.; Reilley, S.M.; Walston, J.D.; Andersen, R.E. Maximal heart rate prediction in adults that are overweight or obese. J. Strength Cond. Res. Natl. Strength Cond. Assoc. 2011, 25, 1407. [Google Scholar] [CrossRef] [Green Version]
  20. Esco, M.R.; Chamberlain, N.; Flatt, A.A.; Snarr, R.L.; Bishop, P.A.; Williford, H.N. Cross-Validation of Age-Predicted Maximal Heart Rate Equations among Female Collegiate Athletes. J. Strength Cond. Res. 2015, 29, 3053–3059. [Google Scholar] [CrossRef]
  21. Robergs, R.A.; Landwehr, R. The surprising history of the “HRmax = 220-age” equation. J. Exerc. Physiol. Online 2002, 5, 1–10. [Google Scholar]
  22. Gelbart, M.; Ziv-Baran, T.; Williams, C.A.; Yarom, Y.; Dubnov-Raz, G. Prediction of Maximal Heart Rate in Children and Adolescents. Clin. J. Sport Med. Off. J. Can. Acad. Sport Med. 2017, 27, 139–144. [Google Scholar] [CrossRef]
  23. Paap, D.; Takken, T. Reference values for cardiopulmonary exercise testing in healthy adults: A systematic review. Expert Rev. Cardiovasc. Ther. 2014, 12, 1439–1453. [Google Scholar] [CrossRef]
  24. Machado, F.A.; Denadai, B.S. Validity of maximum heart rate prediction equations for children and adolescents. Arq. Bras. De Cardiol. 2011, 97, 136–140. [Google Scholar] [CrossRef] [PubMed] [Green Version]
  25. Powers, S.K.; Howley, E.T.; Quindry, J. Exercise Physiology: Theory and Application to Fitness and Performance; McGraw-Hill: New York, NY, USA, 2007. [Google Scholar]
  26. Hur, Y.-M.; Kaprio, J.; Iacono, W.G.; Boomsma, D.I.; McGue, M.; Silventoinen, K.; Martin, N.G.; Luciano, M.; Visscher, P.M.; Rose, R.J.; et al. Genetic influences on the difference in variability of height, weight and body mass index between Caucasian and East Asian adolescent twins. Int. J. Obes. 2008, 32, 1455–1467. [Google Scholar] [CrossRef] [PubMed] [Green Version]
  27. O’Neal, W.T.; Alam, A.B.; Sandesara, P.B.; Claxton, J.S.; MacLehose, R.F.; Chen, L.Y.; Bengtson, L.G.S.; Chamberlain, A.M.; Norby, F.L.; Lutsey, P.L.; et al. Sex and racial differences in cardiovascular disease risk in patients with atrial fibrillation. PLoS ONE 2019, 14, e0222147. [Google Scholar] [CrossRef] [Green Version]
  28. Egan, K.J.; Knutson, K.L.; Pereira, A.C.; von Schantz, M. The role of race and ethnicity in sleep, circadian rhythms and cardiovascular health. Sleep Med. Rev. 2017, 33, 70–78. [Google Scholar] [CrossRef] [PubMed] [Green Version]
  29. Ahmad, O.B.; Boschi-Pinto, C.; Lopez, A.D.; Murray, C.J.; Lozano, R.; Inoue, M. Age Standardization of Rates: A New WHO Standard; World Health Organization: Geneva, Switzerland, 2001; Volume 9, pp. 1–14. [Google Scholar]
  30. Eisenmann, J.C.; Brisko, N.; Shadrick, D.; Welsh, S. Comparative analysis of the Cosmed Quark b2 and K4b2 gas analysis systems during submaximal exercise. J. Sports Med. Phys. Fit. 2003, 43, 150–155. [Google Scholar]
  31. Bruce, R.A.; Blackmon, J.R.; Jones, J.W.; Strait, G. Exercising testing in adult normal subjects and cardiac patients. Pediatrics 1963, 32, 742–756. [Google Scholar] [CrossRef]
  32. Engström, E.; Ottosson, E.; Wohlfart, B.; Grundström, N.; Wisén, A. Comparison of heart rate measured by Polar RS400 and ECG, validity and repeatability. Adv. Physiother. 2012, 14, 115–122. [Google Scholar] [CrossRef] [Green Version]
  33. de Rezende Barbosa, M.P.d.C.; Silva, N.T.d.; de Azevedo, F.M.; Pastre, C.M.; Vanderlei, L.C.M. Comparison of Polar® RS 800G3™ heart rate monitor with P olar® S810i™ and electrocardiogram to obtain the series of RR intervals and analysis of heart rate variability at rest. Clin. Physiol. Funct. Imaging 2016, 36, 112–117. [Google Scholar] [CrossRef]
  34. Stahl, S.E.; An, H.-S.; Dinkel, D.M.; Noble, J.M.; Lee, J.-M. How accurate are the wrist-based heart rate monitors during walking and running activities? Are they accurate enough? BMJ Open Sport Exerc. Med. 2016, 2, e000106. [Google Scholar] [CrossRef] [PubMed] [Green Version]
  35. Cleary, M.A.; Hetzler, R.K.; Wages, J.J.; Lentz, M.A.; Stickley, C.D.; Kimura, I.F. Comparisons of Age-Predicted Maximum Heart Rate Equations in College-Aged Subjects. J. Strength Cond. Res. 2011, 25, 2591–2597. [Google Scholar] [CrossRef] [PubMed]
  36. Gellish, R.L.; Goslin, B.R.; Olson, R.E.; McDONALD, A.; Russi, G.D.; Moudgil, V.K. Longitudinal Modeling of the Relationship between Age and Maximal Heart Rate. Med. Sci. Sports Exerc. 2007, 39, 822–829. [Google Scholar] [CrossRef] [PubMed]
  37. Nikolaidis, P.; Padulo, J.; Chtourou, H.; Torres-Luque, G.; Afonso, J.; Heller, J. Estimating Maximal Heart Rate with the ‘220-Age’ Formula in Adolescent Female Volleyball Players: A Preliminary Study. Hum. Mov. 2014, 15, 166–170. [Google Scholar] [CrossRef] [Green Version]
  38. Sarzynski, M.; Rankinen, T.; Earnest, C.; Leon, A.; Rao, D.; Skinner, J.; Bouchard, C. Measured maximal heart rates compared to commonly used age-based prediction equations in the heritage family study. Am. J. Hum. Biol. 2013, 25, 695–701. [Google Scholar] [CrossRef] [Green Version]
  39. Cicone, Z.S.; Holmes, C.J.; Fedewa, M.V.; MacDonald, H.; Esco, M.R. Age-Based Prediction of Maximal Heart Rate in Children and Adolescents: A Systematic Review and Meta-Analysis. Res. Q. Exerc. Sport 2019, 90, 417–428. [Google Scholar] [CrossRef]
  40. Papadopoulou, S.D.; Papadopoulou, S.K.; Alipasali, F.; Hatzimanouil, D.; Rosemann, T.; Knechtle, B.; Nikolaidis, P.T. Validity of Prediction Equations of Maximal Heart Rate in Physically Active Female Adolescents and the Role of Maturation. Medicina 2019, 55, 735. [Google Scholar] [CrossRef] [Green Version]
  41. Fernhall, B.; McCubbin, J.A.; Pitetti, K.H.; Rintala, P.; Rimmer, J.H.; Millar, A.L.; De Silva, A. Prediction of maximal heart rate in individuals with mental retardation. Med. Sci. Sports Exerc. 2001, 33, 1655–1660. [Google Scholar] [CrossRef]
  42. Froelicher, V.; Myers, J. Exercise and the Heart, 4th ed.; WB Saunders: Philadelphia, PA, USA, 2000. [Google Scholar]
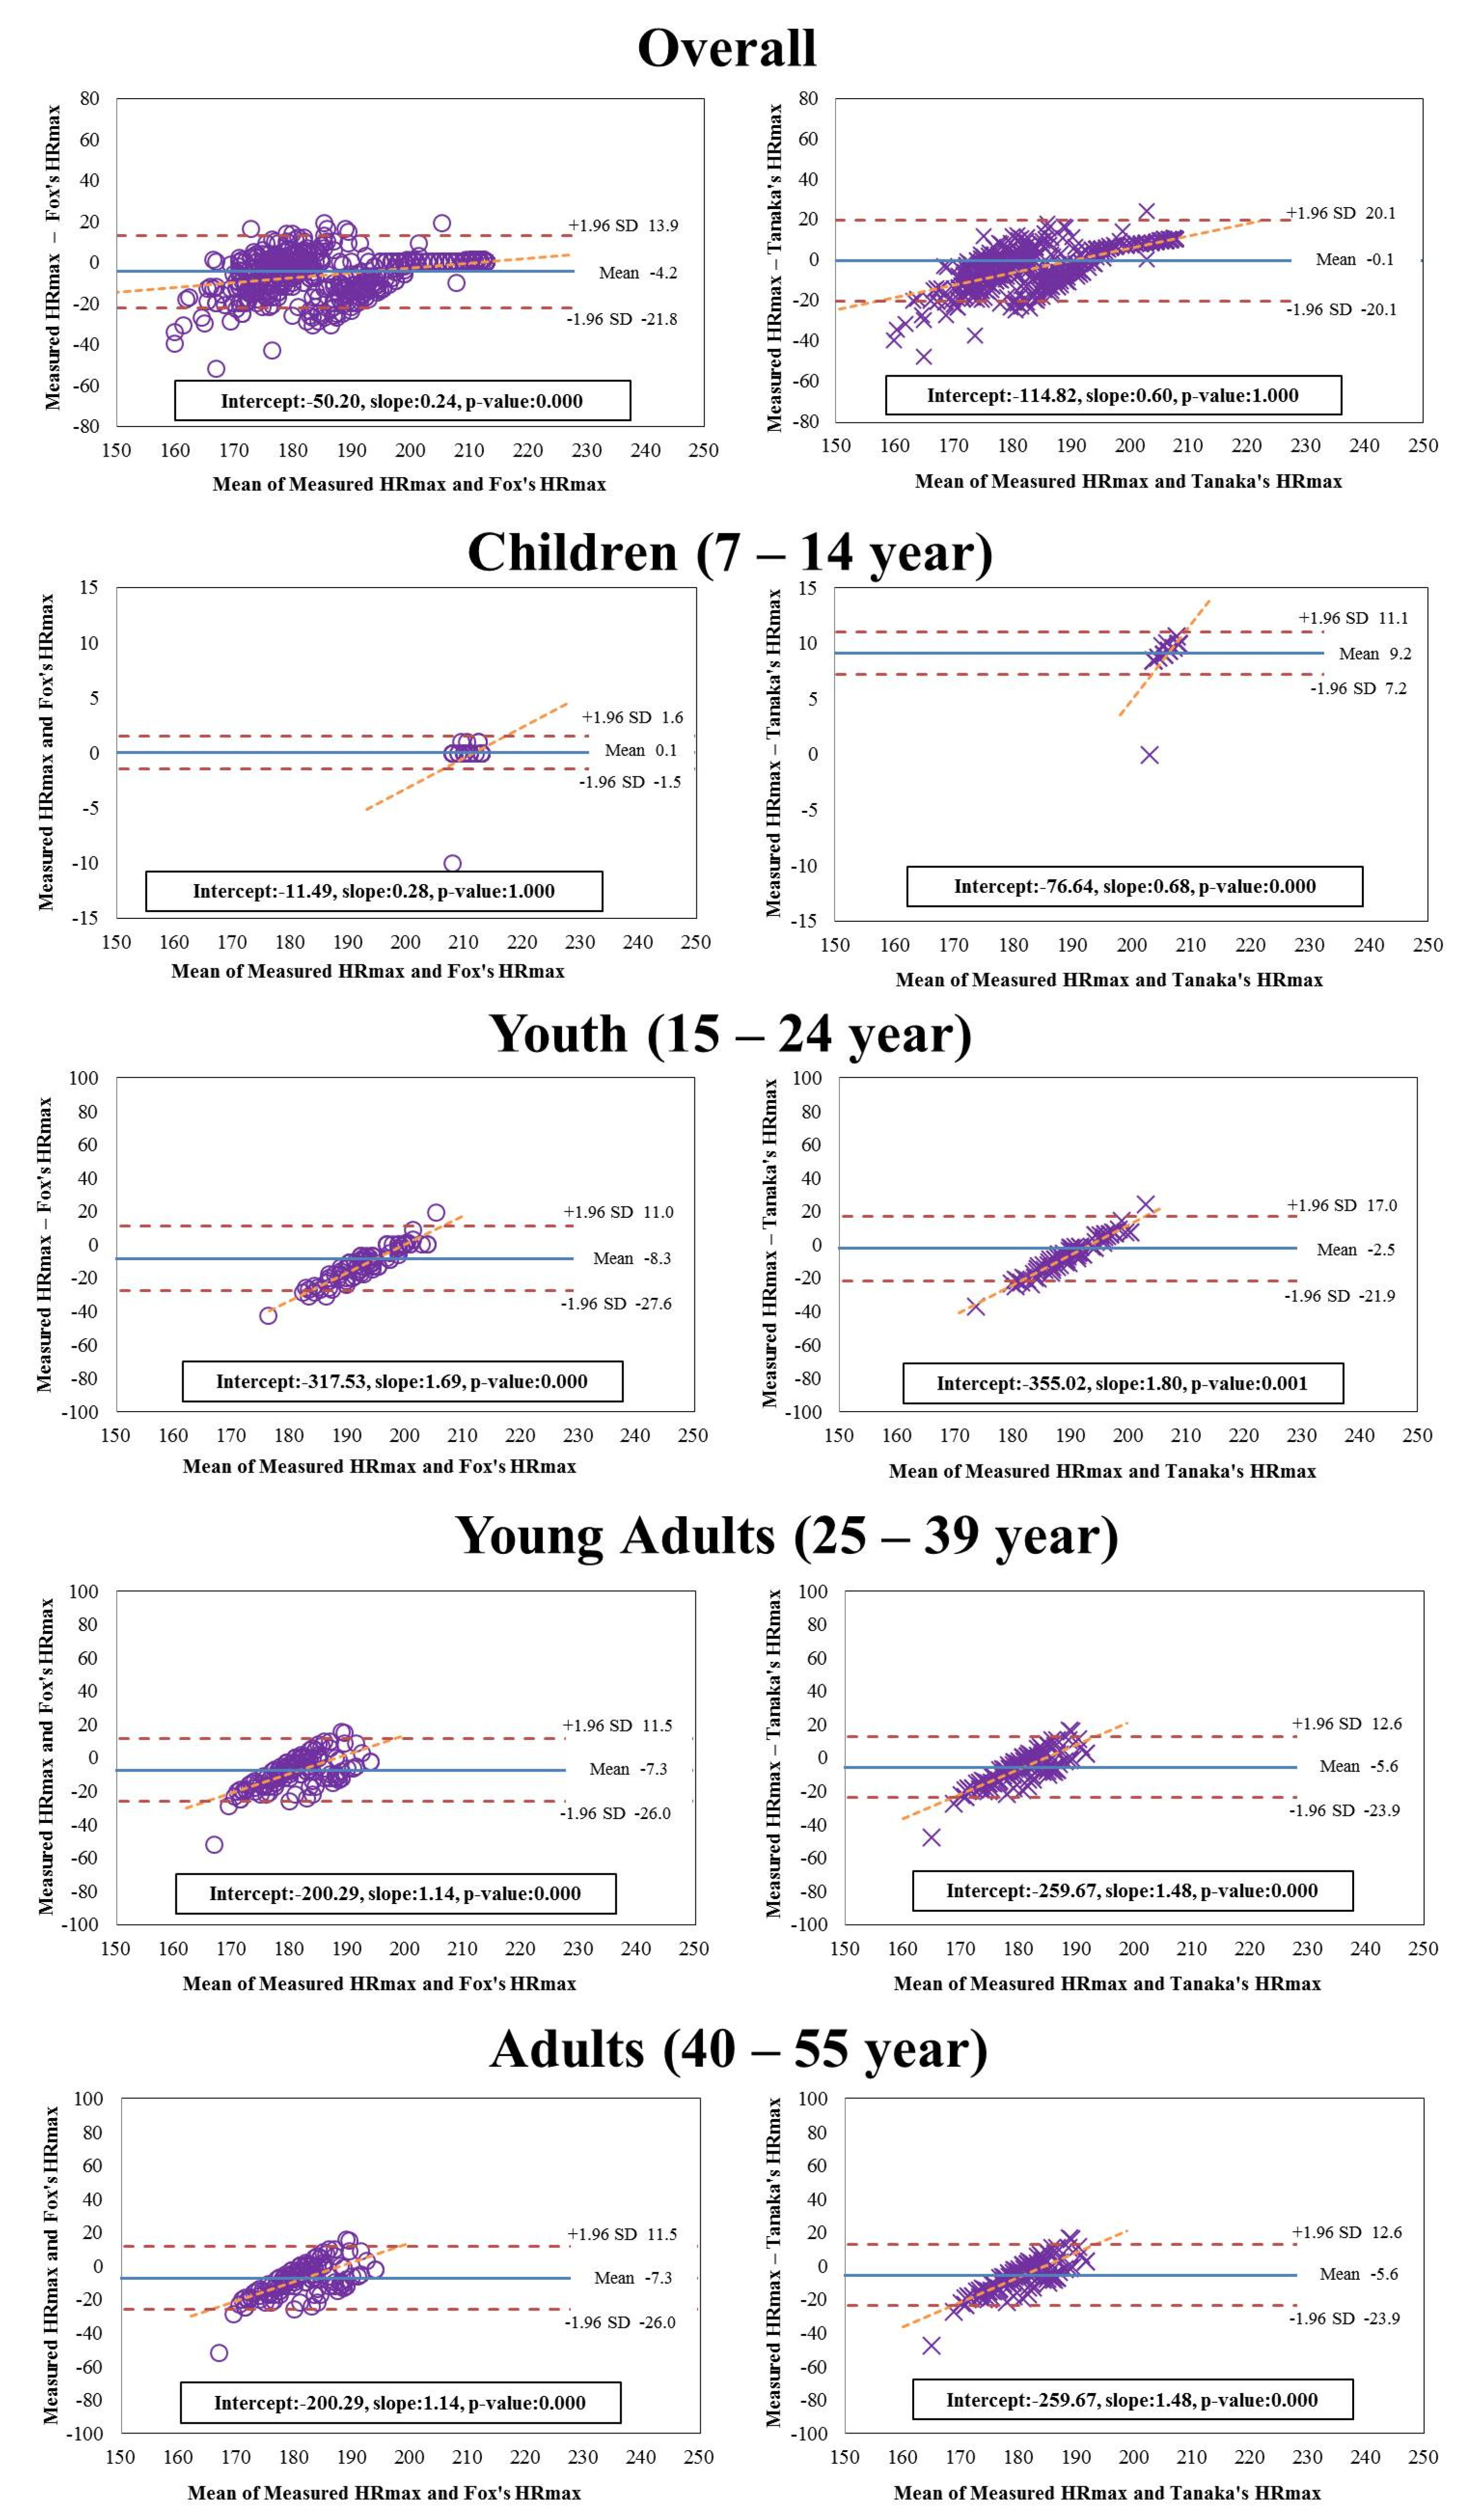
Figure 1. Bland–Altman plots for maximal heart rate estimated by Fox′s equation and Tanaka′s equation based on direct measured maximal heart rate.
Ijerph 19 08509 g001
Figure 2. Dark lines mean equivalence zone (±10% of the mean). Grey lines are the 90% confidence interval for a mean of the estimated maximal heart rate prediction equation. (A) Equivalence testing in maximal heart rate measured by direct measurement and Fox′s equation; (B) equivalence testing in maximal heart rate measured by direct measurement and Tanaka′s equation.
Ijerph 19 08509 g002
Figure 3. Mean absolute percentage error (MAPE) of maximal heart rate for Fox′s equation and Tanaka′s equation based on direct measured maximal heart rate.
Ijerph 19 08509 g003
Table 1. Participants’ characteristics (n = 672).
VariablesAll Participants
No. (%)Mean ± SD
Anthropometrics × AgeHeight (cm)7–14 144.22 ± 14.35
15–24 167.69 ± 7.88
25–39 162.54 ± 5.55
40–55 163.45 ± 7.96
Weight (kg)7–14 39.62 ± 17.96
15–24 62.66 ± 10.36
25–39 59.01 ± 9.21
40–55 64.35 ± 11.53
BMI (kg·m−2)7–14 18.14 ± 4.27
15–24 22.13 ± 2.63
25–39 22.27 ± 3.21
40–55 23.92 ± 3.27
maximal exercise Responses × AgeHRmax (bpm)7–14 209.89 ± 7.12
15–24 201.12 ± 13.81
25–39 193.64 ± 18.96
40–55 189.90 ± 21.40
VO2max (mL·kg−1·min−1)7–14 53.76 ± 9.20
15–24 46.05 ± 12.30
25–39 34.08 ± 6.45
40–55 33.22 ± 7.21
Respiratory exchange ratio7–14 1.17 ± 0.13
15–24 1.22 ± 0.14
25–39 1.18 ± 0.08
40–55 1.18 ± 0.09
SD—standard deviation, BMI—body mass index; HRmax—maximal heart rate; VO2max—maximal oxygen uptake.
Table 2. Average of HRmax divided by gender, age, and gender × age in each different HRmax equation (Mean ± SD).
VariablesMeasured HRmaxFox′s HRmaxTanaka′s HRmax
Overall189.77 ± 17.17193.99 ± 13.74 ***189.79 ± 9.67
GenderMale 202.56 ± 11.96202.98 ± 11.63196.08 ± 8.14 ***
Female 180.63 ± 14.24187.57 ± 11.31 ***185.29 ± 7.91 ***
Age (year)7–14 210.35 ± 2.22210.29 ± 2.11201.20 ± 1.47 ***
15–24 191.11 ± 10.34199.41 ± 2.35 ***193.59 ± 1.64 **
25–39 178.15 ± 9.46185.41 ± 4.57 ***183.79 ± 3.20 ***
40–55 173.49 ± 10.40176.29 ± 3.11 ***177.40 ± 2.18 ***
Gender × AgeMale7–14210.32 ± 2.20210.21 ± 2.13201.14 ± 1.49 ***
15–24196.76 ± 7.21200.05 ± 2.64 ***194.03 ± 1.85 **
25–39189.13 ± 7.51190.25 ± 5.97187.17 ± 4.17
40–55178.95 ± 5.22176.86 ± 2.41 *177.80 ± 1.69
Female7–14210.57 ± 2.34210.77 ± 1.87201.53 ± 1.30 ***
15–24187.38 ± 10.42198.99 ± 2.03 ***193.29 ± 1.42 ***
25–39177.54 ± 9.20185.15 ± 4.35 ***183.60 ± 3.04 ***
40–55171.86 ± 11.05176.11 ± 3.27 ***177.27 ± 2.29 ***
SD—standard deviation; HRmax—maximal heart rate. *** p < 0.001, ** p < 0.01, and * p < 0.05.
Table 3. Regression coefficients for estimating maximal heart rate.
VariablesParameterHRmax Regression EquationNew HRmax Prediction Equation
Coefficients (95% CI)Standard Error
OverallMaleIntercept218.984 (218.117 to 219.851)0.440219 − age
Age−0.965 (−1.007 to −0.923)0.021
FemaleIntercept208.830 (205.715 to 211.945)1.584209 − (0.9 × age)
Age−0.869 (−0.960 to −0.779)0.046
ChildrenMaleIntercept220.310 (220.090 to 220.529)0.111220 − age
Age−1.020 (−1.042 to −0.998)0.011
FemaleIntercept217.760 (214.179 to 221.340)1.748218 − (0.8 × age)
Age−0.779 (−1.159 to −0.399)0.186
YouthMaleIntercept213.619 (200.147 to 227.090)6.735214 − (0.8 × age)
Age−0.845 (−1.515 to −0.176)0.335
FemaleIntercept213.600 (191.871 to 235.328)10.940214 − (1.2 × age)
Age−1.248 (−2.277 to −0.218)0.518
Young AdultsMaleIntercept211.751 (181.448 to 242.053)12.384212 − (0.8 × age)
Age−0.761 (−1.762 to 0.241)0.409
FemaleIntercept187.700 (175.492 to 199.907)6.175189 − (0.3 × age)
Age−0.291 (−0.639 to 0.056)0.176
AdultsMaleIntercept210.269 (180.067 to 240.471)14.877210 − (0.7 × age)
Age−0.726 (−1.425 to −0.027)0.344
FemaleIntercept189.836 (163.521 to 216.150)13.293190 − (0.4 × age)
Age−0.410 (−1.007 to 0.188)0.302
SD—standard deviation; CI—confidence interval; HRmax—maximal heart rate; Overall—from 7 to 55 years old; Children—from 7 to 14 years old; Youth—from 15 to 24 years old; Young Adults—from 25 to 39 years old; Adults—from 40 to 55 years old.
Publisher’s Note: MDPI stays neutral with regard to jurisdictional claims in published maps and institutional affiliations.