
Multi-Scenario Simulation of Land Use and Habitat Quality in the Guanzhong Plain Urban Agglomeration, China


Abstract
:1. Introduction
2. Literature Review and Research Framework
2.1. Literature Review
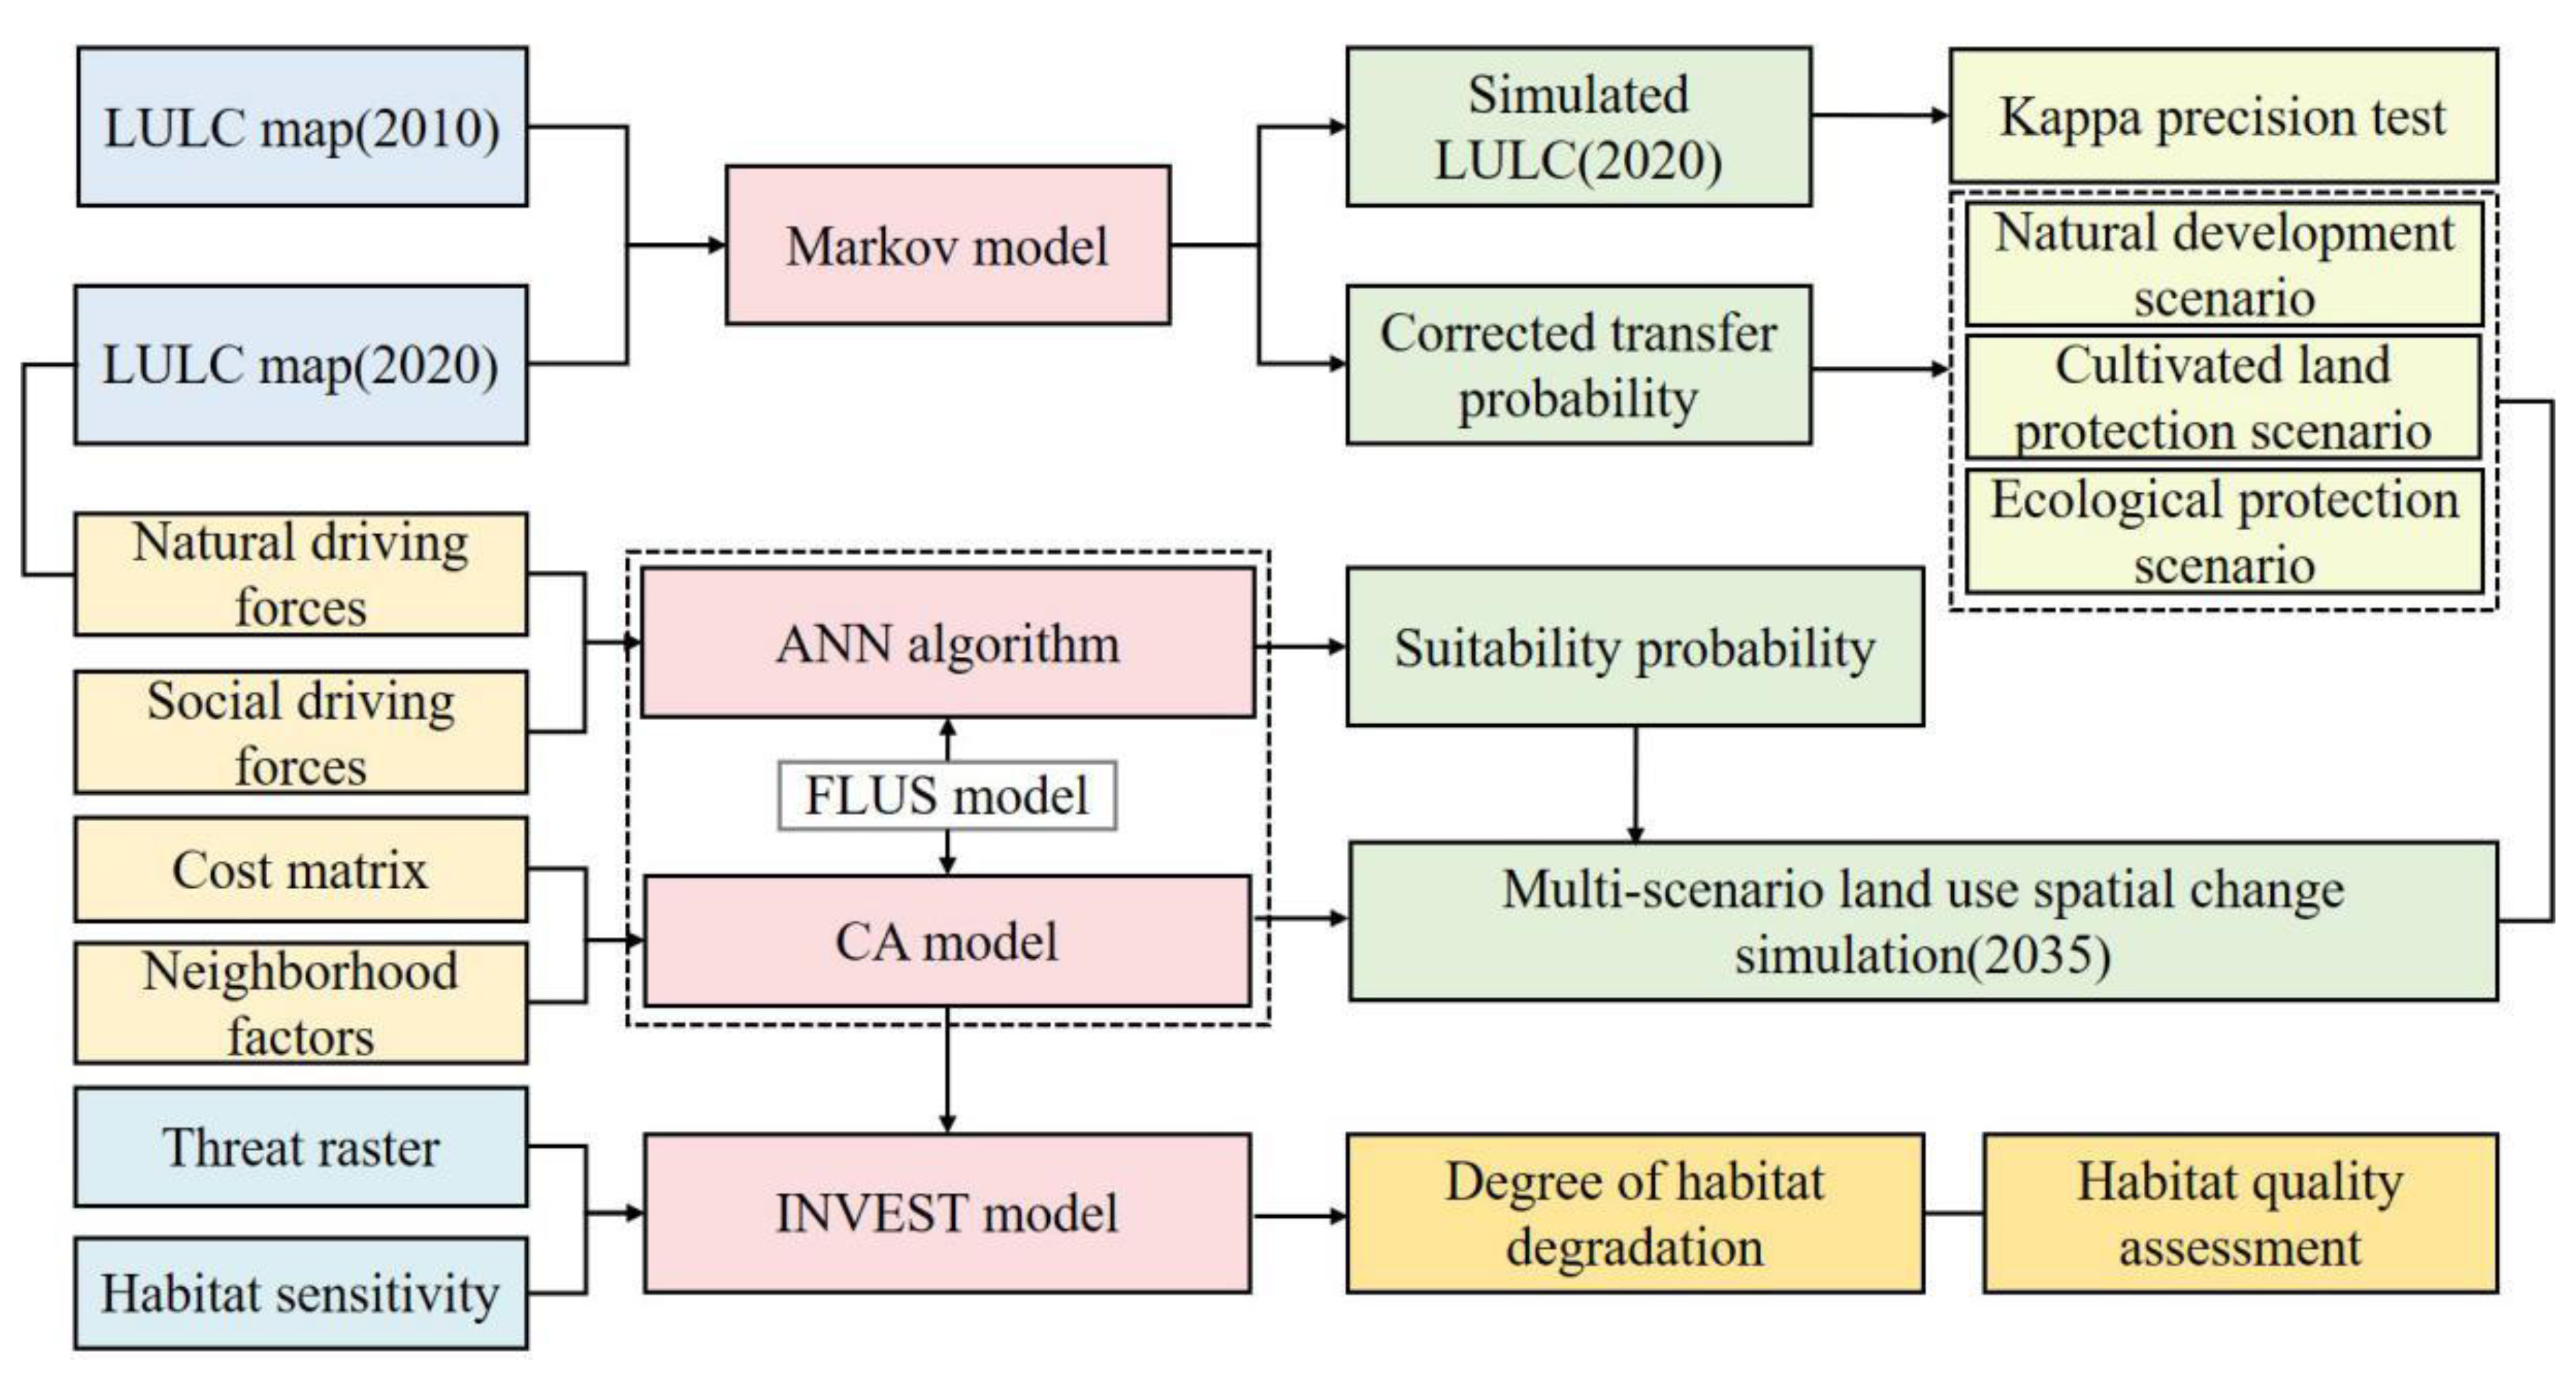
2.2. Research Framework
3. Materials and Methods
3.1. The Study Area
3.2. Data Sources
3.3. Methodology
3.3.1. Land-Use Change Scenario Settings
3.3.2. Land-Use Change Simulation Based on Markov–FLUS Model
- (1)
- Land-use quantity demand simulation using the Markov model.
- (2)
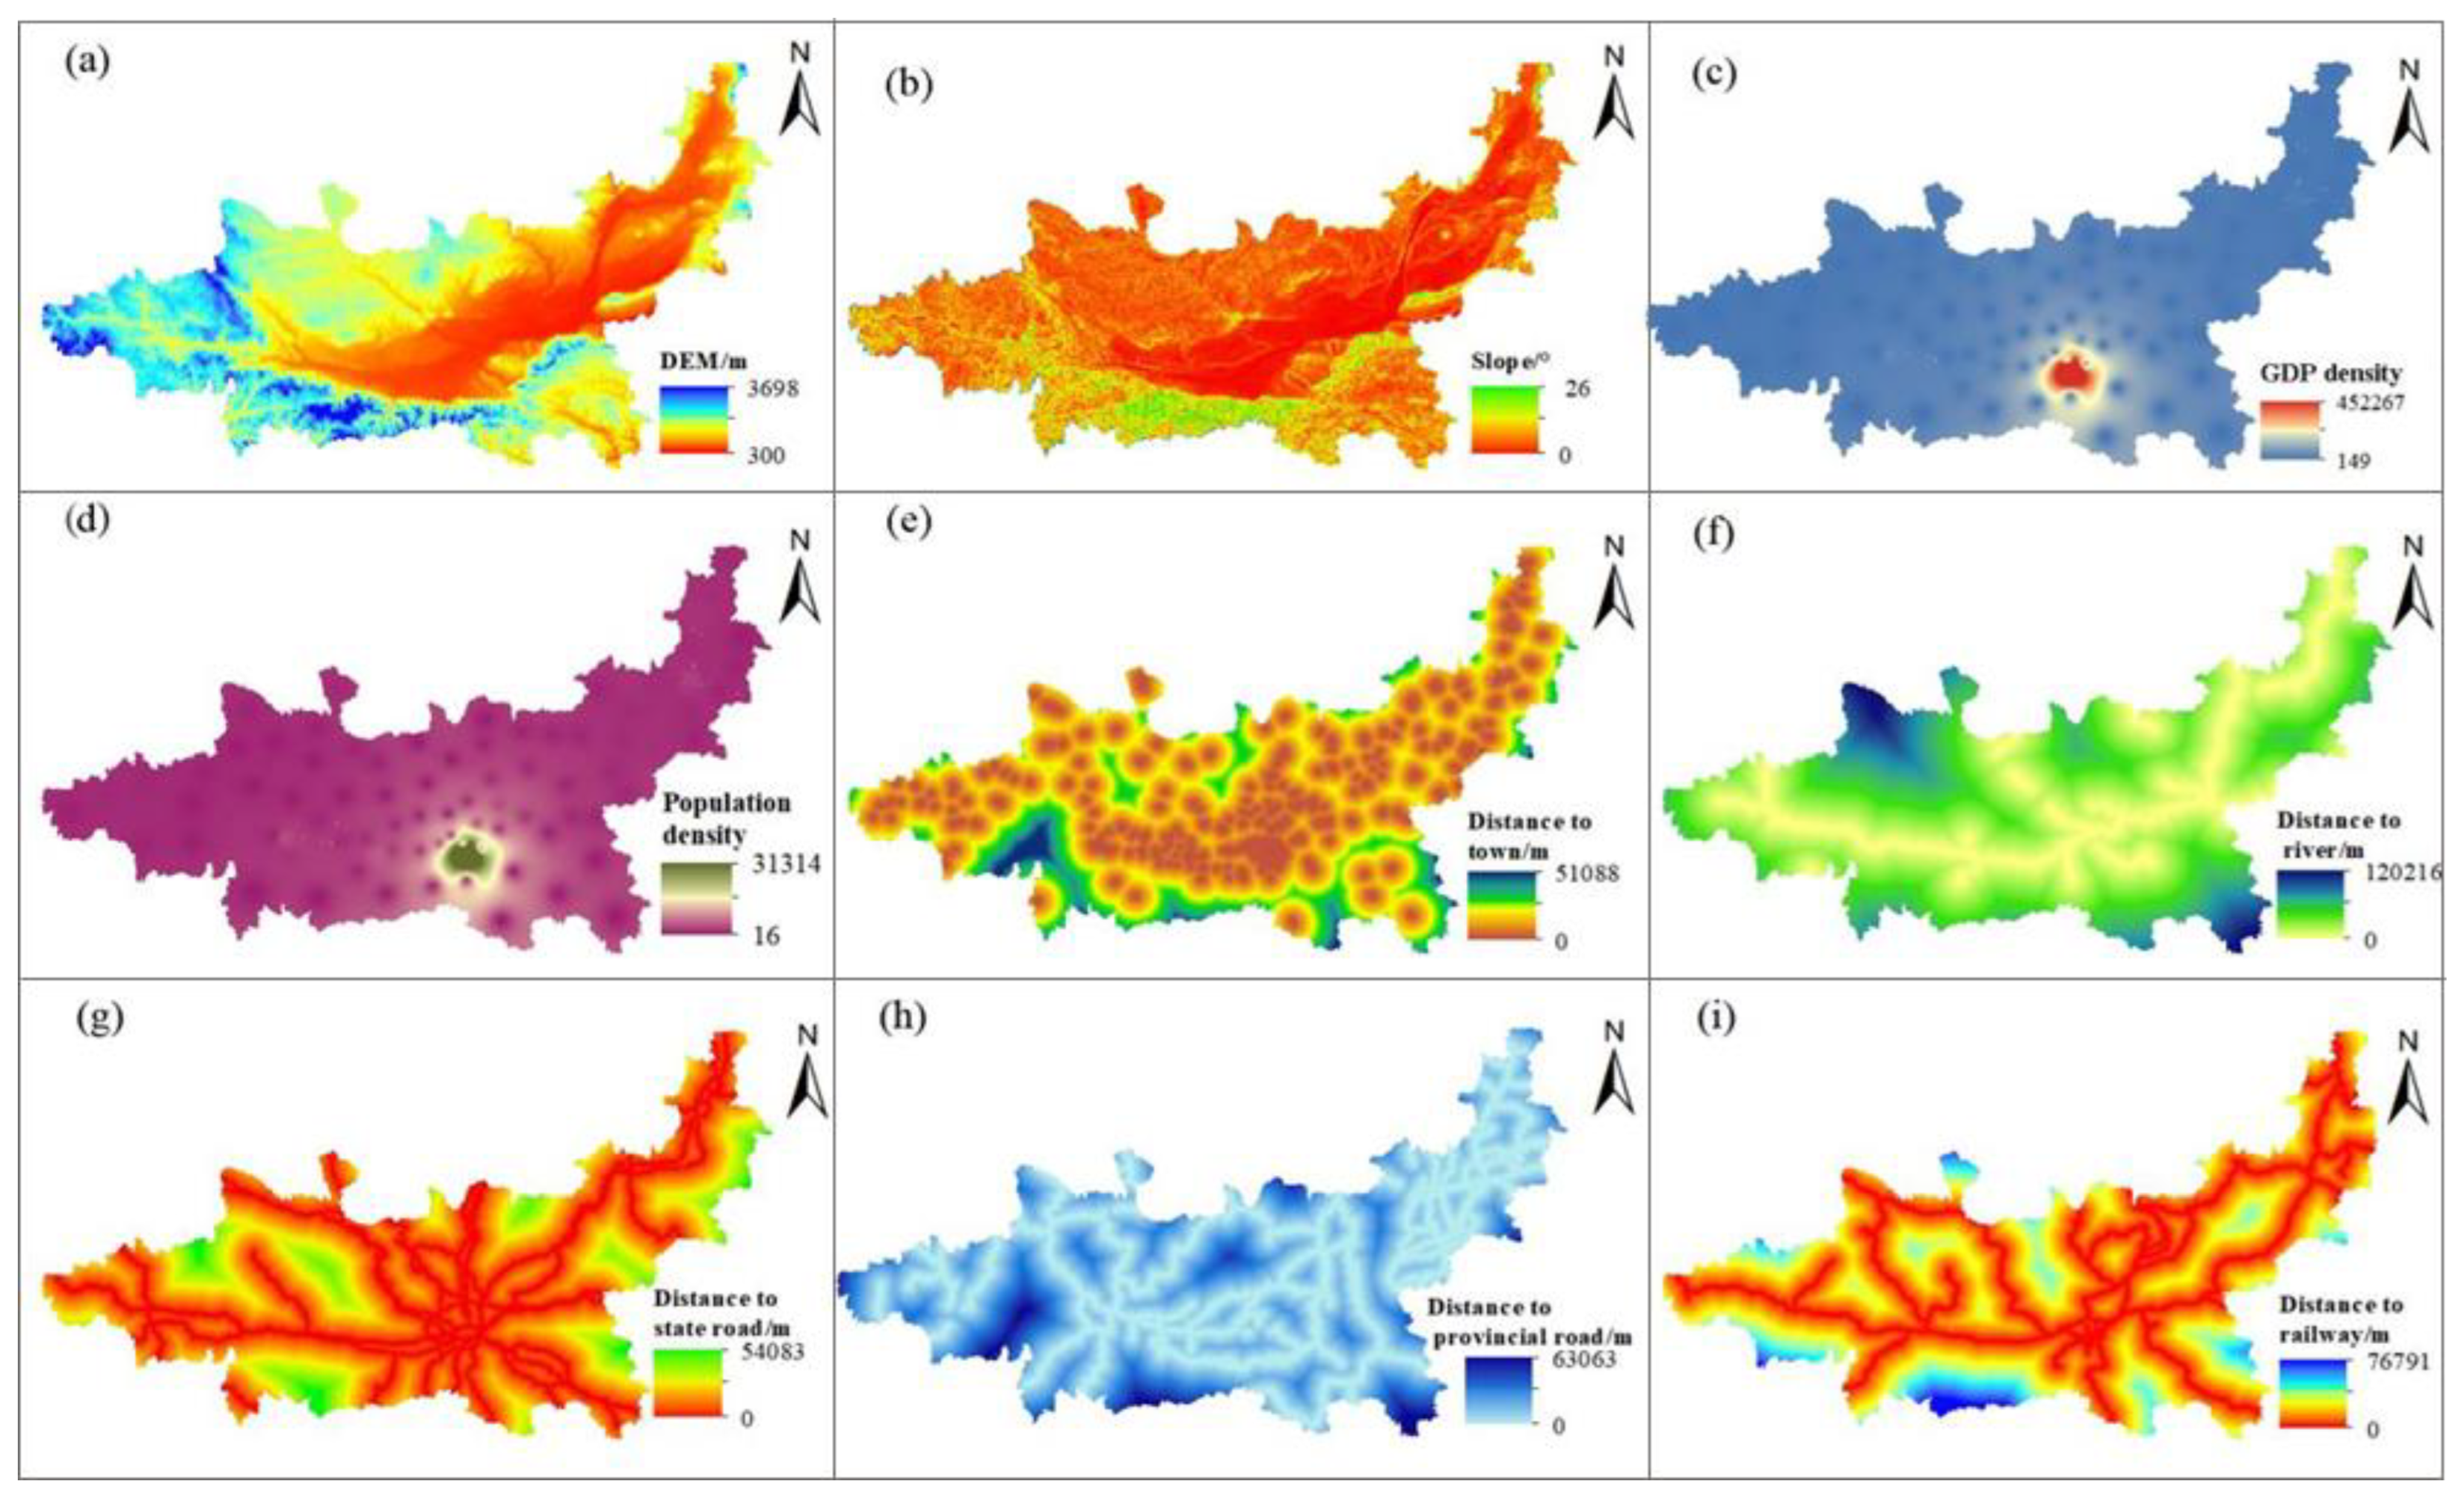
- Calculation of suitability probabilities and neighborhood factors.
- (3)
- Adaptive inertia coefficient.
- (4)
- Cost matrix.
- (5)
- Model accuracy test.
3.3.3. Habitat Quality Assessment Based on the InVEST Model
4. Results
4.1. Characteristics of Land-Use Change in Guanzhong Plain Urban Agglomeration
4.2. Multi-Scenario Simulation Results
- (1)
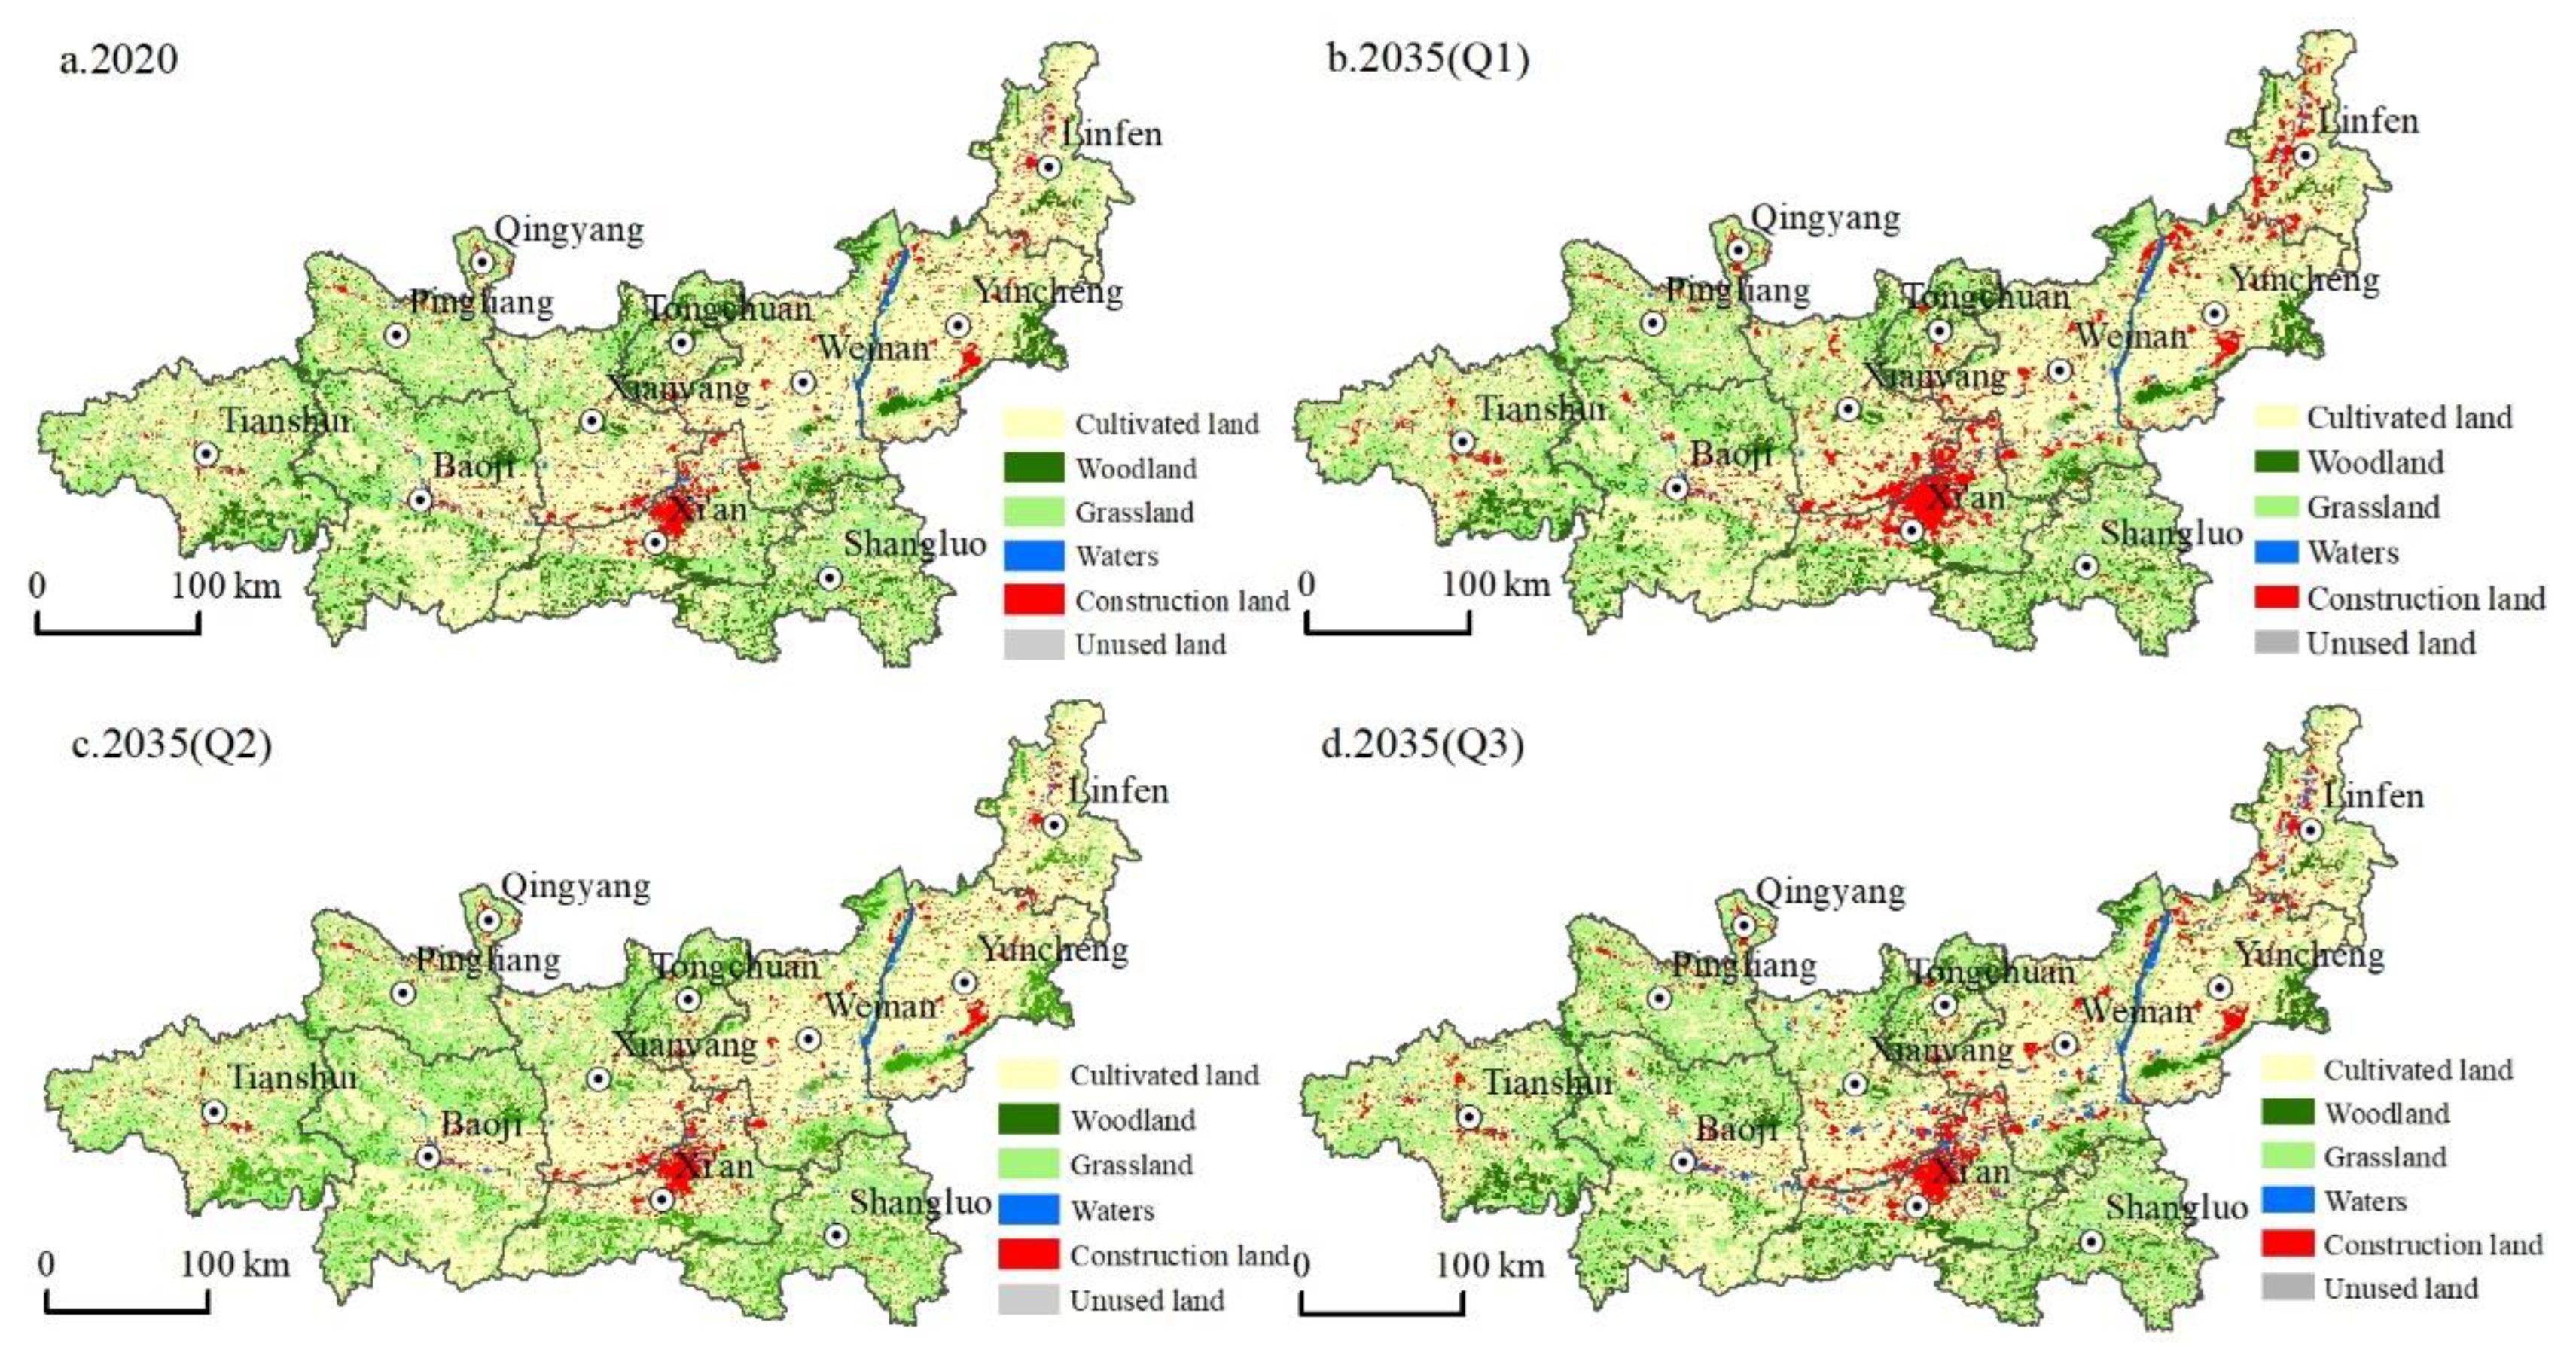
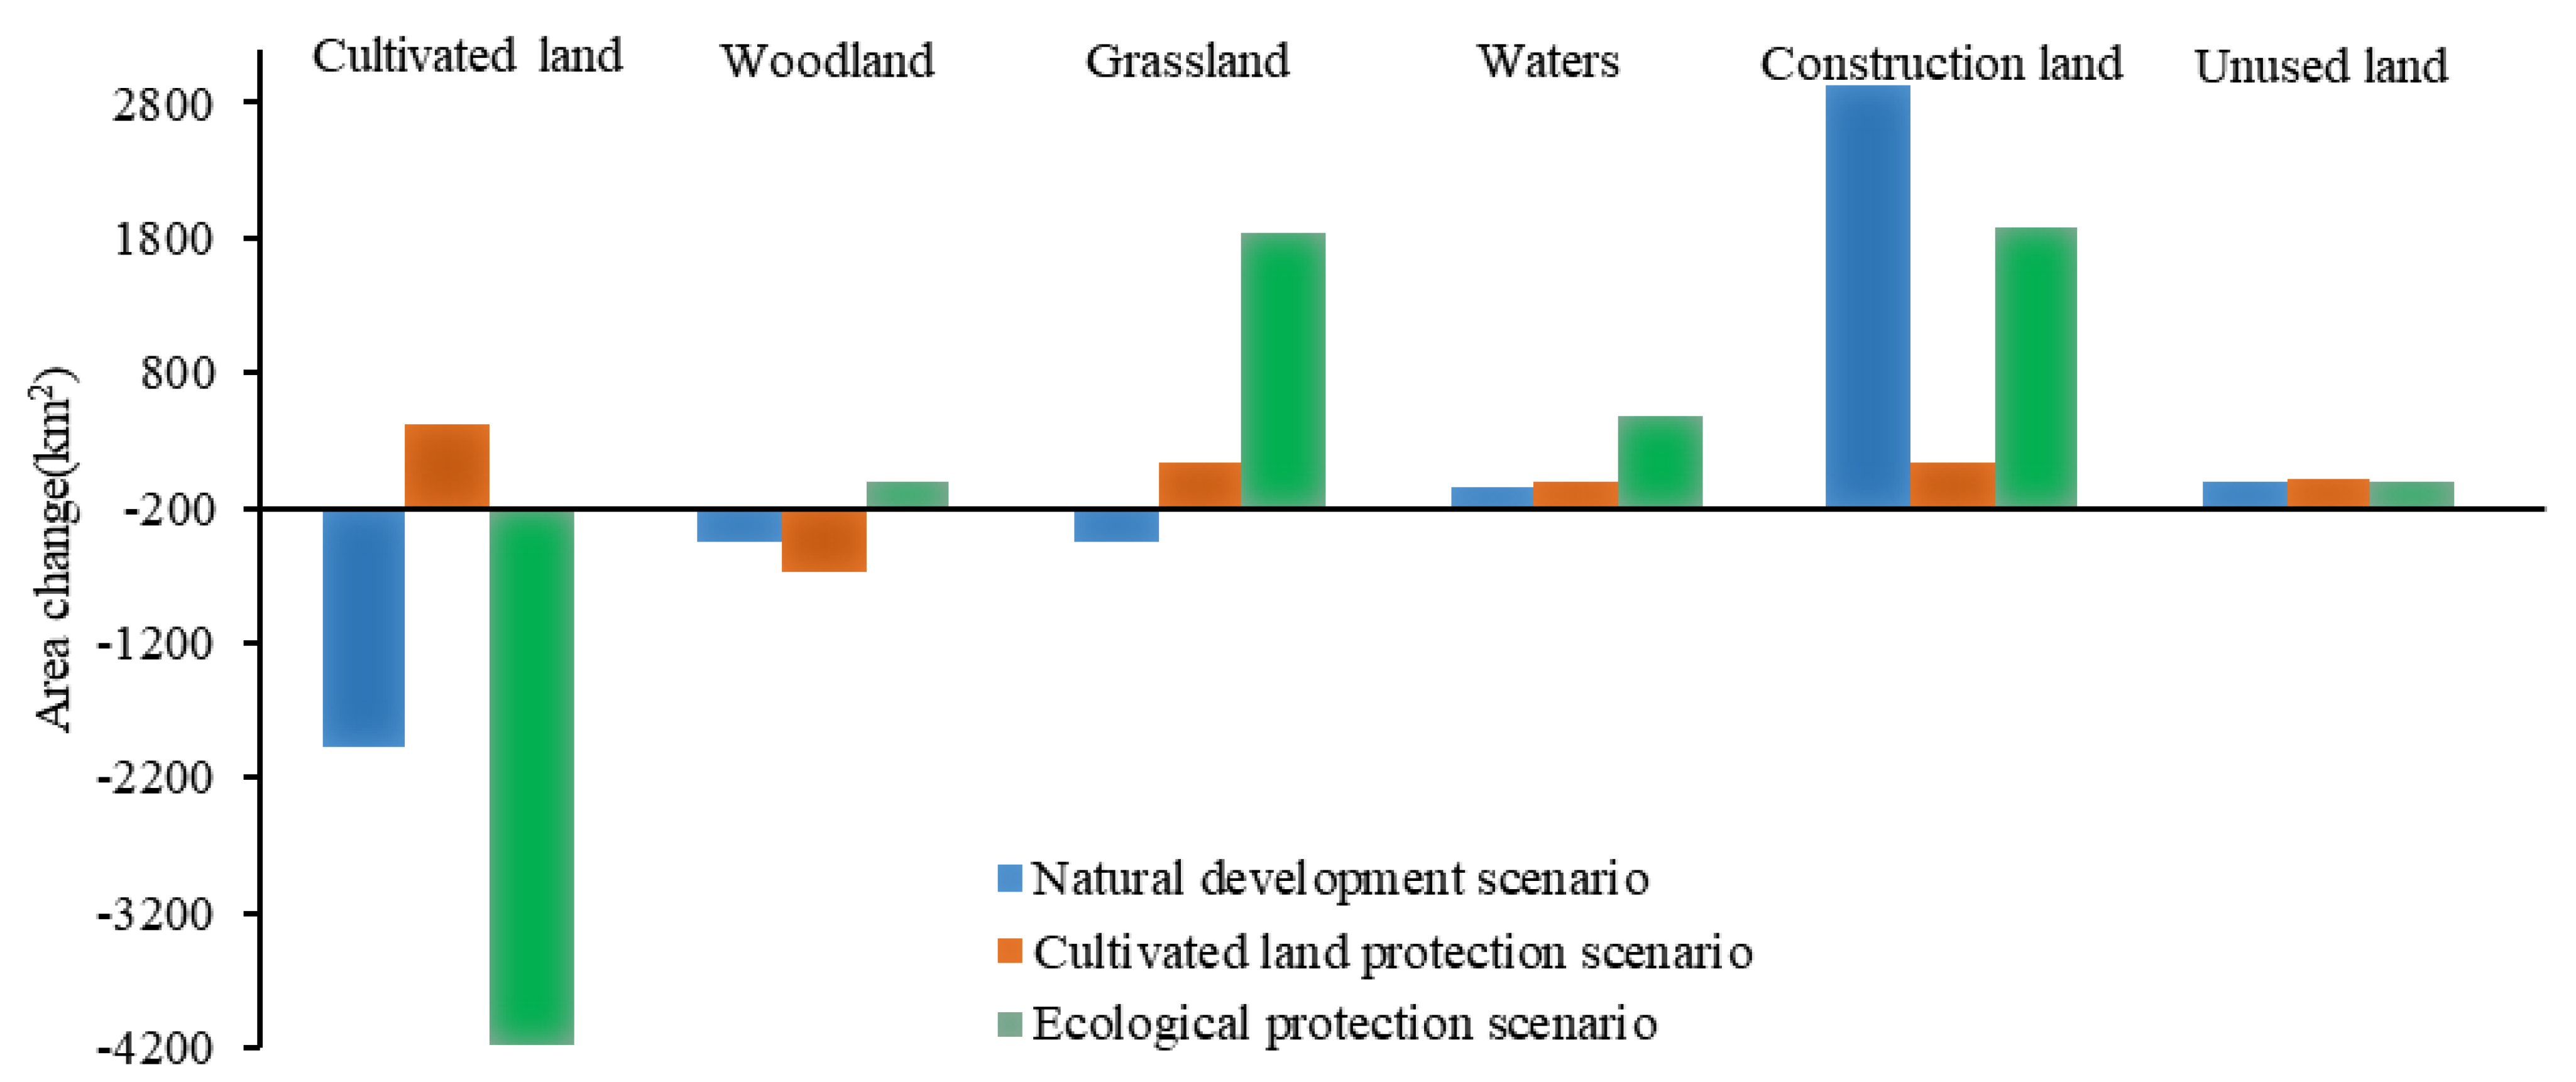
- The natural development scenario allowed free conversion between various land types without considering the influence of national land space planning and development policies. In terms of quantity change, the area of cultivated land, woodlands, and grassland under this scenario showed a decreasing trend. Compared with 2020, the area of cultivated land, woodland, and grassland decreased by 1981.95 km2 (3.30%), 444.67 km2 (3.95%), and 456.76 km2 (1.57%), respectively, and the area of waters and unused land decreased slightly by 40.87 km2 (3.41%) and 5.43 km2 (3.71%), respectively. Only construction land showed an expansion trend, increasing significantly by 2934.4 km2 (54.82%). From the change in the land-use spatial pattern, construction land spread throughout the region, from Xi’an as the core to Xianyang City, Weinan City, Baoji City, Tianshui City, and other regions. Construction land in Linfen City and Yuncheng City also expanded rapidly based on the original distribution. In addition, cultivated land and ecological land were occupied and disturbed to varying degrees.
- (2)
- Under the cultivated land protection scenario, the expansion speed of construction land was restrained, and the transfer of cultivated land to other types of land was controlled. In terms of quantity change, the scale of cultivated land showed an increasing trend, increasing by 411.97 km2 (0.68%) from 2020, mainly because the transfer area of cultivated land to woodland, grassland, and construction land decreased. Grassland and unused land area increased slightly by 133.51 km2 (0.45%) and 15.05 km2 (10.27%), respectively. Compared with the natural development scenario, the expansion trend of construction land was lower, increasing by only 132.56 km2 (2.47%); meanwhile, the reduction in woodland area increased, decreasing by 672.32 km2 (5.98%), which showed that the transfer trend of cultivated land to woodland decreased. The waters area decreased slightly by 15.67 km2 (1.31%). From the perspective of the change of land-use spatial pattern, the expansion of construction land was mainly concentrated in Xi’an and its surrounding areas, followed by Linfen and Yuncheng. The cultivated land area mainly increased in the west of the Guanzhong Plain, such as in Pingliang City and Tianshui City, and its growth source was mainly woodland. This change was consistent with the direction of land development and utilization determined in the development plan of the Guanzhong Plain urban agglomeration.
- (3)
- Under the ecological protection scenario, to promote the ecological co-construction and environmental co-governance of the Guanzhong Plain urban agglomeration, various types of ecological land were protected, and the rate of transfer of ecological land to other land was controlled. In terms of quantity change, the cultivated land area decreased by 4176.49 km2, which was a larger decrease (6.96%) than in the other scenarios. The area of woodland decreased slightly by 1.91 km2 (0.02%), but the scale of woodland decrease was smaller than in the other scenarios. The unused land area decreased slightly (2.04%). Additionally, grassland and waters showed the most significant growth trends among the three scenarios, with their area increasing by 1839.08 km2 (6.31%) and 476.22 km2 (39.78), respectively. The area of construction land increased significantly, reaching 1870.53 km2, but, compared with the natural development scenario, its expansion rate was restrained, and its growth rate decreased from 54.82% to 34.94%. From the perspective of the change of land-use spatial pattern, construction land mainly expanded in Xi’an and Xianyang, with significant expansions also in Linfen and Yuncheng. The cultivated land reduction areas were mainly in the north and south of the Guanzhong Plain urban agglomeration and were mainly transferred to grassland and construction land. In other words, under the premise of ecological protection, it is necessary to meet the needs of various human activities so that various social and economic activities can operate normally.
4.3. Temporal and Spatial Variation of Habitat Quality
- (1)
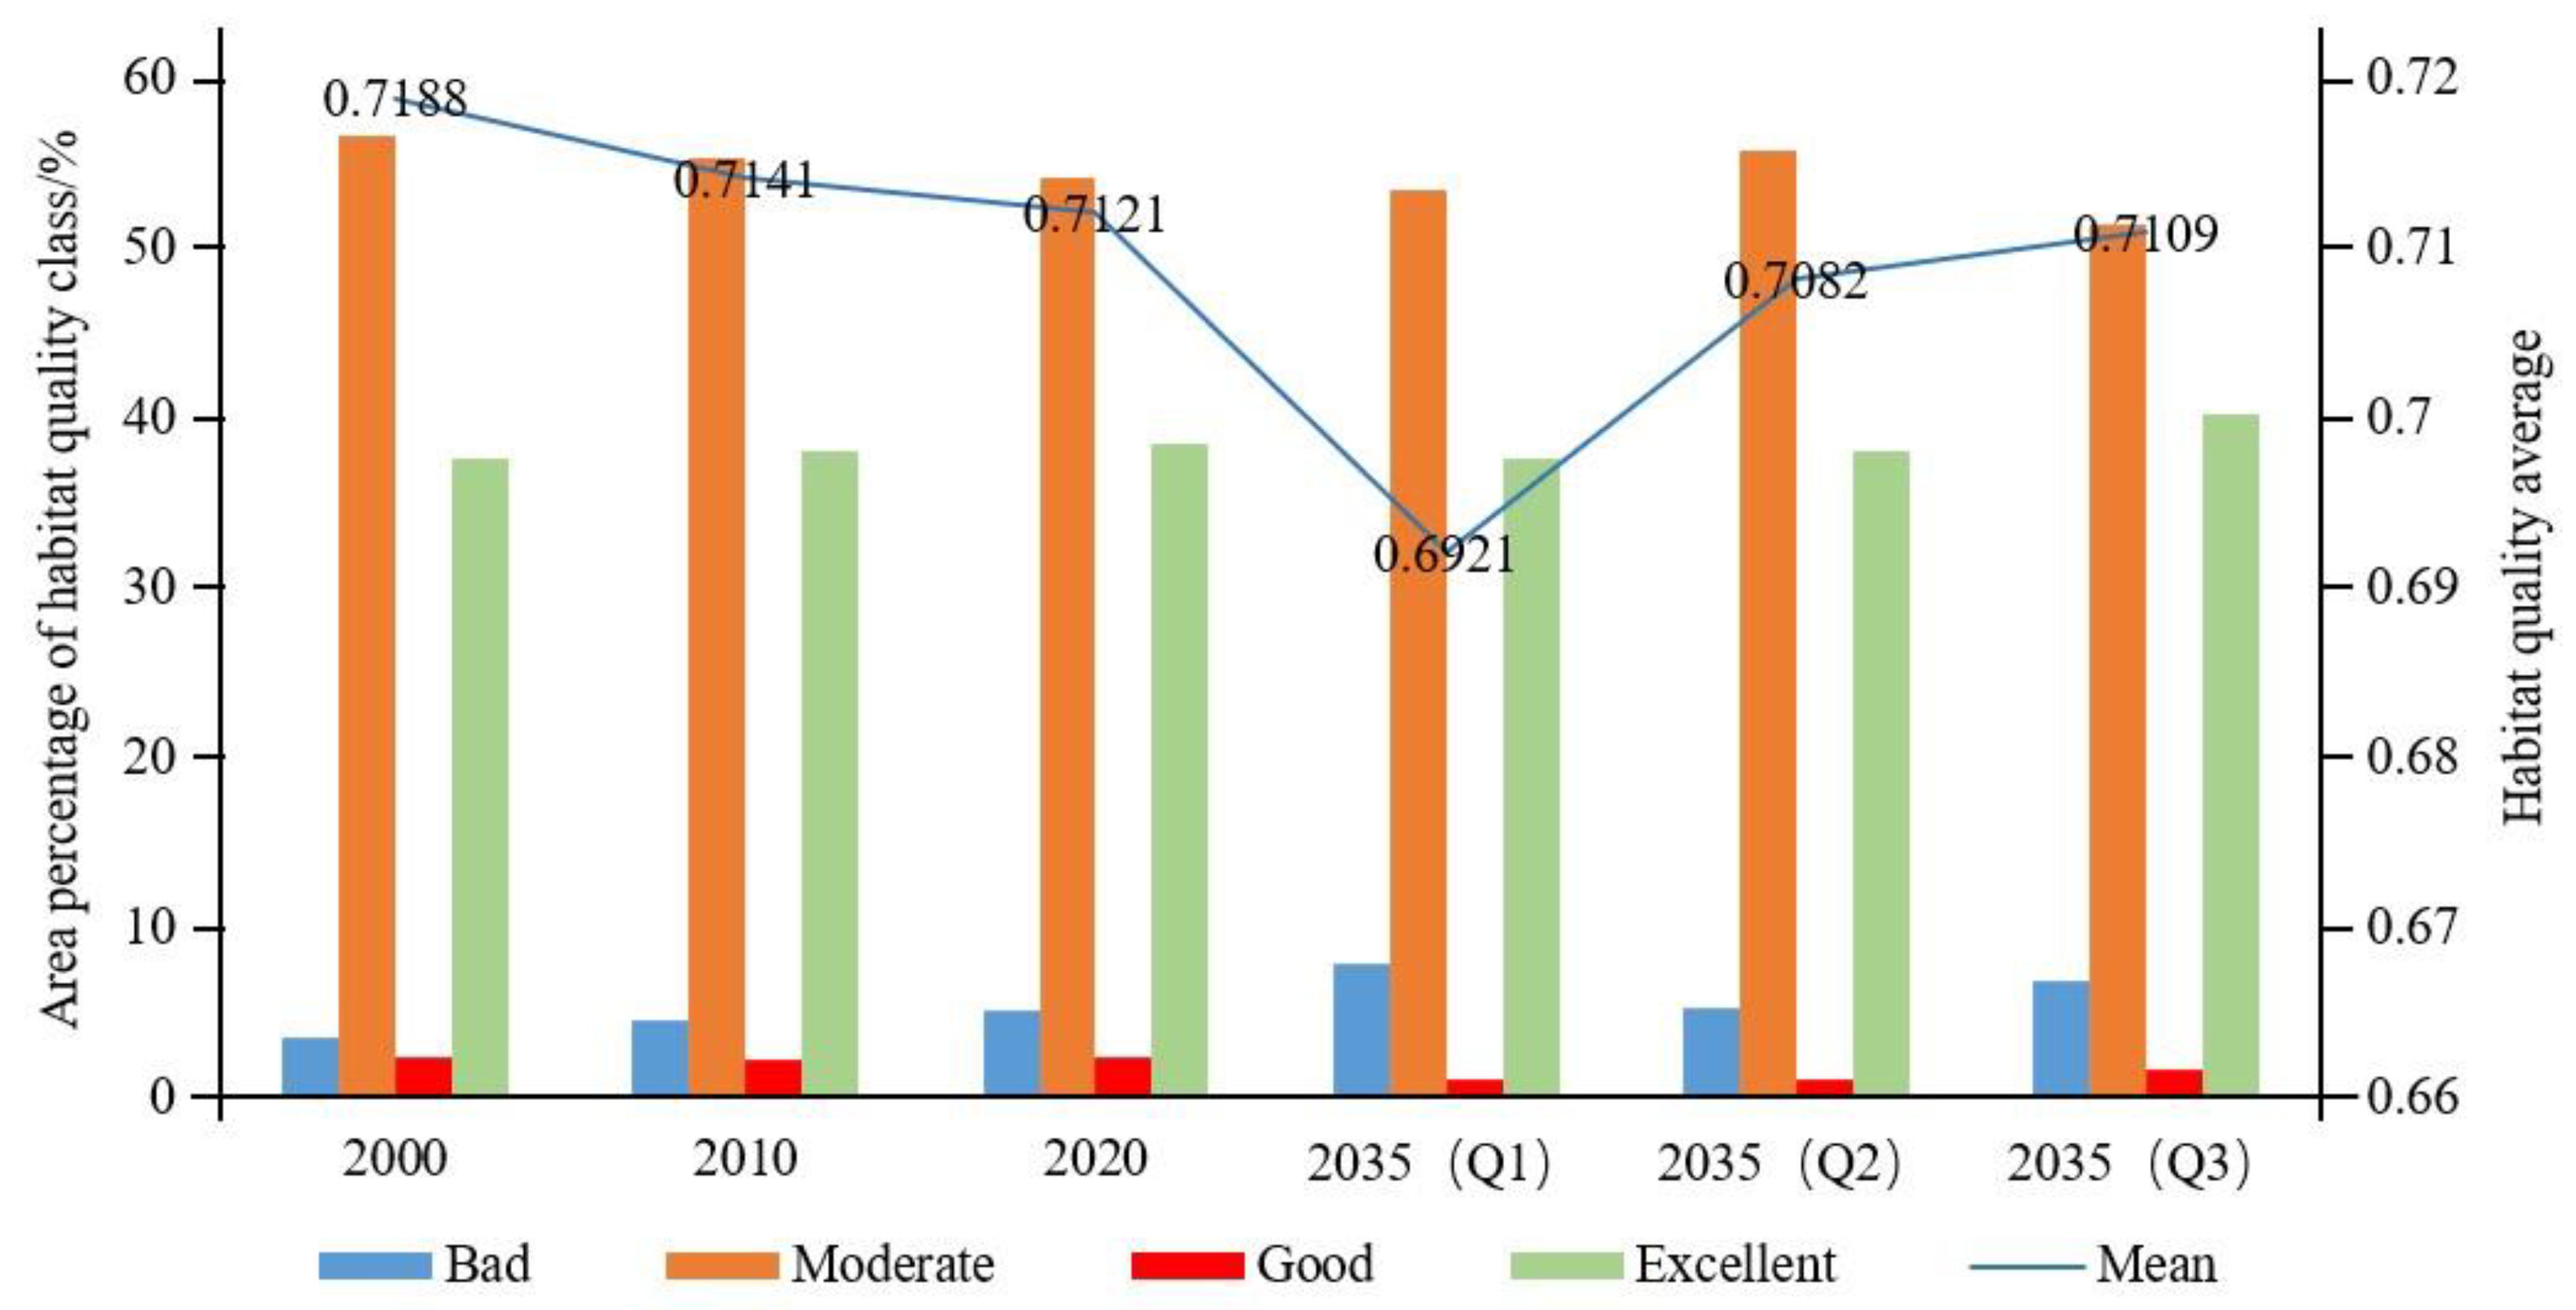
- Temporal variations in habitat quality: The average habitat quality in 2000, 2010, and 2020 was 0.7188, 0.7141, and 0.7121, respectively, and the regional habitat quality decreased by 0.93% over 20 years. During this period, the habitat quality grade showed the characteristics of a high proportion of areas with moderate and excellent habitat quality and a low proportion of areas with poor and good habitat quality, while the area with poor habitat quality gradually increased from 3.54% in 2000 to 5.11% in 2020, mainly due to the shrinkage of areas with moderate and good habitat quality; meanwhile, the area with excellent habitat quality increased slightly (0.95%). In general, the habitat quality of the Guanzhong Plain urban agglomeration was good, and the overall level was high, but the habitat was in decline. Regarding the average habitat quality, the three scenarios were ranked as follows: ecological protection scenario > cultivated land protection scenario > natural development scenario. Under the natural development scenario, from 2020 to 2035, the average habitat quality continued to decline to 0.6921, the area with poor habitat quality increased to 7.87%, and the moderate-grade area decreased from 54.1% to 53.3%. This decline in the overall habitat quality of the region was mainly due to the continuous expansion of construction land to support economic development, encroaching on cultivated land, woodland, and grassland around the city. In 2035, the average habitat quality under the cultivated land protection scenario was 0.7082. Compared with the natural development scenario, habitat quality was improved, the proportion of low-value areas was lower, and the proportion of high-value areas was higher. The poor area was lower at 5.26%, the moderate-grade area was higher at 55.66%, and the excellent area was higher at 37.97%. The average habitat quality under the ecological protection scenario in 2035 was the highest of the three scenarios (0.7109). Although there was a gap in 2020, the poor area accounted for 6.86%, which was lower than the percentage under the natural development scenario, while the proportions of good-grade and excellent-grade areas were 1.55% and 40.23%, respectively, which were higher than in the other two scenarios, indicating that the ecological quality of this scenario was better.
- (2)
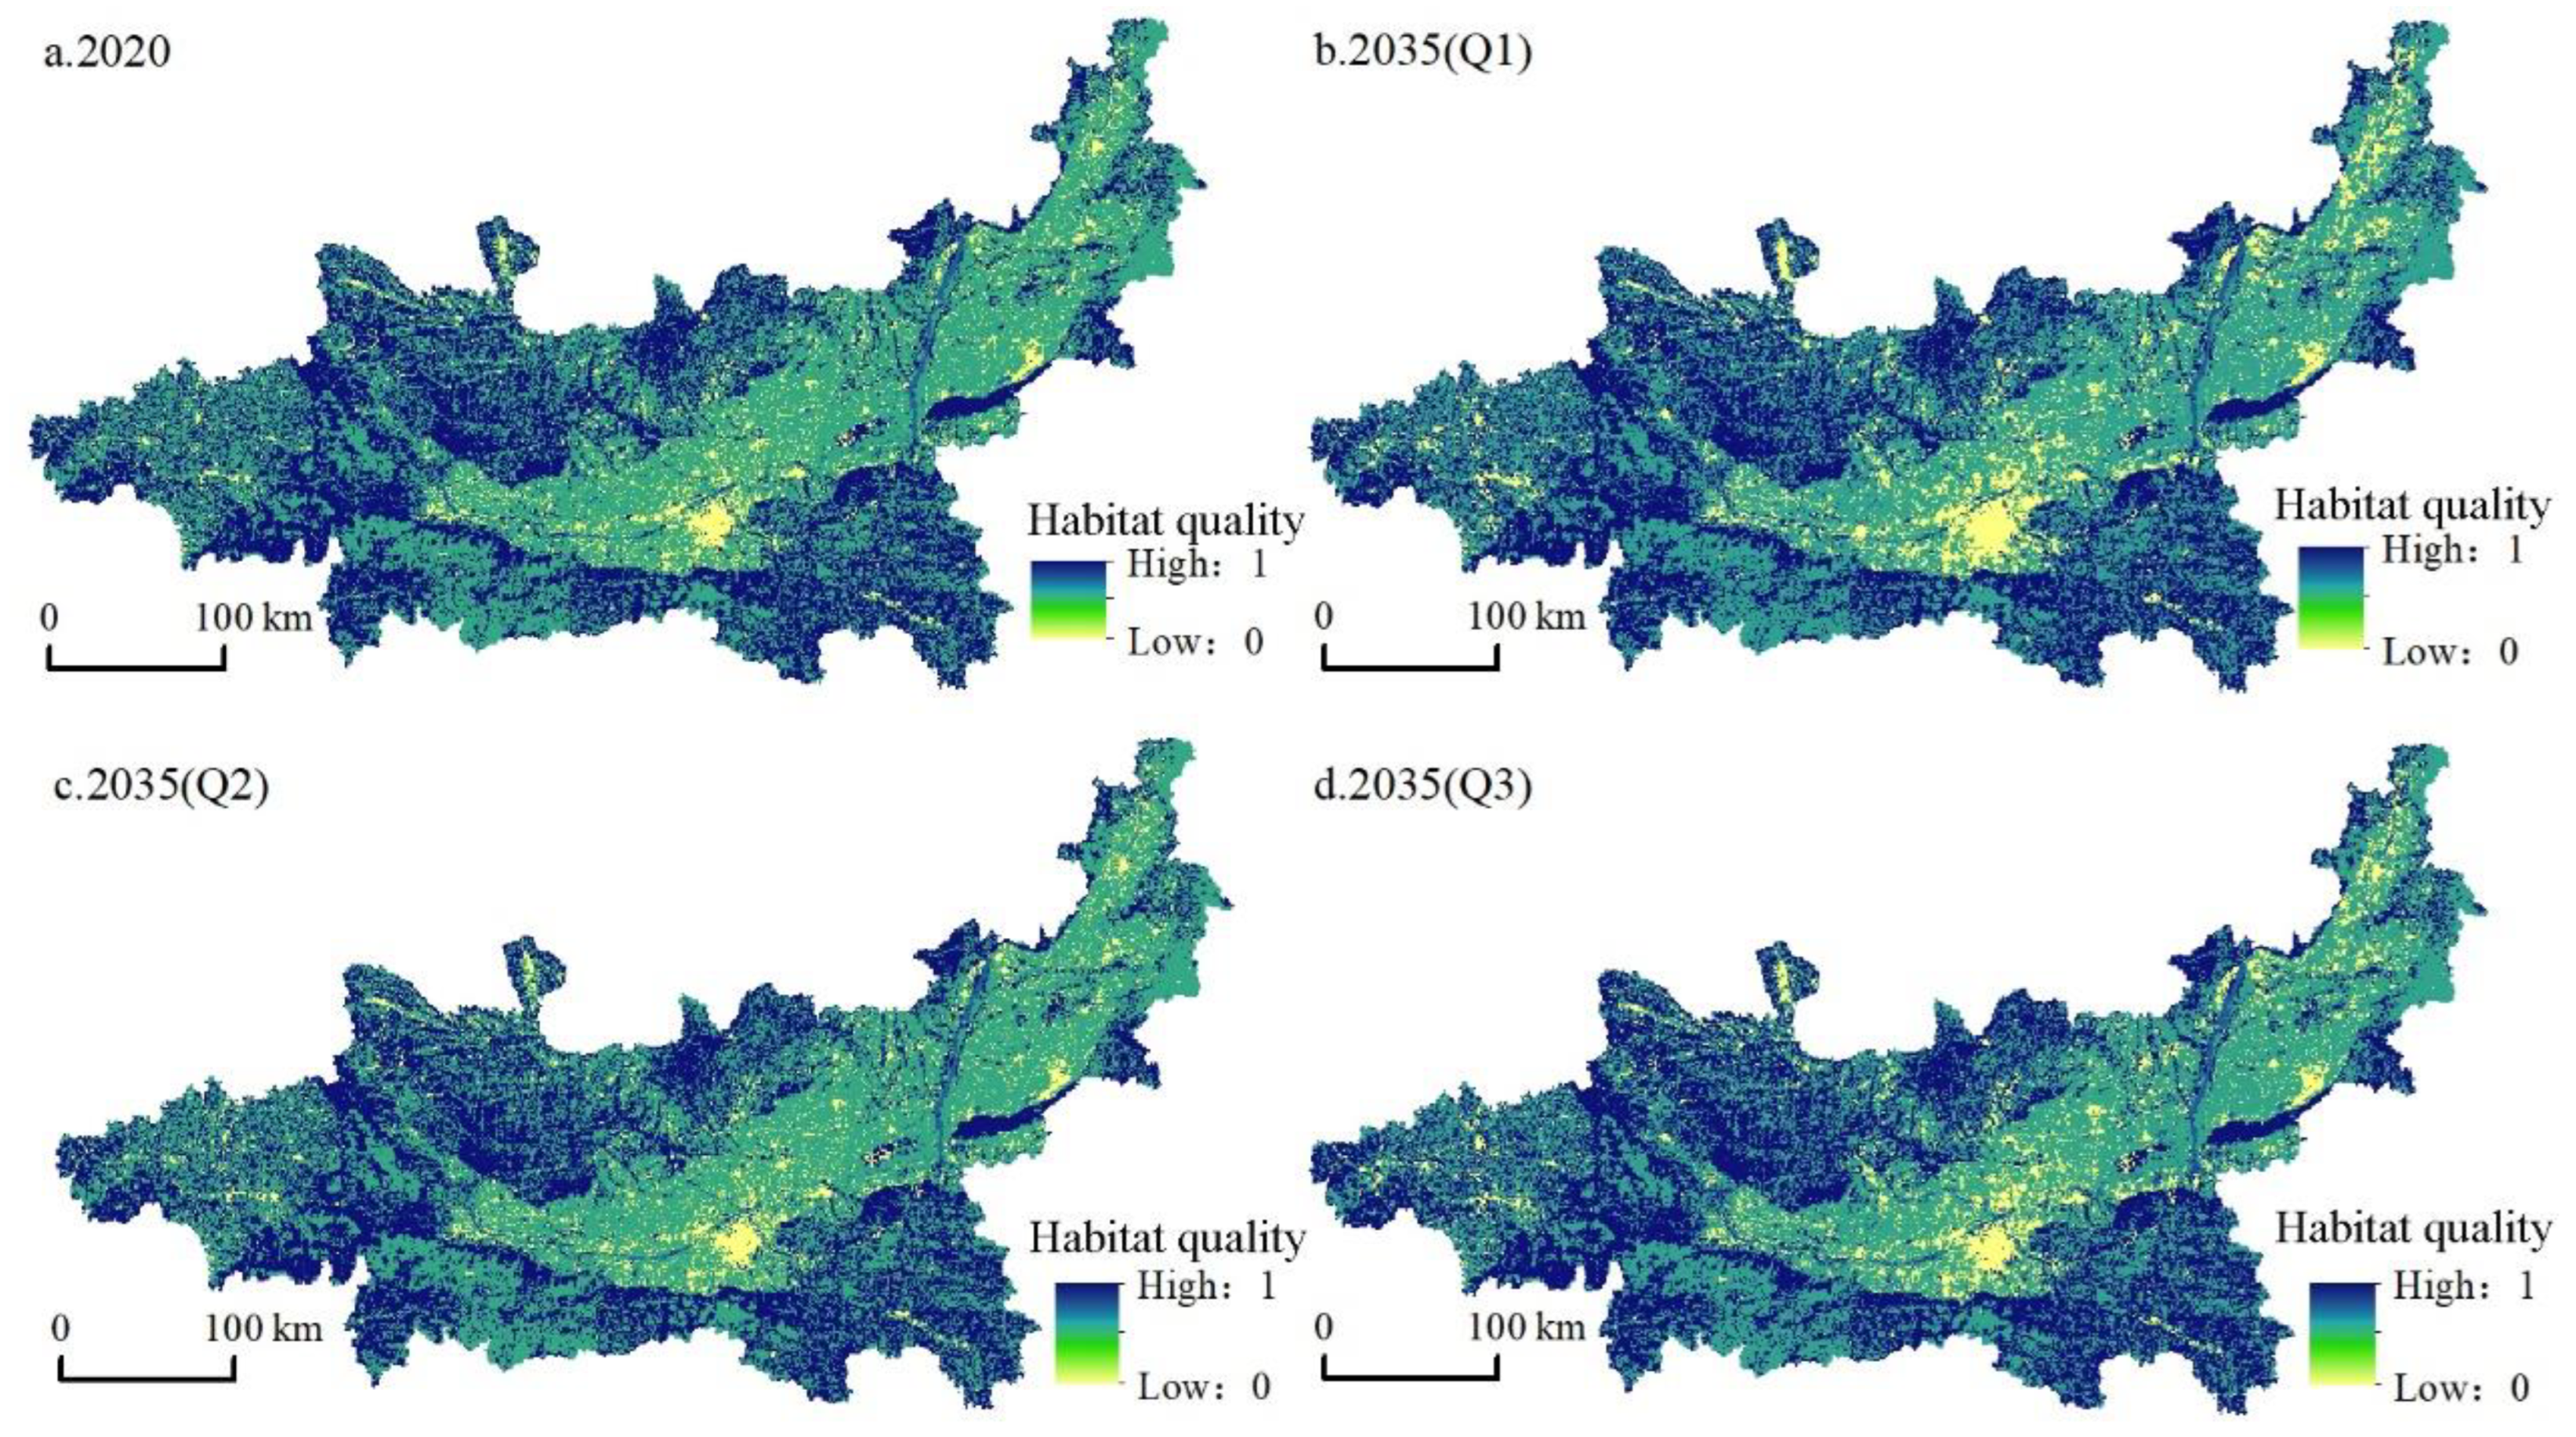
- Spatial pattern variations in habitat quality: During the study period, the habitat quality of the study area showed a spatial pattern of poor in the middle, moderate in the east and west, and good in the north and south. Areas with high habitat quality were mainly distributed in the south and north of the study area: the Qinba Mountains in the south, and the Loess Plateau in the north. Overall, the ecological environment was good. Areas with low habitat quality were mainly located in the middle of the urban agglomeration with Xi’an as the core. The economic development of this area was good, various development activities caused great damage to the habitat, and the urban space continued to extend to the surrounding higher habitat areas. From 2000 to 2020, the habitat quality of the study area continued to decline. With the disorderly expansion of urban construction land brought about by economic growth, the moderate-habitat-quality area gradually deteriorated. The habitat quality under the natural development scenario from 2020 to 2035 further decreased (Figure 6), the low-value area in the middle expanded, and the construction land in Linfen and Yuncheng in the northeast expanded. Although the habitat quality under the cultivated land protection scenario was reduced compared with the natural development scenario, the habitat quality was obviously higher. Cultivated land was protected while slowing the transformation of woodland and grassland, besides which, the expansion degree of construction land in the central region was significantly weakened, indicating that a cultivated land protection policy is conducive to slowing the decline of habitat quality. Compared with the previous two scenarios, the ecological protection scenario had the highest habitat quality, which enabled economic development in the central part of the Guanzhong Plain urban agglomeration and the protection of north–south habitats. Therefore, this scenario was conducive to economic, social, and ecological sustainability.
5. Discussion
5.1. Effects of Land-Use Change on Habitat Quality in Urban Agglomerations
5.2. Comparison of Land-Use Scenarios for Sustainable Development Goals
5.3. Policy Impact
5.4. Limitations and Potentials
6. Conclusions
- (1)
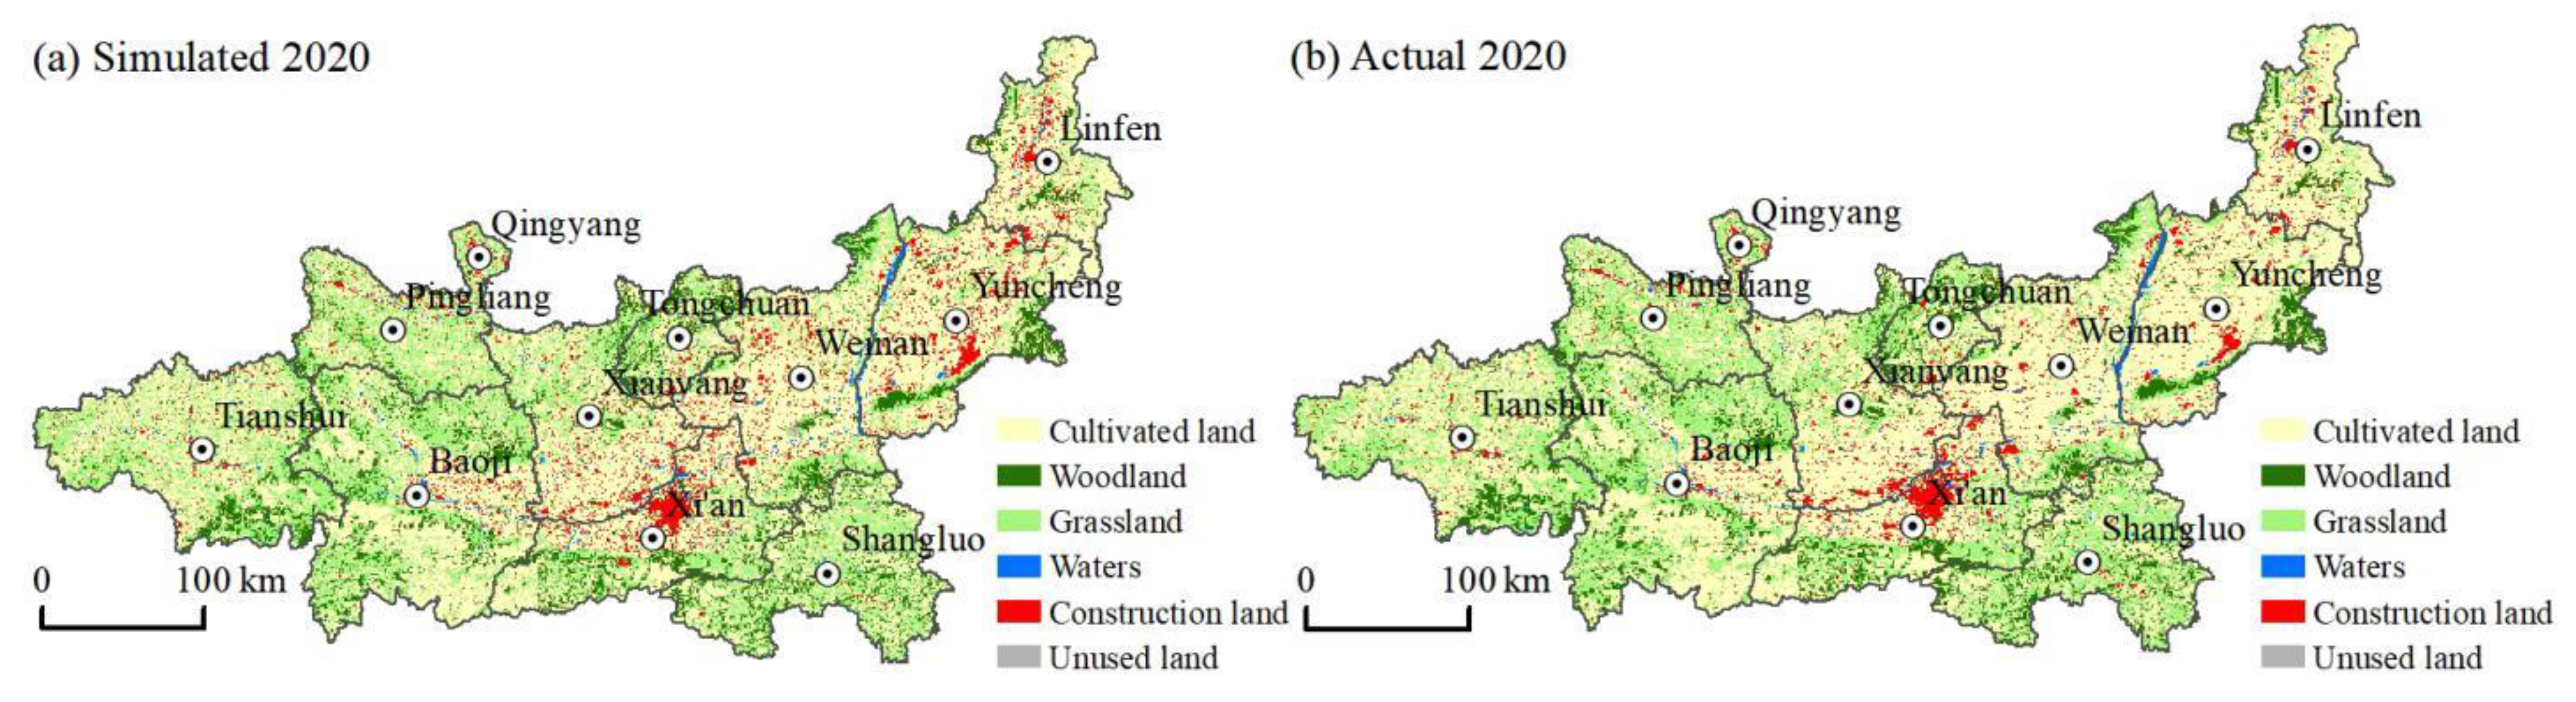
- Simulating the habitat quality of urban agglomerations based on land-use change is an important method for understanding and evaluating the complex coupling relationship between human activities and natural habitats. The Markov–FLUS model selected in this study showed excellent simulation results and was suitable for simulating land-use changes in the Guanzhong Plain urban agglomeration. The model test showed that the overall accuracy was 0.952, and the kappa coefficient was 0.924, indicating that the model had strong applicability for predicting future land-use change in the Guanzhong Plain urban agglomeration and effectively reflected the impact of regional human activities on the state and change in natural habitat;
- (2)
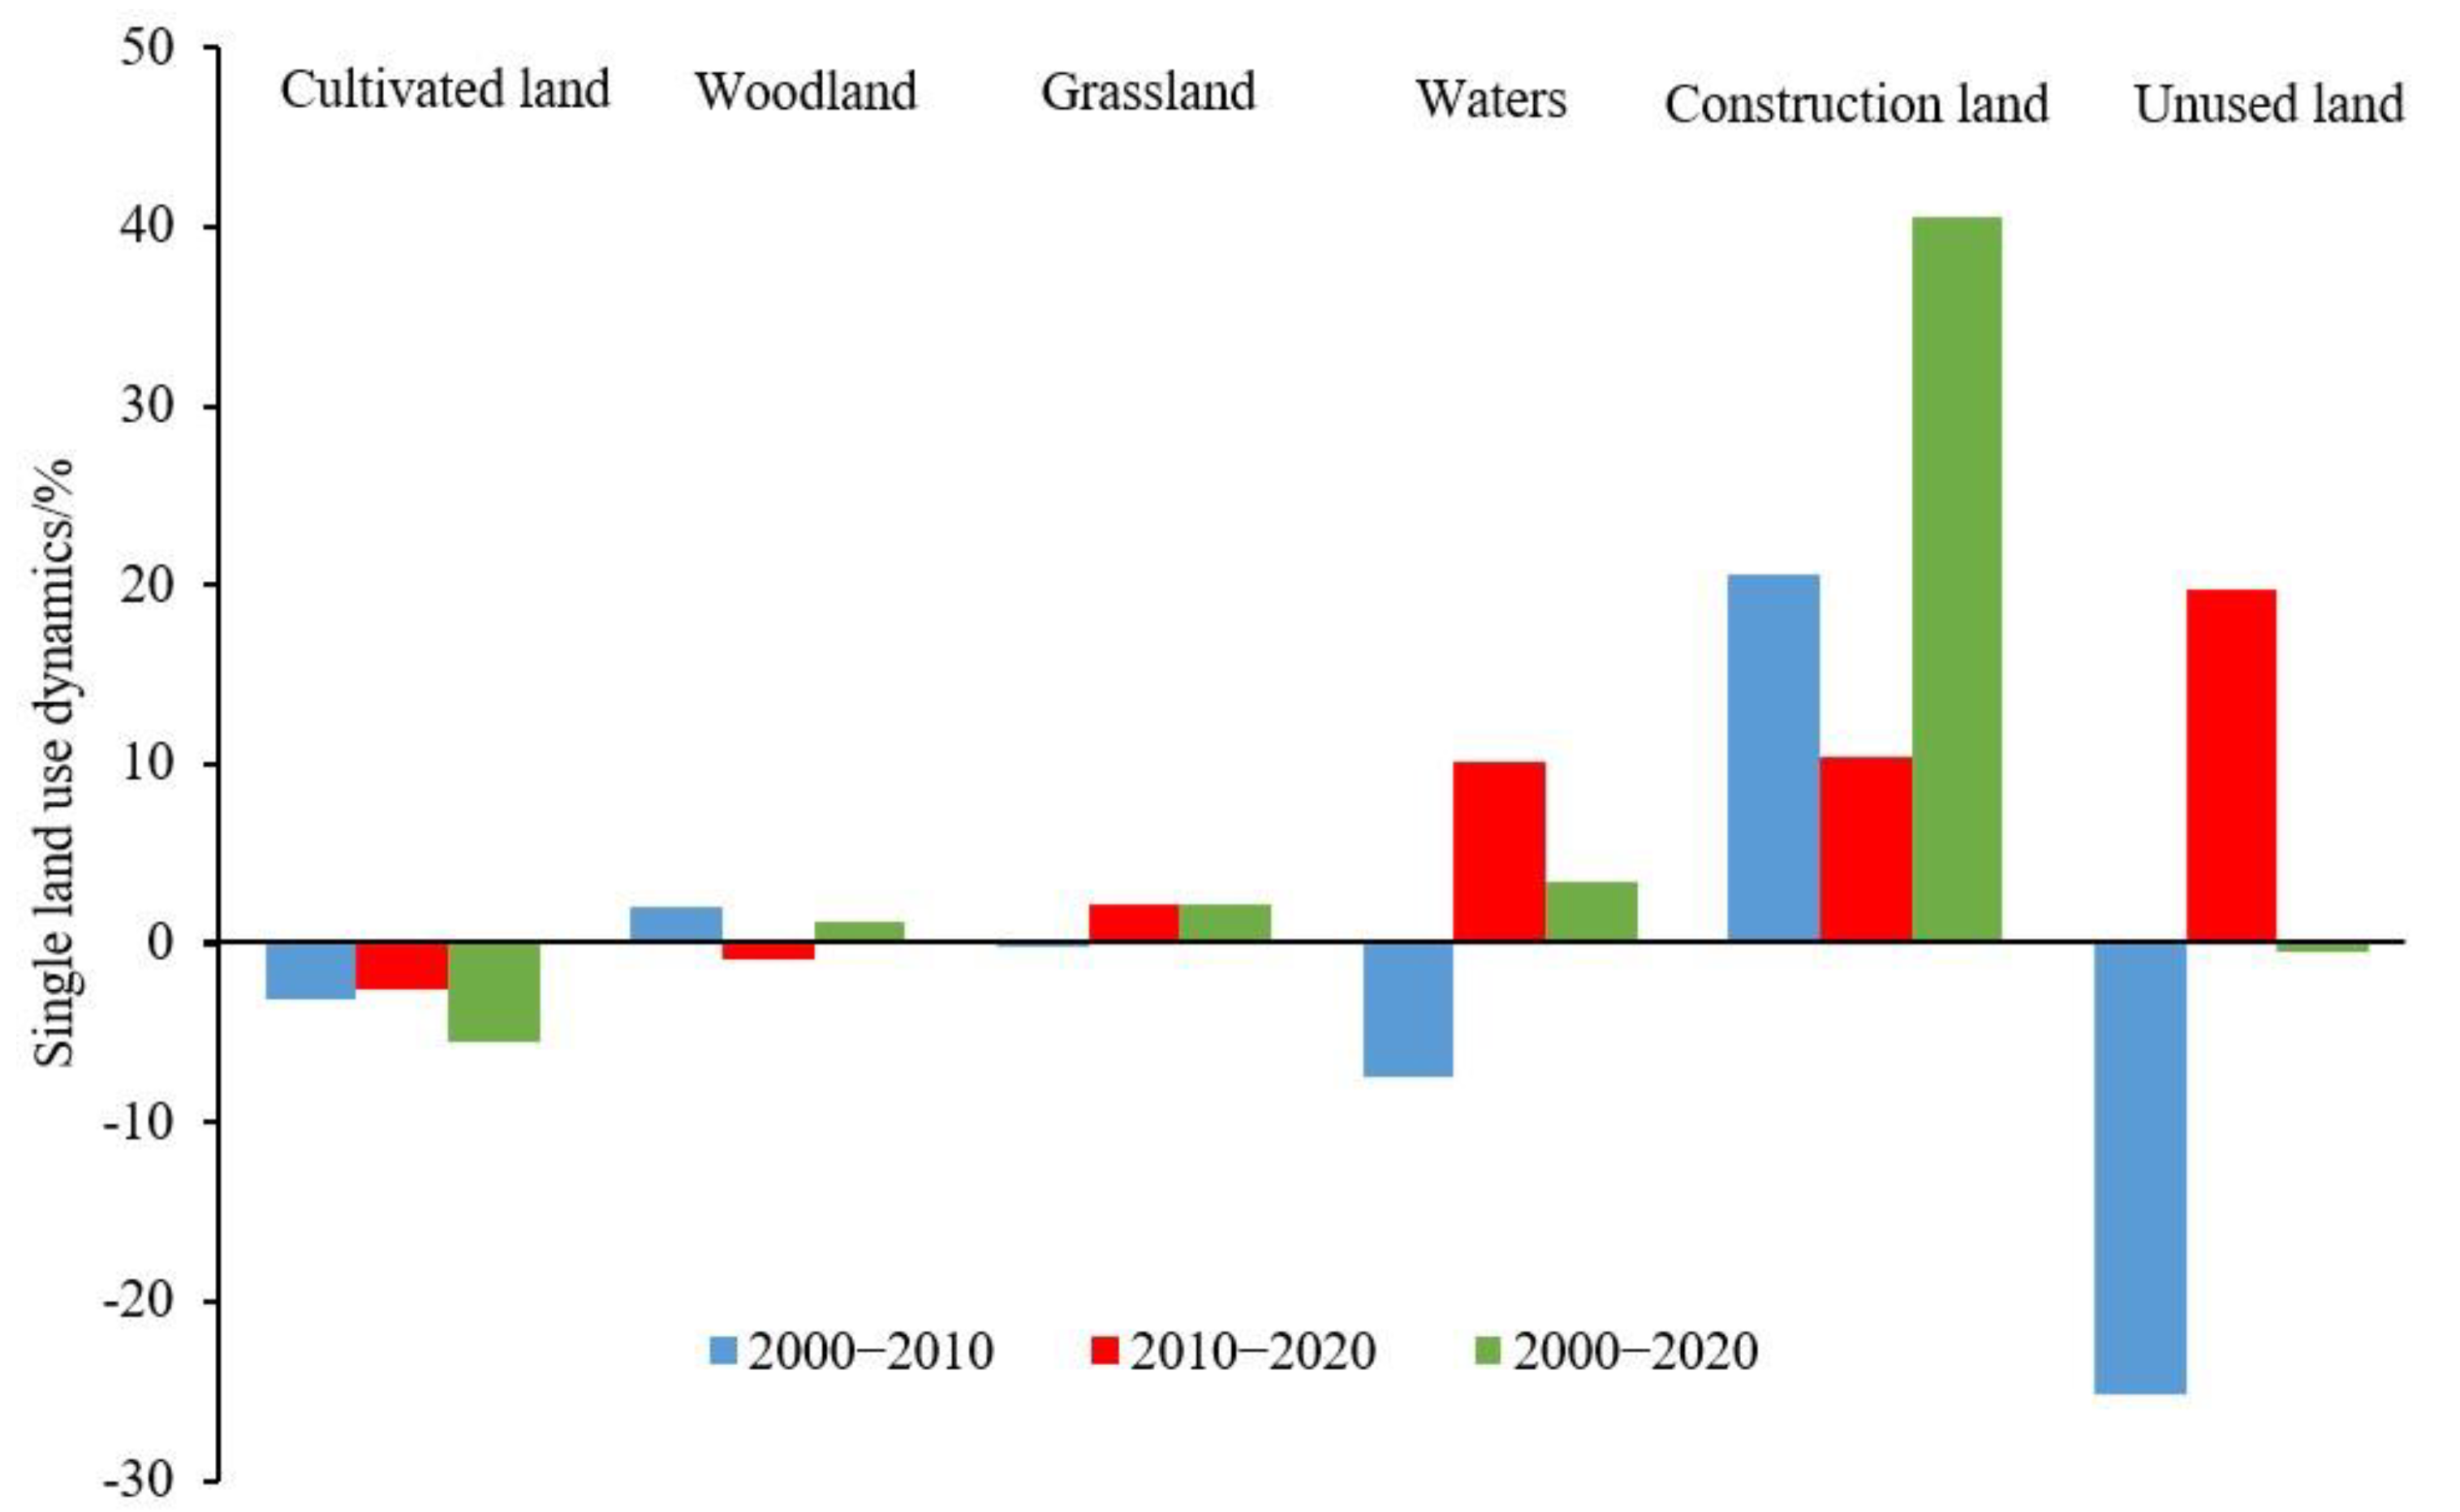
- From 2000 to 2020, the cultivated land area of the Guanzhong Plain urban agglomeration decreased by 5.48%, and the construction land area increased by 40.58%. Under the natural development scenario from 2020 to 2035, the growth in construction land area was the most significant, increasing by 54.82%. The cultivated land area only showed an upward trend under the cultivated land protection scenario, with an increase of 411.97 km2, while the increase in construction land area was the lowest at only 2.47%. Under the ecological protection scenario, the cultivated land area decreased by 6.96%, and the grassland and waters area showed a growth trend, increasing by 1839.08 and 476.22 km2, respectively;
- (3)
- From 2000 to 2020, the habitat quality of the Guanzhong Plain urban agglomeration gradually decreased from 0.7188 to 0.7121. The high-value areas of habitat quality were mainly distributed in the Qinling Mountains in the south of the Guanzhong Plain and the Loess Plateau in the north, while the low-value areas were mainly located in the middle of the urban agglomeration, with Xi’an as the core. In 2035, the order of average habitat quality under the three scenarios was: ecological protection scenario > cultivated land protection scenario > natural development scenario, showing that the ecological protection scenario was most conducive to building a sustainable geographical pattern in the urban agglomeration area, realizing the effective coordination of urban development, agricultural production, and ecological protection. It can also provide an important basis for the sustainable development of the urban agglomeration area.
Author Contributions
Funding
Institutional Review Board Statement
Informed Consent Statement
Data Availability Statement
Conflicts of Interest
Appendix A

| First Class Type | Secondary Type | ||
|---|---|---|---|
| Number | Name | Number | Name |
| 1 | Cultivated land | - | - |
| - | - | 11 | Paddy field |
| - | - | 12 | Dry land |
| 2 | Woodland | - | - |
| - | - | 21 | Forest land |
| - | - | 22 | Bush |
| - | - | 23 | Open forest land |
| - | - | 24 | Other woodland |
| 3 | Grassland | - | - |
| - | - | 31 | High coverage grass |
| - | - | 32 | Medium coverage grass |
| - | - | 33 | Low coverage grass |
| 4 | Waters | - | - |
| - | - | 41 | Canals |
| - | - | 42 | Lake |
| - | - | 43 | Reservoir pond |
| - | - | 44 | Permanent glacier snow |
| - | - | 45 | Tidal flat |
| - | - | 46 | Beach |
| 5 | Construction land | - | - |
| - | - | 51 | Urban land |
| - | - | 52 | Rural settlement |
| - | - | 53 | Other construction land |
| 6 | Unused land | - | - |
| - | - | 61 | Sand |
| - | - | 62 | Gobi |
| - | - | 63 | Saline-alkali land |
| - | - | 64 | Wetlands |
| - | - | 65 | Bare earth |
| - | - | 66 | Bare rock texture |
| - | - | 67 | Other |
| Land Types | Cultivated Land | Woodland | Grassland | Waters | Construction Land | Unused Land |
|---|---|---|---|---|---|---|
| Cultivated land | 84.85 | 1.34 | 6.80 | 0.93 | 6.00 | 0.08 |
| Woodland | 4.67 | 83.57 | 10.61 | 0.20 | 0.79 | 0.17 |
| Grassland | 9.95 | 2.05 | 86.05 | 0.70 | 1.01 | 0.24 |
| Waters | 8.68 | 0.77 | 5.65 | 81.85 | 1.55 | 1.49 |
| Construction land | 16.45 | 0.52 | 1.50 | 0.26 | 81.26 | - |
| Unused land | 6.29 | 1.55 | 10.85 | 3.07 | 4.62 | 73.62 |
Appendix B
References
- Hamere, Y.; Teshome, S.; Mekuria, A.; Ashraf, D. Spatio-temporal changes in habitat quality and linkage with landscape characteristics in the Beressa watershed, Blue Nile basin of Ethiopian highlands. J. Environ. Manag. 2021, 281, 111885. [Google Scholar] [CrossRef]
- Song, Y.; Xue, D.; Dai, L.; Wang, P.; Huang, X.; Xia, S. Land cover change and eco-environmental quality response of different geomorphic units on the Chinese Loess Plateau. J. Arid Land 2020, 12, 29–43. [Google Scholar] [CrossRef] [Green Version]
- Krausman, P.R. Some basic principles of habitat use. Grazing Behav. Livest. Wildl. 1999, 70, 85–90. [Google Scholar]
- Peng, L.; Zhang, L.; Li, X.; Wang, Z.; Wang, H.; Jiao, L. Spatial expansion effects on urban ecosystem services supply-demand mismatching in Guanzhong Plain urban agglomeration of China. J. Geogr. Sci. 2022, 32, 806–828. [Google Scholar] [CrossRef]
- Newbold, T.; Hudson, L.N.; Hill, S.L.L.; Contu, S.; Lysenko, I.; Senior, R.A.; Börger, L.; Bennett, D.J.; Choimes, A.; Collen, B.; et al. Global effects of land use on local terrestrial biodiversity. Nature 2015, 520, 45–50. [Google Scholar] [CrossRef] [Green Version]
- Cai, Y.L. Research on land use/Land Cover Change: Seeking a new comprehensive approach. Geogr. Stud. 2001, 6, 645–652. [Google Scholar]
- Watson, S.J.; Luck, G.W.; Spooner, P.G.; Watson, D.M. Land-use change: Incorporating the frequency, sequence, time span, and magnitude of changes into ecological research. Front. Ecol. Environ. 2014, 12, 241–249. [Google Scholar] [CrossRef]
- Gaglio, M.; Aschonitis, V.G.; Gissi, E.; Castaldelli, G.; Fano, E.A. Land use change effects on ecosystem services of river deltas and coastal wetlands: Case study in Volano–Mesola–Goro in Po river delta (Italy). Wetl. Ecol. Manag. 2017, 25, 67–86. [Google Scholar] [CrossRef]
- Xiong, J.H.; Yue, W.Z.; Chen, Y.; Liao, R.; Fang, K. Multi-scenario urban expansion simulation for SDGs: Taking the Central Asian region along the Belt and Road as an example. J. Nat. Resour. 2021, 36, 841–853. [Google Scholar] [CrossRef]
- DESA, U.N. The Sustainable Development Goals Report 2018. In Proceedings of the Regional Training Course on SDG Indicator, Daejeon, Korea, 15–19 October 2018. [Google Scholar]
- Foley, J.A.; DeFries, R.; Asner, G.P.; Barford, C.; Bonan, G.; Carpenter, S.R.; Chapin, F.S.; Coe, M.T.; Daily, G.C.; Gibbs, H.K.; et al. Global consequences of land use. Science 2005, 309, 570–574. [Google Scholar] [CrossRef] [Green Version]
- Zhang, X.; Zhou, J.; Li, G.; Chen, C.; Li, M.; Luo, J. Spatial pattern reconstruction of regional habitat quality based on the simulation of land use changes from 1975 to 2010. J. Geogr. Sci. 2020, 30, 601–620. [Google Scholar] [CrossRef]
- Mengist, W.; Soromessa, T.; Feyisa, G.L. Landscape change effects on habitat quality in a forest biosphere reserve: Implications for the conservation of native habitats. J. Clean. Prod. 2021, 329, 129778. [Google Scholar] [CrossRef]
- Kija, H.K.; Ogutu, J.O.; Mangewa, L.J.; Bukombe, J.; Verones, F.; Graae, B.J.; Kideghesho, J.R.; Said, M.Y.; Nzunda, E.F. Spatio-Temporal Changes in Wildlife Habitat Quality in the Greater Serengeti Ecosystem. Sustainability 2020, 12, 2440. [Google Scholar] [CrossRef] [Green Version]
- Tallis, H.; Ricketts, T. InVEST User’s Guide: Integrated Valuation of Environmental Services and Tradeoffs; The Natural Capital Project: Stanford, CA, USA, 2013. [Google Scholar]
- Su, X.; Zhou, Y.; Li, Q. Designing Ecological Security Patterns Based on the Framework of Ecological Quality and Ecological Sensitivity: A Case Study of Jianghan Plain, China. Int. J. Environ. Res. Public Health 2021, 18, 8383. [Google Scholar] [CrossRef]
- Zhang, X.; Liao, L.; Xu, Z.; Zhang, J.; Chi, M.; Lan, S.; Gan, Q. Interactive Effects on Habitat Quality Using InVEST and GeoDetector Models in Wenzhou, China. Land 2022, 11, 630. [Google Scholar] [CrossRef]
- Zhang, X.; Lyu, C.; Fan, X.; Bi, R.; Xia, L.; Xu, C.; Sun, B.; Li, T.; Jiang, C. Spatiotemporal Variation and Influence Factors of Habitat Quality in Loess Hilly and Gully Area of Yellow River Basin: A Case Study of Liulin County, China. Land 2022, 11, 127. [Google Scholar] [CrossRef]
- Berta Aneseyee, A.; Noszczyk, T.; Soromessa, T.; Elias, E. The InVEST Habitat Quality Model Associated with Land Use/Cover Changes: A Qualitative Case Study of the Winike Watershed in the Omo-Gibe Basin, Southwest Ethiopia. Remote Sens. 2020, 12, 1103. [Google Scholar] [CrossRef] [Green Version]
- Fan, X.; Gu, X.; Yu, H.; Long, A.; Tiando, D.S.; Ou, S.; Li, J.; Rong, Y.; Tang, G.; Zheng, Y.; et al. The Spatial and Temporal Evolution and Drivers of Habitat Quality in the Hung River Valley. Land 2021, 10, 1369. [Google Scholar] [CrossRef]
- Wu, J.-S.; Cao, Q.-W.; Shi, S.-Q.; Huang, X.-L.; Lu, Z.-Q. Spatio-temporal variability of habitat quality in Beijing-Tianjin-Hebei Area based on land use change. Chin. J. Appl. Ecol. 2015, 26, 3457–3466. [Google Scholar] [CrossRef]
- Deng, Y.; Jiang, W.G.; Wang, W.J.; Lu, J.X.; Chen, K. Urban expansion led to the degradation of habitat quality in the Beijing-Tianjin-Hebei Area. Acta Ecol. Sin. 2018, 38, 4516–4525. [Google Scholar] [CrossRef]
- Chen, Y.; Zhang, K.Y.; Chen, X.; Liao, Y.; Song, B.; Huang, H.; Wang, X. Ecological protection and high-quality development in the Yellow River Basin. Reg. Econ. Rev. 2020, 1, 12–17. [Google Scholar] [CrossRef]
- Song, Y.Y.; Xue, D.Q.; Xia, S.Y.; Mi, W.B. Change characteristics and formation mechanism of the territorial spatial pattern in the Yellow River Basin from 1980 to 2018, China. Geogr. Res. 2021, 40, 1445–1463. [Google Scholar]
- Zhou, L.; Che, L.; Zhou, C.H. Spatio-temporal evolution and influencing factors of urban green development efficiency in China. Acta Geogr. Sin. 2019, 74, 2027–2044. [Google Scholar] [CrossRef]
- Song, Y.; Ma, B.; Dai, L.H.; Xue, D.-Q.; Xia, S.-Y.; Wang, P.-T. Spatial-temporal pattern and formation mechanism of county urbanization on the Chinese Loess Plateau. J. Mt. Sci. 2021, 18, 1093–1111. [Google Scholar] [CrossRef]
- Guan, D.J.; Li, H.F.; Inohae, T.; Su, W.; Nagaie, T.; Hokao, K. Modeling urban land use change by the integration of cellular automaton and Markov model. Ecol. Model. 2011, 222, 3761–3772. [Google Scholar] [CrossRef]
- Veldkamp, A.; Lambin, E.F. Predicting land-use change. Agric. Ecosyst. Environ. 2001, 85, 1–6. [Google Scholar] [CrossRef]
- Li, P.; Li, X.B.; Liu, X.J. Macro-analysis on the driving forces of the land-use change in China. Geogr. Res. 2001, 2, 129–138. [Google Scholar]
- Turner, B.L.; Skole, D.; Sanderson, S.; Fischer, G.; Fresco, L.; Leemans, R. Land-Use and Land-Cover Change: Science/Research Plan; Elsevier: Amsterdam, The Netherlands, 1995. [Google Scholar]
- Lambin, E.F. Land-Use and Land-Cover Change (LUCC)-Implementation Strategy; UNT Digital Library: Denton, TX, USA, 1999. [Google Scholar]
- Moran, E.; Ojima, D.S.; Buchmann, B.; Canadell, J.G.; Coomes, O.; Graumlich, L.; Jackson, R.; Jaramillo, V.; Lavorel, S.; Leadley, P.; et al. Global land project: Science plan and implementation strategy. Environ. Policy Collect. 2005, 19, 53. [Google Scholar]
- Chen, R.S.; Cai, Y.L.; Yan, X.; Li, H. The Functions of Land System and Its Sustainable Assesement. China Land Sci. 2011, 25, 8–15. [Google Scholar] [CrossRef]
- Zhou, J.; Zhang, X.; Shen, L. Urbanization bubble: Four quadrants measurement model. Cities 2015, 46, 8–15. [Google Scholar] [CrossRef]
- Larson, K.L.; White, D.D.; Gober, P.; Wutich, A. Decision-making under uncertainty for water sustainability and urban climate change adaptation. Sustainability 2015, 7, 14761–14784. [Google Scholar] [CrossRef] [Green Version]
- Baccini, A.; Goetz, S.J.; Walker, W.S.; Laporte, N.T.; Sun, M.; Sulla-Menashe, D.; Hackler, J.; Beck, P.S.A.; Dubayah, R.; Friedl, M.A.; et al. Estimated carbon dioxide emissions from tropical deforestation improved by carbon-density maps. Nat. Clim. Chang. 2012, 2, 182–185. [Google Scholar] [CrossRef]
- Di Febbraro, M.; Sallustio, L.; Vizzarri, M.; De Rosa, D.; De Lisio, L.; Loy, A.; Eichelberger, B.; Marchetti, M. Expert-based and correlative models to map habitat quality: Which gives better support to conservation planning? Glob. Ecol. Conserv. 2018, 16, 2351–9894. [Google Scholar] [CrossRef]
- Costanza, J.K.; Watling, J.; Sutherland, R.; Belyea, C.; Dilkina, B.; Cayton, H.; Bucklin, D.; Romañach, S.S.; Haddad, N.M. Preserving connectivity under climate and land-use change: No one-size-fits-all approach for focal species in similar habitats. Biol. Conserv. 2020, 248, 108678. [Google Scholar] [CrossRef]
- Liu, M.; Tian, H. China’s land cover and land use change from 1700 to 2005: Estimations from high-resolution satellite data and historical archives. Glob. Biogeochem. Cycles 2010, 24, 3. [Google Scholar] [CrossRef]
- Mertens, B.; Lambin, E.F. Spatial modelling of deforestation in southern Cameroon: Spatial disaggregation of diverse deforestation processes. Appl. Geogr. 1997, 17, 143–162. [Google Scholar] [CrossRef]
- Li, X.; Mao, X.D.; Xiao, C.-J.; Ou, M.-H. The Regional Land Use Layout Optimization Based on the CLUE-S Model. Econ. Geogr. 2015, 28, 336–348. [Google Scholar] [CrossRef]
- Dietzel, C.; Clarke, K.C. Toward optimal calibration of the SLEUTH land use change model. Trans. GIS 2007, 11, 29–45. [Google Scholar] [CrossRef]
- Yan, D.; Li, A.L.; Nan, X.; Lei, G.B.; Cao, X.M. The Study of Urban Land Scenario Simulation in Mountain Area Based on Modified Dyna-CLUE Model and SDM: A Case Study of the Upper Reaches of Minjiang River. J. Geo-Inf. Sci. 2016, 18, 514–525. [Google Scholar] [CrossRef]
- Liu, X.; Liang, X.; Li, X.; Xu, X.; Ou, J.; Chen, Y.; Li, S.; Wang, S.; Pei, F. A future land use simulation model (FLUS) for simulating multiple land use scenarios by coupling human and natural effects. Landsc. Urban Plann. 2017, 168, 94–116. [Google Scholar] [CrossRef]
- Chu, M.; Lu, J.; Sun, D. Influence of Urban Agglomeration Expansion on Fragmentation of Green Space: A Case Study of Beijing-Tianjin-Hebei Urban Agglomeration. Land 2022, 11, 275. [Google Scholar] [CrossRef]
- Ding, Q.; Chen, Y.; Bu, L.; Ye, Y. Multi-Scenario Analysis of Habitat Quality in the Yellow River Delta by Coupling FLUS with InVEST Model. Int. J. Environ. Res. Public Health 2021, 18, 2389. [Google Scholar] [CrossRef] [PubMed]
- Villamagna, A.M.; Angermeier, P.L.; Bennett, E.M. Capacity, pressure, demand, and flow: A conceptual framework for analyzing ecosystem service provision and delivery. Ecol. Complex. 2013, 15, 114–121. [Google Scholar] [CrossRef]
- Bazelet, C.S.; Samways, M.J. Identifying grasshopper bioindicators for habitat quality assessment of ecological networks. Ecol. Indic. 2011, 11, 1259–1269. [Google Scholar] [CrossRef]
- Wang, Z.Q.; Chen, Z.C.; Hao, C.Y. Breeding Habitat Suitability Evaluation of Red-crown Crane in Zhao long National Nature Reserve by the Method of Habitat Suitability Index. Wetl. Sci. 2009, 7, 197–201. [Google Scholar] [CrossRef]
- Wang, J.H.; Tian, J.H.; Lü, X.G. Assesement of stream habitat quality in Naoli River Watershed, China. Acta Ecol. Sin. 2010, 30, 481–486. [Google Scholar]
- Billionnet, A. Mathematical optimization ideas for biodiversity conservation. Eur. J. Oper. Res. 2013, 231, 514–534. [Google Scholar] [CrossRef]
- Shi, L.; Feng, Y.; Gao, L. Habitat suitability assessment of blue sheep in Helan Mountain based on MAXENT modeling. Acta Ecol. Sin. 2013, 33, 7243–7249. [Google Scholar]
- Sánchez-Canales, M.; Benito, A.L.; Passuello, A.; Terrado, M.; Ziv, G.; Acuña, V.; Schuhmacher, M.; Elorza, F.J. Sensitivity analysis of ecosystem service valuation in a Mediterranean watershed. Sci. Total Environ. 2012, 440, 140–153. [Google Scholar] [CrossRef]
- Zhou, B.; Yu, X.L.; Chen, L.H.; Zhang, Z.M. Soil Erosion Simulation in Mountain Areas of Beijing Based on InVEST Model. Res. Soil Water Conserv. 2010, 17, 9–13. [Google Scholar]
- Van Hulst, R. On the dynamics of vegetation: Markov chains as models of succession. Vegetatio 1979, 40, 3–14. [Google Scholar] [CrossRef]
- Chen, L.T.; Cai, H.S.; Zhang, T.; Zhang, X.L.; Zhang, H. Land use multi-scenario simulation analysis of Rao River Basin based on Markov-FLUS model. Acta Ecol. Sin. 2022, 42, 3947–3958. [Google Scholar] [CrossRef]
- Zheng, H.; Gao, L.Y.; Xia, J. Dynamic analysis of urban landscape using a modified conversion matrix method: A case study in Nanchang City. Acta Ecol. Sin. 2003, 11, 2201–2209. [Google Scholar]
- Wang, X.; Ma, B.W.; Li, D.; Kun-Lun, C.; Hua-Song, Y. Multi-scenario simulation and prediction of ecological space in Hubei province based on FLUS model. J. Nat. Resour. 2020, 35, 230–242. [Google Scholar] [CrossRef]
- Ou, Y.X.; He, Q.Y.; Zhu, X. Simulation of Impacts of Urban Agglomeration Land Use Change on Ecosystem Services Value under Multi-Scenarios: Case Study in Changsha-Zhuzhou-Xiangtan Urban Agglomeration. Econ. Geogr. 2020, 40, 93–102. [Google Scholar] [CrossRef]
- Liu, S.; Liao, Q.; Xiao, M.; Zhao, D.; Huang, C. Spatial and Temporal Variations of Habitat Quality and Its Response of Landscape Dynamic in the Three Gorges Reservoir Area, China. Int. J. Environ. Res. Public Health 2022, 19, 3594. [Google Scholar] [CrossRef]
- Chu, L.; Zhang, X.R.; Wang, T.W.; Li, Z.-X.; Cai, C. Spatial-temporal evolution and prediction of urban landscape pattern and habitat quality based on CA-Markov and InVEST mode. Chin. J. Appl. Ecol. 2018, 29, 4106–4118. [Google Scholar] [CrossRef]
- Zhou, Q.G.; Wang, T.; Liu, X.W.; Zhou, L.; Peng, C.; Fu, J. Research on the Temporal and Spatial Evolution Characteristics of Habitat Quality in the Water-Level-Fluctuating Zone of the Three Gorges Reservoir Area and Its Topographic Gradient Effect. Areal Res. Dev. 2022, 41, 155–160. [Google Scholar] [CrossRef]
- Liu, X.W.; Zhang, D.X.; Chen, B.M. Characteristics of China’ s Town-level Land Use in Rapid Urbanization Stage. Acta Ecol. Sin. 2008, 3, 301–310. [Google Scholar]
- Wen, F.A. The focus of the new era to continuously promote the western development strategy. Reform 2018, 9, 1. [Google Scholar]
- Zhang, Z.B. The Strategic Significance and Reform Difficulties of New Urbanization. J. Chin. Acad. Gov. 2013, 1, 48–54. [Google Scholar] [CrossRef]
- Liu, W.D. Scientific understanding of the Belt and Road Initiative of China and related research themes. Prog. Geogr. 2015, 34, 538–544. [Google Scholar] [CrossRef]
- Zhao, A.Z.; Liu, X.F.; Zhu, X.-F.; Pan, Y.-Z.; Chen, S.-C. Spatiotemporal analyses and associated driving forces of vegetation coverage change in the Loess Plateau. China Environ. Sci. 2016, 36, 1568–1578. [Google Scholar]
- Liu, X.F.; Pan, Y.Z.; Zhu, X.X.; Li, S. Spatiotemporal variation of vegetation coverage in Qinling-Daba Mountains in relation to environmental factors. Acta Geogr. Sin. 2015, 70, 705–716. [Google Scholar] [CrossRef]
- Dang, X.W.; Zhou, L.; Hu, F.L.; Yuan, B.; Tang, J.J. The multi-scale direct and indirect effects of urban extension of Guanzhong Plain urban agglomeration on ecologic land. Acta Ecol. Sin. 2022, 42, 3020–3032. [Google Scholar] [CrossRef]
- Tao, R.; Xu, Z.G.; Xu, J.T. Constructing Social Policies Fit for China’s Development: A Contribution to Discussion on “Social Policy and Coordinated Socioeconomic Development in China”. Soc. Sci. China 2004, 6, 25–38+204. [Google Scholar]
- Fan, J. The Strategy of Major Function Oriented Zoning and the Optimization of Territorial Development Patterns. Bull. Chin. Acad. Sci. 2013, 28, 193–206. [Google Scholar] [CrossRef]

| Land-Use Type | Construction Land | Unused Land | Waters | Grassland | Cultivated Land | Woodland |
|---|---|---|---|---|---|---|
| Neighborhood factor parameters | 1 | 0.5 | 0.4 | 0.3 | 0.2 | 0.01 |
| Natural Development Scenario | Cultivated Land Protection Scenario | Ecological Protection Scenario | ||||||||||||||||
|---|---|---|---|---|---|---|---|---|---|---|---|---|---|---|---|---|---|---|
| a | b | c | d | e | f | a | b | c | d | e | f | a | b | c | d | e | f | |
| a 1 | 1 | 0 | 0 | 0 | 1 | 0 | 1 | 0 | 0 | 0 | 0 | 0 | 1 | 1 | 1 | 1 | 1 | 0 |
| b | 1 | 1 | 0 | 0 | 1 | 0 | 1 | 1 | 1 | 0 | 1 | 1 | 0 | 1 | 0 | 0 | 0 | 0 |
| c | 1 | 0 | 1 | 0 | 1 | 0 | 1 | 1 | 1 | 1 | 1 | 1 | 0 | 1 | 1 | 1 | 0 | 0 |
| d | 1 | 1 | 1 | 1 | 1 | 0 | 1 | 0 | 1 | 1 | 1 | 1 | 0 | 0 | 1 | 1 | 0 | 0 |
| e | 0 | 0 | 0 | 0 | 1 | 0 | 0 | 0 | 0 | 0 | 1 | 0 | 0 | 0 | 0 | 0 | 1 | 0 |
| f | 1 | 1 | 1 | 1 | 1 | 1 | 1 | 1 | 1 | 1 | 1 | 1 | 1 | 1 | 1 | 1 | 1 | 1 |
| Threat Source | Maximum Stress Distance (km) | Weight | Spatial Decay Type |
|---|---|---|---|
| Cultivated land | 3 | 0.7 | Linear decay |
| Construction land | 10 | 1 | Exponential decay |
| National roads | 2 | 0.8 | Linear decay |
| Provincial roads | 2 | 0.8 | Linear decay |
| Main railways | 2 | 0.8 | Linear decay |
| Land-Use Type | Habitat Suitability | Threat Source | ||||
|---|---|---|---|---|---|---|
| Cultivated Land | Construction Land | National Roads | Provincial Roads | Main Railways | ||
| Cultivated land | 0.6 | 0.3 | 1 | 0.4 | 0.4 | 0.3 |
| Woodland | 1 | 0.8 | 0.8 | 0.6 | 0.6 | 0.5 |
| Grassland | 1 | 0.7 | 0.7 | 0.4 | 0.3 | 0.2 |
| Waters | 0.8 | 0.5 | 0.9 | 0.5 | 0.4 | 0.4 |
| Construction land | 0 | 0 | 0 | 0 | 0 | 0 |
| Unused land | 0 | 0 | 0 | 0 | 0 | 0 |
| Land Types | Cultivated Land | Woodland | Grassland | Waters | Construction Land | Unused Land | Area Decrease |
|---|---|---|---|---|---|---|---|
| Cultivated land | 45,189.71 | 437.62 | 1840.31 | 181.06 | 1945.30 | 18.46 | 4422.75 |
| Woodland | 183.38 | 22,410.22 | 367.73 | 10.41 | 49.10 | 9.39 | 620.01 |
| Grassland | 1063.22 | 434.71 | 27,107.45 | 38.64 | 92.82 | 15.80 | 1645.19 |
| Waters | 131.65 | 7.38 | 35.87 | 1043.12 | 29.92 | 3.16 | 207.98 |
| Construction land | 316.02 | 6.68 | 17.19 | 6.30 | 4026.26 | 0.32 | 346.51 |
| Unused land | 10.65 | 4.91 | 12.96 | 15.55 | 3.78 | 112.55 | 47.85 |
| Area increase | 1704.91 | 891.30 | 2274.06 | 251.96 | 2120.92 | 47.13 |
Publisher’s Note: MDPI stays neutral with regard to jurisdictional claims in published maps and institutional affiliations. |
© 2022 by the authors. Licensee MDPI, Basel, Switzerland. This article is an open access article distributed under the terms and conditions of the Creative Commons Attribution (CC BY) license (https://creativecommons.org/licenses/by/4.0/).
Share and Cite
Ye, H.; Song, Y.; Xue, D. Multi-Scenario Simulation of Land Use and Habitat Quality in the Guanzhong Plain Urban Agglomeration, China. Int. J. Environ. Res. Public Health 2022, 19, 8703. https://doi.org/10.3390/ijerph19148703
Ye H, Song Y, Xue D. Multi-Scenario Simulation of Land Use and Habitat Quality in the Guanzhong Plain Urban Agglomeration, China. International Journal of Environmental Research and Public Health. 2022; 19(14):8703. https://doi.org/10.3390/ijerph19148703
Chicago/Turabian StyleYe, Hao, Yongyong Song, and Dongqian Xue. 2022. "Multi-Scenario Simulation of Land Use and Habitat Quality in the Guanzhong Plain Urban Agglomeration, China" International Journal of Environmental Research and Public Health 19, no. 14: 8703. https://doi.org/10.3390/ijerph19148703