
Multidisciplinary Neuromuscular and Endurance Interventions on Youth Basketball Players: A Systematic Review with Meta-Analysis and Meta-Regression

 ,
,  ,
,
Abstract
:1. Introduction
2. Materials and Methods
2.1. Literature Search Strategies
2.2. Study Selection
2.3. Inclusion and Exclusion Criteria
2.4. Data Extraction
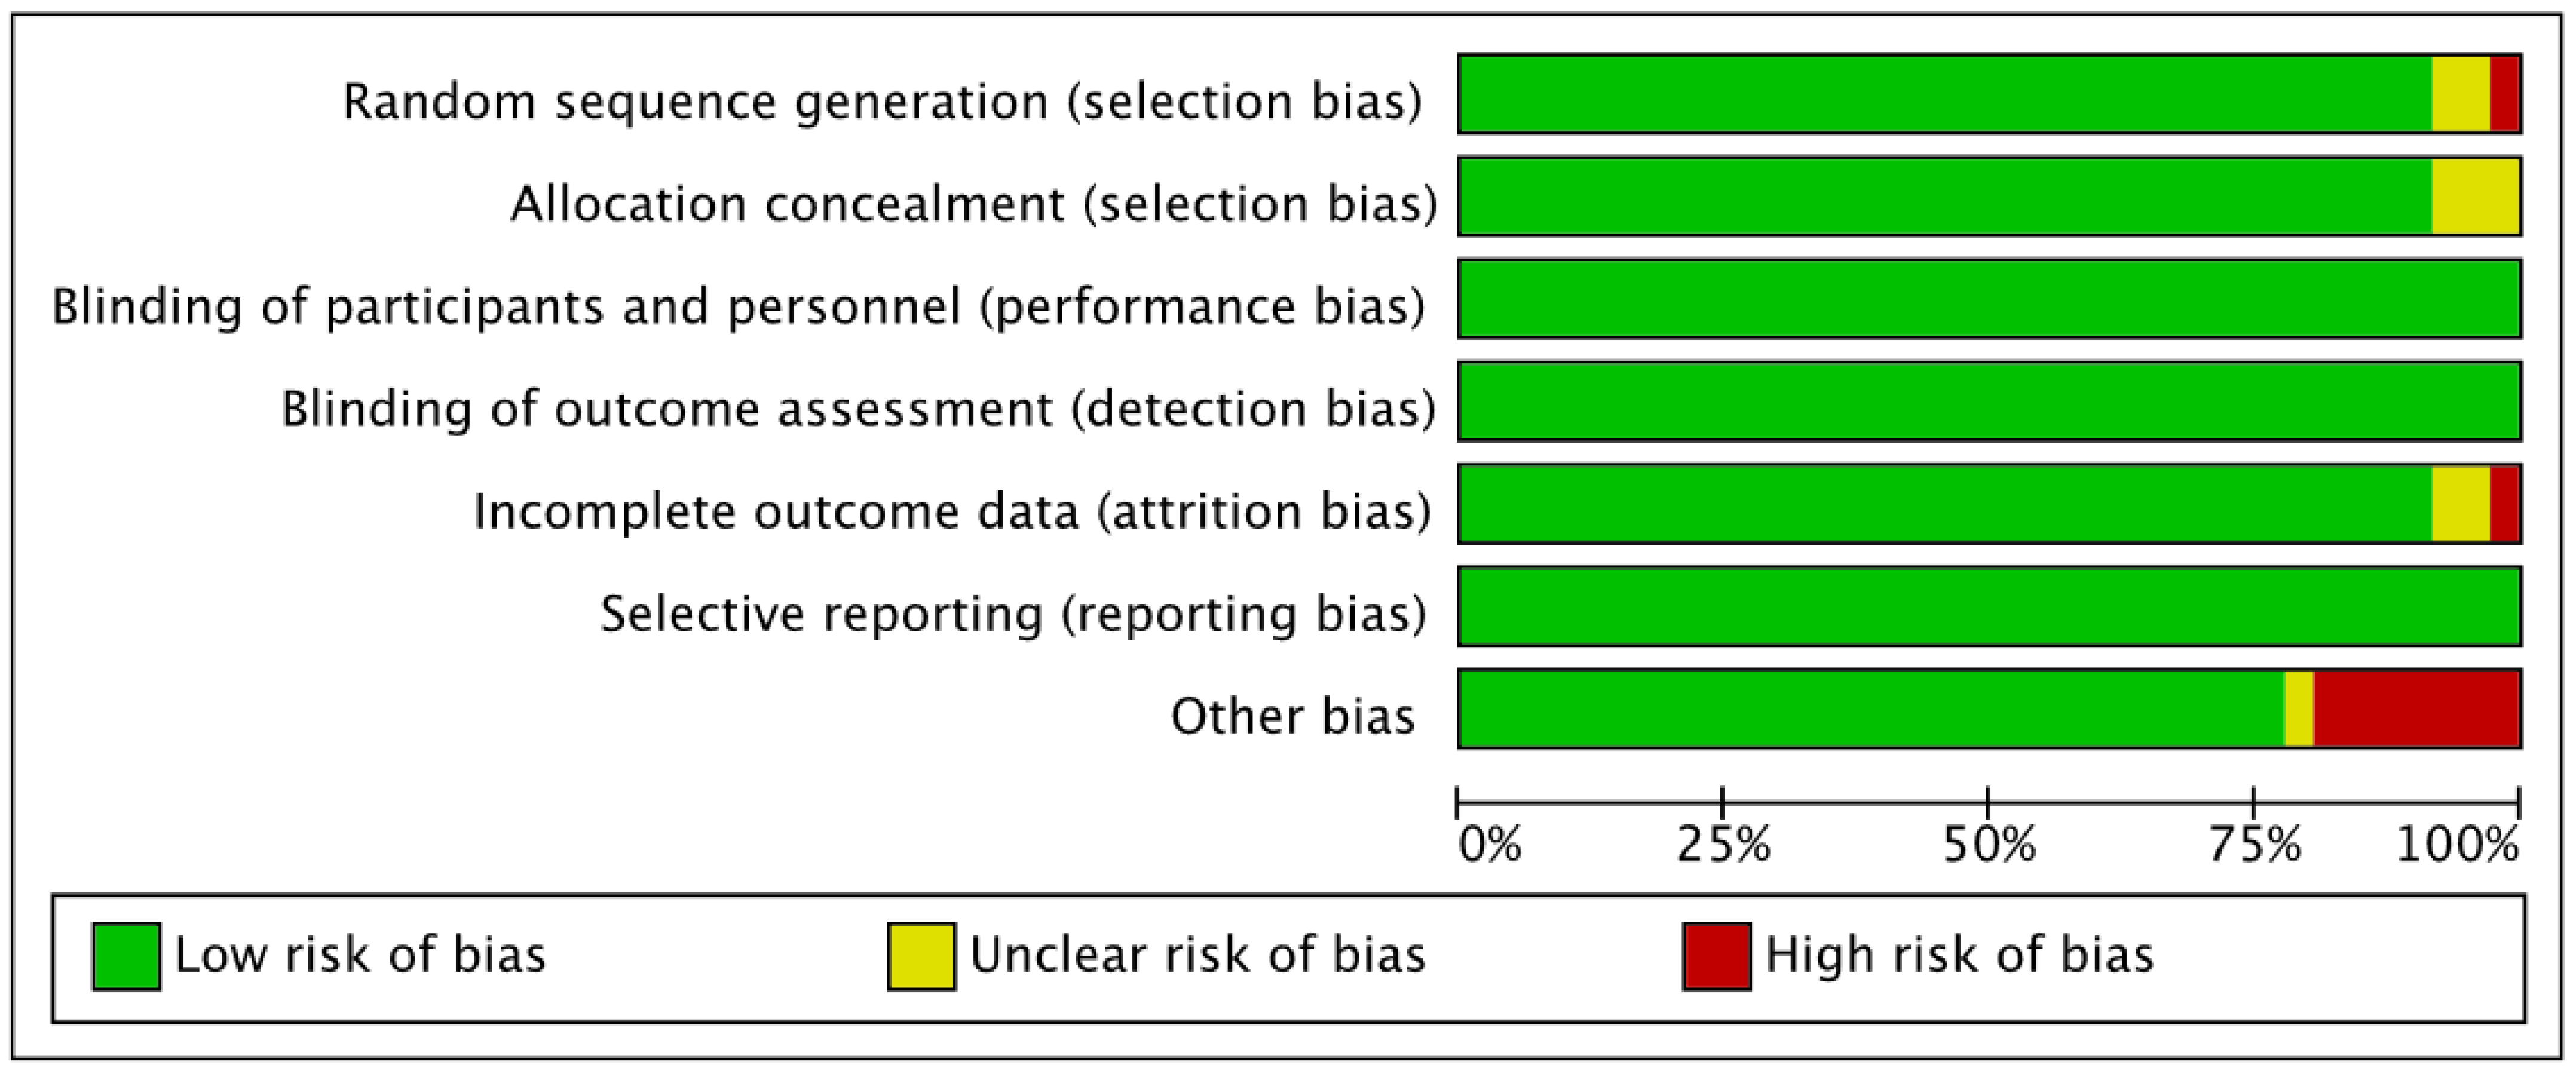
2.5. Risk of Bias Assessment
2.6. Sub-Groups Analyses
2.7. Meta-Regression
2.8. Statistical Analyses
3. Results
3.1. Main Search
3.2. Risk of Bias Assessment
3.3. Neuromuscular Interventions in Youth Basketball Players
3.4. Effect on Neuromuscular Power Vertical
3.4.1. Age
3.4.2. Gender
3.4.3. Competitive Level
3.4.4. Training Type
3.5. Effect on Neuromuscular Power Horizontal
3.5.1. Age
3.5.2. Gender
3.5.3. Competitive Level
3.5.4. Training Type
3.6. Effect on Endurance
3.7. Meta-Regression
4. Discussion
4.1. Perspective
4.2. Limitations
5. Conclusions
Author Contributions
Funding
Institutional Review Board Statement
Data Availability Statement
Acknowledgments
Conflicts of Interest
References
- Stojanovic, E.; Stojiljkovic, N.; Scanlan, A.T.; Dalbo, V.J.; Berkelmans, D.M.; Milanovic, Z. The Activity Demands and Physiological Responses Encountered During Basketball Match-Play: A Systematic Review. Sports Med. 2018, 48, 111–135. [Google Scholar] [CrossRef] [PubMed]
- Petway, A.J.; Freitas, T.T.; Calleja-González, J.; Medina Leal, D.; Alcaraz, P.E. Training load and match-play demands in basketball based on competition level: A systematic review. PLoS ONE 2020, 15, e0229212. [Google Scholar] [CrossRef] [PubMed] [Green Version]
- Gottlieb, R.; Shalom, A.; Calleja-González, J. Physiology of Basketball–Field Tests. J. Hum. Kinet. 2021, 77, 159–167. [Google Scholar] [CrossRef] [PubMed]
- Abdelkrim, N.B.; Castagna, C.; El Fazaa, S.; El Ati, J. The effect of players’ standard and tactical strategy on game demands in men’s basketball. J. Strength Cond. Res. 2010, 24, 2652–2662. [Google Scholar] [CrossRef]
- Abdelkrim, N.B.; Castagna, C.; Jabri, I.; Battikh, T.; El Fazaa, S.; El Ati, J. Activity profile and physiological requirements of junior elite basketball players in relation to aerobic-anaerobic fitness. J. Strength Cond. Res. 2010, 24, 2330–2342. [Google Scholar] [CrossRef]
- Bishop, D.; Wright, C. A time-motion analysis of professional basketball to determine the relationship between three activity profiles: High, medium and low intensity and the length of the time spent on court. Int. J. Perform. Anal. Sport 2006, 6, 130–139. [Google Scholar] [CrossRef]
- Janeira, M.; Maia, J. Game intensity in basketball. An interactionist view linking time-motion analysis, lactate concentration and heart rate. Coach. Sport Sci. J. 1998, 3, 26–30. [Google Scholar]
- McInnes, S.; Carlson, J.; Jones, C.; McKenna, M. The physiological load imposed on basketball players during competition. J. Sports Sci. 1995, 13, 387–397. [Google Scholar] [CrossRef]
- Schelling, X.; Torres-Ronda, L. Conditioning for basketball: Quality and quantity of training. Strength Cond. J. 2013, 35, 89–94. [Google Scholar] [CrossRef]
- Schelling, X.; Torres-Ronda, L. An integrative approach to strength and neuromuscular power training for basketball. Strength Cond. J. 2016, 38, 72–80. [Google Scholar] [CrossRef]
- Narazaki, K.; Berg, K.; Stergiou, N.; Chen, B. Physiological demands of competitive basketball. Scand. J. Med. Sci. Sports 2009, 19, 425–432. [Google Scholar] [CrossRef]
- Scanlan, A.; Dascombe, B.; Reaburn, P. A comparison of the activity demands of elite and sub-elite Australian men’s basketball competition. J. Sports Sci. 2011, 29, 1153–1160. [Google Scholar] [CrossRef]
- Khoramipour, K.; Gaeini, A.A.; Shirzad, E.; Gilany, K.; Chashniam, S.; Sandbakk, Ø. Metabolic load comparison between the quarters of a game in elite male basketball players using sport metabolomics. Eur. J. Sport Sci. 2021, 21, 1022–1034. [Google Scholar] [CrossRef]
- Portes, R.; Jiménez, S.L.; Navarro, R.M.; Scanlan, A.T.; Gómez, M.-Á. Comparing the external loads encountered during competition between elite, junior male and female basketball players. Int. J. Environ. Res. Public Health 2020, 17, 1456. [Google Scholar] [CrossRef] [Green Version]
- Rinaldo, N.; Toselli, S.; Gualdi-Russo, E.; Zedda, N.; Zaccagni, L. Effects of anthropometric growth and basketball experience on physical performance in pre-adolescent male players. Int. J. Environ. Res. Public Health 2020, 17, 2196. [Google Scholar] [CrossRef] [Green Version]
- DiFiori, J.P.; Güllich, A.; Brenner, J.S.; Côté, J.; Hainline, B.; Ryan, E.; Malina, R.M. The NBA and youth basketball: Recommendations for promoting a healthy and positive experience. Sports Med. 2018, 48, 2053–2065. [Google Scholar] [CrossRef] [Green Version]
- Smith, J.J.; Eather, N.; Morgan, P.J.; Plotnikoff, R.C.; Faigenbaum, A.D.; Lubans, D.R. The health benefits of muscular fitness for children and adolescents: A systematic review and meta-analysis. Sports Med. 2014, 44, 1209–1223. [Google Scholar] [CrossRef]
- Bagur-Calafat, C.; Farrerons-Minguella, J.; Girabent-Farrés, M.; Serra-Grima, J. The impact of high level basketball competition, calcium intake, menses, and hormone levels in adolescent bone density: A three-year follow-up. J. Sports Med. Phys. Fit. 2014, 55, 58–67. [Google Scholar]
- Owoeye, O.B.; Ghali, B.; Befus, K.; Stilling, C.; Hogg, A.; Choi, J.; Palacios-Derflingher, L.; Pasanen, K.; Emery, C.A. Epidemiology of all-complaint injuries in youth basketball. Scand. J. Med. Sci. Sports 2020, 30, 2466–2476. [Google Scholar] [CrossRef]
- Post, E.G.; Biese, K.M.; Schaefer, D.A.; Watson, A.M.; McGuine, T.A.; Brooks, M.A.; Bell, D.R. Sport-specific associations of specialization and sex with overuse injury in youth athletes. Sports Health 2020, 12, 36–42. [Google Scholar] [CrossRef]
- Bedoya, A.A.; Miltenberger, M.R.; Lopez, R.M. Plyometric training effects on athletic performance in youth soccer athletes: A systematic review. J. Strength Cond. Res. 2015, 29, 2351–2360. [Google Scholar] [CrossRef] [PubMed]
- Johnson, B.A.; Salzberg, C.L.; Stevenson, D.A. A systematic review: Plyometric training programs for young children. J. Strength Cond. Res. 2011, 25, 2623–2633. [Google Scholar] [PubMed]
- Silva, A.F.; Clemente, F.M.; Lima, R.; Nikolaidis, P.T.; Rosemann, T.; Knechtle, B. The effect of plyometric training in volleyball players: A systematic review. Int. J. Environ. Res. Public Health 2019, 16, 2960. [Google Scholar] [CrossRef] [PubMed] [Green Version]
- Slimani, M.; Chamari, K.; Miarka, B.; Del Vecchio, F.B.; Chéour, F. Effects of plyometric training on physical fitness in team sport athletes: A systematic review. J. Hum. Kinet. 2016, 53, 231–247. [Google Scholar] [CrossRef] [Green Version]
- Van de Hoef, P.A.; Brauers, J.J.; van Smeden, M.; Backx, F.J.; Brink, M.S. The effects of lower-extremity plyometric training on soccer-specific outcomes in adult male soccer players: A systematic review and meta-analysis. Int. J. Sports Physiol. Perform. 2020, 15, 3–17. [Google Scholar] [CrossRef]
- Beato, M.; Bianchi, M.; Coratella, G.; Merlini, M.; Drust, B. Effects of plyometric and directional training on speed and jump performance in elite youth soccer players. J. Strength Cond. Res. 2018, 32, 289–296. [Google Scholar] [CrossRef]
- Mancha-Triguero, D.; Garcia-Rubio, J.; Calleja-González, J.; Ibanez, S.J. Physical fitness in basketball players: A systematic review. J. Sports Med. Phys. Fit. 2019, 59, 1513–1525. [Google Scholar] [CrossRef]
- Mancha-Triguero, D.; García-Rubio, J.; Gamonales, J.M.; Ibáñez, S.J. Strength and Speed Profiles Based on Age and Sex Differences in Young Basketball Players. Int. J. Environ. Res. Public Health 2021, 18, 643. [Google Scholar] [CrossRef]
- Alonso, E.; Miranda, N.; Zhang, S.; Sosa, C.; Trapero, J.; Lorenzo, J.; Lorenzo, A. Peak match demands in young basketball players: Approach and applications. Int. J. Environ. Res. Public Health 2020, 17, 2256. [Google Scholar] [CrossRef] [Green Version]
- Delextrat, A.; Gruet, M.; Bieuzen, F. Effects of small-sided games and high-intensity interval training on aerobic and repeated sprint performance and peripheral muscle oxygenation changes in elite junior basketball players. J. Strength Cond. Res. 2018, 32, 1882–1891. [Google Scholar] [CrossRef]
- Delextrat, A.; Martinez, A. Small-sided game training improves aerobic capacity and technical skills in basketball players. Int. J. Sports Med. 2014, 35, 385–391. [Google Scholar] [CrossRef] [Green Version]
- Granacher, U.; Lesinski, M.; Büsch, D.; Muehlbauer, T.; Prieske, O.; Puta, C.; Gollhofer, A.; Behm, D.G. Effects of resistance training in youth athletes on muscular fitness and athletic performance: A conceptual model for long-term athlete development. Front. Physiol. 2016, 7, 164. [Google Scholar] [CrossRef] [Green Version]
- Pichardo, A.W.; Oliver, J.L.; Harrison, C.B.; Maulder, P.S.; Lloyd, R.S. Integrating models of long-term athletic development to maximize the physical development of youth. Int. J. Sports Sci. Coach. 2018, 13, 1189–1199. [Google Scholar] [CrossRef]
- Nikolaidis, P.T.; Asadi, A.; Santos, E.J.; Calleja-González, J.; Padulo, J.; Chtourou, H.; Zemkova, E. Relationship of body mass status with running and jumping performances in young basketball players. Muscles Ligaments Tendons J. 2015, 5, 187. [Google Scholar] [CrossRef]
- Ford, P.; De Ste Croix, M.; Lloyd, R.; Meyers, R.; Moosavi, M.; Oliver, J.; Till, K.; Williams, C. The long-term athlete development model: Physiological evidence and application. J. Sports Sci. 2011, 29, 389–402. [Google Scholar] [CrossRef]
- Bergeron, M.F.; Mountjoy, M.; Armstrong, N.; Chia, M.; Côté, J.; Emery, C.A.; Faigenbaum, A.; Hall, G.; Kriemler, S.; Léglise, M. International Olympic Committee consensus statement on youth athletic development. Br. J. Sports Med. 2015, 49, 843–851. [Google Scholar] [CrossRef] [Green Version]
- Lloyd, R.S.; Oliver, J.L. The youth physical development model: A new approach to long-term athletic development. Strength Cond. J. 2012, 34, 61–72. [Google Scholar] [CrossRef] [Green Version]
- Viru, A.; Loko, J.; Harro, M.; Volver, A.; Laaneots, L.; Viru, M. Critical periods in the development of performance capacity during childhood and adolescence. Eur. J. Phys. Educ. 1999, 4, 75–119. [Google Scholar] [CrossRef]
- Calleja-González, J.; Mielgo-Ayuso, J.; Lekue, J.A.; Leibar, X.; Erauzkin, J.; Jukic, I.; Ostojic, S.M.; Delextrat, A.; Sampaio, J.; Terrados, N. The Spanish “Century XXI” academy for developing elite level basketballers: Design, monitoring and training methodologies. Physician Sportsmed. 2016, 44, 148–157. [Google Scholar] [CrossRef]
- Harrison, C.B.; Gill, N.D.; Kinugasa, T.; Kilding, A.E. Development of aerobic fitness in young team sport athletes. Sports Med. 2015, 45, 969–983. [Google Scholar] [CrossRef]
- Behm, D.G.; Young, J.D.; Whitten, J.H.; Reid, J.C.; Quigley, P.J.; Low, J.; Li, Y.; Lima, C.D.; Hodgson, D.D.; Chaouachi, A. Effectiveness of traditional strength vs. power training on muscle strength, power and speed with youth: A systematic review and meta-analysis. Front. Physiol. 2017, 8, 423. [Google Scholar] [CrossRef] [Green Version]
- Oliver, J.L.; Lloyd, R.S.; Rumpf, M.C. Developing speed throughout childhood and adolescence: The role of growth, maturation and training. Strength Cond. J. 2013, 35, 42–48. [Google Scholar] [CrossRef] [Green Version]
- Liberati, A.; Altman, D.G.; Tetzlaff, J.; Mulrow, C.; Gøtzsche, P.C.; Ioannidis, J.P.; Clarke, M.; Devereaux, P.J.; Kleijnen, J.; Moher, D. The PRISMA statement for reporting systematic reviews and meta-analyses of studies that evaluate health care interventions: Explanation and elaboration. J. Clin. Epidemiol. 2009, 62, e1–e34. [Google Scholar] [CrossRef] [Green Version]
- Methley, A.M.; Campbell, S.; Chew-Graham, C.; McNally, R.; Cheraghi-Sohi, S. PICO, PICOS and SPIDER: A comparison study of specificity and sensitivity in three search tools for qualitative systematic reviews. BMC Health Serv. Res. 2014, 14, 579. [Google Scholar] [CrossRef] [Green Version]
- Greenhalgh, T.; Peacock, R. Effectiveness and efficiency of search methods in systematic reviews of complex evidence: Audit of primary sources. BMJ 2005, 331, 1064–1065. [Google Scholar] [CrossRef] [Green Version]
- Higgins, J.; Altman, D.; Sterne, J. Chapter 8: Assessing risk of bias in included studies. In Cochrane Handbook for Systematic Reviews of Interventions; Version 5.1.0.; The Cochrane Collaboration: Copenhagen, Denmark, 2011. [Google Scholar]
- Araújo, C.; Scharhag, J. Athlete: A working definition for medical and health sciences research. Scand. J. Med. Sci. Sports 2016, 26, 4–7. [Google Scholar] [CrossRef]
- De la Rubia Riaza, A.; Lorenzo Calvo, J.; Mon-López, D.; Lorenzo, A. Impact of the relative age effect on competition performance in basketball: A qualitative systematic review. Int. J. Environ. Res. Public Health 2020, 17, 8596. [Google Scholar] [CrossRef]
- Arede, J.; Vaz, R.; Franceschi, A.; Gonzalo-Skok, O.; Leite, N. Effects of a combined strength and conditioning training program on physical abilities in adolescent male basketball players. J. Sports Med. Phys. Fit. 2018, 59, 1298–1305. [Google Scholar] [CrossRef]
- Gonzalo-Skok, O.; Tous-Fajardo, J.; Suarez-Arrones, L.; Arjol-Serrano, J.L.; Casajús, J.A.; Mendez-Villanueva, A. Single-leg power output and between-limbs imbalances in team-sport players: Unilateral versus bilateral combined resistance training. Int. J. Sports Physiol. Perform. 2017, 12, 106–114. [Google Scholar] [CrossRef]
- Gonzalo-Skok, O.; Tous-Fajardo, J.; Arjol-Serrano, J.L.; Suarez-Arrones, L.; Casajús, J.A.; Mendez-Villanueva, A. Improvement of repeated-sprint ability and horizontal-jumping performance in elite young basketball players with low-volume repeated-maximal-power training. Int. J. Sports Physiol. Perform. 2016, 11, 464–473. [Google Scholar] [CrossRef]
- Ciacci, S.; Bartolomei, S. The effects of two different explosive strength training programs on vertical jump performance in basketball. J. Sports Med. Phys. Fit. 2017, 58, 1375–1382. [Google Scholar] [CrossRef] [PubMed]
- Higgins, J.P.; López-López, J.A.; Aloe, A.M. Meta-regression. In Handbook of Meta-Analysis; Chapman and Hall: London, UK, 2020; pp. 129–150. [Google Scholar]
- Lipsey, M.W.; Wilson, D.B. Practical Meta-Analysis; SAGE Publications, Inc.: Thousand Oaks, CA, USA, 2001. [Google Scholar]
- Wilson, D.B. Meta-Analysis Macros for SAS, SPSS, and Stata. Available online: http://mason.gmu.edu/~dwilsonb/ma.html (accessed on 8 May 2021).
- Norusis, M. Documentation SPSS for Windows; SPSS Inc.: Chicago, IL, USA, 1993. [Google Scholar]
- Hedges, L.V.; Olkin, I. Statistical Methods for Meta-Analysis; Academic Press: Cambridge, MA, USA, 2014. [Google Scholar]
- DerSimonian, R.; Laird, N. Meta-analysis in clinical trials. Control. Clin. Trials 1986, 7, 177–188. [Google Scholar] [CrossRef]
- Cohen, J. Statistical Power Analysis for the Behavioral Sciences; Academic Press: Cambridge, MA, USA, 2013. [Google Scholar]
- O’Connor, D.; Green, S.; Higgins, J.P. Defining the review question and developing criteria for including studies. In Cochrane Handbook for Systematic Reviews of Interventions; Cochrane Book Series; John Wiley & Sons Ltd.: Chichester, UK, 2008; pp. 81–94. [Google Scholar]
- Aksović, N.; Berić, D.; Kocić, M.; Jakovljević, S.; Milanović, F. Plyometric training and sprint abilities of young basketball players. Facta Univ. Ser. Phys. Educ. Sport 2020, 17, 539–548. [Google Scholar] [CrossRef]
- Asadi, A.; Ramirez-Campillo, R.; Meylan, C.; Nakamura, F.Y.; Cañas-Jamett, R.; Izquierdo, M. Effects of volume-based overload plyometric training on maximal-intensity exercise adaptations in young basketball players. J. Sports Med. Phys. Fit. 2016, 57, 1557–1563. [Google Scholar] [CrossRef]
- Attene, G.; Iuliano, E.; Di Cagno, A.; Calcagno, G.; Moalla, W.; Aquino, G.; Padulo, J. Improving neuromuscular performance in young basketball players: Plyometric vs. technique training. J. Sports Med. Phys. Fit. 2015, 55, 1–8. [Google Scholar]
- Attene, G.; Laffaye, G.; Chaouachi, A.; Pizzolato, F.; Migliaccio, G.M.; Padulo, J. Repeated sprint ability in young basketball players: One vs. two changes of direction (Part 2). J. Sports Sci. 2015, 33, 1553–1563. [Google Scholar] [CrossRef]
- Attene, G.; Pizzolato, F.; Calcagno, G.; Ibba, G.; Pinna, M.; Salernitano, G.; Padulo, J. Sprint vs. intermittent training in young female basketball players. J. Sports Med. Phys. Fit. 2014, 54, 154–161. [Google Scholar]
- Bouteraa, I.; Negra, Y.; Shephard, R.J.; Chelly, M.S. Effects of combined balance and plyometric training on athletic performance in female basketball players. J. Strength Cond. Res. 2020, 34, 1967–1973. [Google Scholar] [CrossRef]
- Figueira, B.; Gonçalves, B.; Abade, E.; Paulauskas, R.; Masiulis, N.; Sampaio, J. Effects of a 4-week combined sloped training program in young basketball players’ physical performance. Sci. Sports 2020, 35, 172.e171–172.e179. [Google Scholar] [CrossRef]
- Gonzalo-Skok, O.; Sánchez-Sabaté, J.; Izquierdo-Lupón, L.; Sáez de Villarreal, E. Influence of force-vector and force application plyometric training in young elite basketball players. Eur. J. Sport Sci. 2019, 19, 305–314. [Google Scholar] [CrossRef]
- Gonzalo-Skok, O.; Tous-Fajardo, J.; Moras, G.; Arjol-Serrano, J.L.; Mendez-Villanueva, A. A repeated power training enhances fatigue resistance while reducing intraset fluctuations. J. Strength Cond. Res. 2019, 33, 2711–2721. [Google Scholar] [CrossRef]
- Gottlieb, R.; Eliakim, A.; Shalom, A.; Dello-Iacono, A.; Meckel, Y. Improving anaerobic fitness in young basketball players: Plyometric vs. specific sprint training. J. Athl. Enhanc. 2014, 3, 3. [Google Scholar]
- Hernández, S.; Ramirez-Campillo, R.; Álvarez, C.; Sanchez-Sanchez, J.; Moran, J.; Pereira, L.A.; Loturco, I. Effects of plyometric training on neuromuscular performance in youth basketball players: A pilot study on the influence of drill randomization. J. Sports Sci. Med. 2018, 17, 372. [Google Scholar]
- Matavulj, D.; Kukolj, M.; Ugarkovic, D.; Tihanyi, J.; Jaric, S. Effects of pylometric training on jumping performance in junior basketball players. J. Sports Med. Phys. Fit. 2001, 41, 159–164. [Google Scholar]
- McCormick, B.T.; Hannon, J.C.; Newton, M.; Shultz, B.; Detling, N.; Young, W.B. The effects of frontal-and sagittal-plane plyometrics on change-of-direction speed and power in adolescent female basketball players. Int. J. Sports Physiol. Perform. 2016, 11, 102–107. [Google Scholar] [CrossRef]
- Meszler, B.; Váczi, M. Effects of short-term in-season plyometric training in adolescent female basketball players. Physiol. Int. 2019, 106, 168–179. [Google Scholar] [CrossRef]
- Santos, E.J.; Janeira, M.A. Effects of complex training on explosive strength in adolescent male basketball players. J. Strength Cond. Res. 2008, 22, 903–909. [Google Scholar] [CrossRef] [Green Version]
- Santos, E.J.; Janeira, M.A. The effects of resistance training on explosive strength indicators in adolescent basketball players. J. Strength Cond. Res. 2012, 26, 2641–2647. [Google Scholar] [CrossRef] [Green Version]
- Tsimahidis, K.; Galazoulas, C.; Skoufas, D.; Papaiakovou, G.; Bassa, E.; Patikas, D.; Kotzamanidis, C. The effect of sprinting after each set of heavy resistance training on the running speed and jumping performance of young basketball players. J. Strength Cond. Res. 2010, 24, 2102–2108. [Google Scholar] [CrossRef]
- Yáñez-García, J.M.; Rodríguez-Rosell, D.; Mora-Custodio, R.; González-Badillo, J.J. Changes in Muscle Strength, Jump, and Sprint Performance in Young Elite Basketball Players: The Impact of Combined High-Speed Resistance Training and Plyometrics. J. Strength Cond. Res. 2022, 36, 478–485. [Google Scholar] [CrossRef]
- Aschendorf, P.F.; Zinner, C.; Delextrat, A.; Engelmeyer, E.; Mester, J. Effects of basketball-specific high-intensity interval training on aerobic performance and physical capacities in youth female basketball players. Physician Sportsmed. 2019, 47, 65–70. [Google Scholar] [CrossRef] [PubMed]
- Ignjatovic, A.; Radovanovic, D.; Stankovic, R.; Marković, Z.; Kocic, J. Influence of resistance training on cardiorespiratory endurance and muscle power and strength in young athletes. Acta Physiol. Hung. 2011, 98, 305–312. [Google Scholar] [CrossRef] [PubMed]
- Calleja González, J.; Mielgo Ayuso, J.; Lekue, J.A.; Leibar, X.; Erauzkin, J.; Jukic, I.; Ostojic, S.M.; Ponce González, J.G.; Fuentes Azpiroz, M.; Terrados, N. Anthropometry and performance of top youth international male basketball players in Spanish national academy. Nutr. Hosp. 2018, 35, 1331–1339. [Google Scholar] [CrossRef] [PubMed] [Green Version]
- Balyi, I.; Hamilton, A. Long-term athlete development: Trainability in childhood and adolescence. Olymp. Coach. 2004, 16, 4–9. [Google Scholar]
- Carvalho, H.M.; Coelho-e-Silva, M.; Valente-dos-Santos, J.; Gonçalves, R.S.; Philippaerts, R.; Malina, R. Scaling lower-limb isokinetic strength for biological maturation and body size in adolescent basketball players. Eur. J. Appl. Physiol. 2012, 112, 2881–2889. [Google Scholar] [CrossRef] [PubMed]
- Castillo, D.; Raya-González, J.; Scanlan, A.T.; Sánchez-Díaz, S.; Lozano, D.; Yanci, J. The influence of physical fitness attributes on external demands during simulated basketball matches in youth players according to age category. Physiol. Behav. 2021, 233, 113354. [Google Scholar] [CrossRef]
- Kelly, A.L.; Jiménez Sáiz, S.L.; Lorenzo Calvo, A.; de la Rubia, A.; Jackson, D.T.; Jeffreys, M.A.; Ford, C.; Owen, D.; Santos, S.D.L.d. Relative Age Effects in Basketball: Exploring the Selection into and Successful Transition Out of a National Talent Pathway. Sports 2021, 9, 101. [Google Scholar] [CrossRef]
- Noyes, F.R.; Barber-Westin, S.D.; Smith, S.T.; Campbell, T.; Garrison, T.T. A training program to improve neuromuscular and performance indices in female high school basketball players. J. Strength Cond. Res. 2012, 26, 709–719. [Google Scholar] [CrossRef] [Green Version]
- Zwolski, C.; Quatman-Yates, C.; Paterno, M.V. Resistance training in youth: Laying the foundation for injury prevention and physical literacy. Sports Health 2017, 9, 436–443. [Google Scholar] [CrossRef] [Green Version]
- Sander, A.; Keiner, M.; Wirth, K.; Schmidtbleicher, D. Influence of a 2-year strength training programme on power performance in elite youth soccer players. Eur. J. Sport Sci. 2013, 13, 445–451. [Google Scholar] [CrossRef]
- Lesinski, M.; Prieske, O.; Granacher, U. Effects and dose–response relationships of resistance training on physical performance in youth athletes: A systematic review and meta-analysis. Br. J. Sports Med. 2016, 50, 781–795. [Google Scholar] [CrossRef] [Green Version]
- Brown, K.A.; Patel, D.R.; Darmawan, D. Participation in sports in relation to adolescent growth and development. Transl. Pediatr. 2017, 6, 150. [Google Scholar] [CrossRef] [Green Version]
- Faigenbaum, A.; Chu, D. Plyometric Training for Children and Adolescents; American College of Sports Medicine: Indianapolis, IN, USA, 2001. [Google Scholar]
- Grgic, J.; Schoenfeld, B.J.; Mikulic, P. Effects of plyometric vs. resistance training on skeletal muscle hypertrophy: A review. J. Sport Health Sci. 2021, 10, 530–536. [Google Scholar] [CrossRef]
- McKinlay, B.J.; Wallace, P.; Dotan, R.; Long, D.; Tokuno, C.; Gabriel, D.A.; Falk, B. Effects of plyometric and resistance training on muscle strength, explosiveness, and neuromuscular function in young adolescent soccer players. J. Strength Cond. Res. 2018, 32, 3039–3050. [Google Scholar] [CrossRef]
- Pardos-Mainer, E.; Lozano, D.; Torrontegui-Duarte, M.; Cartón-Llorente, A.; Roso-Moliner, A. Effects of strength vs. plyometric training programs on vertical jumping, linear sprint and change of direction speed performance in female soccer players: A systematic review and meta-analysis. Int. J. Environ. Res. Public Health 2021, 18, 401. [Google Scholar] [CrossRef]
- Stojanović, E.; Ristić, V.; McMaster, D.T.; Milanović, Z. Effect of plyometric training on vertical jump performance in female athletes: A systematic review and meta-analysis. Sports Med. 2017, 47, 975–986. [Google Scholar] [CrossRef]
- Rumpf, M.C.; Cronin, J.B.; Pinder, S.D.; Oliver, J.; Hughes, M. Effect of different training methods on running sprint times in male youth. Pediatr. Exerc. Sci. 2012, 24, 170–186. [Google Scholar] [CrossRef]
- Philippaerts, R.M.; Vaeyens, R.; Janssens, M.; Van Renterghem, B.; Matthys, D.; Craen, R.; Bourgois, J.; Vrijens, J.; Beunen, G.; Malina, R.M. The relationship between peak height velocity and physical performance in youth soccer players. J. Sports Sci. 2006, 24, 221–230. [Google Scholar] [CrossRef]
- Edwards, T.; Weakley, J.; Banyard, H.G.; Cripps, A.; Piggott, B.; Haff, G.G.; Joyce, C. Influence of age and maturation status on sprint acceleration characteristics in junior Australian football. J. Sports Sci. 2021, 39, 1585–1593. [Google Scholar] [CrossRef]
- Meyers, R.W.; Oliver, J.L.; Hughes, M.G.; Cronin, J.B.; Lloyd, R.S. Maximal sprint speed in boys of increasing maturity. Pediatr. Exerc. Sci. 2015, 27, 85–94. [Google Scholar] [CrossRef] [Green Version]
- Meyers, R.W.; Oliver, J.L.; Hughes, M.G.; Lloyd, R.S.; Cronin, J.B. New insights into the development of maximal sprint speed in male youth. Strength Cond. J. 2017, 39, 2–10. [Google Scholar] [CrossRef]
- McManus, A.M.; Armstrong, N. Physiology of elite young female athletes. Elite Young Athl. 2011, 56, 23–46. [Google Scholar]
- Sommi, C.; Gill, F.; Trojan, J.D.; Mulcahey, M.K. Strength and conditioning in adolescent female athletes. Physician Sportsmed. 2018, 46, 420–426. [Google Scholar] [CrossRef]
- Armstrong, N.; McManus, A.M. Physiology of elite young male athletes. Elite Young Athl. 2011, 56, 1–22. [Google Scholar]
- Rice, P.E.; Goodman, C.L.; Capps, C.R.; Triplett, N.T.; Erickson, T.M.; McBride, J.M. Force–and power–time curve comparison during jumping between strength-matched male and female basketball players. Eur. J. Sport Sci. 2017, 17, 286–293. [Google Scholar] [CrossRef]
- Haizlip, K.; Harrison, B.; Leinwand, L. Sex-based differences in skeletal muscle kinetics and fiber-type composition. Physiology 2015, 30, 30–39. [Google Scholar] [CrossRef]
- Bottinelli, R.; Canepari, M.; Pellegrino, M.; Reggiani, C. Force-velocity properties of human skeletal muscle fibres: Myosin heavy chain isoform and temperature dependence. J. Physiol. 1996, 495, 573–586. [Google Scholar] [CrossRef] [PubMed]
- Laffaye, G.; Wagner, P.P.; Tombleson, T.I. Countermovement jump height: Gender and sport-specific differences in the force-time variables. J. Strength Cond. Res. 2014, 28, 1096–1105. [Google Scholar] [CrossRef]
- Radnor, J.M.; Oliver, J.L.; Waugh, C.M.; Myer, G.D.; Moore, I.S.; Lloyd, R.S. The influence of growth and maturation on stretch-shortening cycle function in youth. Sports Med. 2018, 48, 57–71. [Google Scholar] [CrossRef] [PubMed] [Green Version]
- Ramos, S.; Volossovitch, A.; Ferreira, A.P.; Fragoso, I.; Massuça, L.M. Training Experience and Maturational, Morphological, and Fitness Attributes as Individual Performance Predictors in Male and Female under-14 Portuguese Elite Basketball Players. J. Strength Cond. Res. 2021, 35, 2025–2032. [Google Scholar] [CrossRef] [PubMed]
- Sekulic, D.; Spasic, M.; Mirkov, D.; Cavar, M.; Sattler, T. Gender-specific influences of balance, speed, and power on agility performance. J. Strength Cond. Res. 2013, 27, 802–811. [Google Scholar] [CrossRef]
- Torres-Unda, J.; Zarrazquin, I.; Gil, J.; Ruiz, F.; Irazusta, A.; Kortajarena, M.; Seco, J.; Irazusta, J. Anthropometric, physiological and maturational characteristics in selected elite and non-elite male adolescent basketball players. J. Sports Sci. 2013, 31, 196–203. [Google Scholar] [CrossRef]
- Erculj, F.; Blas, M.; Bracic, M. Physical demands on young elite European female basketball players with special reference to speed, agility, explosive strength, and take-off power. J. Strength Cond. Res. 2010, 24, 2970–2978. [Google Scholar] [CrossRef]
- Slimani, M.; Paravlić, A.; Bragazzi, N.L. Data concerning the effect of plyometric training on jump performance in soccer players: A meta-analysis. Data Brief 2017, 15, 324–334. [Google Scholar] [CrossRef]
- Thapa, R.K.; Lum, D.; Moran, J.; Ramirez-Campillo, R. Effects of Complex Training on Sprint, Jump, and Change of Direction Ability of Soccer Players: A Systematic Review and Meta-Analysis. Front. Psychol. 2020, 11, 627869. [Google Scholar] [CrossRef]
- Perez-Gomez, J.; Calbet, J. Training methods to improve vertical jump performance. J. Sports Med. Phys. Fit. 2013, 53, 339–357. [Google Scholar]
- De Villarreal, E.S.-S.; Kellis, E.; Kraemer, W.J.; Izquierdo, M. Determining variables of plyometric training for improving vertical jump height performance: A meta-analysis. J. Strength Cond. Res. 2009, 23, 495–506. [Google Scholar] [CrossRef]
- Darmiento, A.; Galpin, A.J.; Brown, L.E. Vertical jump and power. Strength Cond. J. 2012, 34, 34–43. [Google Scholar] [CrossRef]
- Zghal, F.; Colson, S.S.; Blain, G.; Behm, D.G.; Granacher, U.; Chaouachi, A. Combined resistance and plyometric training is more effective than plyometric training alone for improving physical fitness of pubertal soccer players. Front. Physiol. 2019, 10, 1026. [Google Scholar] [CrossRef] [Green Version]
- Davies, G.; Riemann, B.L.; Manske, R. Current concepts of plyometric exercise. Int. J. Sports Phys. Ther. 2015, 10, 760. [Google Scholar]
- Ramírez-Campillo, R.; Gallardo, F.; Henriquez-Olguín, C.; Meylan, C.M.; Martínez, C.; Álvarez, C.; Caniuqueo, A.; Cadore, E.L.; Izquierdo, M. Effect of vertical, horizontal, and combined plyometric training on explosive, balance, and endurance performance of young soccer players. J. Strength Cond. Res. 2015, 29, 1784–1795. [Google Scholar] [CrossRef] [Green Version]
- Ramírez-Campillo, R.; Vergara-Pedreros, M.; Henríquez-Olguín, C.; Martínez-Salazar, C.; Alvarez, C.; Nakamura, F.Y.; De La Fuente, C.I.; Caniuqueo, A.; Alonso-Martinez, A.M.; Izquierdo, M. Effects of plyometric training on maximal-intensity exercise and endurance in male and female soccer players. J. Sports Sci. 2016, 34, 687–693. [Google Scholar] [CrossRef]
- Young, W.; Mc Lean, B.; Ardagna, J. Relationship between strength qualities and sprinting performance. J. Sports Med. Phys. Fit. 1995, 35, 13–19. [Google Scholar]
- Young, L.; O’Connor, J.; Alfrey, L. Physical literacy: A concept analysis. Sport Educ. Soc. 2020, 25, 946–959. [Google Scholar] [CrossRef]
- Faigenbaum, A.D.; Myer, G.D. Resistance training among young athletes: Safety, efficacy and injury prevention effects. Br. J. Sports Med. 2010, 44, 56–63. [Google Scholar] [CrossRef] [Green Version]
- Malina, R.M. Weight training in youth-growth, maturation, and safety: An evidence-based review. Clin. J. Sport Med. 2006, 16, 478–487. [Google Scholar] [CrossRef]
- Riley, R.D.; Higgins, J.P.; Deeks, J.J. Interpretation of random effects meta-analyses. BMJ 2011, 342, d549. [Google Scholar] [CrossRef] [PubMed] [Green Version]


| P (Population) | “youth basketball players” |
| I (Intervention) | “neuromuscular and endurance conditioning interventions” |
| C (Comparators) | “group comparison with multidisciplinary interventions and controls” |
| O (Outcomes) | “neuromuscular power (vertical and horizontal) and endurance” |
| S (Study design) | “any type of design” |
| Author | Participants/ Gender | Age/ Level | Duration/Type of Intervention | Outcome | Pre Test (Unit): M ± SD | Post Test (Unit): M ± SD | Sig |
|---|---|---|---|---|---|---|---|
| Aksović et al. 2020 [61] | 33, M | U-16 amateur | 10 weeks. Plyometric program | NPH | S5m (s): 1.21 ± 0.034 S10m (s): 2.03 ± 0.048 S20m (s): 3.48 ± 0.149 | S5m (s): 1.14 ± 0.066 * S10m (s): 1.95 ± 0.084 S20m (s): 3.36 ± 0.169 * | * significant main effect pre and post |
| Arede et al. 2018 [49] | 16, M | U-16 amateur | 8 weeks. Mixed strength and conditioning program | NPV NPH | CMJ (cm): 30.31 ± 3.48 SJ (cm): 27.24 ± 2.91 S10m (s): 2.3 ± 0.11 505 (s): 5.54 ± 0.20 | CMJ (cm): 32.34 ± 4.94 *† SJ (cm): 29.37 ±3.72 * S10m (s): 1.95 ± 0.07 *† 505 (s): 5.50 ± 0.17 | * significant pre and post † significant EG vs. CG |
| Asadi et al. 2016 [62] | 16, M | U-18 elite | 8 weeks. Plyometric training program. | NPV NPH | VJ (cm): 44.2 ± 2.1 BJ (cm): 228 ± 4.4 t-Test (s): 13.34 ± 0.50 Illinois (s): 18.92 ± 0.76 1RM (kg): 183 ± 8.7 S60m (s): 8.87 ± 0.46 | VJ (cm): 50.5 ± 2.2 *† BJ (cm): 239 ± 3.9 *† t-Test (s): 12.20 ± 0.32 *† Illinois (s): 17.81 ± 0.71 *† 1RM (kg): 200 ± 9.8 *† S60m (s): 7.45 ± 0.41 *† | * significant pre and post † significant EG vs. CG |
| Aschendorf et al. 2019 [79] | 25, F | U-16 elite | 5 weeks. B- specific HIIT program | E | Yo-Yo (m): 1498 ± 266 S20m (s): 5.62 ± 0.30 S20m ball (s): 5.79 ± 0.31 CMJ (cm): 26.85 ± 3.73 CMJ arm (cm): 29.95 ± 4.59 SJ (cm): 25.45 ± 3.43 LJ (cm): 177 ± 10.2 Pass (m): 9.85 ± 0.79 | Yo-Yo (m): 1895 ± 42 * S20m (s): 5.53 ± 0.22 * S20m ball (s): 5.72 ± 0.24 * CMJ (cm): 27.05 ± 3.63 CMJ arm (cm): 30.52 ± 3.69 SJ (cm): 25.25 ± 3.69 LJ (cm): 177 ± 14.3 Pass (m): 10.24 ± 0.58 *† | * significant pre and post † significant EG vs. CG |
| Attene et al. 2014_RST [65] | 16, F | U-16 elite | 6 weeks. Repeated Sprint training | E | BT (s): 6.74 ± (0.3) WT (s): 7.26 ± (0.27) TT (s): 69.91 ± (2.73) BLa: 8.45 ± (2.41) FI%: 3.79 ± (1.57) Y Dis (m): 605 ± (233) Y Speed (Km·h): 14.5 ± (0.46) Y HR (bpm): 199 ± (8) | BT (s): 6.53 ± (0.19) * WT (s): 6.87 ± (0.27) TT (s): 67 ± (2.23) BLa: 7.11 ± (2.29) FI%: 2.69 ± (0.58) Y Dis (m): 775 ± (242) Y Speed (Km·h): 14.75 ± (0.38) Y HR (bpm): 200 ± (10) | * significant pre and post No significant main effect on training type |
| Attene et al. 2014_IT [65] | 16, F | U-16 elite | 6 weeks. Intermittent training | E | BT (s): 6.83 ± (0.24) WT (s): 7.28 ± (0.33) TT (s): 70.6 ± (2.42) BLa: 9.45 ± (1.63) FI%: 3.34 ± (1.34) Y Dis (m): 720 ± (291) Y Speed (Km·h): 14.81 ± (0.53) Y HR (bpm): 201 ± (5) | BT (s): 6.41 ± (0.1) * WT (s): 6.89 ± (0.32) * TT (s): 66.37 ± (1.83) * BLa: 6.49 ± (1.35) * FI%: 3.54 ± (1.87) Y Dis (m): 905 ± (217) * Y Speed (Km·h): 14.94 ± (0.42) * Y HR (bpm): 196 ± (6) | * significant pre and post No significant main effect on training type |
| Attene et al. 2015 [63] | 36, F | U-16 elite | 6 weeks. Plyometric training program. | NPV | CMJ Height (cm): 26.94 ± 3.62 CMJ power (w/kg): 24.52 ± 7.35 CMJ strength (n/kg): 20.22 ± 2.88 CMJ Speed (cm/s): 149 ± 31.06 SJ Height (cm): 22.71 ± 3.24 SJ power (w/kg): 29.64 ± 4.14 SJ max power (w/kg): 31.59 ± 3.87 SJ strength (n/kg): 20.76 ± 4.53 SJ Speed (cm/s): 183 ± 15.60 | CMJ Height (cm): 29.99 ± 3.65 *† CMJ power (w/kg): 27.47 ± 7.19 * CMJ strength (n/kg): 22.29 ± 2.60 * CMJ Speed (cm/s): 168 ± 28.03 * SJ Height (cm): 26.21 ± 3.55 *† SJ power (w/kg): 31.77 ± 4.13 * SJ max power (w/kg): 32.21 ± 4.21 SJ strength (n/kg): 22.44 ± 2.98 SJ Speed (cm/s): 197 ± 14.39 * | * significant pre and post † just significant main effect for SJ and CMJ height in BPT group |
| Attene et al. 2015b_RST [64] | 18, M | U-16 elite | 4 weeks. Repeated Sprint training | E | RSA BT (s): 6.042 ± 0.351 RSA WT (s): 6.583 ± 0.418 RSA TT (s): 63.06 ± 3.731 RSA FI (%):4.4 ± 2.3 IRSA BT (s): 7.320 ± 0.463 IRSA WT (s): 7.888 ± 0.548 IRSA TT (s): 76.26 ± 5.095 IRSA FI (%): 4.2 ± 1.2 SJ (cm): 35.0 ± 4.0 CMJ (cm): 35.3 ± 2.8 Yo-Yo (m): 1233 ± 663 | RSA BT (s): 5.940 ± 0.307 * RSA WT (s): 6.277 ± 0.410 * RSA TT (s): 61.24 ± 3.593 RSA FI (%): 3.1 ± 1.3 * IRSA BT (s): 7.206 ± 0.439 * IRSA WT (s): 7.565 ± 0.436 IRSA TT (s): 73.92 ± 4.527 IRSA FI (%): 2.6 ± 0.9 SJ (cm): 36.1 ± 3.2 CMJ (cm): 36.5 ± 3.4 * Yo-Yo (m): 1549 ± 679 * | * significant pre and post |
| Attene et al. 2015b_IRST [64] | 18, M | U-16 elite | 4 weeks. Intensive Repeated Sprint training | E | RSA BT (s): 5.676 ± 0.198 RSA WT (s): 6.121 ± 0.280 RSA TT (s): 58.89 ± 2.040 RSA FI (%): 3.8 ± 1.4 IRSA BT (s): 6.877 ± 0.267 IRSA WT (s): 7.385 ± 0.360 IRSA TT (s): 71.25 ± 2.943 IRSA FI (%): 3.6 ± 1.0 SJ (cm): 39.3 ± 3.6 CMJ (cm): 37.8 ± 4.1 Yo-Yo (m): 1933 ± 560 | RSA BT (s): 5.595 ± 0.180 RSA WT (s): 5.975 ± 0.342 RSA TT (s): 57.57 ± 2.163 RSA FI (%): 2.9 ± 1.2 * IRSA BT (s): 6.665 ± 0.245 * IRSA WT (s): 7.011 ± 0.327 * IRSA TT (s): 68.54 ± 2.986 IRSA FI (%): 2.8 ± 1.5 SJ (cm): 41.3 ± 3.5 * CMJ (cm): 40.7 ± 4.5 *† Yo-Yo (m): 2244 ± 638 | * significant pre and post † just significant main effect for CMJ in IRSAG |
| Bouteraa et al. 2020 [66] | 22, F | U-18, amateur | 8 weeks. Plyometric training program. | NPV NPH | SJ (cm): 20.4 ± 3.9 CMJ (cm): 26.8 ± 3.8 DJ (cm): 24.7 ± 2.9 DJ (w/kg): 26.5 ± 4.0 S5m (s): 0.95 ± 0.08 S10m (s): 1.82 ± 0.14 S20m (s): 3.39 ± 0.25 SBT (cm): 17.3 ± 9.6 YBT (cm): 104.3 ± 9.7 Illiniois (s): 11.3 ± 0.6 | SJ (cm): 22.5 ± 3.5 CMJ (cm): 28.8 ± 3.3 DJ (cm): 28.4 ± 3.0 *† DJ (w/kg): 27.8 ± 5.0 S5m (s): 0.91 ± 0.05 S10m (s): 1.72 ± 0.09 S20m (s): 3.27 ± 0.16 SBT (cm): 39.2 ± 13.3 *† YBT (cm): 114.4 ± 10.4 *† Illiniois (s): 10.6 ± 0.4 *† | * significant pre and post † just significant main effect for EG compared to CG |
| Figueira et al. 2020_FLAT [67] | 31, M | U-14 elite | 4 weeks. Plyometric training program flat | NPV NPH | Standing height jump (cm): 48.20 ± 5.29 Drop Jump (cm): 42.00 ± 7.44 Contact time (ms): 200.20 ± 26.62 Jump Power (W): 1171.20 ± 256.01 Jump power (W/kg): 20.95 ± 2.90 AnAl Power (W): 859.33 ± 160.16 AnAl Power (Wkg): 15.36 ± 1.33 Hexagon agility (s): 13.21 ± 1.88 | Standing height jump (cm): 52.27 ± 4.13 † Drop Jump (cm): 46.00 ± 7.51 Contact time (ms): 192.07 ± 26.95 Jump Power (W): 1331.33 ± 304.19 Jump power (wKg): 23.78 ± 4.66 AnAl Power (W): 882.00 ± 196.76 AnAl Power (Wkg): 15.59 ± 1.312 Hexagon agility (s): 11.62 ± 0.77 | † just significant main effect for standing height jump in FLAT No look at pre to post changes |
| Figueira et al. 2020_SLOPE [67] | 31, M | U-14 elite | 4 weeks. Plyometric training program slope | NPV NPH | Standing height jump (cm): 47.20 ± 5.72 Drop Jump (cm): 42.20 ± 6.17 Contact time (ms): 238.20 ± 35.22 Jump Power (W): 923.07 ± 250.73 Jump power (Wkg): 17.56 ± 2.61 AnAl Power (W): 714.27 ± 195.70 AnAl power (Wkg): 13.50 ± 1.39 Hexagon agility (s): 14.37 ± 0.80 | Standing height jump (cm): 46.13 ± 6.01 Drop Jump (cm): 43.53 ± 9.01 Contact time (ms): 216.80 ± 41.85 Jump Power (W): 1011.47 ± 225.18 Jump power (wKg): 19.30 ± 3.22 AnAl Power (W): 750.80 ± 204.46 AnAl power (Wkg): 14.16 ± 1.37 Hexagon agility (s): 13.11 ± 0.74 | No look at pre to post changes |
| Gonzalo-Skok et al. 2017_BIL [50] | 22, M | U-16 to U-18 elite | 6 weeks. Mixed strength and conditioning program bilateral | NPV NPH | V-cut test (s): 6.63 ± 0.24 180° RCOD (s): 3.50 ± 0.12 180° LCOD (s): 3.48 ± 0.12 MP BIL (W): 407.5 ± 56.2 MP UNI R (W): 270.1 ± 32.8 MP UNI L (W): 270.9 ± 51.3 BL Imb (%): 6.9 ± 5.0 BL Def (%): 23.1 ± 8.4 S5m (s): 1.10 ± 0.05 S15m (s): 2.52 ± 0.09 S25m (s): 3.80 ± 0.15 CMJ (cm): 38.9 ± 5.3 | V-cut test (s): 6.56 ± 0.20 180° RCOD (s): 3.45 ± 0.09 180° LCOD (s): 3.48 ± 0.11 MP BIL (W): 470.2 ± 75.8 ** MP UNI R (W): 330.1 ± 61.2 * MP UNI L (W): 330.4 ± 73.8 * BL Imb (%): 4.4 ± 2.5 BL Def (%): 27.0 ± 6.4 S5m (s): 1.06 ± 0.02 * S15m (s): 2.46 ± 0.07 * S25m (s): 3.69 ± 0.15 * CMJ (cm): 40.6 ± 5.5 | * Very likely changes pre and post ** almost certainly changes pre to post |
| Gonzalo-Skok et al. 2017_UNI [50] | 22, M | U-16 to U-18 elite | 6 weeks. Mixed strength and conditioning program unilateral | NPV NPH | V-cut test (s): 6.57 ± 0.23 180° RCOD (s): 3.54 ± 0.15 180° LCOD (s): 3.55 ± 0.17 MP BIL (W): 406.9 ± 48.5 MP UNI R (W): 273.7 ± 40.0 MP UNI L (W): 271.2 ± 36.8 BLImb (%): 9.6 ± 3.8 BLDef (%): 24.8 ± 8.9 S5m (s): 1.13 ± 0.05 S15m (s): 2.54 ± 0.08 S25m (s): 3.84 ± 0.12 CMJ (cm): 37.4 ± 4.2 | V-cut test (s): 6.50 ± 0.18 180° RCOD (s): 3.47 ± 0.10 * 180° LCOD (s): 3.46 ± 0.15 † MP BIL (W): 466.3 ± 72.8 ** MP UNI R (W): 372.2 ± 57.3 **† MP UNI L (W): 370.4 ± 50.4 **† BLImb (%): 4.8 ± 1.3 *† BLDef (%): 36.8 ± 7.7 S5m (s): 1.07 ± 0.06 ** S15m (s): 2.48 ± 0.1 ** S25m (s): 3.75 ± 0.15 ** CMJ (cm): 39.8 ± 5.1 * | * Very likely changes pre and post ** almost certainly changes pre to post † likely changes between UNI and BIL |
| Gonzalo-Skok et al. 2016 [51] | 22, M | U-16 to U-18 elite | 6 weeks. Mixed strength and conditioning program repeated power training | NPH | RSA BT (s): 7.16 ± 0.23 RSA ST (s): 7.86 ± 0.29 RSA M (s): 7.52 ± 0.2 %DEC RSA(%): 5.1 ± 1.8 RCOD BT (s): 6.58 ± 0.21 RCOD ST (s): 6.77 ± 0.20 RCOD MT (s): 6.86 ± 0.25 %DEC RCOD(%): 2.0 ± 0.7 UNIR (cm): 169.1 ± 16.8 UNIL (cm): 170.4 ± 16.6 LSIuni (%): 94.3 ± 3.6 DJR (cm): 402.2 ± 35.2 DJL (cm): 410.8 ± 24.5 LSIdj (%): 94.5 ± 4.4 LSIuni (%): 94.9 ± 4.4 DJR (cm): 394.5 ± 24.4 DJL (cm): 412.6 ± 17.8 LSIdj (%): 95.2 ± 3.4 | RSA BT (s): 7.10 ± 0.18 RSA ST (s): 7.67 ± 0.29 † RSA M (s): 7.40 ± 0.2 **† %DEC RSA(%): 4.3 ± 1.7 RCOD BT (s): 6.41 ± 0.20 **†† RCOD ST (s): 6.61 ± 0.21 *†† RCOD MT (s): 6.72 ± 0.23 *†† %DEC RCOD(%): 2.6 ± 1.5 UNIR (cm): 180.9 ± 14.4 *† UNIL (cm): 182.7 ± 12.8 **† LSIuni (%): 95.9 ± 2.3 DJR (cm): 411.1 ± 30.8 DJL (cm): 419 ± 28.9 LSIdj (%): 96.6 ± 2.3 LSIuni (%): 95.5 ± 4.3 DJR (cm): 393.4 ± 24.2 DJL (cm): 410.4 ± 14.3 LSIdj (%): 95.5 ± 4.6 | * Very likely changes pre and post ** almost certainly changes pre to post † likely changes between RPA and CG †† very likely changes between RPA and CG |
| Gonzalo-Skok et al. 2019_UH [68] | 20, M | U-14 elite | 6 weeks. Plyometric training program unilateral horizontal | NPV NPH | S5m (s): 1.13 ± 0.07 S10m (s): 1.92 ± 0.08 S25m (s): 4.02 ± 0.20 CMJ (cm): 31.6 ± 4.2 CMJ L (cm): 12.9 ± 3.1 CMJ R (cm): 12.5 ± 3.0 HJ L (cm): 147.0 ± 22.5 HJ R (cm): 146.9 ± 19.0 V-cut (s): 7.25 ± 0.22 COD 180 (s): 2.72 ± 0.05 DORS L (cm): 10.5 ± 2.4 DORS R (cm): 10.0 ± 2.9 SEBT AL (cm): 55.9 ± 6.4 SEBT AR (cm): 53.7 ± 5.7 SEBT PLL (cm): 72.8 ± 8.4 SEBT PLR (cm): 72.3 ± 11.9 | S5m (s): 1.07 ± 0.05 ** S10m (s): 1.86 ± 0.06 **† S25m (s): 3.95 ± 0.19 CMJ (cm): 33.0 ± 2.8 CMJ L (cm): 14.9 ± 1.9 * CMJ R (cm): 14.1 ± 2.9 * HJ L (cm): 159.0 ± 21.1 * HJ R (cm): 153.2 ± 16.6 V-cut (s): 7.01 ± 0.19 ** COD 180 (s): 2.72 ± 0.07 DORS L (cm): 10.4 ± 4.2 DORS R (cm): 10.6 ± 3.9 SEBT AL (cm): 56.2 ± 6.8 * SEBT AR (cm): 54.5 ± 7.3 SEBT PLL (cm): 74.9 ± 7.4 SEBT PLR (cm): 78.2 ± 11.6 | * Very likely changes pre and post ** almost certainly changes pre to post † likely changes between BV and UH, more in UH |
| Gonzalo-Skok et al. 2019_BV [68] | 20, M | U-14 elite | 6 weeks. Plyometric training program bilateral vertical | NPV NPH | S5m (s): 1.14 ± 0.08 S10m (s): 1.91 ± 0.10 S25m (s): 3.99 ± 0.22 CMJ (cm): 32.5 ± 5.1 CMJ L (cm): 12.4 ± 3.6 CMJ R (cm): 12.3 ± 2.4 HJ L (cm): 141.0 ± 24.9 HJ R (cm): 143.2 ± 21.7 V-cut (s): 7.37 ± 0.41 COD 180 (s): 2.79 ± 0.17 DORS L (cm): 9.1 ± 2.7 DORS R (cm): 10.1 ± 2.4 SEBT AL (cm): 53.4 ± 6.3 SEBT AR (cm): 54.3 ± 5.2 SEBT PLL (cm): 69.3 ± 7.6 SEBT PLR (cm): 68.0 ± 7.8 | S5m (s): 1.11 ± 0.06 S10m (s): 1.90 ± 0.10 S25m (s): 3.96 ± 0.21 CMJ (cm): 33.4 ± 4.3 CMJ L (cm): 14.1 ± 3.4 CMJ R (cm): 14.6 ± 3.1 ** HJ L (cm): 152.8 ± 16.5 HJ R (cm): 155.6 ± 17.9 * V-cut (s): 7.21 ± 0.40 COD 180 (s): 2.77 ± 0.16 DORS L (cm): 9.6 ± 2.7 DORS R (cm): 10.0 ± 1.7 SEBT AL (cm): 56.1 ± 6.9 SEBT AR (cm): 55.6 ± 6.8 SEBT PLL (cm): 71.8 ± 7.3 SEBT PLR (cm): 72.9 ± 9.7 | * Very likely changes pre and post ** almost certainly changes pre to post |
| Gottlieb et al. 2014_PT [70] | 9,M | U-16 elite | 6 weeks Plyometric training program | NPV NPH | CMJ (cm): 41.32 ± 3.87 S20m (s): 3.03 ± 0.12 | CMJ (cm): 42.51 ± 2.72 S20m (s): 3.01 ± 0.13 | |
| Gottlieb et al. 2014_ST [70] | 10,M | U-16 elite | 6 weeks Repeated sprint training program | NPV NPH | CMJ (cm): 40.60 ± 4.80 S20m (s): 3.07 ± 0.11 | CMJ (cm): 42.36 ± 5.75 S20m (s): 2.99 ± 0.07 * | * significant pre and post |
| Matavulj et al. 2001 [72] | 33, M | U-16 elite | 6 weeks. Plyometric training program drop jumps | NPV | CMJ (cm): 40,4 ± 6.3 | CMJ (cm): 46± 6 *† | * significant pre and post † more than control |
| McCormick et al. 2016_SP [73] | 14, F | U-16 amateur | 6 weeks. Plyometric training program sagittal plane | NPV | CMJ (cm): 47.72 ± 7.07 SLJ (cm): 177.89 ± 30.07 LHr (cm): 135.89 ± 22.36 LHl (cm): 140.06 ± 25.81 LSHr: 23.86 ± 3.13 LSHl: 24.00 ± 3.06 | CMJ (cm): 52.61 ± 9.36 *† SLJ (cm): 191.95 ± 29.06 * LHr (cm): 143.87 ± 25.34 * LHl (cm): 142.60 ± 32.33 * LSHr: 24.57 ± 2.99 * LSHl: 24.14 ± 2.55 * | * significant pre and post † more than FPP |
| McCormick et al. 2016_FP [73] | 14, F | U-16 amateur | 6 weeks. Plyometric training program frontal plane | NPV | CMJ (cm): 48.26 ± 5.39 SLJ (cm): 176.89 ± 18.47 LHr (cm): 141.06 ± 7.47 LHl (cm): 137.16 ± 12.97 LSHr: 23.00 ± 2.31 LSHl: 22.71 ± 2.22 | CMJ (cm): 50.07 ± 5.33 * SLJ (cm): 187.05 ± 14.19 * LHr (cm): 154.94 ± 13.03 * LHl (cm): 153.49 ± 6.02 *Ψ LSHr: 24.57 ± 1.90 * LSHl: 24.71 ± 2.36 *Ψ | * significant pre and post Ψ more than SPP |
| Meszler & Váczi (2019) [74] | 16, F | U-18 amateur | 7 weeks. Plyometric training program | NPV NPH | IAT (s): 16.21 ± 0.81 t-Test (s): 10.96 ± 0.48 CMJ (cm): 33.52 ± 3.89 B: 74.82 ± 2.22 MVC60ext (Nm): 165.64 ± 22.53 MVC60flex (Nm): 94.54 ± 14.05 MVC180ext (Nm): 120.25 ± 25.89 MVC180flex (Nm): 94.82 ± 24.99 H:Q60 ratio (%): 60.42 ± 9.99 H:Q180 ratio (%): 78.52 ± 10.32 | IAT (s): 16.95 ± 1.07 * t-Test (s): 11.13 ± 0.63 CMJ (cm): 31.96 ± 3.48 * B: 75.62 ± 4.31 MVC60ext (Nm): 175.16 ± 21.61 MVC60flex (Nm): 99.11 ± 17.96 MVC180ext (Nm): 130.01 ± 19.06 MVC180flex (Nm): 113.01 ± 26.80 * H:Q60 ratio (%): 58.79 ± 7.72 H:Q180 ratio (%): 86.38 ± 10.51 | * significant pre and post |
| Hernández et al. 2018_R [71] | 19, M | U-12 amateur | 7 weeks. Plyometric training program randomized | NPV NPH | CMJ (cm): 28.4 ± 8.3 DJ (cm): 20.6 ± 5.1 S30m (s): 5.71 ± 0.46 S30m ball (s): 7.18 ± 1.1 t-Test (s): 12.1 ± 1.1 | CMJ (cm): 33.5 ± 8.1 *† DJ (cm): 25.4 ± 5.9 *† S30m (s): 5.06 ± 0.52 *† S30m ball (s): 6.52 ± 1.0 *† t-Test (s): 10.3 ± 0.7 *† | * significant pre and post † more RG group than the others |
| Hernández et al. 2018_NR [71] | 19, M | U-12 amateur | 7 weeks. Plyometric training program non randomized | NPV NPH | CMJ (cm): 24.1 ± 5.9 DJ (cm): 19.6 ± 6.5 S30m (s): 5.87 ± 0.51 S30m ball (s): 7.57 ± 1.7 t-Test (s): 12.3 ± 1.1 | CMJ (cm): 26.9 ± 5.8 * DJ (cm): 22.0 ± 6.0 * S30m (s): 5.48 ± 0.56 * S30m ball (s): 6.92 ± 1.6 * t-Test (s): 11.0 ± 1.1 * | * significant pre and post |
| Santos & Janeira (2008) [75] | 25, M | U-16 amateur | 10 weeks. Plyometric training program | NPV | SJ (cm): 24.79 ± 4.2 CMJ (cm): 29.88 ± 5.9 ABA (cm): 34.77 ± 6.3 DJ (cm): 34.71 ± 7.4 MP (W·Kg): 23.69 ± 4.0 MBT (m): 3.47 ± 0.6 | SJ (cm): 28.01±4.6 *† CMJ (cm): 33.02±6.2 *† ABA (cm): 38.43±7.1 * DJ (cm): 36.64 ± 8.1 † MP (W·Kg): 24.48 ± 3.9 MBT (m): 4.15 ± 0.5 *† | * significant pre and post † significant different post training EG group than the CG |
| Santos & Janeira (2012) [76] | 25, M | U-16 amateur | 10 weeks. Plyometric training program | NPV | SJ (cm): 24.81 ± 3.3 CMJ (cm): 33.30 ± 4.3 ABA (cm): 38.73 ± 4.9 DJ (cm): 34.80 ± 4.1 MBT (m): 3.42 ± 0.38 | SJ (cm): 27.92±4.0 *† CMJ (cm): 36.68±4.2 *† ABA (cm): 42.62±4.4 *† DJ (cm): 38.10 ± 4.3 *† MBT (m): 3.68 ± 0.42 * | * significant pre and post † significant different post training EG group than the CG |
| Ciacci & Bartolomei (2017)_U-16HS [52] | 36, M | U-16 elite | 16 weeks. Mixed strength and conditioning program half squat | NPV | U-16 SJ (cm): 34.19 ± 3.32 U-16 CMJ (cm): 35.56 ± 3.41 U-16 CMJarm (cm): 43.33 ± 5.47 U-16 TCMJstep (cm): 40.83 ± 4.98 U-16 Power Balance (%): 84.91 ± 9.62 | U-16 SJ (cm): 36.66 ± 3.34 *† U-16 CMJ (cm): 37.43 ± 4.94 U-16 CMJarm (cm): 43.02 ± 4.46 U-16 TCMJstep (cm): 43.94 ± 4.54 *† U-16 Power Balance (%): 82.92 ± 7.01 | * significant pre and post † significant different post training HSQ group than the HCL |
| Ciacci & Bartolomei (2017)_U-16HC [52] | 36, M | U-16 elite | 16 weeks. Mixed strength and conditioning program hang clean | NPV | U-16 SJ (cm): 37.32 ± 3.99 U-16 CMJ (cm): 39.01 ± 4.72 U-16 CMJarm (cm): 43.37 ± 5.82 U-16 TCMJstep (cm): 48.86 ± 4.24 U-16 Power Balance (%): 91.31 ± 8.37 | U-16 SJ (cm): 37.16 ± 4.32 U-16 CMJ (cm): 39.98 ± 5.94 U-16 CMJarm (cm): 43.79 ± 6.82 U-16 TCMJstep (cm): 48.81 ± 6.75 U-16 Power Balance (%): 80.42 ± 14.63 | post training HSQ group than the HCL |
| Ciacci & Bartolomei (2017)_U-18HS [52] | 36, M | U-18 elite | 16 weeks. Mixed strength and conditioning program half squat | NPV | U-18 SJ (cm): 38.44 ± 5.98 U-18 CMJ (cm): 40.11 ± 6.91 U-18 CMJarm (cm): 43.13 ± 7.14 U-18 TCMJstep (cm): 47.45 ± 7.86 U-18 Power Balance (%): 86.46 ± 7.98 | U-18 SJ (cm): 40.79 ± 4.97 * U-18 CMJ (cm): 40.23 ± 4.86 U-18 CMJarm (cm): 46.71 ± 5.68 U-18 TCMJstep (cm): 48.90 ± 5.5 * U-18 Power Balance (%): 78.47 ± 9.05 | * significant pre and post |
| Ciacci & Bartolomei (2017)_U-18HC [52] | 36, M | U-18 elite | 16 weeks. Mixed strength and conditioning program hang clean | NPV | U-18 SJ (cm): 38.78 ± 5.87 U-18 CMJ (cm): 39.46 ± 5.78 U-18 CMJarm (cm): 45.72 ± 6.58 U-18 TCMJstep (cm): 47.84 ± 7.71 U-18 Power Balance (%): 76.68 ± 7.62 | U-18 SJ (cm): 40.71 ± 5.17 * U-18 CMJ (cm): 40.80 ± 5.71 * U-18 CMJarm (cm): 47.33 ± 6.16 * U-18 TCMJstep (cm): 50.02 ± 6.96 * U-18 Power Balance (%): 72.62 ± 10.30 | * significant pre and post |
| Tsimachidis et al. 2010 [77] | 26, M | U-18 amateur | 10 weeks. Plyometric training program | NPV NPH | S30m (s): 5.29 ± 0.70 CMJ (cm): 32.7 ± 12.3 | S30m (s): 5.02 ± 0.23 *† CMJ (cm): 36.8 ± 9.7 *† | * significant pre and post † significant different post training CTG than the CG |
| Yañez-García et al. 2019_U-14 [78] | 11,M | U-14 elite | 6 weeks Mixed strength and conditioning program | NPV NPH | S10m (s): 1.96 ± 0.12 S20m (s): 3.46 ± 0.19 CMJ (cm): 27.0 ± 6.2 | S10m (s): 1.88 ± 0.09 * S20m (s): 3.34 ± 0.18 * CMJ (cm): 30.2 ± 6.2 * | * significant intra groups |
| Yañez-García et al. 2019_U-16 [78] | 11,M | U-16 elite | 6 weeks Mixed strength and conditioning program | NPV NPH | S10m (s): 1.83 ± 0.06 S20m (s): 3.18 ± 0.11 CMJ (cm): 32.5 ± 3.7 | S10m (s): 1.82 ± 0.06 * S20m (s): 3.14 ± 0.10 * CMJ (cm): 35.9 ± 3.4 * | * significant intra groups |
| Yañez-García et al. 2019_U-18 [78] | 11,M | U-18 elite | 6 weeks Mixed strength and conditioning program | NPV NPH | S10m (s): 1.78 ± 0.07 S20m (s): 3.11 ± 0.11 CMJ (cm): 33.9 ± 6.1 | S10m (s): 1.78 ± 0.05 * S20m (s): 3.09 ± 0.11 * CMJ (cm): 36.2 ± 6.1 | * significant intra groups |
| Competitive level of participants | Amateur | 9 [49,61,66,71,73,74,75,76,77] |
| Elite | 13 [50,51,52,62,63,64,65,67,68,70,72,78,79] | |
| Age | U-12 | 1 [71] |
| U-14 | 3 [50,67,78] | |
| U-16 | 13 [49,52,61,63,64,65,70,72,73,75,76,78,79] | |
| U-18 | 7 [51,52,62,66,74,77,78] | |
| Gender | Male | 16 [49,50,51,52,61,62,64,67,68,70,71,72,75,76,77,78] |
| Female | 6 [63,65,66,73,74,79] | |
| Interventions | Mixed Strength and conditioning program | 7 [49,50,51,52,76,78,80] |
| Plyometric training program | 12 [61,62,63,66,67,68,70,71,73,74,75,77] | |
| HIIT B program | 1 [79] | |
| Repeated sprint training | 3 [64,65,70] | |
| Outcomes | Neuromuscular power vertical (NPV) | 30 [49,51,52,62,63,66,68,70,71,72,73,74,75,76,78] |
| Neuromuscular power horizontal (NPH) | 24 [49,50,51,61,62,66,67,68,70,71,74,77,78] | |
| Endurance (E) | 3 [64,65,79] |
| NPV | N | R Squared | Adj R Squared | Sum of Squares | F | Sig | |
|---|---|---|---|---|---|---|---|
| Training type | |||||||
| Plyometric training | 16 | 0.40 | 0.36 | 235.82 | 10.04 | 0.006 * | |
| Mixed strength and conditioning | 9 | 0.73 | 0.69 | 8.31 | 21.23 | 0.002 * | |
| Gender | |||||||
| Male | 24 | 0.37 | 0.34 | 208.41 | 13.28 | 0.001 * | |
| Female | 5 | 0.97 | 0.96 | 171.94 | 84.95 | 0.003 * | |
| Competitive level | |||||||
| Elite | 19 | 0.60 | 0.57 | 226.03 | 26.59 | 0.001 * | |
| Amateur | 9 | 0.63 | 0.58 | 205.12 | 13.66 | 0.006 * | |
| Age | |||||||
| U-16 | 13 | 0.8 | 0.78 | 144.06 | 47.87 | 0.001 * | |
| U-18 | 8 | 0.59 | 0.51 | 159.77 | 9.21 | 0.019 * | |
| NPH | N | R Squared | Adj R Squared | Sum of Squares | F | Sig | |
|---|---|---|---|---|---|---|---|
| Training type | |||||||
| Plyometric training | 10 | 0.86 | 0.84 | 588.97 | 53,44 | 0.001 * | |
| Mixed strength and conditioning | 6 | 0.85 | 0.82 | 9.63 | 29.01 | 0.003 * | |
| Endurance | 5 | 0.96 | 0.95 | 65.37 | 98.26 | 0.001 * | |
| Gender | |||||||
| Male | 19 | 0.83 | 0.83 | 663.03 | 92.40 | 0.001 * | |
| Female | 3 | 0.88 | 0.82 | 35.43 | 14.83 | 0.061 | |
| Competitive level | |||||||
| Elite | 16 | 0.84 | 0.82 | 479.59 | 76.65 | 0.001 * | |
| Amateur | 6 | 0.85 | 0.82 | 164.45 | 29.02 | 0.003 * | |
| Age | |||||||
| U-16 | 8 | 0.96 | 0.96 | 68.03 | 178.36 | 0.001 * | |
| U-18 | 7 | 0.96 | 0.95 | 221.66 | 141.60 | 0.001 * | |
Publisher’s Note: MDPI stays neutral with regard to jurisdictional claims in published maps and institutional affiliations. |
© 2022 by the authors. Licensee MDPI, Basel, Switzerland. This article is an open access article distributed under the terms and conditions of the Creative Commons Attribution (CC BY) license (https://creativecommons.org/licenses/by/4.0/).
Share and Cite
Sacot, A.; López-Ros, V.; Prats-Puig, A.; Escosa, J.; Barretina, J.; Calleja-González, J. Multidisciplinary Neuromuscular and Endurance Interventions on Youth Basketball Players: A Systematic Review with Meta-Analysis and Meta-Regression. Int. J. Environ. Res. Public Health 2022, 19, 9642. https://doi.org/10.3390/ijerph19159642
Sacot A, López-Ros V, Prats-Puig A, Escosa J, Barretina J, Calleja-González J. Multidisciplinary Neuromuscular and Endurance Interventions on Youth Basketball Players: A Systematic Review with Meta-Analysis and Meta-Regression. International Journal of Environmental Research and Public Health. 2022; 19(15):9642. https://doi.org/10.3390/ijerph19159642
Chicago/Turabian StyleSacot, Arnau, Víctor López-Ros, Anna Prats-Puig, Jesús Escosa, Jordi Barretina, and Julio Calleja-González. 2022. "Multidisciplinary Neuromuscular and Endurance Interventions on Youth Basketball Players: A Systematic Review with Meta-Analysis and Meta-Regression" International Journal of Environmental Research and Public Health 19, no. 15: 9642. https://doi.org/10.3390/ijerph19159642