
Change of Rice Paddy and Its Impact on Human Well-Being from the Perspective of Land Surface Temperature in the Northeastern Sanjiang Plain of China


Abstract
:1. Introduction
2. Method
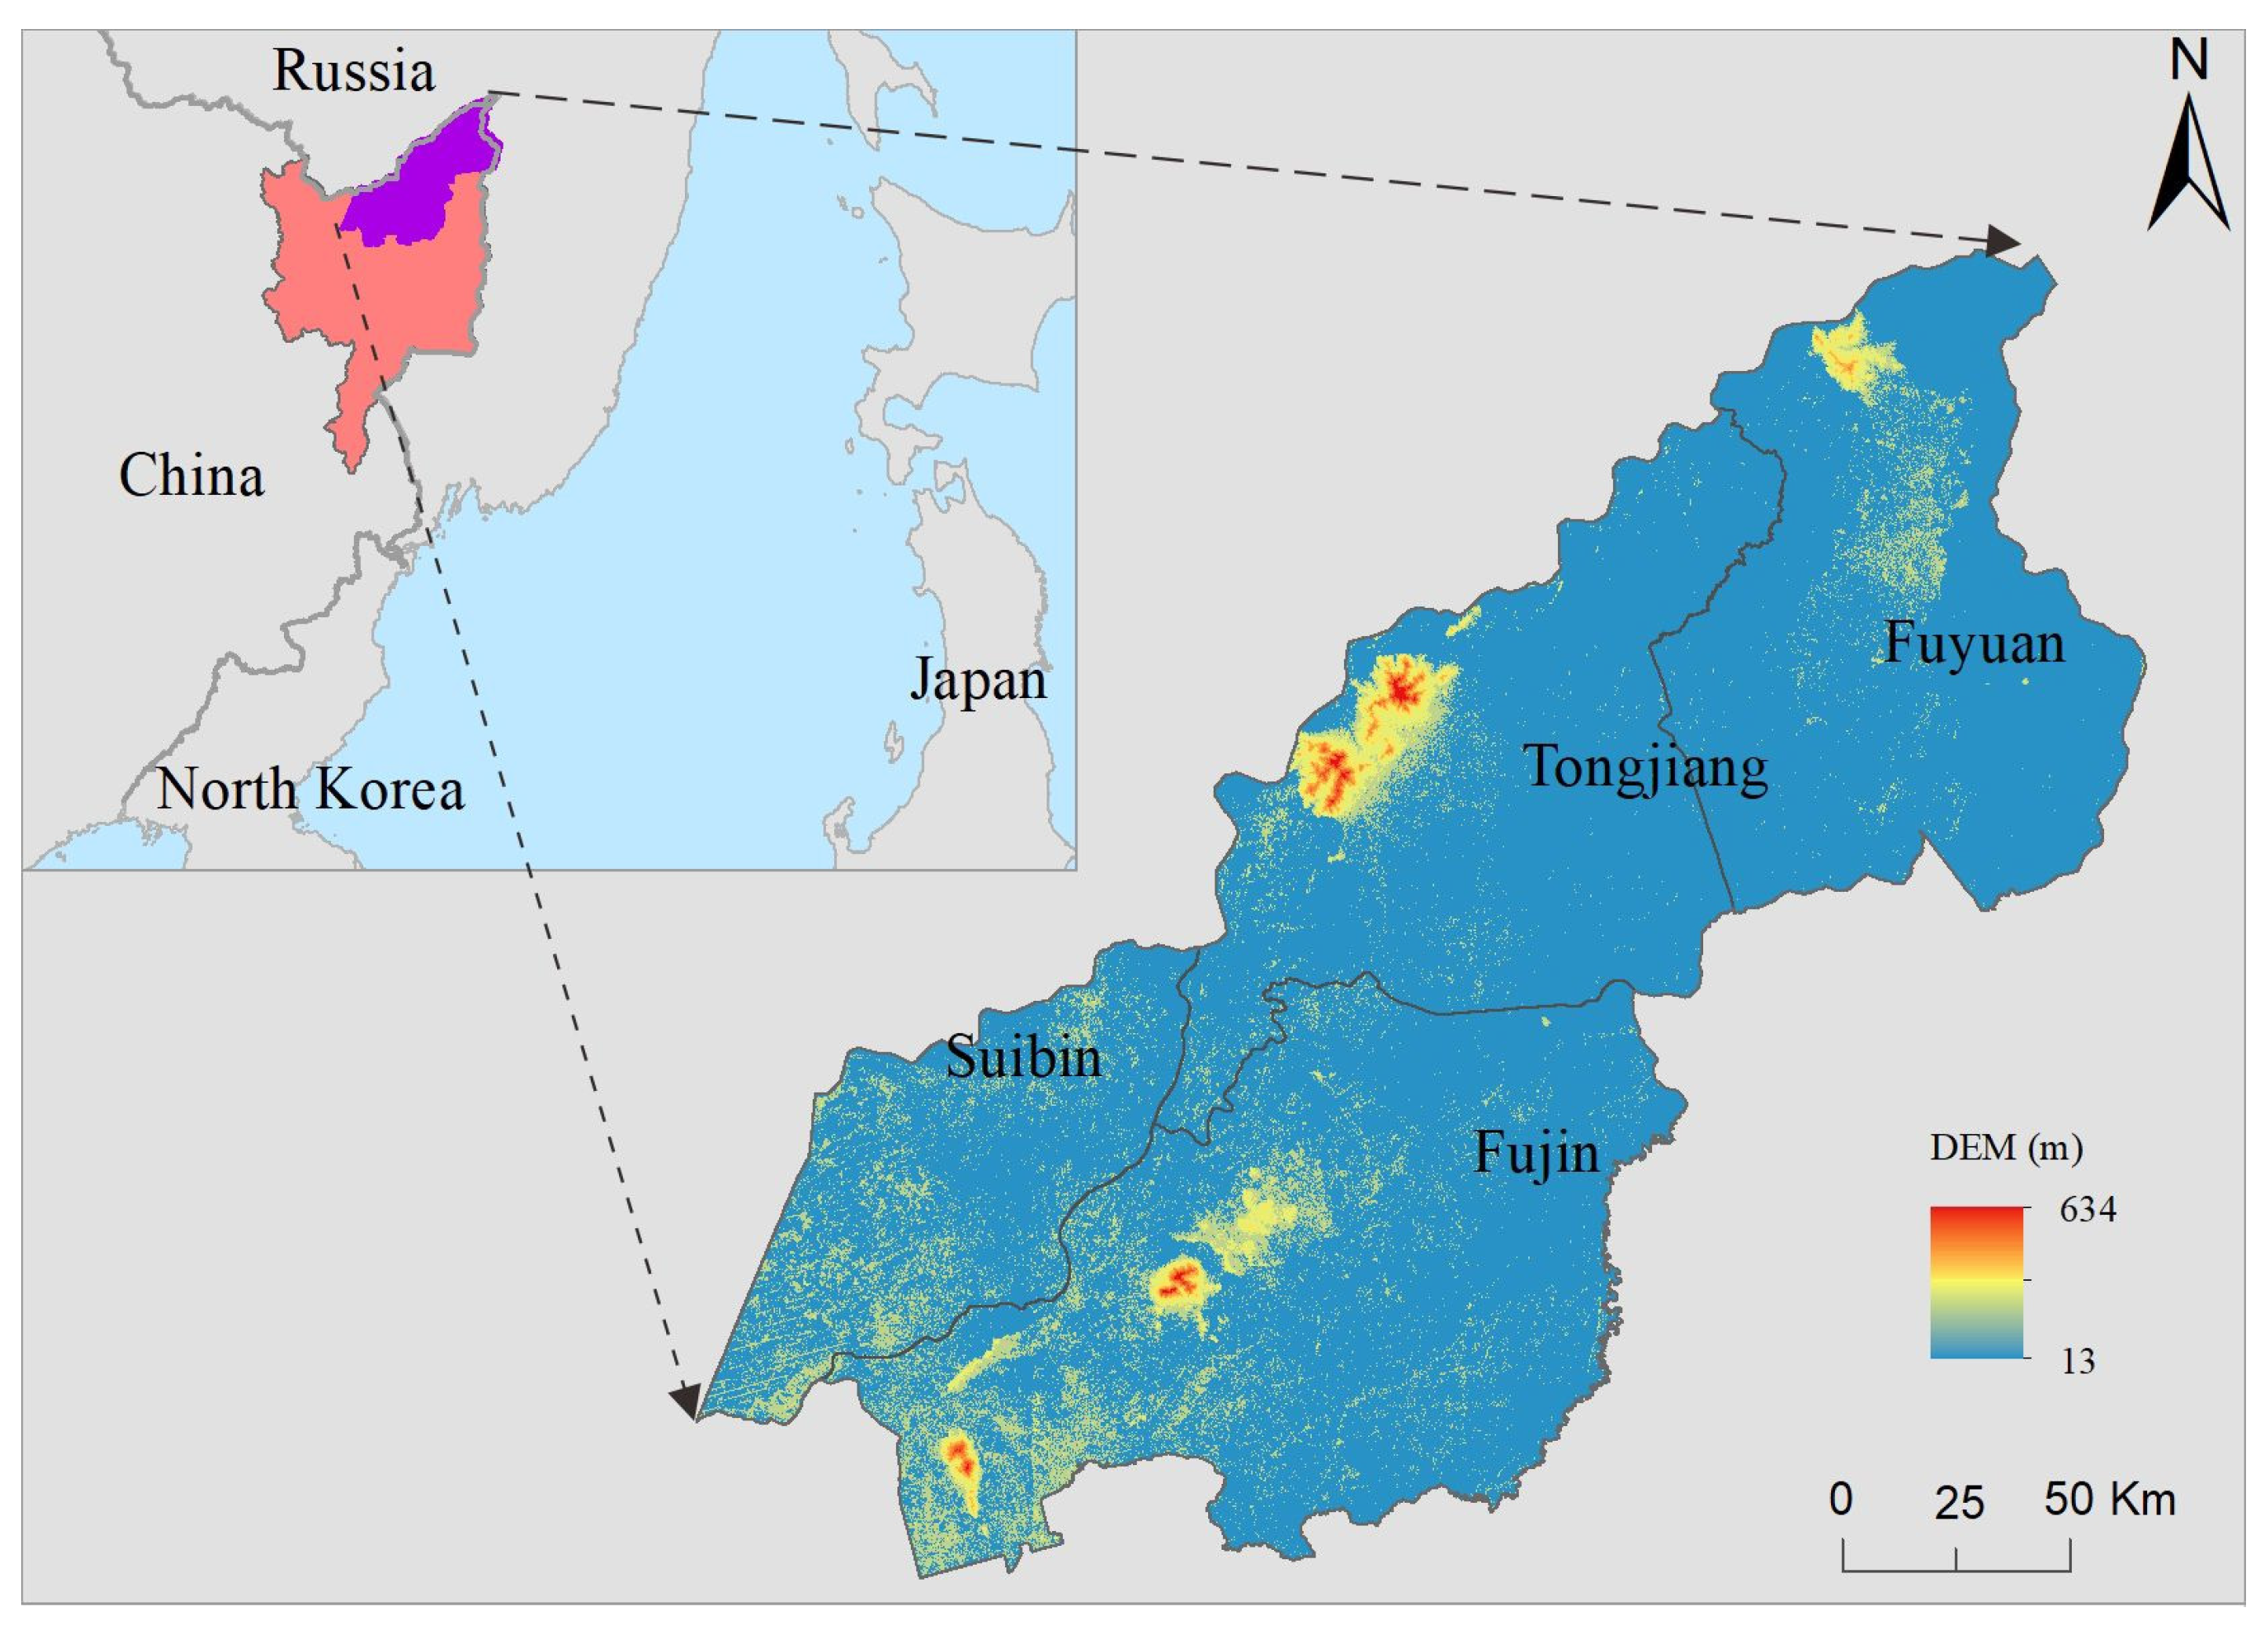
2.1. Study Area
2.2. Method of the Technical Process
2.3. Data Collection
2.4. Processing and Visualization of Land Use Data to Extend to 2000–2020
2.5. Center of Gravity Transfer Model
2.6. Processing of Land Surface Temperature Data
3. Results
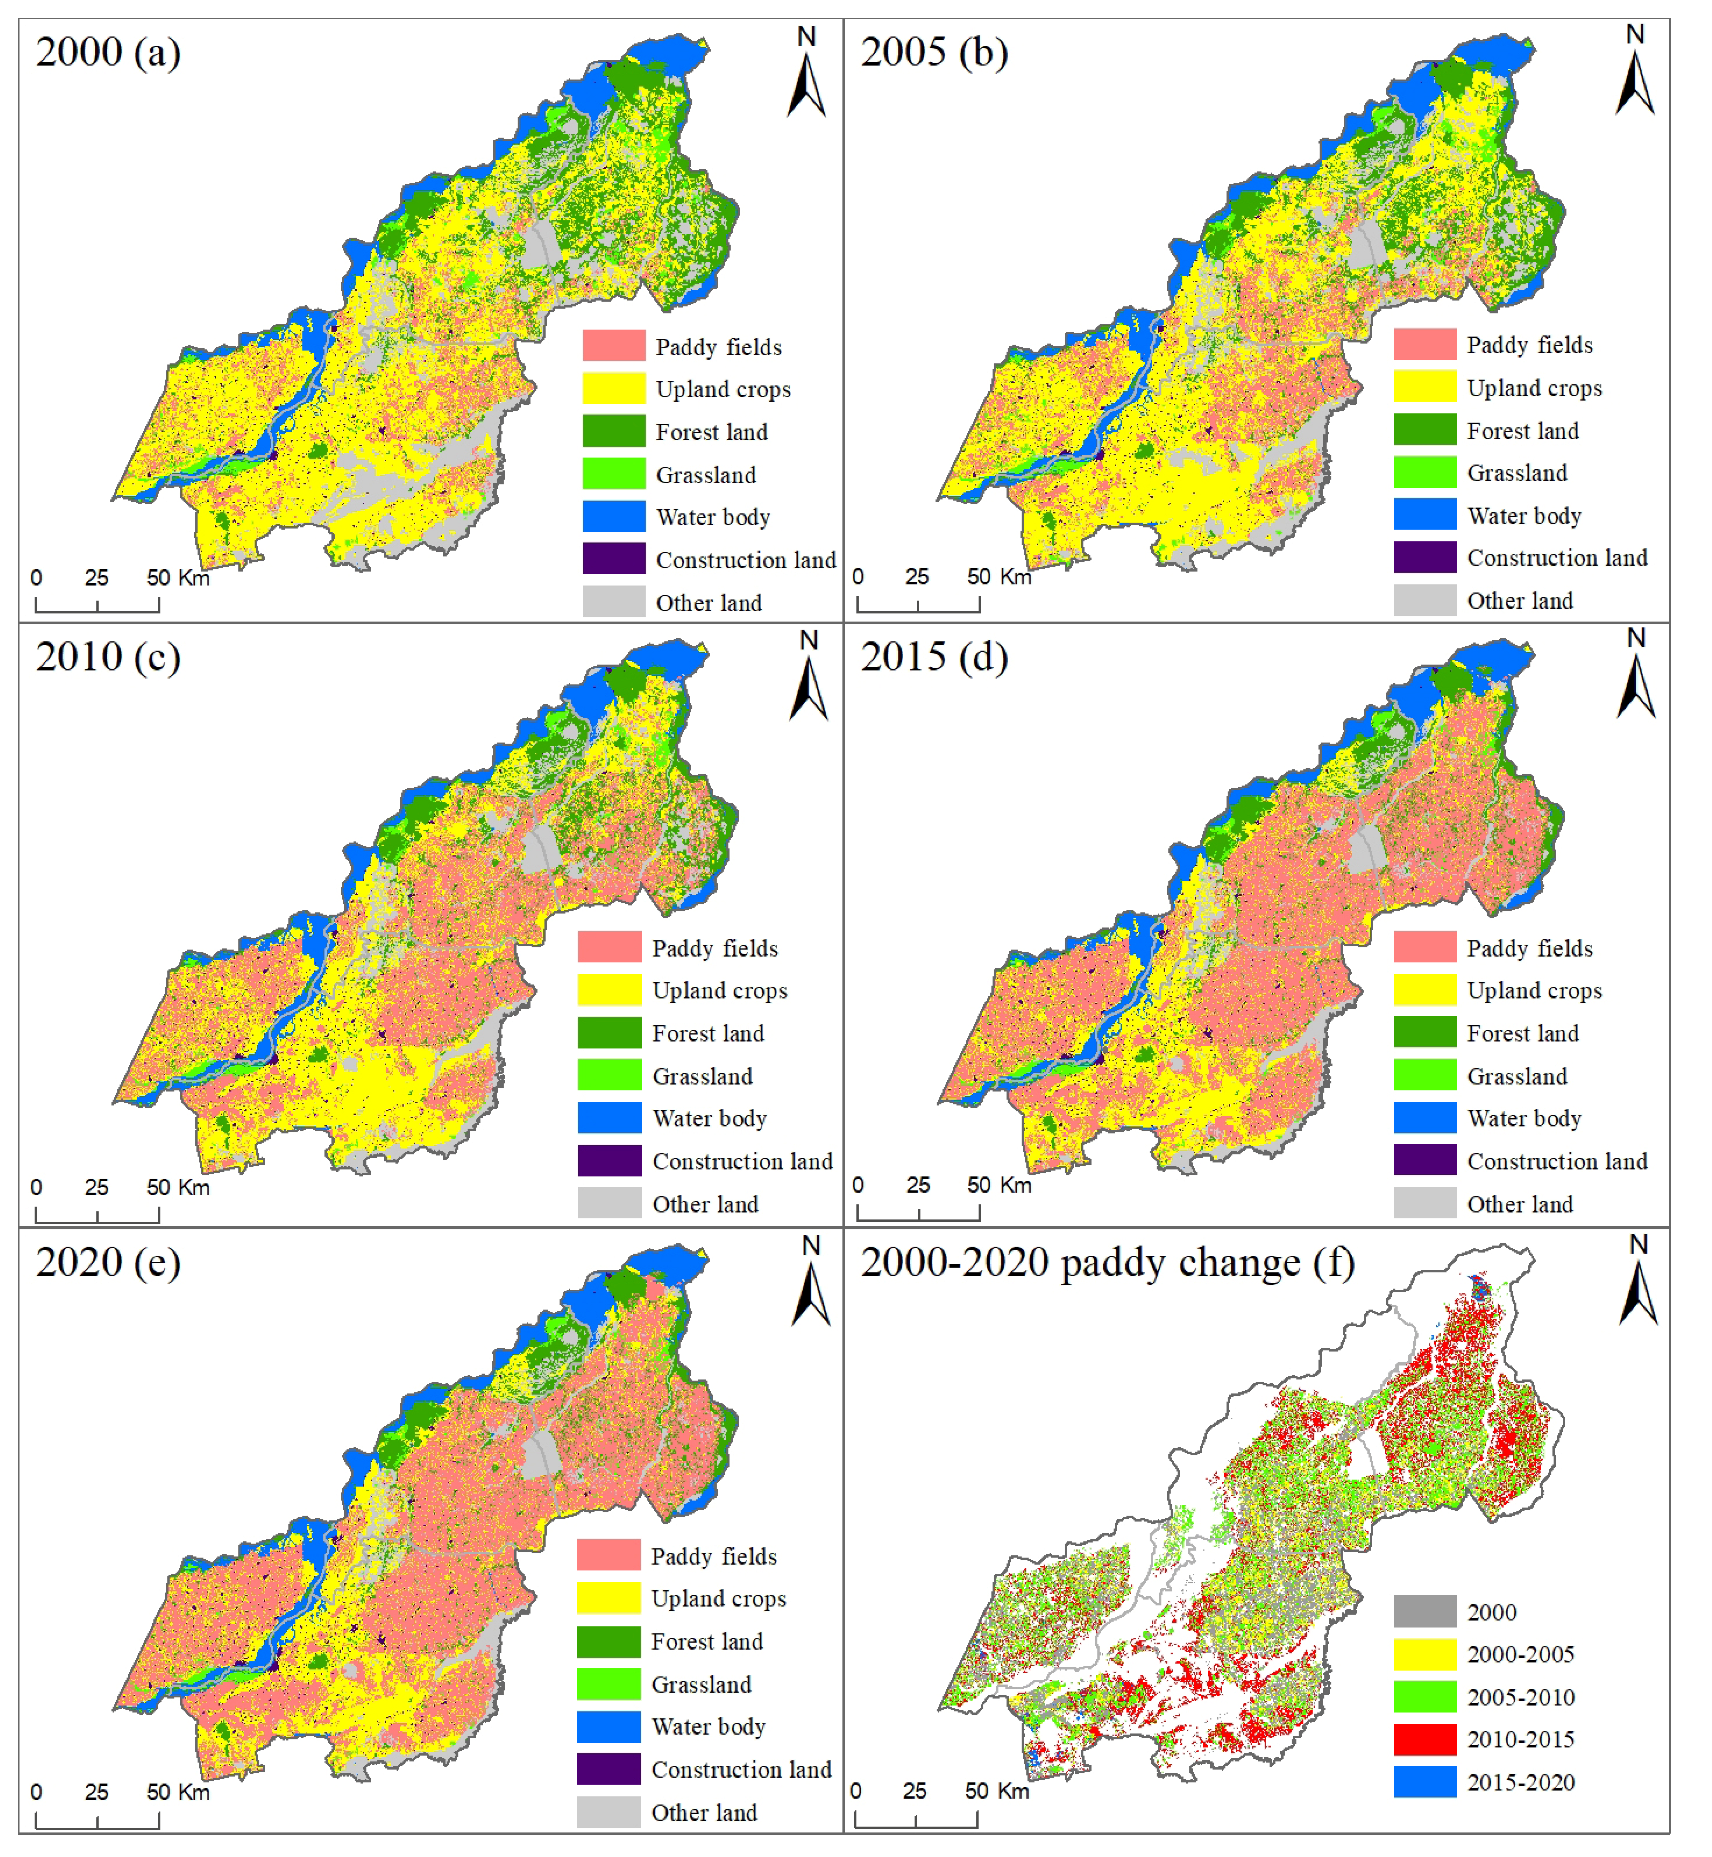
3.1. Change Analysis of Paddy Field Quantity and Its Difference in Different Regions
3.1.1. Analysis of Paddy Field Change and Its Reclamation Rate from 2000 to 2020
3.1.2. Analysis of Regional Differences in the Development of Different Paddy Field Levels from 2000 to 2020 in the Study Area
3.2. Spatial Heterogeneity and Center Migration of Paddy Field Change from 2000 to 2020
3.2.1. Spatial Pattern of Paddy Field Change from 2000 to 2020 in the Study Area
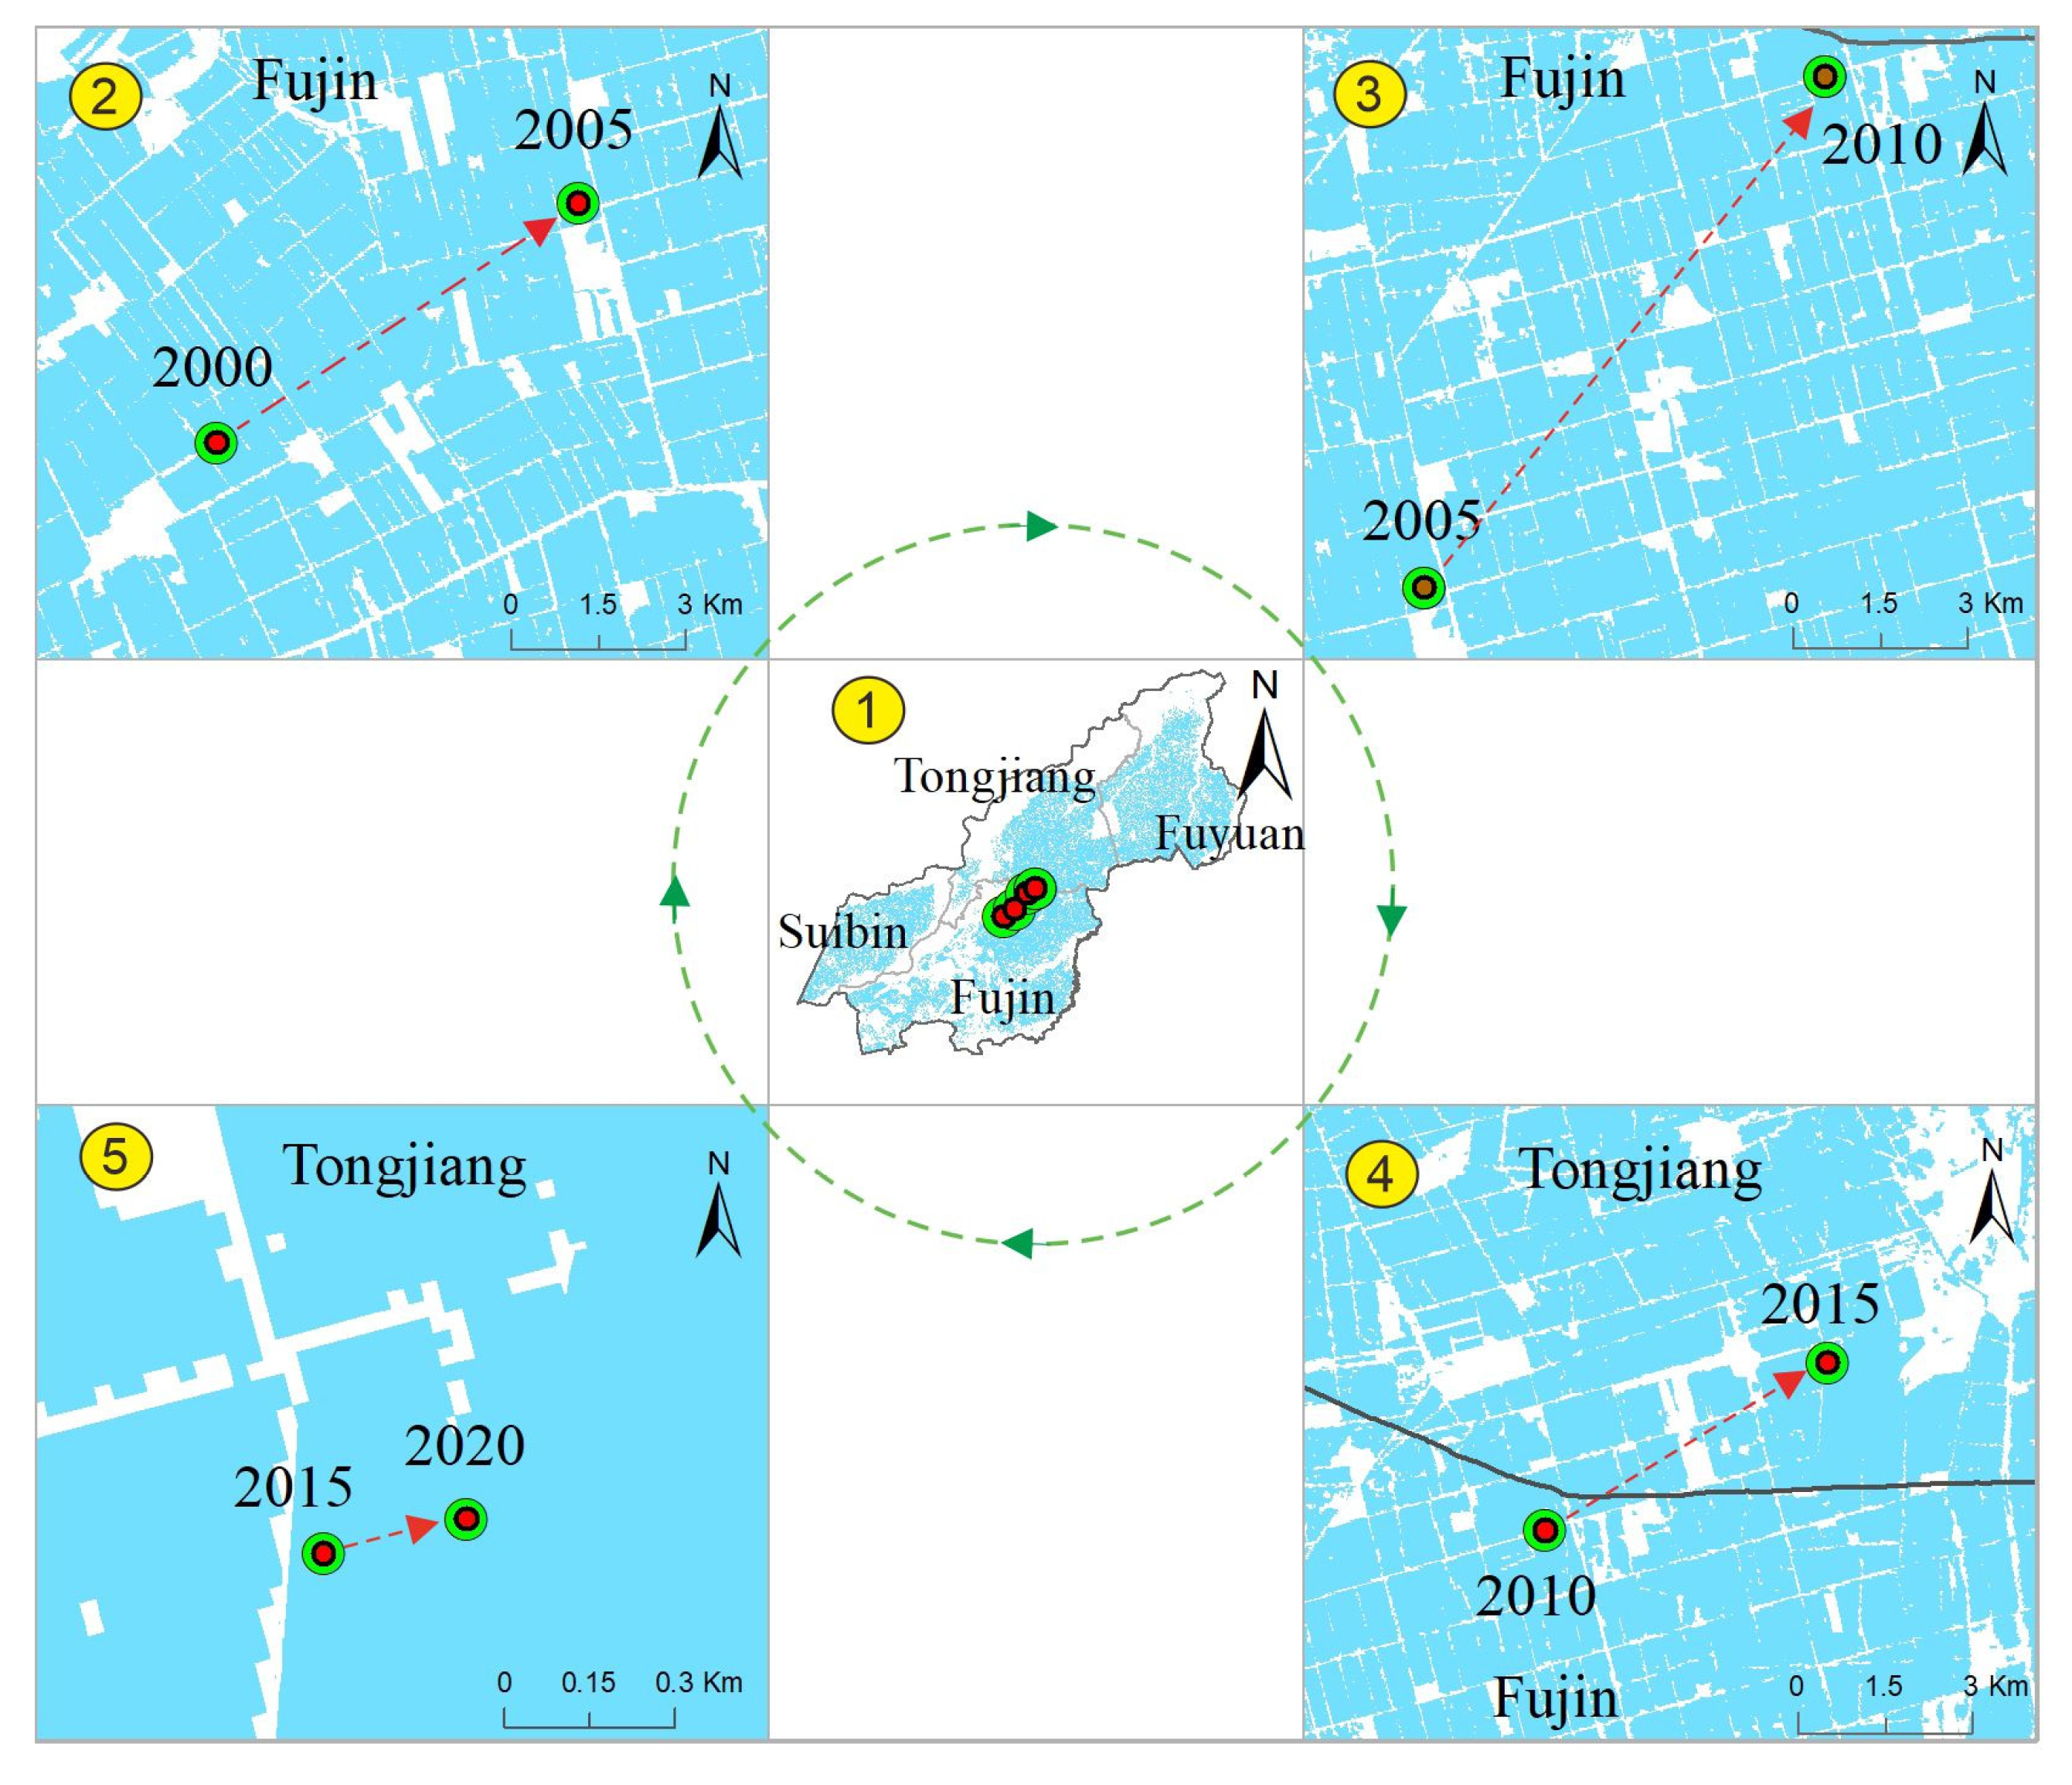
3.2.2. Analysis of the Center Migration Process of Paddy Field Change
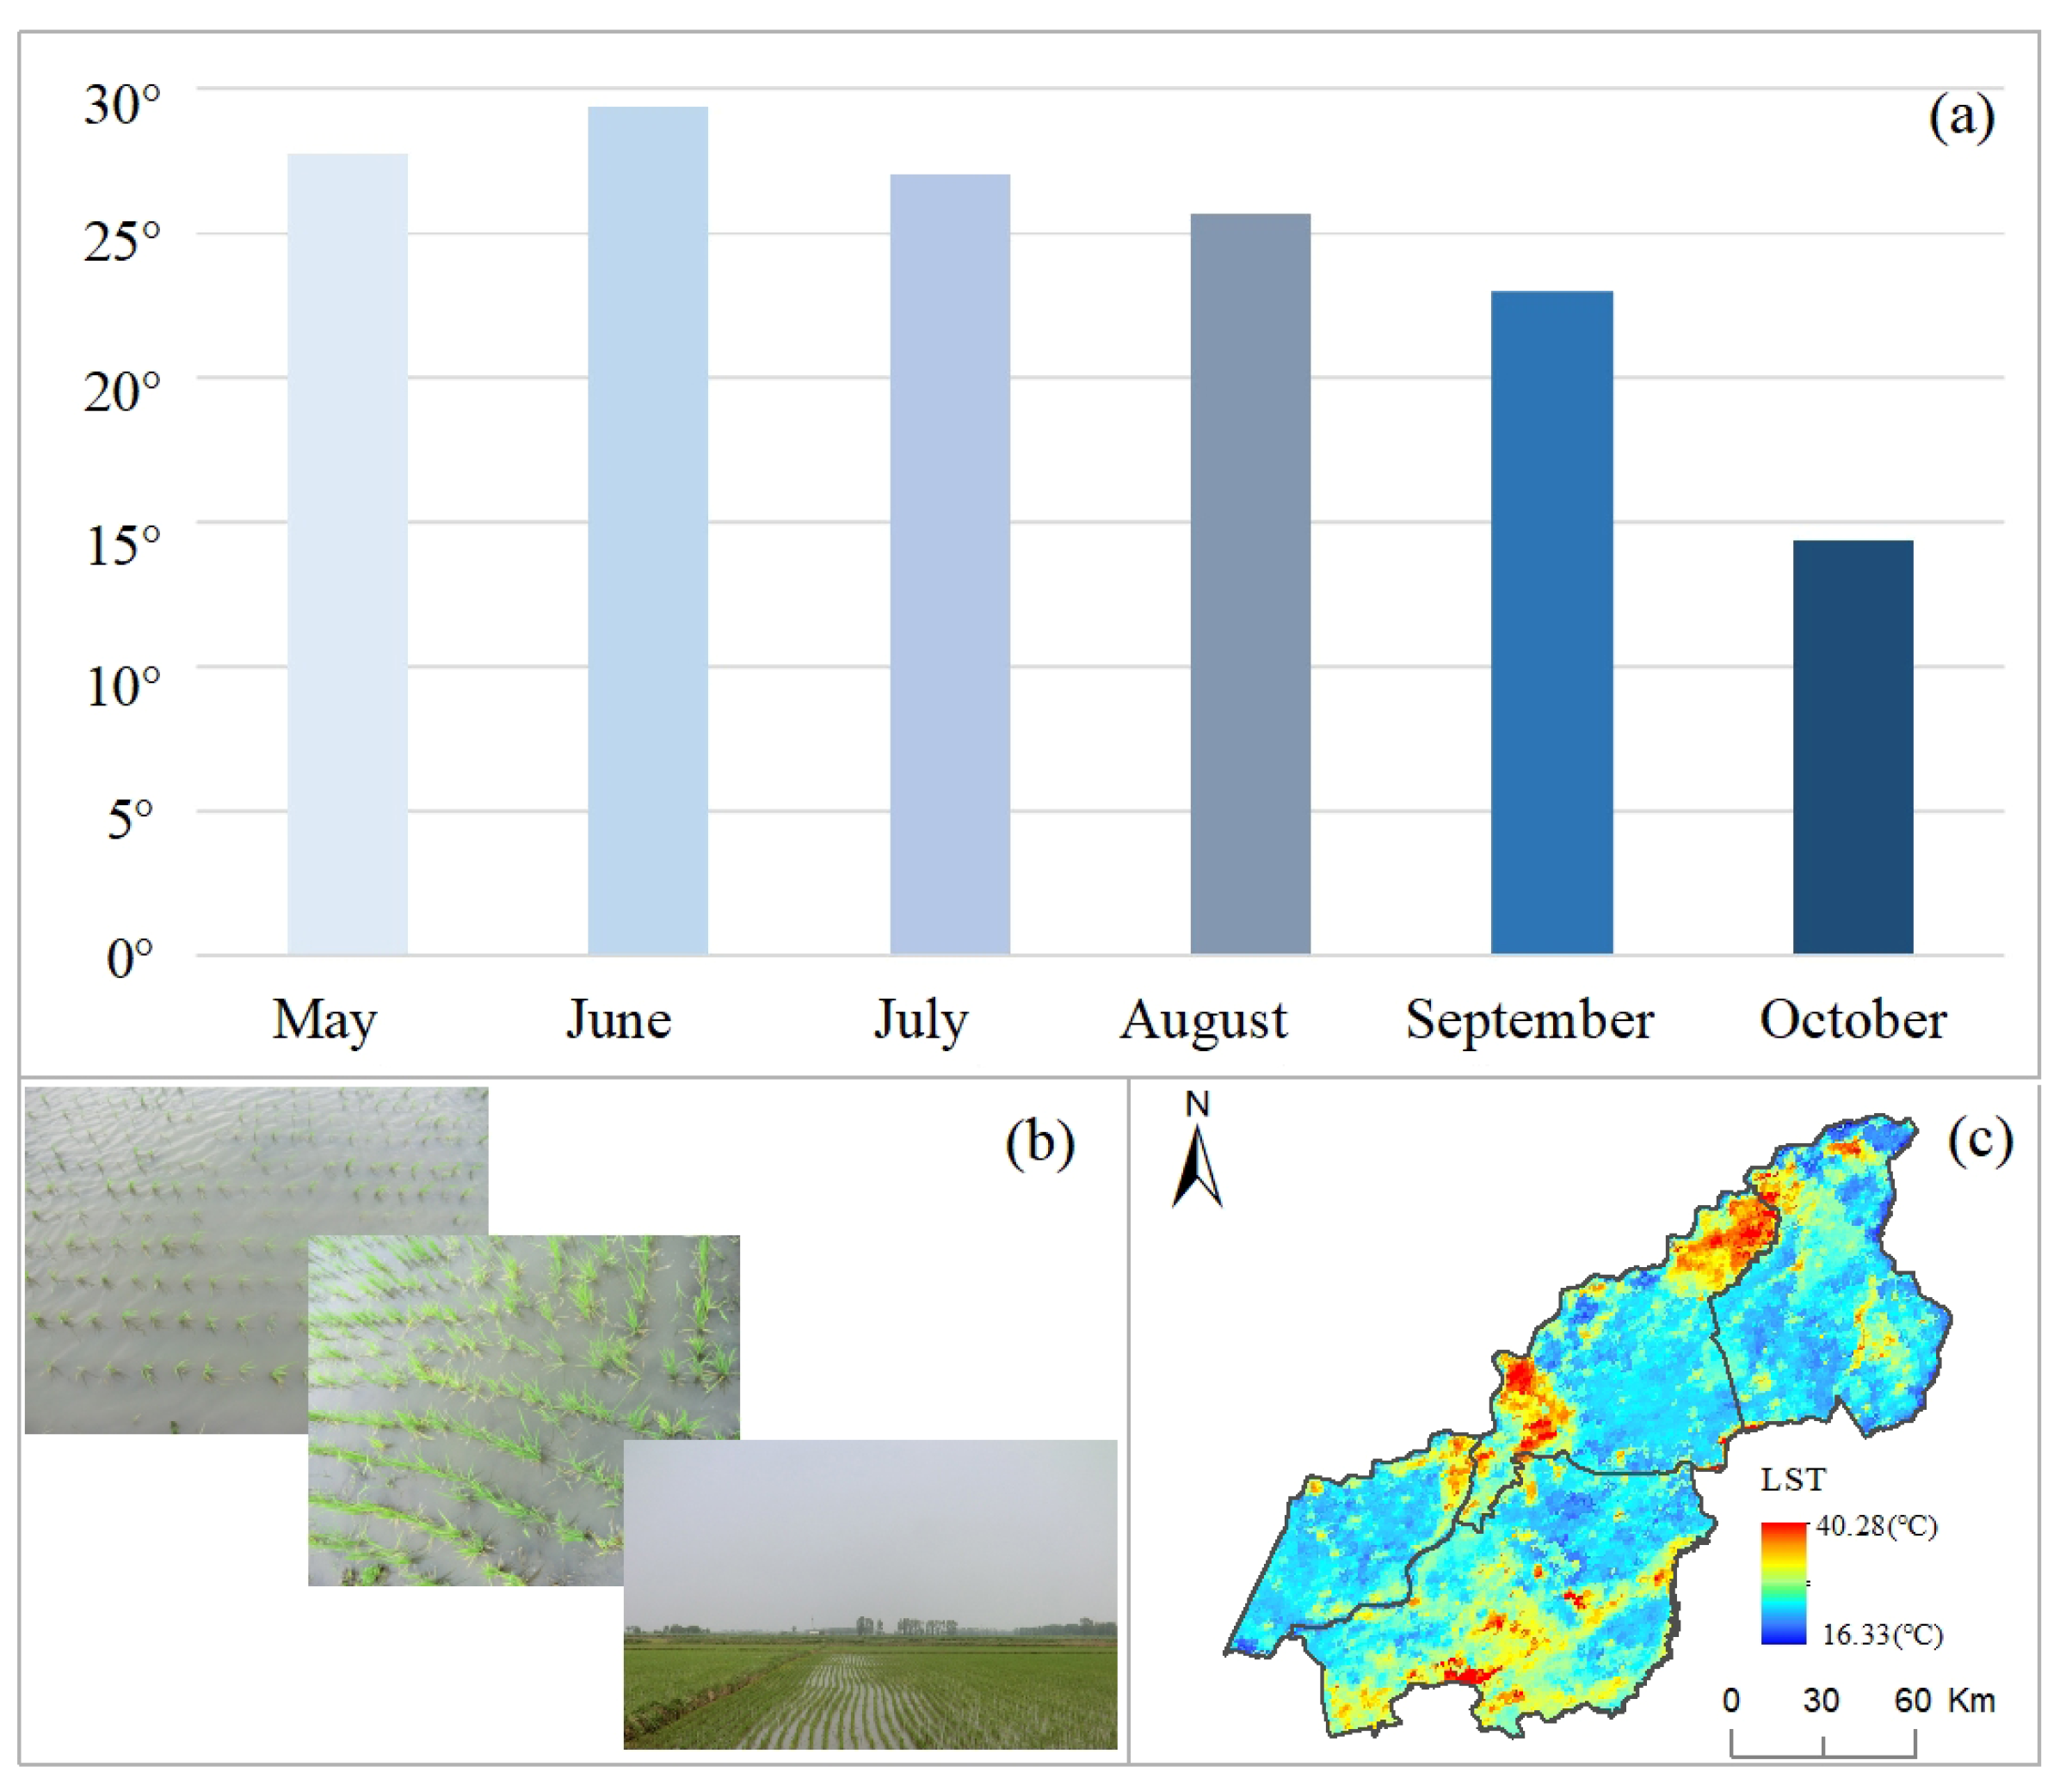
3.3. Analysis of Surface Temperature Change Process of Paddy Field in the Whole Growing Season from 2000 to 2020
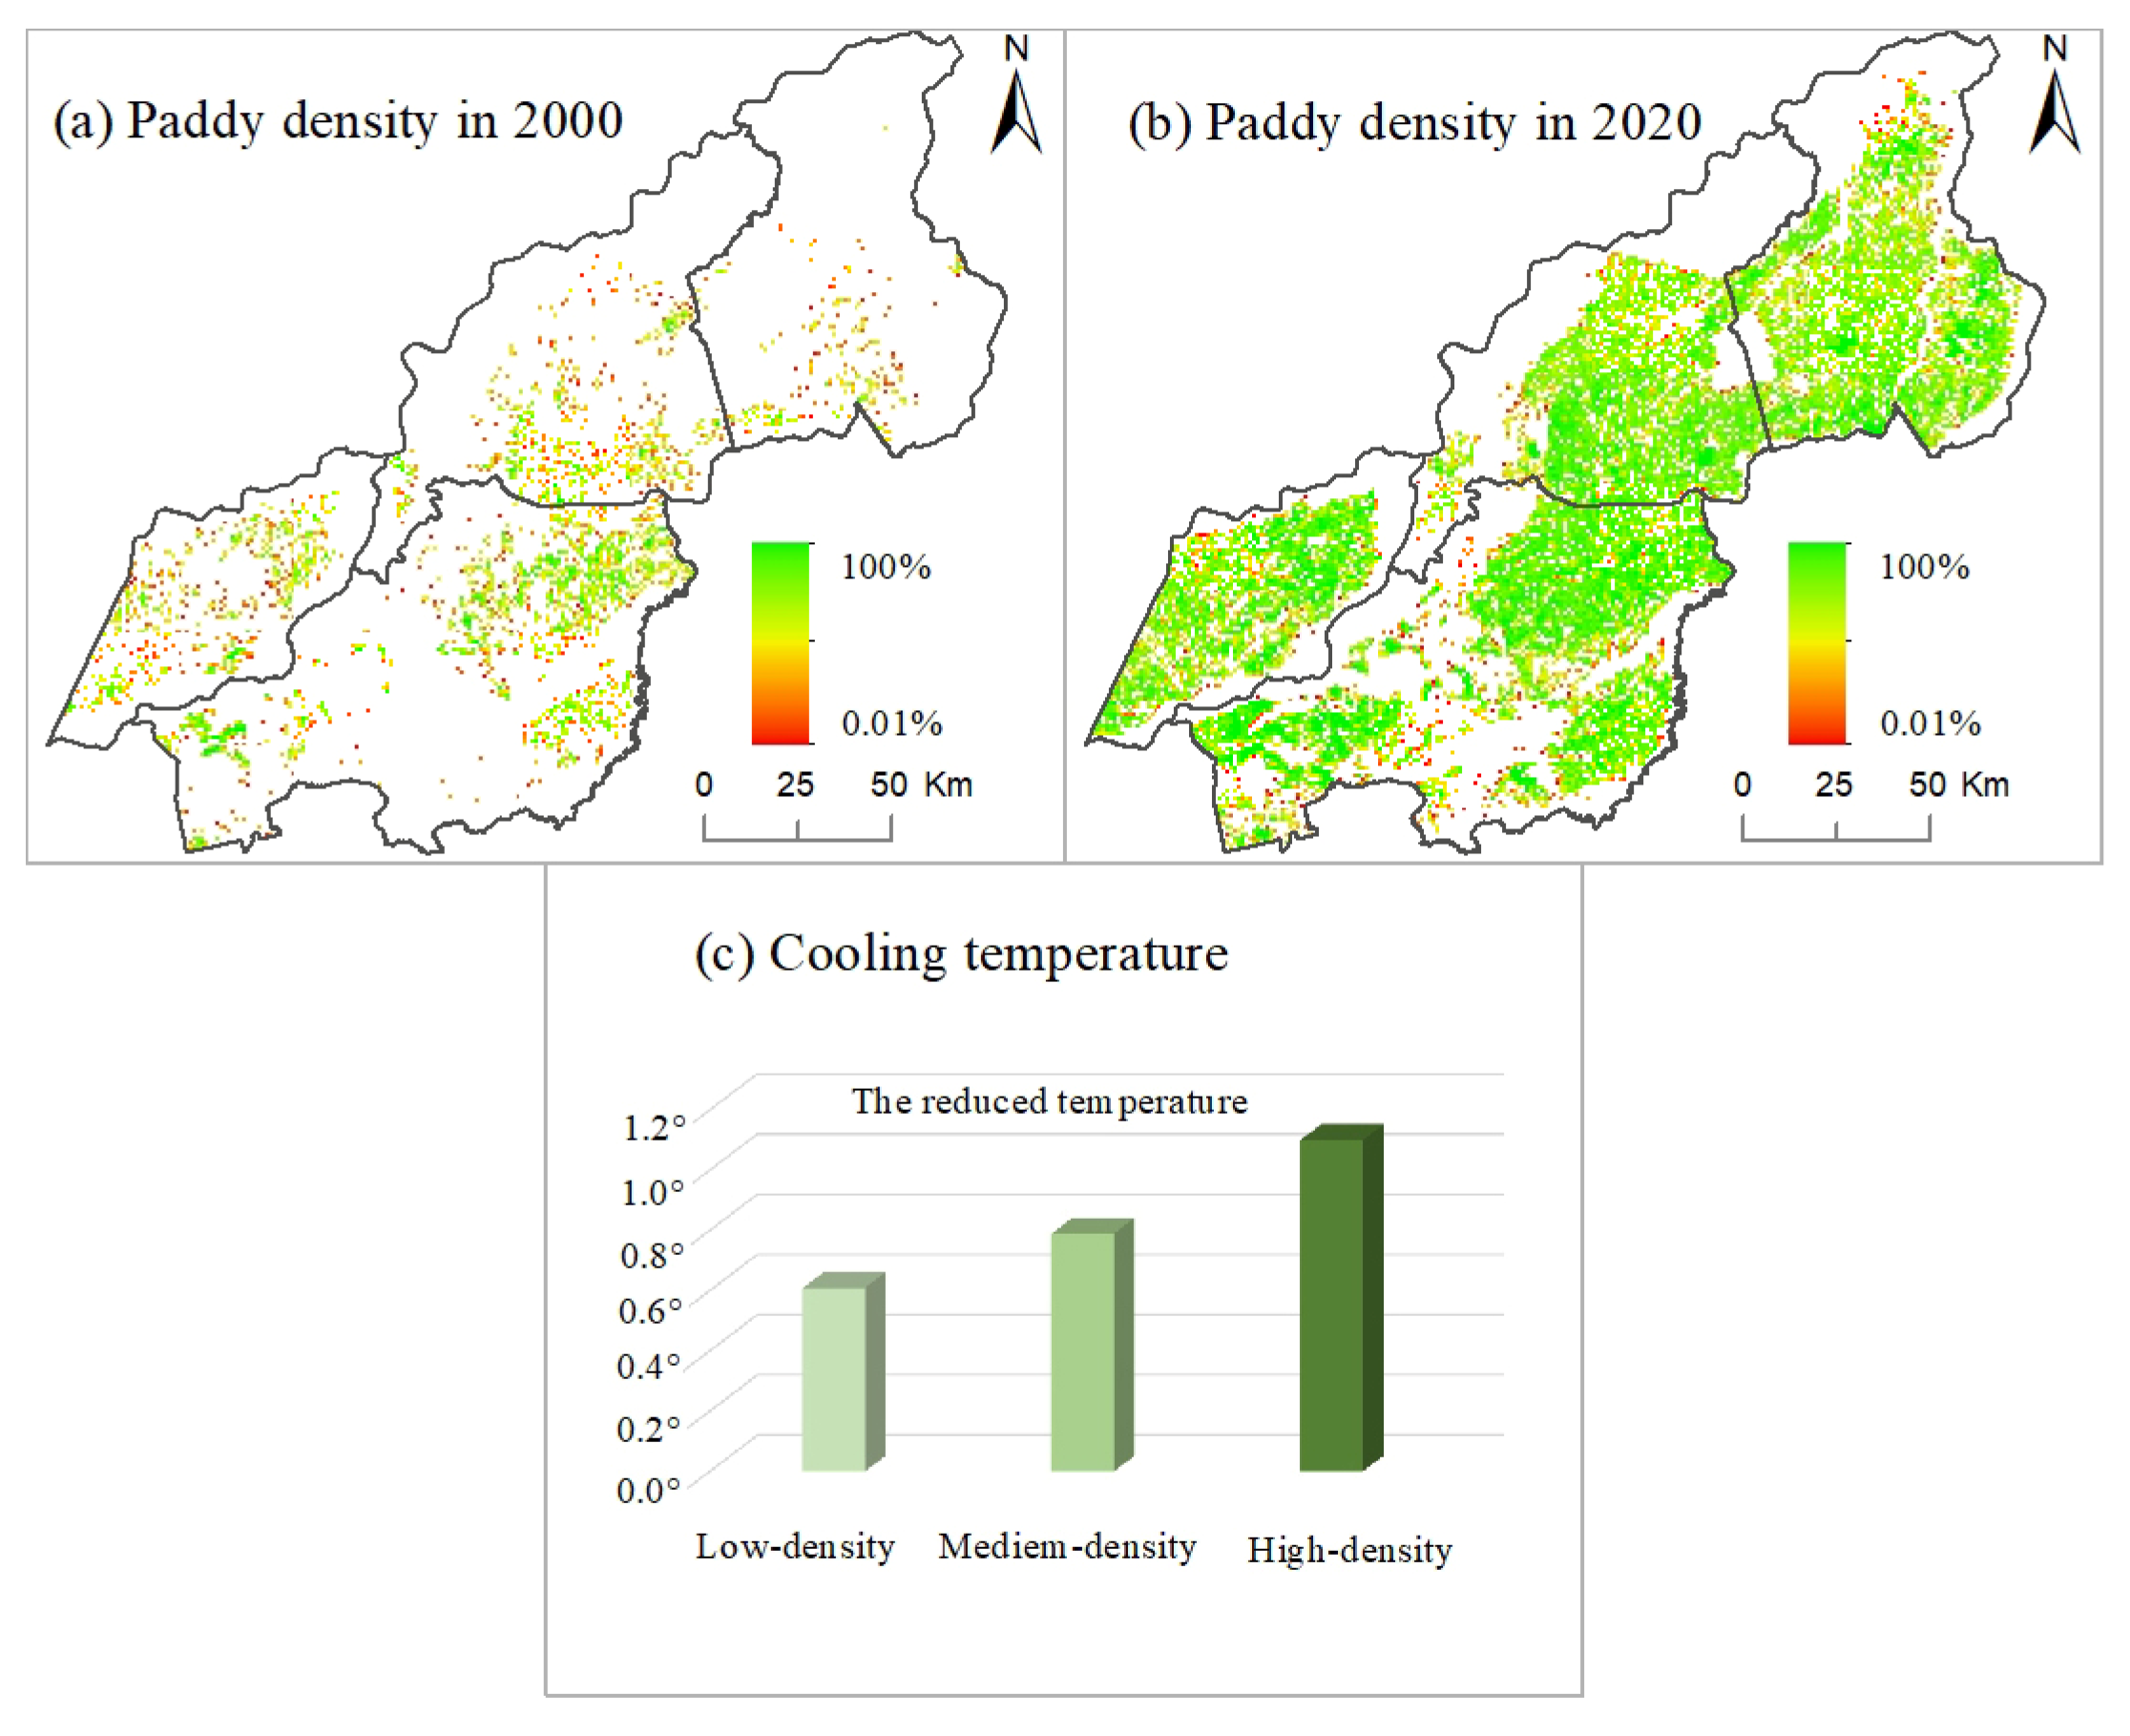
3.4. Analysis of Cooling Effect of Paddy Field under the Different Scales in the Study Area
4. Discussion
4.1. The New Finding of Paddy Field Expansion from 2000 to 2020
4.2. Influence of Paddy Field Expansion on the Comfort of Human Well-Being in Northeast China
4.3. Comparative Analysis of Paddy Field Change and Its Cold Irrigation Effect in Different Regions
5. Conclusions
Author Contributions
Funding
Institutional Review Board Statement
Informed Consent Statement
Data Availability Statement
Conflicts of Interest
References
- Yan, F.; Yu, L.; Yang, C.; Zhang, S. Paddy field expansion and aggregation since the mid-1950s in a cold region and its possible causes. Remote Sens. 2018, 10, 384. [Google Scholar] [CrossRef] [Green Version]
- Firdaus, R.R.; Leong Tan, M.; Rahmat, S.R.; Senevi Gunaratne, M. Paddy, rice and food security in Malaysia: A review of climate change impacts. Cogent Soc. Sci. 2020, 6, 1818373. [Google Scholar] [CrossRef]
- Yamamura, K.; Yokozawa, M.; Nishimori, M.; Ueda, Y.; Yokosuka, T. How to analyze long-term insect population dynamics under climate change: 50-year data of three insect pests in paddy fields. Popul. Ecol. 2006, 48, 31–48. [Google Scholar] [CrossRef]
- Zhuang, Y.; Liu, H.; Zhang, L.; Li, S. Research perspectives on paddy field systems: Ecological functions and environmental impacts. Int. J. Agric. Sustain. 2020, 18, 505–520. [Google Scholar] [CrossRef]
- Lutz, W.; Sanderson, W.; Scherbov, S. The coming acceleration of global population ageing. Nature 2008, 451, 716–719. [Google Scholar] [CrossRef]
- Mc Carthy, U.; Uysal, I.; Badia-Melis, R.; Mercier, S.; O’Donnell, C.; Ktenioudaki, A. Global food security–Issues, challenges and technological solutions. Trends Food Sci. Technol. 2018, 77, 11–20. [Google Scholar] [CrossRef]
- Kamruzzaman, M.; Hwang, S.; Choi, S.-K.; Cho, J.; Song, I.; Song, J.-H.; Jeong, H.; Jang, T.; Yoo, S.-H. Evaluating the impact of climate change on paddy water balance using APEX-paddy model. Water 2020, 12, 852. [Google Scholar] [CrossRef] [Green Version]
- Chen, H.; Zeng, W.; Jin, Y.; Zha, Y.; Mi, B.; Zhang, S. Development of a waterlogging analysis system for paddy fields in irrigation districts. J. Hydrol. 2020, 591, 125325. [Google Scholar] [CrossRef]
- Guo, J.; Song, Z.; Zhu, Y.; Wei, W.; Li, S.; Yu, Y. The characteristics of yield-scaled methane emission from paddy field in recent 35-year in China: A meta-analysis. J. Clean. Prod. 2017, 161, 1044–1050. [Google Scholar] [CrossRef]
- Akram, R.; Turan, V.; Wahid, A.; Ijaz, M.; Shahid, M.A.; Kaleem, S.; Hafeez, A.; Maqbool, M.M.; Chaudhary, H.J.; Munis, M.F.H. Paddy land pollutants and their role in climate change. In Environmental Pollution of Paddy Soils; Springer: Berlin, Germany, 2018; pp. 113–124. [Google Scholar]
- Kim, H.Y.; Ko, J.; Kang, S.; Tenhunen, J. Impacts of climate change on paddy rice yield in a temperate climate. Glob. Chang. Biol. 2013, 19, 548–562. [Google Scholar] [CrossRef]
- Liu, X.; Yang, S.; Xu, J.; Zhang, J.; Liu, J. Effects of soil heat storage and phase shift correction on energy balance closure of paddy fields. Atmósfera 2017, 30, 39–52. [Google Scholar] [CrossRef]
- Leppman, E.J. Changing Rice Bowl: Economic Development and Diet in China: Economic Development and Diet in China; Hong Kong University Press: Hong Kong, 2005; Volume 1. [Google Scholar]
- Clauss, K.; Yan, H.; Kuenzer, C. Mapping paddy rice in China in 2002, 2005, 2010 and 2014 with MODIS time series. Remote Sens. 2016, 8, 434. [Google Scholar] [CrossRef] [Green Version]
- Xia, Y.; Ti, C.; She, D.; Yan, X. Linking river nutrient concentrations to land use and rainfall in a paddy agriculture–urban area gradient watershed in southeast China. Sci. Total Environ. 2016, 566, 1094–1105. [Google Scholar] [CrossRef] [PubMed]
- Ji, Z.; Kang, S. Evaluation of extreme climate events using a regional climate model for China. Int. J. Climatol. 2015, 35, 888–902. [Google Scholar] [CrossRef]
- Qu, T.; Song, Y.T.; Yamagata, T. An introduction to the South China Sea throughflow: Its dynamics, variability, and application for climate. Dyn. Atmos. Ocean. 2009, 47, 3–14. [Google Scholar] [CrossRef]
- Liu, W.; Dong, J.; Xiang, K.; Wang, S.; Han, W.; Yuan, W. A sub-pixel method for estimating planting fraction of paddy rice in Northeast China. Remote Sens. Environ. 2018, 205, 305–314. [Google Scholar] [CrossRef]
- Jin, C.; Xiao, X.; Dong, J.; Qin, Y.; Wang, Z. Mapping paddy rice distribution using multi-temporal Landsat imagery in the Sanjiang Plain, northeast China. Front. Earth Sci. 2016, 10, 49–62. [Google Scholar] [CrossRef] [Green Version]
- Wang, Z.; Zhang, B.; Zhang, S.; Li, X.; Liu, D.; Song, K.; Li, J.; Li, F.; Duan, H. Changes of land use and of ecosystem service values in Sanjiang Plain, Northeast China. Environ. Monit. Assess. 2006, 112, 69–91. [Google Scholar] [CrossRef]
- Dong, J.; Xiao, X.; Menarguez, M.A.; Zhang, G.; Qin, Y.; Thau, D.; Biradar, C.; Moore, B., III. Mapping paddy rice planting area in northeastern Asia with Landsat 8 images, phenology-based algorithm and Google Earth Engine. Remote Sens. Environ. 2016, 185, 142–154. [Google Scholar] [CrossRef] [Green Version]
- Dong, G.; Bai, J.; Yang, S.; Wu, L.; Cai, M.; Zhang, Y.; Luo, Y.; Wang, Z. The impact of land use and land cover change on net primary productivity on China’s Sanjiang Plain. Environ. Earth Sci. 2015, 74, 2907–2917. [Google Scholar] [CrossRef]
- Dong, J.; Xiao, X.; Kou, W.; Qin, Y.; Zhang, G.; Li, L.; Jin, C.; Zhou, Y.; Wang, J.; Biradar, C. Tracking the dynamics of paddy rice planting area in 1986–2010 through time series Landsat images and phenology-based algorithms. Remote Sens. Environ. 2015, 160, 99–113. [Google Scholar] [CrossRef]
- Song, K.; Liu, D.; Wang, Z.; Khan, S.; Hafeez, M.; Mu, J. A study on the wetland dynamic and its relation with cropland reclamation in Sanjiang plain, China. In Proceedings of the International Congress on Modeling and Simulation, Christchurch, New Zealand, 11–13 December 2007; pp. 2569–2575. [Google Scholar]
- Ting, Y.; Xiang, P.-a. Emergy analysis of paddy farming in Hunan Province, China: A new perspective on sustainable development of agriculture. J. Integr. Agric. 2016, 15, 2426–2436. [Google Scholar]
- Fahmi, Z.; Samah, B.A.; Abdullah, H. Paddy industry and paddy farmers well-being: A success recipe for agriculture industry in Malaysia. Asian Soc. Sci. 2013, 9, 177. [Google Scholar] [CrossRef]
- Alberto, M.C.R.; Wassmann, R.; Hirano, T.; Miyata, A.; Kumar, A.; Padre, A.; Amante, M. CO2/heat fluxes in rice fields: Comparative assessment of flooded and non-flooded fields in the Philippines. Agric. For. Meteorol. 2009, 149, 1737–1750. [Google Scholar] [CrossRef]
- Tsai, J.-L.; Tsuang, B.-J.; Lu, P.-S.; Yao, M.-H.; Shen, Y. Surface energy components and land characteristics of a rice paddy. J. Appl. Meteorol. Climatol. 2007, 46, 1879–1900. [Google Scholar] [CrossRef]
- Duan, Z.; Grimmond, C.; Gao, C.Y.; Sun, T.; Liu, C.; Wang, L.; Li, Y.; Gao, Z. Seasonal and interannual variations in the surface energy fluxes of a rice–wheat rotation in Eastern China. J. Appl. Meteorol. Climatol. 2021, 60, 877–891. [Google Scholar] [CrossRef]
- Friedl, M.A. Forward and inverse modeling of land surface energy balance using surface temperature measurements. Remote Sens. Environ. 2002, 79, 344–354. [Google Scholar] [CrossRef]
- Zhang, Y.; Sun, L. Spatial-temporal impacts of urban land use land cover on land surface temperature: Case studies of two Canadian urban areas. Int. J. Appl. Earth Obs. Geoinf. 2019, 75, 171–181. [Google Scholar] [CrossRef]
- Alexander, C. Normalised difference spectral indices and urban land cover as indicators of land surface temperature (LST). Int. J. Appl. Earth Obs. Geoinf. 2020, 86, 102013. [Google Scholar] [CrossRef]
- Alter, R.E.; Douglas, H.C.; Winter, J.M.; Eltahir, E.A. Twentieth century regional climate change during the summer in the Central United States attributed to agricultural intensification. Geophys. Res. Lett. 2018, 45, 1586–1594. [Google Scholar] [CrossRef]
- Kang, S.; Eltahir, E.A. North China Plain threatened by deadly heatwaves due to climate change and irrigation. Nat. Commun. 2018, 9, 2894. [Google Scholar] [CrossRef] [PubMed] [Green Version]
- Pecl, G.T.; Araújo, M.B.; Bell, J.D.; Blanchard, J.; Bonebrake, T.C.; Chen, I.-C.; Clark, T.D.; Colwell, R.K.; Danielsen, F.; Evengård, B. Biodiversity redistribution under climate change: Impacts on ecosystems and human well-being. Science 2017, 355, eaai9214. [Google Scholar] [CrossRef] [PubMed]
- Liu, J.; Kuang, W.; Zhang, Z.; Xu, X.; Qin, Y.; Ning, J.; Zhou, W.; Zhang, S.; Li, R.; Yan, C. Spatiotemporal characteristics, patterns, and causes of land-use changes in China since the late 1980s. J. Geogr. Sci. 2014, 24, 195–210. [Google Scholar] [CrossRef]
- Qiu, S.; Lin, Y.; Shang, R.; Zhang, J.; Ma, L.; Zhu, Z. Making Landsat time series consistent: Evaluating and improving Landsat analysis ready data. Remote Sens. 2018, 11, 51. [Google Scholar] [CrossRef] [Green Version]
- Liu, Y.; Li, J.; Yang, Y. Strategic adjustment of land use policy under the economic transformation. Land Use Policy 2018, 74, 5–14. [Google Scholar] [CrossRef]
- He, Y.; Chen, Y.; Tang, H.; Yao, Y.; Yang, P.; Chen, Z. Exploring spatial change and gravity center movement for ecosystem services value using a spatially explicit ecosystem services value index and gravity model. Environ. Monit. Assess. 2011, 175, 563–571. [Google Scholar] [CrossRef]
- Benali, A.; Carvalho, A.; Nunes, J.; Carvalhais, N.; Santos, A. Estimating air surface temperature in Portugal using MODIS LST data. Remote Sens. Environ. 2012, 124, 108–121. [Google Scholar] [CrossRef]
- Wan, Z. New refinements and validation of the collection-6 MODIS land-surface temperature/emissivity product. Remote Sens. Environ. 2014, 140, 36–45. [Google Scholar] [CrossRef]
- Ye, Q.; Qijiao, S.; Xiaofan, Z.; Shiyong, Q.; Lindsay, T. China’s New Urbanisation Opportunity: A Vision for the 14th Five-Year Plan; Coalition for Urban Transitions: London, UK, 2020. [Google Scholar]
- Wei, H.; Nian, M.; Li, L. China’s strategies and policies for regional development during the period of the 14th five-year plan. Chin. J. Urban Environ. Stud. 2020, 8, 2050008. [Google Scholar] [CrossRef]
- Jie, F. High-quality development of national territory space governance and regional economic layout during 14th Five-Year Plan in China. Bull. Chin. Acad. Sci. 2020, 35, 796–805. [Google Scholar]
- Gao, J.; Liu, Y. Climate warming and land use change in Heilongjiang Province, Northeast China. Appl. Geogr. 2011, 31, 476–482. [Google Scholar] [CrossRef]
- Pan, T.; Zhang, C.; Kuang, W.; De Maeyer, P.; Kurban, A.; Hamdi, R.; Du, G. Time tracking of different cropping patterns using Landsat images under different agricultural systems during 1990–2050 in Cold China. Remote Sens. 2018, 10, 2011. [Google Scholar] [CrossRef] [Green Version]
- Cruz, R.P.d.; Sperotto, R.A.; Cargnelutti, D.; Adamski, J.M.; de FreitasTerra, T.; Fett, J.P. Avoiding damage and achieving cold tolerance in rice plants. Food Energy Secur. 2013, 2, 96–119. [Google Scholar] [CrossRef]
- Wang, W.; Vinocur, B.; Altman, A. Plant responses to drought, salinity and extreme temperatures: Towards genetic engineering for stress tolerance. Planta 2003, 218, 1–14. [Google Scholar] [CrossRef]
- Zhao, Q.; Sailor, D.J.; Wentz, E.A. Impact of tree locations and arrangements on outdoor microclimates and human thermal comfort in an urban residential environment. Urban For. Urban Green. 2018, 32, 81–91. [Google Scholar] [CrossRef] [Green Version]
- Lai, D.; Liu, W.; Gan, T.; Liu, K.; Chen, Q. A review of mitigating strategies to improve the thermal environment and thermal comfort in urban outdoor spaces. Sci. Total Environ. 2019, 661, 337–353. [Google Scholar] [CrossRef]
- Zhang, Y.; Li, Y.; Chen, Y.; Liu, S.; Yang, Q. Spatiotemporal Heterogeneity of Urban Land Expansion and Urban Population Growth under New Urbanization: A Case Study of Chongqing. Int. J. Environ. Res. Public Health 2022, 19, 7792. [Google Scholar] [CrossRef]
- Pun, M.; Mutiibwa, D.; Li, R. Land use classification: A surface energy balance and vegetation index application to map and monitor irrigated lands. Remote Sens. 2017, 9, 1256. [Google Scholar] [CrossRef] [Green Version]
- Xue, W.; Jeong, S.; Ko, J.; Yeom, J.-M. Contribution of Biophysical Factors to Regional Variations of Evapotranspiration and Seasonal Cooling Effects in Paddy Rice in South Korea. Remote Sens. 2021, 13, 3992. [Google Scholar] [CrossRef]
- Yokohari, M.; Brown, R.D.; Kato, Y.; Yamamoto, S. The cooling effect of paddy fields on summertime air temperature in residential Tokyo, Japan. Landsc. Urban Plan. 2001, 53, 17–27. [Google Scholar] [CrossRef]
- Shi, H.; Luo, G.; Zheng, H.; Chen, C.; Bai, J.; Liu, T.; Ochege, F.U.; De Maeyer, P. Coupling the water-energy-food-ecology nexus into a Bayesian network for water resources analysis and management in the Syr Darya River basin. J. Hydrol. 2020, 581, 124387. [Google Scholar] [CrossRef]
- Wu, L.; Feng, J.; Miao, W. Simulating the impacts of irrigation and dynamic vegetation over the North China Plain on regional climate. J. Geophys. Res. Earth Surf. 2018, 123, 8017–8034. [Google Scholar] [CrossRef]
- Puma, M.; Cook, B. Effects of irrigation on global climate during the 20th century. J. Geophys. Res. Earth Surf. 2010, 115, D16. [Google Scholar] [CrossRef]


| Fuyuan City | Tongjiang City | Suibin City | Fujin City | |||||
|---|---|---|---|---|---|---|---|---|
| Year | Paddy | Reclamation | Paddy | Reclamation | Paddy | Reclamation | Paddy | Reclamation |
| Area | Ratio | Area | Ratio | Area | Ratio | Rrea | Ratio | |
| 2000 | 223.35 | 3.67 | 586.14 | 9.60 | 528.32 | 15.71 | 1226.86 | 14.45 |
| 2005 | 475.15 | 7.80 | 1019.24 | 16.69 | 693.87 | 20.63 | 1823.19 | 21.48 |
| 2010 | 1634.03 | 26.82 | 2000.37 | 32.76 | 1317.44 | 39.17 | 2707.15 | 31.89 |
| 2015 | 3043.35 | 49.96 | 2563.38 | 41.99 | 1749.59 | 52.02 | 3821.94 | 45.03 |
| 2020 | 3103.40 | 50.95 | 2569.24 | 42.08 | 1775.33 | 52.78 | 3982.97 | 46.92 |
Publisher’s Note: MDPI stays neutral with regard to jurisdictional claims in published maps and institutional affiliations. |
© 2022 by the authors. Licensee MDPI, Basel, Switzerland. This article is an open access article distributed under the terms and conditions of the Creative Commons Attribution (CC BY) license (https://creativecommons.org/licenses/by/4.0/).
Share and Cite
Pan, T.; Bao, Z.; Ning, L.; Tong, S. Change of Rice Paddy and Its Impact on Human Well-Being from the Perspective of Land Surface Temperature in the Northeastern Sanjiang Plain of China. Int. J. Environ. Res. Public Health 2022, 19, 9690. https://doi.org/10.3390/ijerph19159690
Pan T, Bao Z, Ning L, Tong S. Change of Rice Paddy and Its Impact on Human Well-Being from the Perspective of Land Surface Temperature in the Northeastern Sanjiang Plain of China. International Journal of Environmental Research and Public Health. 2022; 19(15):9690. https://doi.org/10.3390/ijerph19159690
Chicago/Turabian StylePan, Tao, Zhengyi Bao, Letian Ning, and Siqin Tong. 2022. "Change of Rice Paddy and Its Impact on Human Well-Being from the Perspective of Land Surface Temperature in the Northeastern Sanjiang Plain of China" International Journal of Environmental Research and Public Health 19, no. 15: 9690. https://doi.org/10.3390/ijerph19159690
APA StylePan, T., Bao, Z., Ning, L., & Tong, S. (2022). Change of Rice Paddy and Its Impact on Human Well-Being from the Perspective of Land Surface Temperature in the Northeastern Sanjiang Plain of China. International Journal of Environmental Research and Public Health, 19(15), 9690. https://doi.org/10.3390/ijerph19159690