
Study on the Spatial Interaction between Urban Economic and Ecological Environment—A Case Study of Wuhan City

Abstract
:1. Introduction
- (1)
- A comprehensive evaluation index system of urban economy and ecological environment is constructed. The comprehensive ecological index system includes the ecological carbon sequestration index and land-cover index. The city economy comprehensive index system is constructed from three aspects: the economic development level, the economic structure, and the economic efficiency. The index weight is calculated by combining subjective and objective methods.
- (2)
- The interaction between ecological environment and urban economy in Wuhan city is analyzed from dynamic and spatial perspectives.
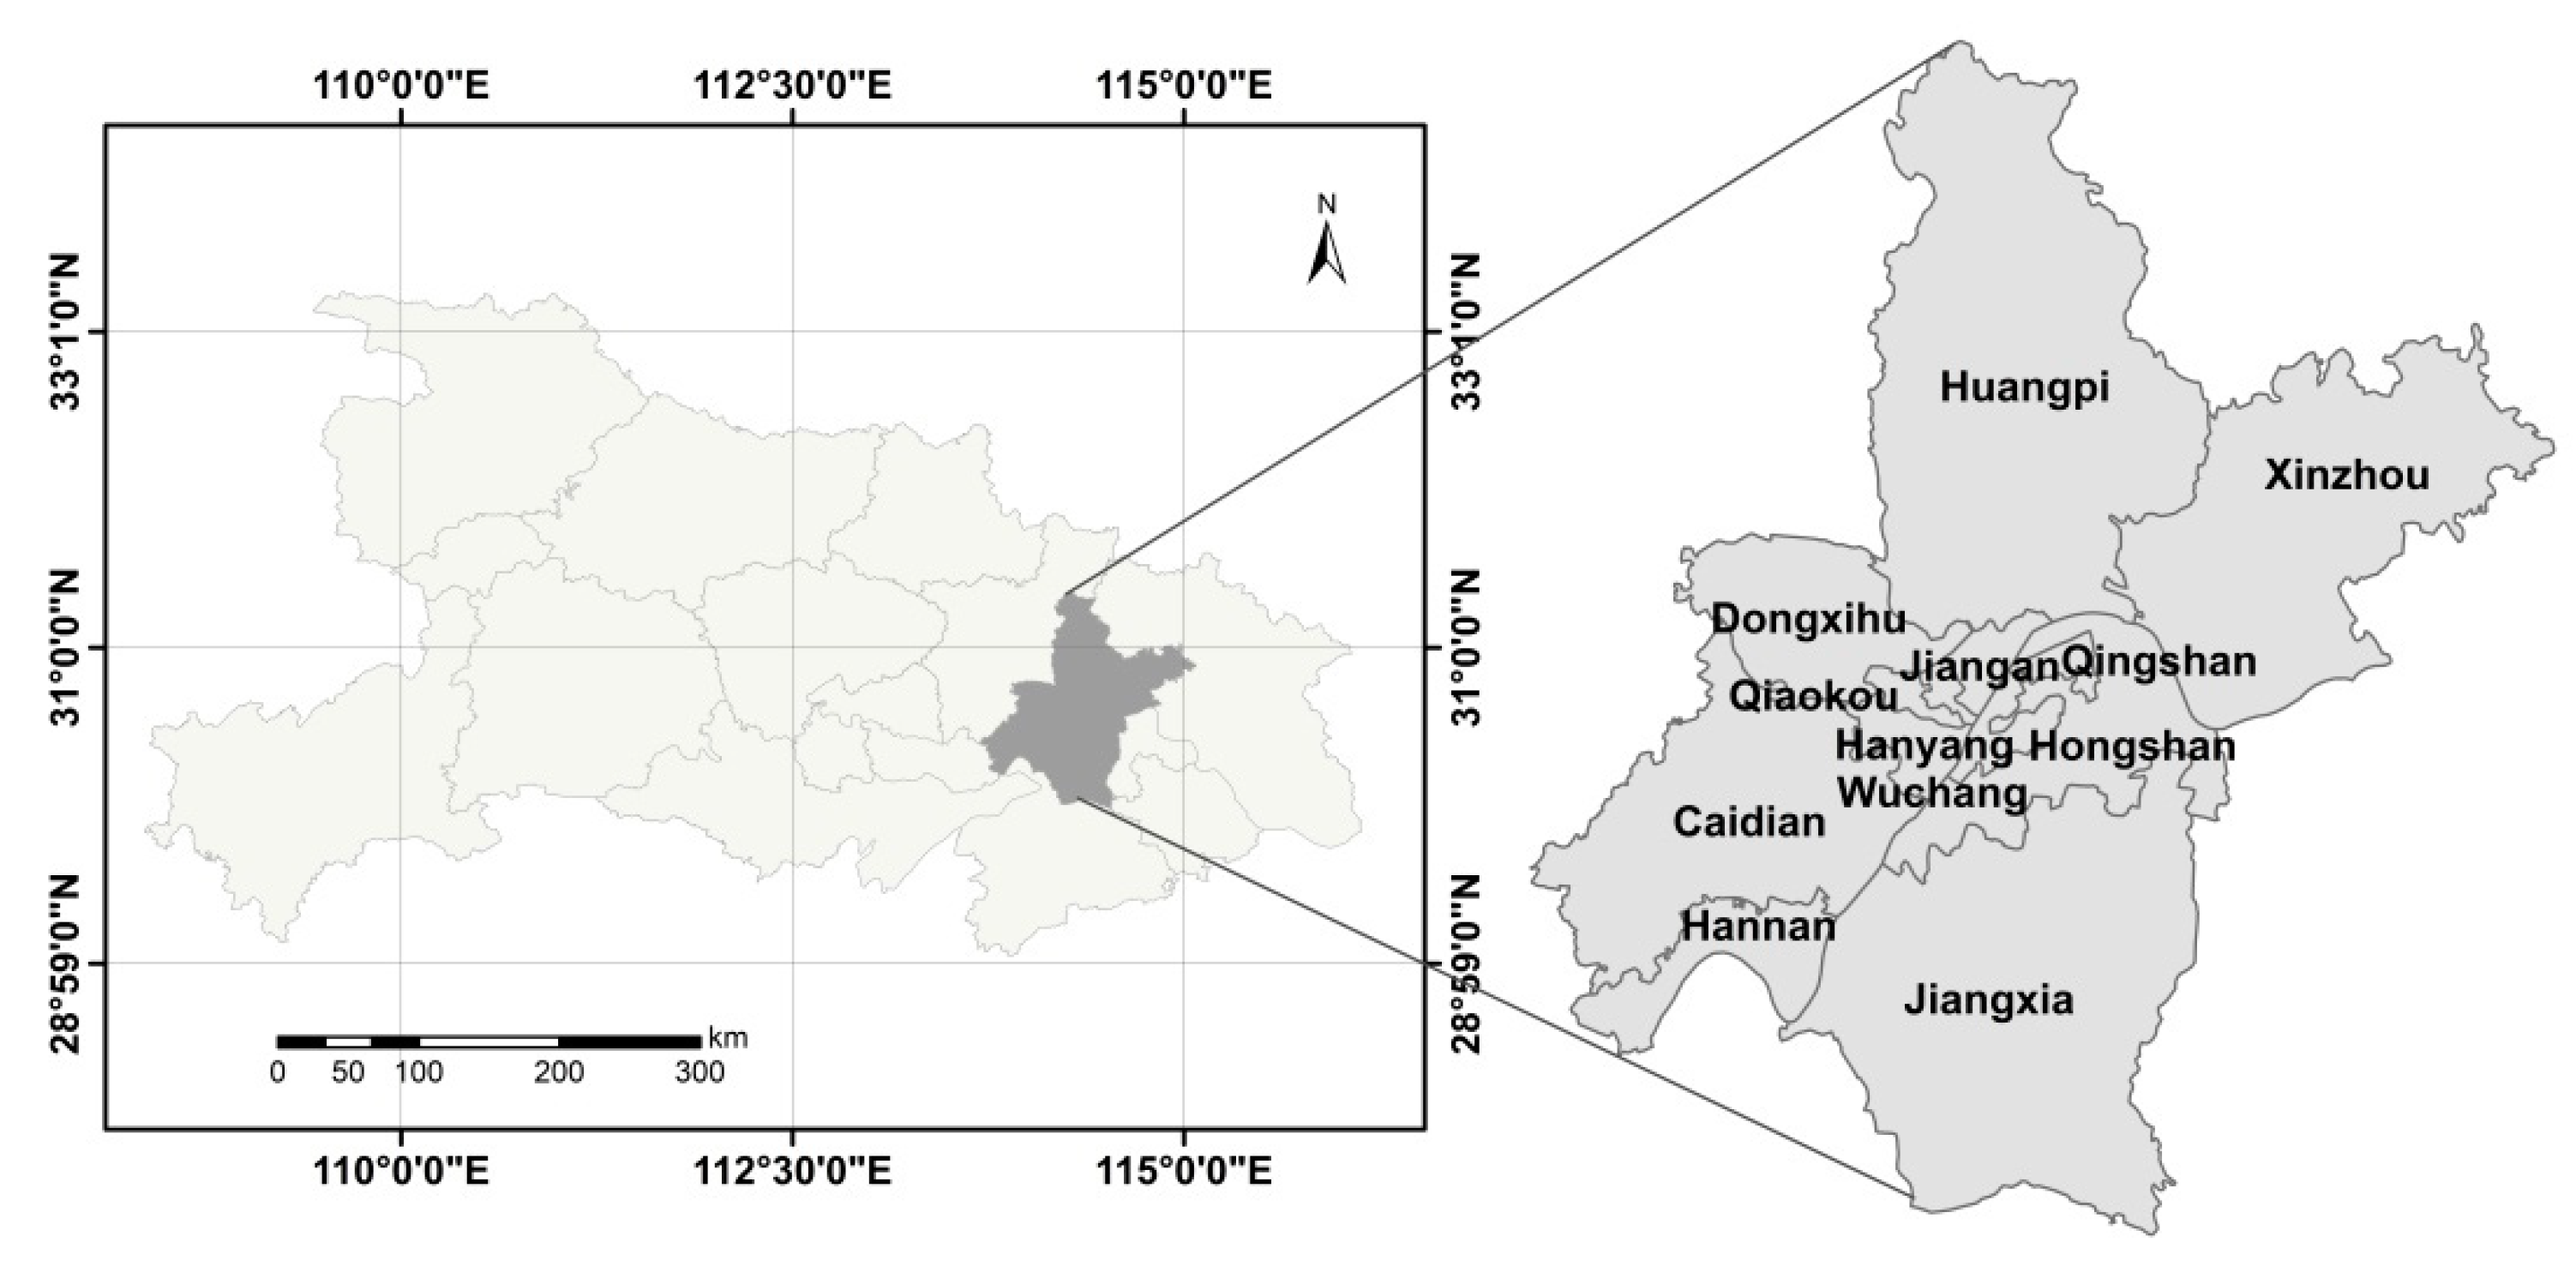
2. Study Area
3. Materials and Methods
3.1. Assessment Index System
- (1)
- Economic development level index
- (2)
- Economic structure index
- (3)
- Economic efficiency index
- (4)
- Ecological carbon sequestration index
- (5)
- Land-cover index
3.2. Data Processing and Sources
3.3. Index Weight Calculation
- (a)
- Constructing the first-order index judgment matrix
- (b)
- Consistency test
- (c)
- Calculating the weight proportion of each level of indicators
- (a)
- Calculation of standardized matrix
- (b)
- Calculation of probability matrix P
- (c)
- Calculation of information entropy
- (d)
- Calculation of the information utility value
- (e)
- Calculation of the entropy weight of each index
3.4. Elastic Coefficient Method
3.5. Spatial Autocorrelation Model
4. Results
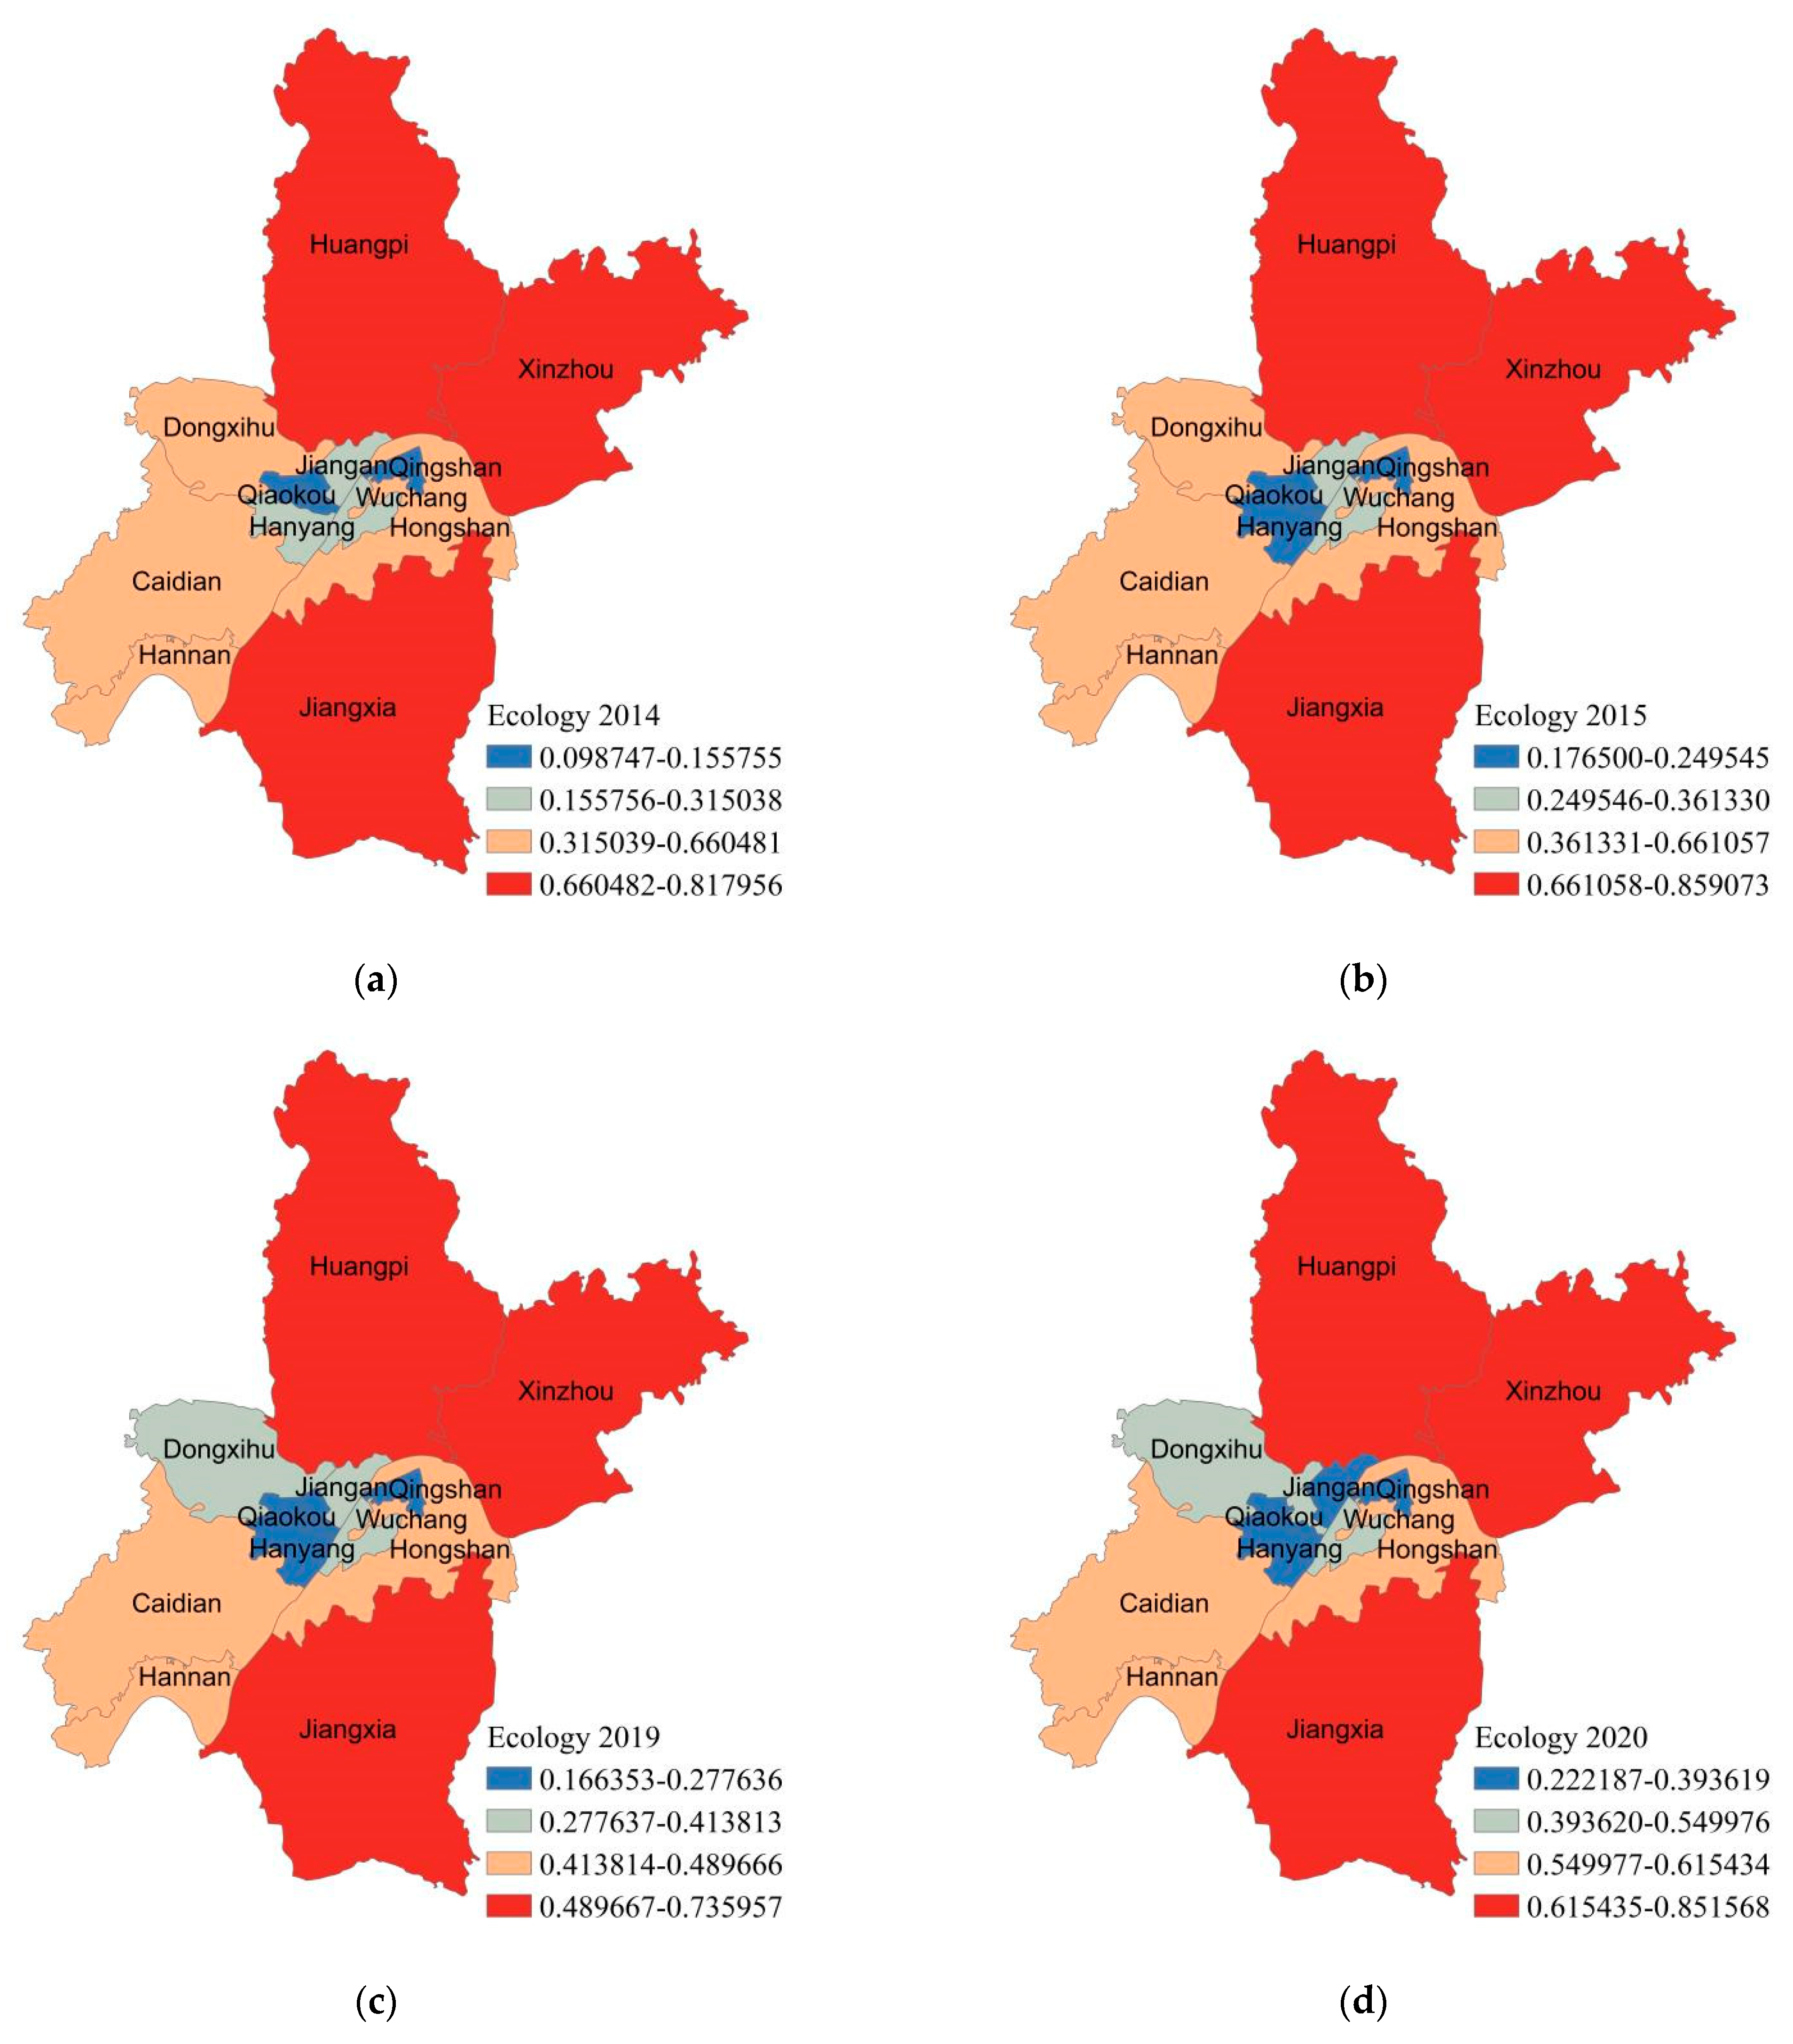
4.1. Analysis of Dynamic Relationship between Economic Development and Ecological Environment
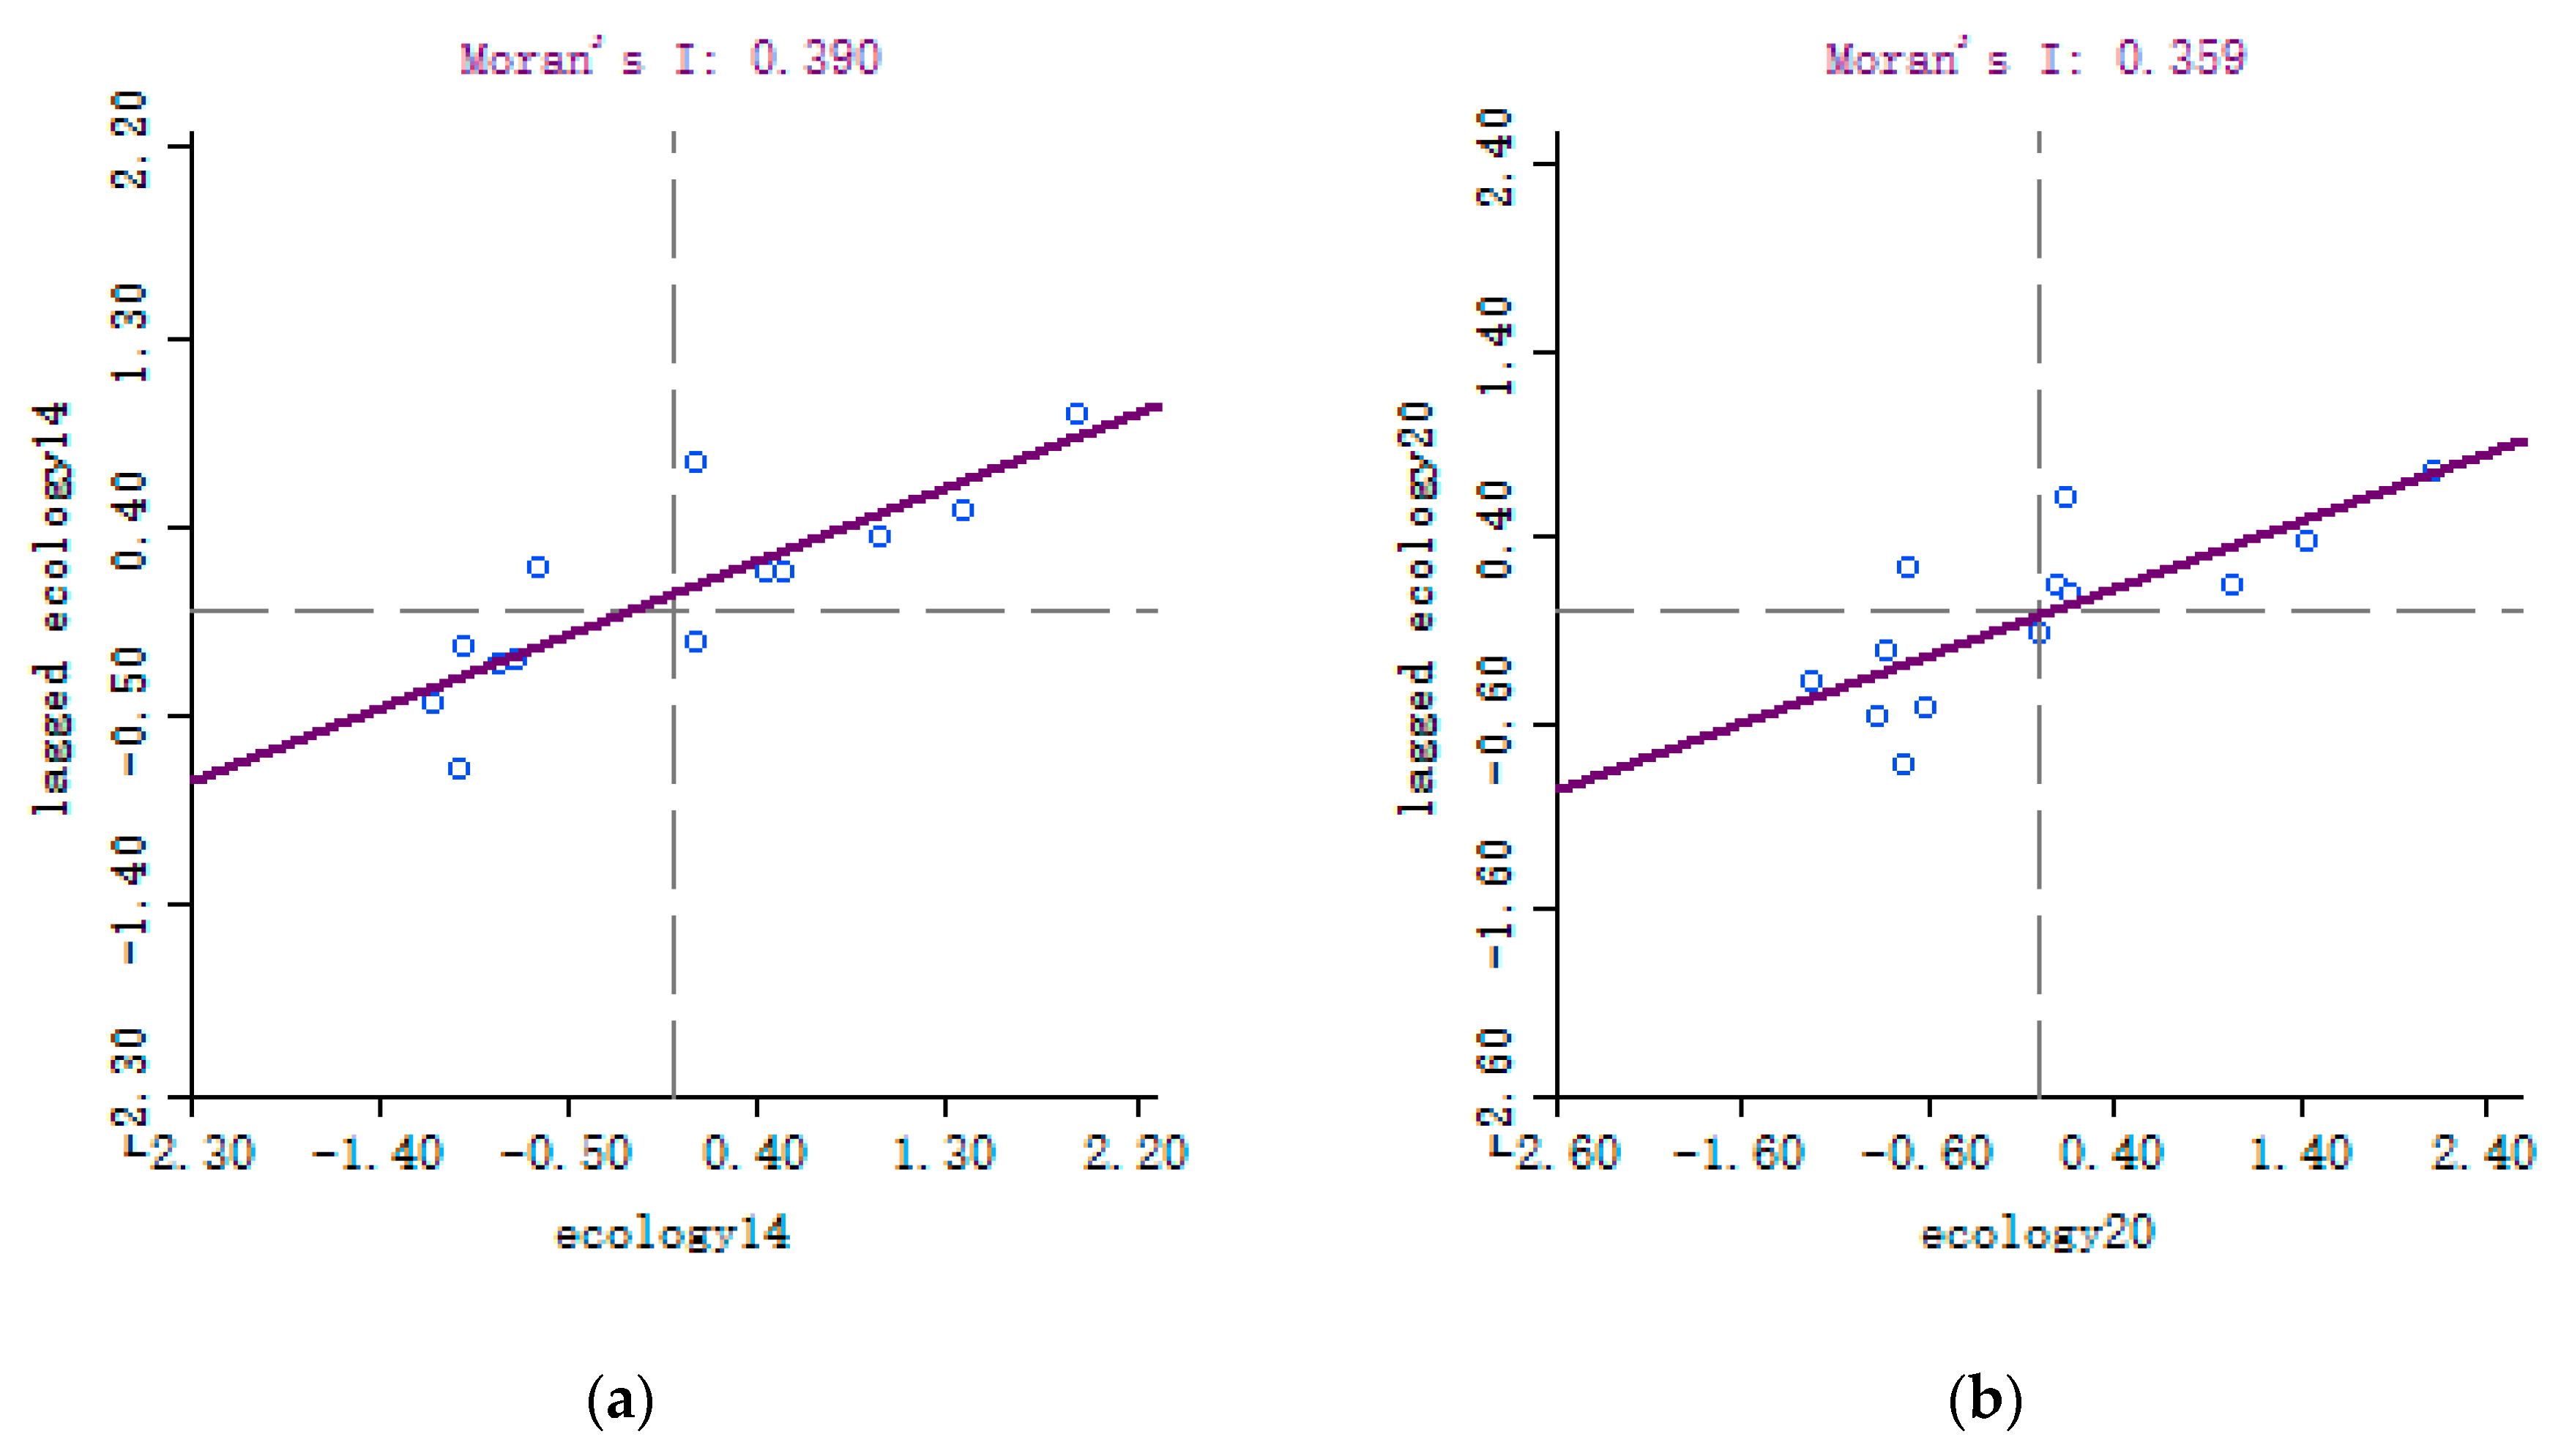
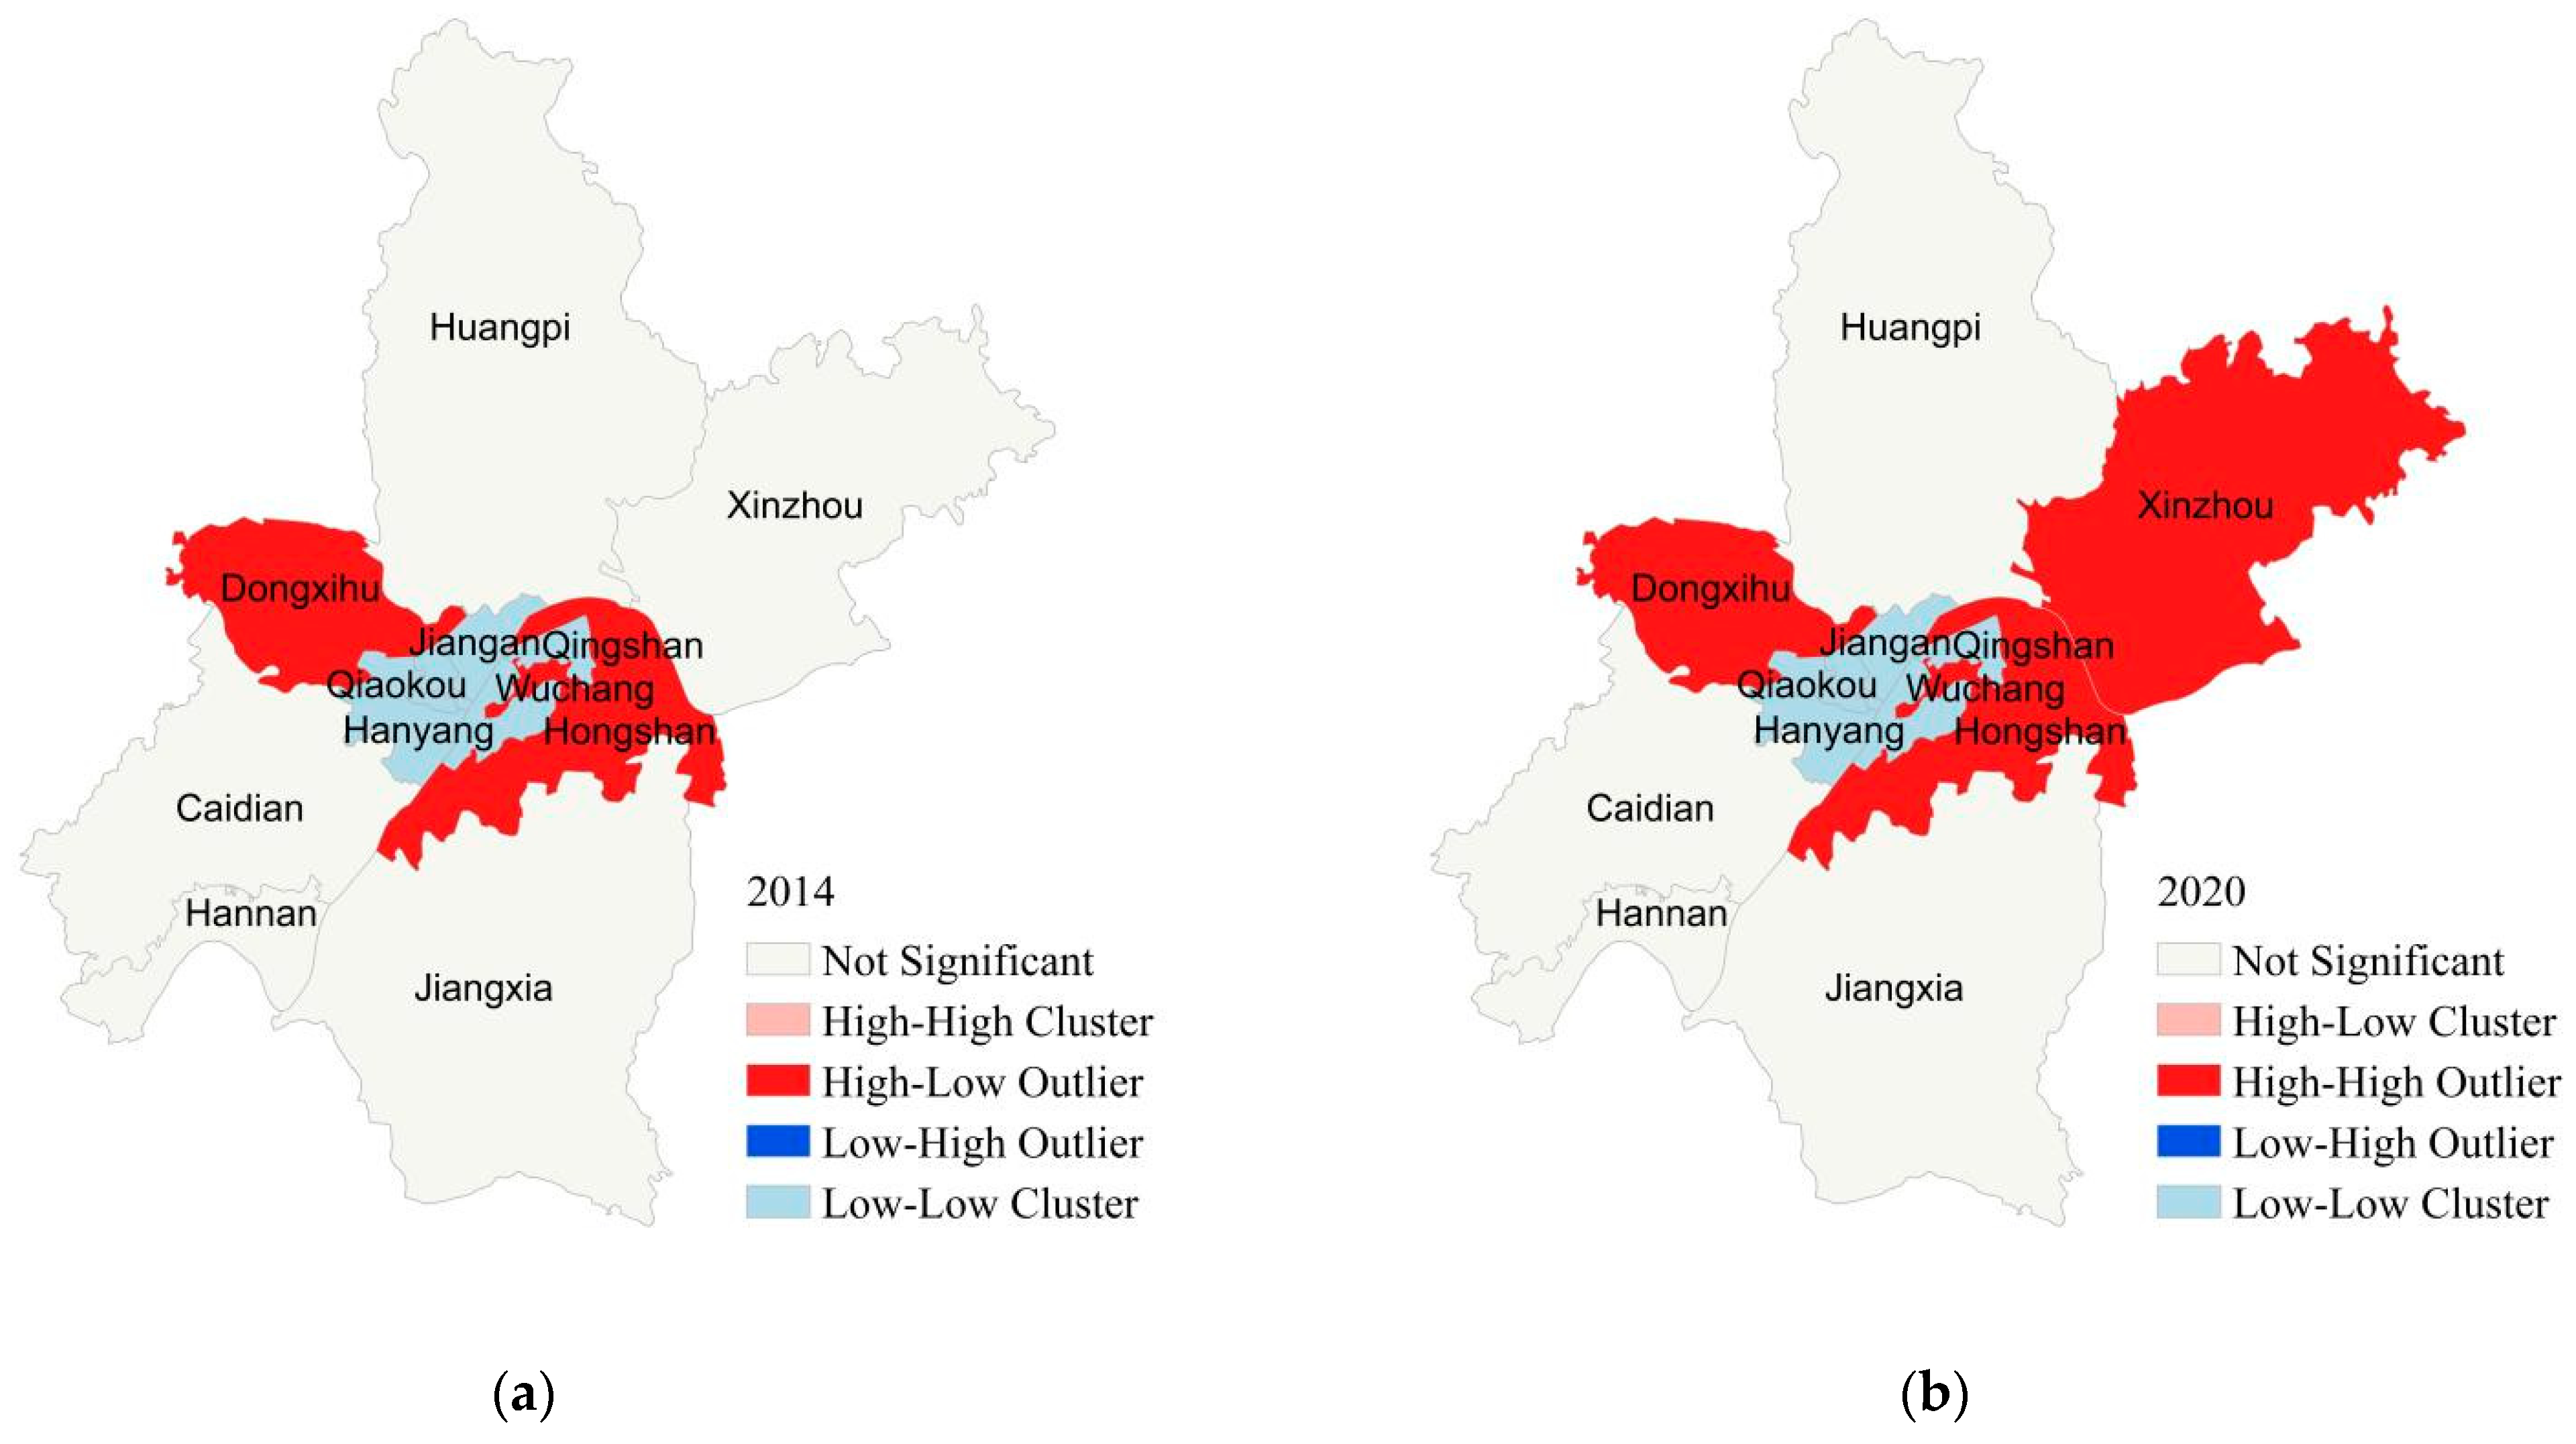
4.2. Analysis of Spatial Interaction between Economic Development and Ecological Environment
5. Discussion and Policy Recommendations
- (1)
- Promote green development through local policy. We should continue to push the urbanization process forward while combining the development differences and spatial heterogeneity of different regions. Local governments should improve the efficiency of urban infrastructure, such as public systems, and reduce carbon emissions.
- (2)
- Adhere to green production and improve urban ecological environment. While urban economic development is being achieved, the ecological environment should also be optimized. A relationship between these two elements can move the city in the direction of green and low-carbon development.
- (3)
- Reasonably control energy consumption and raise awareness of low-carbon environmental protection. Energy consumption is a mainstay; hence, we should advocate the low-carbon concept in economic development and life, maintaining a simple and low-carbon consciousness. At the same time, with the continuous improvement of the technical level, we should pay attention to and provide targeted support for projects with less pollution and low energy consumption, such as transformation and marketing.
- (4)
- Promote the construction of wetland culture and grasp the ecological advantages. This can be achieved by protecting the integrity of wetlands, maintaining and increasing carbon sinks, building Wuhan’s “Wetland City” business card, and building an international wetland city.
6. Conclusions
Author Contributions
Funding
Institutional Review Board Statement
Informed Consent Statement
Data Availability Statement
Conflicts of Interest
References
- Li, G.; Fang, C. Global mapping and estimation of ecosystem services values and gross domestic product: A spatially explicit integration of national ‘green GDP’accounting. Ecol. Indic. 2014, 46, 293–314. [Google Scholar] [CrossRef]
- Shi, T.; Yang, S.; Zhang, W.; Zhou, Q. Coupling coordination degree measurement and spatiotemporal heterogeneity between economic development and ecological environment—Empirical evidence from tropical and subtropical regions of China. J. Clean. Prod. 2020, 244, 118739. [Google Scholar] [CrossRef]
- Tao, L.R.G. Construction and Application of the High-quality Development Index—Also on the High-quality Development of Northeast China’s Economy. J. Northeast. Univ. 2020, 22, 31–39. [Google Scholar] [CrossRef]
- Sun, Q. Urban Land Regulation and the Global Carbon Cycle: Its Ecological and Economic Effects. Open House Int. 2017, 42, 25–28. [Google Scholar] [CrossRef]
- Du, W.; Yan, H.; Feng, Z.; Yang, Y.; Liu, F. The supply-consumption relationship of ecological resources under ecological civilization construction in China. Resour. Conserv. Recycl. 2021, 172, 105679. [Google Scholar] [CrossRef]
- Cheng, X.; Chen, L.; Sun, R.; Kong, P. Land use changes and socio-economic development strongly deteriorate river ecosystem health in one of the largest basins in China. Sci. Total Environ. 2018, 616, 376–385. [Google Scholar] [CrossRef]
- Rojas, O.; Soto, E.; Rojas, C.; López, J.J. Assessment of the flood mitigation ecosystem service in a coastal wetland and potential impact of future urban development in Chile. Habitat Int. 2022, 123, 102554. [Google Scholar] [CrossRef]
- Basit, A.; Amin, N.U.; Shah, S.T.; Ahmad, I. Greenbelt conservation as a component of ecosystem, ecological benefits and management services: Evidence from Peshawar City, Pakistan. Environ. Dev. Sustain. 2021, 24, 1–25. [Google Scholar] [CrossRef]
- Powell, R.; Lever, J. Europe’s perennial ‘outsiders’: A processual approach to Roma stigmatization and ghettoization. Curr. Sociol. 2017, 65, 680–699. [Google Scholar] [CrossRef]
- Cretan, R.; Málovics, G.; Berki, B.M. On the perpetuation and contestation of racial stigma: Urban Roma in a disadvantaged neighbourhood of Szeged. Geogr. Pannonica 2020, 24, 294–310. [Google Scholar] [CrossRef]
- Méreiné-Berki, B.; Málovics, G.; Creţan, R. “You become one with the place”: Social mixing, social capital, and the lived experience of urban desegregation in the Roma community. Cities 2021, 117, 103302. [Google Scholar] [CrossRef]
- Lai, X.; Xiao, Z. A research on urban eco-security evaluation and analysis: Complex system’s brittle structure model. Environ. Sci. Pollut. Res. 2020, 27, 24914–24928. [Google Scholar] [CrossRef] [PubMed]
- Fang, W.; An, H.; Li, H.; Gao, X.; Sun, X.; Zhong, W. Accessing on the sustainability of urban ecological-economic systems by means of a coupled emergy and system dynamics model: A case study of Beijing. Energy Policy 2017, 100, 326–337. [Google Scholar] [CrossRef]
- Mou, Y.; Luo, Y.; Su, Z.; Wang, J.; Liu, T. Evaluating the dynamic sustainability and resilience of a hybrid urban system: Case of Chengdu, China. J. Clean. Prod. 2021, 291, 125719. [Google Scholar] [CrossRef]
- Zhao, Y.; Wang, S.; Ge, Y.; Liu, Q.; Liu, X. The spatial differentiation of the coupling relationship between urbanization and the eco-environment in countries globally: A comprehensive assessment. Ecol. Model. 2017, 360, 313–327. [Google Scholar] [CrossRef]
- Meng, F.; Guo, J.; Guo, Z.; Lee, J.C.; Liu, G.; Wang, N. Urban ecological transition: The practice of ecological civilization construction in China. Sci. Total Environ. 2021, 755, 142633. [Google Scholar] [CrossRef] [PubMed]
- Barot, S.; Abbadie, L.; Auclerc, A.; Barthelemy, C.; Bérille, E.; Billet, P.; Clergeau, P.; Consalès, J.-N.; Deschamp-Cottin, M.; David, A. Urban ecology, stakeholders and the future of ecology. Sci. Total Environ. 2019, 667, 475–484. [Google Scholar] [CrossRef] [PubMed]
- Song, Y. Ecological city and urban sustainable development. Procedia Eng. 2011, 21, 142–146. [Google Scholar] [CrossRef]
- Deng, C.; Liu, J.; Nie, X.; Li, Z.; Liu, Y.; Xiao, H.; Hu, X.; Wang, L.; Zhang, Y.; Zhang, G. How trade-offs between ecological construction and urbanization expansion affect ecosystem services. Ecol. Indic. 2021, 122, 107253. [Google Scholar] [CrossRef]
- Chen, W.; Zeng, J.; Zhong, M.; Pan, S. Coupling analysis of ecosystem services value and economic development in the Yangtze River Economic Belt: A case study in Hunan Province, China. Remote Sens. 2021, 13, 1552. [Google Scholar] [CrossRef]
- Grossman, G.M.; Krueger, A.B. Economic growth and the environment. Q. J. Econ. 1995, 110, 353–377. [Google Scholar] [CrossRef]
- Liu, Y.; Suk, S. Coupling and coordinating relationship between tourism economy and ecological environment—A case study of Nagasaki Prefecture, Japan. Int. J. Environ. Res. Public Health 2021, 18, 12818. [Google Scholar] [CrossRef] [PubMed]
- Zhao, Y.; Hou, P.; Jiang, J.; Zhai, J.; Chen, Y.; Wang, Y.; Bai, J.; Zhang, B.; Xu, H. Coordination study on ecological and economic coupling of the yellow river basin. Int. J. Environ. Res. Public Health 2021, 18, 10664. [Google Scholar] [CrossRef] [PubMed]
- Zuo, Z.; Guo, H.; Cheng, J.; Li, Y. How to achieve new progress in ecological civilization construction?–Based on cloud model and coupling coordination degree model. Ecol. Indic. 2021, 127, 107789. [Google Scholar] [CrossRef]
- Zhang, K.; Liu, T.; Feng, R.; Zhang, Z.; Liu, K. Coupling coordination relationship and driving mechanism between urbanization and ecosystem service value in large regions: A case study of urban agglomeration in Yellow river basin, China. Int. J. Environ. Res. Public Health 2021, 18, 7836. [Google Scholar] [CrossRef]
- Liu, K.; Qiao, Y.; Shi, T.; Zhou, Q. Study on coupling coordination and spatiotemporal heterogeneity between economic development and ecological environment of cities along the Yellow River Basin. Environ. Sci. Pollut. Res. 2021, 28, 6898–6912. [Google Scholar] [CrossRef]
- Wang, Y.-T.; Wang, Y.-S.; Wu, M.-L.; Sun, C.-C.; Gu, J.-D. Assessing ecological health of mangrove ecosystems along South China Coast by the pressure–state–response (PSR) model. Ecotoxicology 2021, 30, 622–631. [Google Scholar] [CrossRef]
- Das, S.; Pradhan, B.; Shit, P.K.; Alamri, A.M. Assessment of wetland ecosystem health using the pressure–state–response (PSR) model: A case study of mursidabad district of West Bengal (India). Sustainability 2020, 12, 5932. [Google Scholar] [CrossRef]
- Hu, X.; Xu, H. A new remote sensing index based on the pressure-state-response framework to assess regional ecological change. Environ. Sci. Pollut. Res. 2019, 26, 5381–5393. [Google Scholar] [CrossRef]
- Zhang, X.; Ma, C.; Zhan, S.; Chen, W. Evaluation and simulation for ecological risk based on emergy analysis and Pressure-State-Response Model in a coastal city, China. Procedia Environ. Sci. 2012, 13, 221–231. [Google Scholar] [CrossRef]
- Hu, X.; Ma, C.; Huang, P.; Guo, X. Ecological vulnerability assessment based on AHP-PSR method and analysis of its single parameter sensitivity and spatial autocorrelation for ecological protection–A case of Weifang City, China. Ecol. Indic. 2021, 125, 107464. [Google Scholar] [CrossRef]
- Wang, D.; Li, Y.; Yang, X.; Zhang, Z.; Gao, S.; Zhou, Q.; Zhuo, Y.; Wen, X.; Guo, Z. Evaluating urban ecological civilization and its obstacle factors based on integrated model of PSR-EVW-TOPSIS: A case study of 13 cities in Jiangsu Province, China. Ecol. Indic. 2021, 133, 108431. [Google Scholar] [CrossRef]
- Chen, N.; Li, H.; Wang, L. A GIS-based approach for mapping direct use value of ecosystem services at a county scale: Management implications. Ecol. Econ. 2009, 68, 2768–2776. [Google Scholar] [CrossRef]
- Schägner, J.P.; Brander, L.; Maes, J.; Hartje, V. Mapping ecosystem services’ values: Current practice and future prospects. Ecosyst. Serv. 2013, 4, 33–46. [Google Scholar] [CrossRef]
- Liekens, I.; De Nocker, L.; Broekx, S.; Aertsens, J.; Markandya, A. Ecosystem Services and their monetary value. In Ecosystem Services; Elsevier: Amsterdam, The Netherlands, 2013; pp. 13–28. [Google Scholar] [CrossRef]
- Spangenberg, J.H.; Görg, C.; Truong, D.T.; Tekken, V.; Bustamante, J.V.; Settele, J. Provision of ecosystem services is determined by human agency, not ecosystem functions. Four case studies. Int. J. Biodivers. Sci. Ecosyst. Serv. Manag. 2014, 10, 40–53. [Google Scholar] [CrossRef]
- Song, W.; Deng, X. Land-use/land-cover change and ecosystem service provision in China. Sci. Total Environ. 2017, 576, 705–719. [Google Scholar] [CrossRef]
- Tan, Z.; Guan, Q.; Lin, J.; Yang, L.; Luo, H.; Ma, Y.; Tian, J.; Wang, Q.; Wang, N. The response and simulation of ecosystem services value to land use/land cover in an oasis, Northwest China. Ecol. Indic. 2020, 118, 106711. [Google Scholar] [CrossRef]
- Talukdar, S.; Singha, P.; Mahato, S.; Praveen, B.; Rahman, A. Dynamics of ecosystem services (ESs) in response to land use land cover (LU/LC) changes in the lower Gangetic plain of India. Ecol. Indic. 2020, 112, 106121. [Google Scholar] [CrossRef]
- Ariken, M.; Zhang, F.; Liu, K.; Fang, C.; Kung, H.-T. Coupling coordination analysis of urbanization and eco-environment in Yanqi Basin based on multi-source remote sensing data. Ecol. Indic. 2020, 114, 106331. [Google Scholar] [CrossRef]
- Zhang, J. Multi-source remote sensing data fusion: Status and trends. Int. J. Image Data Fusion 2010, 1, 5–24. [Google Scholar] [CrossRef]
- He, C.; Gao, B.; Huang, Q.; Ma, Q.; Dou, Y. Environmental degradation in the urban areas of China: Evidence from multi-source remote sensing data. Remote Sens. Environ. 2017, 193, 65–75. [Google Scholar] [CrossRef]
- Zhang, J.; Zhang, J.; Du, X.; Kang, H.; Qiao, M. An overview of ecological monitoring based on geographic information system (GIS) and remote sensing (RS) technology in China. In Proceedings of the IOP Conference Series: Earth and Environmental Science, Sanya, China, 20–22 November 2017; p. 012056. [Google Scholar] [CrossRef]
- Reif, M.K.; Theel, H.J. Remote sensing for restoration ecology: Application for restoring degraded, damaged, transformed, or destroyed ecosystems. Integr. Environ. Assess. Manag. 2017, 13, 614–630. [Google Scholar] [CrossRef]
- Zhu, D.; Chen, T.; Wang, Z.; Niu, R. Detecting ecological spatial-temporal changes by remote sensing ecological index with local adaptability. J. Environ. Manag. 2021, 299, 113655. [Google Scholar] [CrossRef] [PubMed]
- Niu, X.; Li, Y. Remote sensing evaluation of ecological environment of Anqing city based on remote sensing ecological index. Int. Arch. Photogramm. Remote Sens. Spat. Inf. Sci. 2020, 43, 733–737. [Google Scholar] [CrossRef]
- Cheng, P.G.; Tong, C.Z.; Chen, X.Y.; Nie, Y.J. Urban ecological environment monitoring and evaluation based on remote sensing ecological index. In Proceedings of the International Conference on Intelligent Earth Observing and Applications, Guilin, China, 23–24 October 2015; pp. 1152–1160. [Google Scholar] [CrossRef]
- Xiong, Y.; Xu, W.; Lu, N.; Huang, S.; Wu, C.; Wang, L.; Dai, F.; Kou, W. Assessment of spatial–temporal changes of ecological environment quality based on RSEI and GEE: A case study in Erhai Lake Basin, Yunnan province, China. Ecol. Indic. 2021, 125, 107518. [Google Scholar] [CrossRef]
- Shammi, S.A.; Meng, Q. Use time series NDVI and EVI to develop dynamic crop growth metrics for yield modeling. Ecol. Indic. 2021, 121, 107124. [Google Scholar] [CrossRef]
- Xie, F.; Fan, H. Deriving drought indices from MODIS vegetation indices (NDVI/EVI) and Land Surface Temperature (LST): Is data reconstruction necessary? Int. J. Appl. Earth Obs. Geoinf. 2021, 101, 102352. [Google Scholar] [CrossRef]
- Zhang, T.; Yang, R.; Yang, Y.; Li, L.; Chen, L. Assessing the Urban Eco-Environmental Quality by the Remote-Sensing Ecological Index: Application to Tianjin, North China. ISPRS Int. J. Geo Inf. 2021, 10, 475. [Google Scholar] [CrossRef]
- Li, J.; Gong, J.; Guldmann, J.-M.; Yang, J. Assessment of urban ecological quality and spatial heterogeneity based on remote sensing: A case study of the rapid urbanization of Wuhan City. Remote Sens. 2021, 13, 4440. [Google Scholar] [CrossRef]
- Rasool, H.; Malik, M.A.; Tarique, M. The curvilinear relationship between environmental pollution and economic growth: Evidence from India. Int. J. Energy Sect. Manag. 2020, 14, 891–910. [Google Scholar] [CrossRef]
- Jin, G.; Shi, X.; He, D.; Guo, B.; Li, Z.; Shi, X. Designing a spatial pattern to rebalance the orientation of development and protection in Wuhan. J. Geogr. Sci. 2020, 30, 569–582. [Google Scholar] [CrossRef]


| Target Layer | Criterion Layer | Index Layer | Symbol |
|---|---|---|---|
| Comprehensive evaluation index X of urban economic development | Economic development level X1 | Per capita GDP (10,000 CNY/person) | X11 |
| Per capita gross industrial product (10,000 CNY/person) | X12 | ||
| Annual disposable income of urban residents (CNY) | X13 | ||
| Economic structure index X2 | Proportion of secondary industry | X21 | |
| Proportion of tertiary industry | X22 | ||
| Growth rate of tertiary industry | X23 | ||
| GDP growth rate | X24 | ||
| Economic efficiency index X3 | Energy consumption per unit of coal/GDP | X31 | |
| Fixed assets investment of the whole society (100 million CNY) | X32 | ||
| Total retail sales of consumer goods (100 million CNY) | X33 | ||
| Comprehensive evaluation index Y of ecological environment | Ecological carbon sequestration index Y1 | Net primary productivity (NPP) (g/m2/year) | Y11 |
| Landover index Y2 | Normalized difference vegetation index (NDVI) | Y21 | |
| Normalized difference building index (NDBI) | Y22 | ||
| Normalized difference water index (NDWI) | Y23 |
| Index Hierarchy | Index | Symbol | Subjective Weight | Objective Weight | Comprehensive Weight |
|---|---|---|---|---|---|
| First-level index | Indicators of economic development level | X1 | 0.21 | 0.38 | 0.30 |
| Economic structure index | X2 | 0.55 | 0.24 | 0.38 | |
| Economic efficiency index | X3 | 0.24 | 0.38 | 0.32 | |
| Ecological carbon sequestration index | Y1 | 0.67 | 0.74 | 0.70 | |
| Land-cover index | Y2 | 0.33 | 0.26 | 0.30 | |
| Basic-level index | Per capita GDP | X11 | 0.25 | 0.23 | 0.24 |
| Per capita gross industrial product | X12 | 0.50 | 0.57 | 0.54 | |
| Per capita disposable income of urban residents | X13 | 0.25 | 0.20 | 0.22 | |
| Proportion of secondary industry | X21 | 0.23 | 0.39 | 0.33 | |
| Proportion of tertiary industry | X22 | 0.23 | 0.45 | 0.35 | |
| Growth rate of tertiary industry | X23 | 0.40 | 0.13 | 0.25 | |
| GDP growth rate | X24 | 0.14 | 0.03 | 0.07 | |
| GDP energy intensity | X31 | 0.54 | 0.59 | 0.58 | |
| Investment in social fixed assets | X32 | 0.30 | 0.14 | 0.21 | |
| Total retail sales of consumer goods | X33 | 0.16 | 0.27 | 0.21 | |
| NPP | Y11 | 1.00 | 1.00 | 1.00 | |
| NDVI | Y21 | 0.55 | 0.77 | 0.67 | |
| NDBI | Y22 | 0.16 | 0.11 | 0.14 | |
| NDWI | Y23 | 0.29 | 0.12 | 0.19 |
| Decoupling Type | ∆X | ∆Y | Decoupling Index |
|---|---|---|---|
| Declining connection | <0 | <0 | (0.8,1.2) |
| Growth connectivity | >0 | >0 | (0.8,1.2) |
| recessive decoupling | <0 | <0 | (1.2,+∞) |
| Strong decoupling | <0 | >0 | (−∞,0) |
| Weak decoupling | >0 | >0 | (0,0.8) |
| Weak negative decoupling | <0 | <0 | (0,0.8) |
| Strong negative decoupling | >0 | <0 | (−∞,0) |
| Negative decoupling of growth | >0 | >0 | (1.2,+∞) |
| Partition | Description | |||
|---|---|---|---|---|
| >0 | >0 | >0 | HH | The ecological level of area i is high, and the ecological level of the surrounding areas is high |
| <0 | <0 | >0 | LL | The ecological level of area i is low, and the ecological level of the surrounding areas is low |
| <0 | >0 | <0 | LH | The ecological level of area i is low, while that of the surrounding areas is high |
| >0 | <0 | <0 | HL | The ecological level of area i is high, and the ecological level of the surrounding areas is low |
| Year | 2015 | 2016 | 2017 | 2018 | 2019 | 2020 |
|---|---|---|---|---|---|---|
| Wuchang | −1.28 | −0.43 | −0.04 | −0.27 | −0.03 | −0.45 |
| Jianghan | −3.3 | −1.71 | −1.33 | −1.39 | −0.95 | −2.14 |
| Jiang’an | −2.62 | 0.02 | −0.1 | −0.34 | −0.1 | −0.42 |
| Hongshan | 0.16 | 0.32 | −0.23 | 0.1 | 0.11 | 0.17 |
| Qiaokou | −14.29 | −2.68 | −1.66 | −2.33 | −1.14 | −2.4 |
| Qingshan | 0.46 | 0.17 | 0.14 | 0.65 | 0.23 | 0.63 |
| Hannan | −0.04 | 0.02 | −0.02 | −0.01 | −0.01 | −0.08 |
| Dongxihu | −0.63 | −0.05 | −1.43 | −0.21 | 0.01 | −0.14 |
| Huangpi | −0.95 | −0.23 | −0.64 | −0.29 | −0.02 | −0.04 |
| Xinzhou | 46.1 | 3.34 | −3.93 | −1.28 | −0.19 | −0.1 |
| Jiangxia | −0.06 | −0.21 | −0.14 | −0.17 | −0.15 | −0.09 |
| Hanyang | −0.16 | 0.53 | −0.2 | 4.36 | −0.13 | 4.07 |
| Caidian | −0.08 | −1.42 | 0.16 | −1.05 | 0.42 | 0.14 |
| Particular Year | Moran’s I Test | ||
|---|---|---|---|
| I | z-Value | p-Value | |
| 2020 | 0.353632 | 3.896291 | 0.000098 |
| 2019 | 0.342439 | 3.794738 | 0.000148 |
| 2018 | 0.385259 | 4.182494 | 0.000029 |
| 2017 | 0.384535 | 4.179121 | 0.000029 |
| 2016 | 0.393197 | 4.254598 | 0.000021 |
| 2015 | 0.436339 | 4.643034 | 0.000003 |
| 2014 | 0.443326 | 4.705794 | 0.000003 |
Publisher’s Note: MDPI stays neutral with regard to jurisdictional claims in published maps and institutional affiliations. |
© 2022 by the authors. Licensee MDPI, Basel, Switzerland. This article is an open access article distributed under the terms and conditions of the Creative Commons Attribution (CC BY) license (https://creativecommons.org/licenses/by/4.0/).
Share and Cite
Geng, L.; Zhao, X.; An, Y.; Peng, L.; Ye, D. Study on the Spatial Interaction between Urban Economic and Ecological Environment—A Case Study of Wuhan City. Int. J. Environ. Res. Public Health 2022, 19, 10022. https://doi.org/10.3390/ijerph191610022
Geng L, Zhao X, An Y, Peng L, Ye D. Study on the Spatial Interaction between Urban Economic and Ecological Environment—A Case Study of Wuhan City. International Journal of Environmental Research and Public Health. 2022; 19(16):10022. https://doi.org/10.3390/ijerph191610022
Chicago/Turabian StyleGeng, Liang, Xinyue Zhao, Yu An, Lingtong Peng, and Dan Ye. 2022. "Study on the Spatial Interaction between Urban Economic and Ecological Environment—A Case Study of Wuhan City" International Journal of Environmental Research and Public Health 19, no. 16: 10022. https://doi.org/10.3390/ijerph191610022
APA StyleGeng, L., Zhao, X., An, Y., Peng, L., & Ye, D. (2022). Study on the Spatial Interaction between Urban Economic and Ecological Environment—A Case Study of Wuhan City. International Journal of Environmental Research and Public Health, 19(16), 10022. https://doi.org/10.3390/ijerph191610022