
Evaluating the Sensitivity of Heat Wave Definitions among North Carolina Physiographic Regions
 ,
,  , ,
, ,
Abstract
:1. Introduction
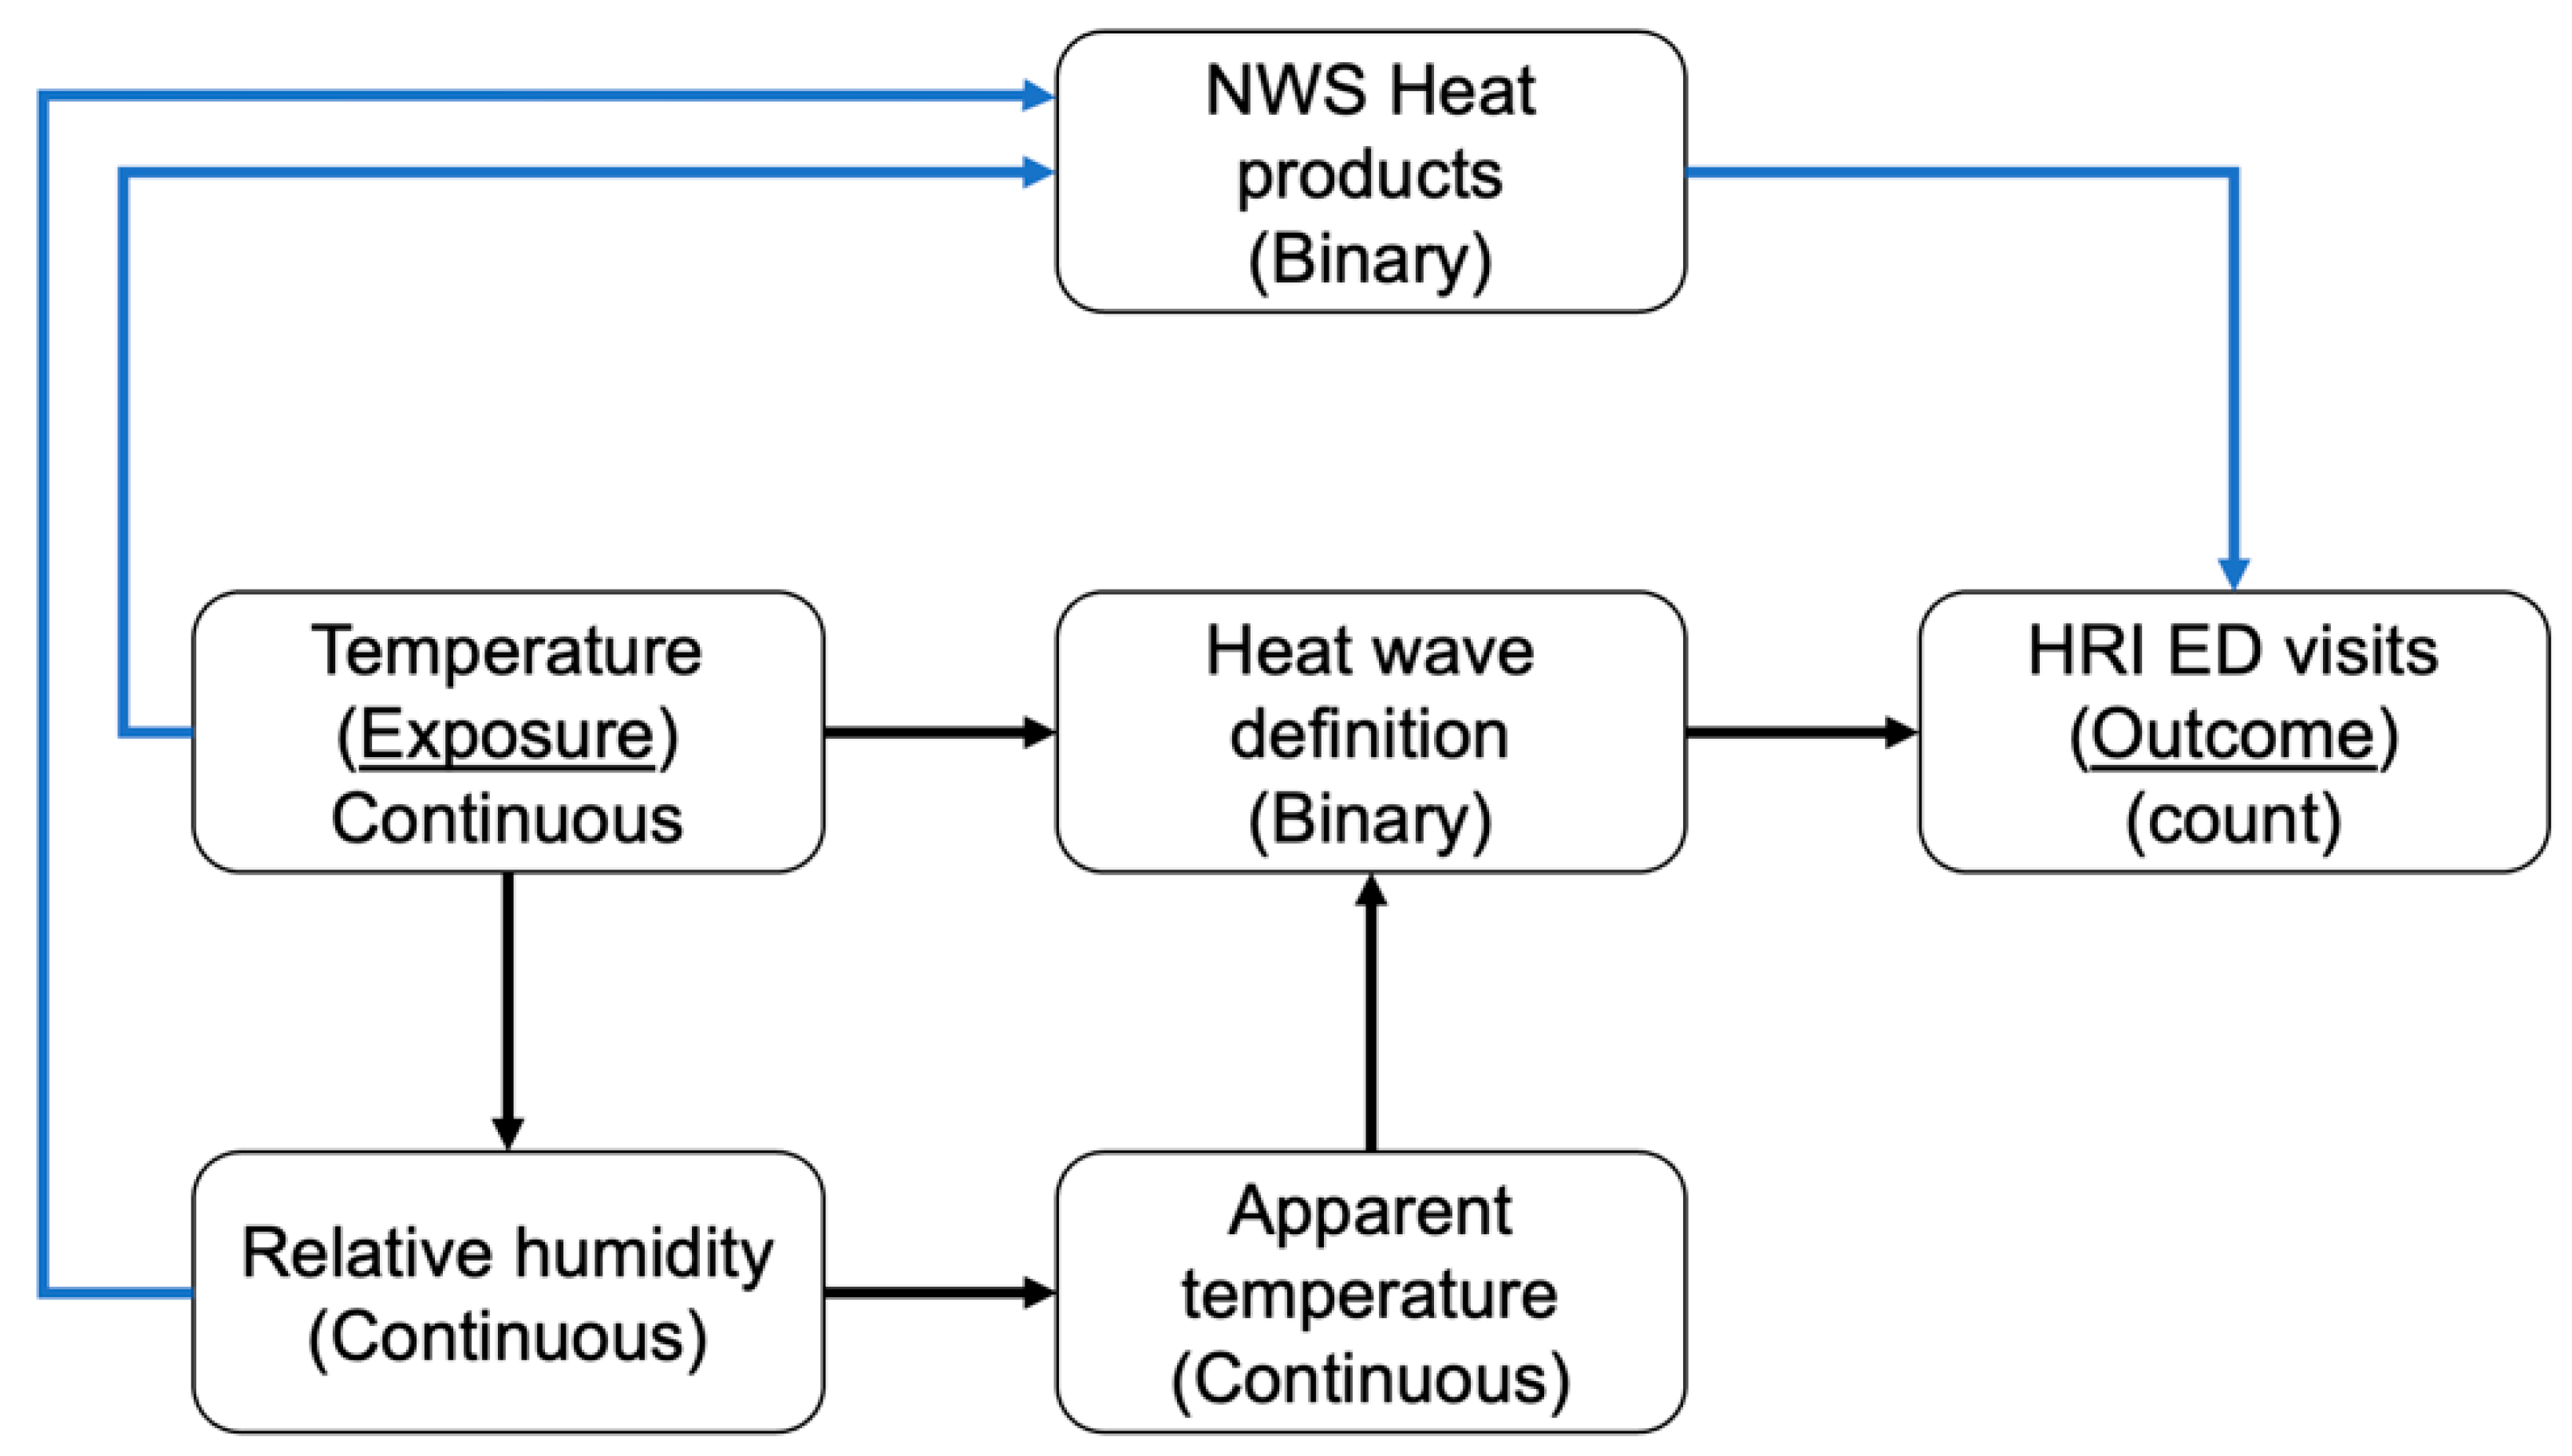
2. Materials and Methods
2.1. Data
2.1.1. Heat Metrics
2.1.2. Heat Wave Definitions
2.1.3. National Weather Service—Heat Products
2.1.4. Heat-Related Illness
2.2. Statistical Analysis
3. Results
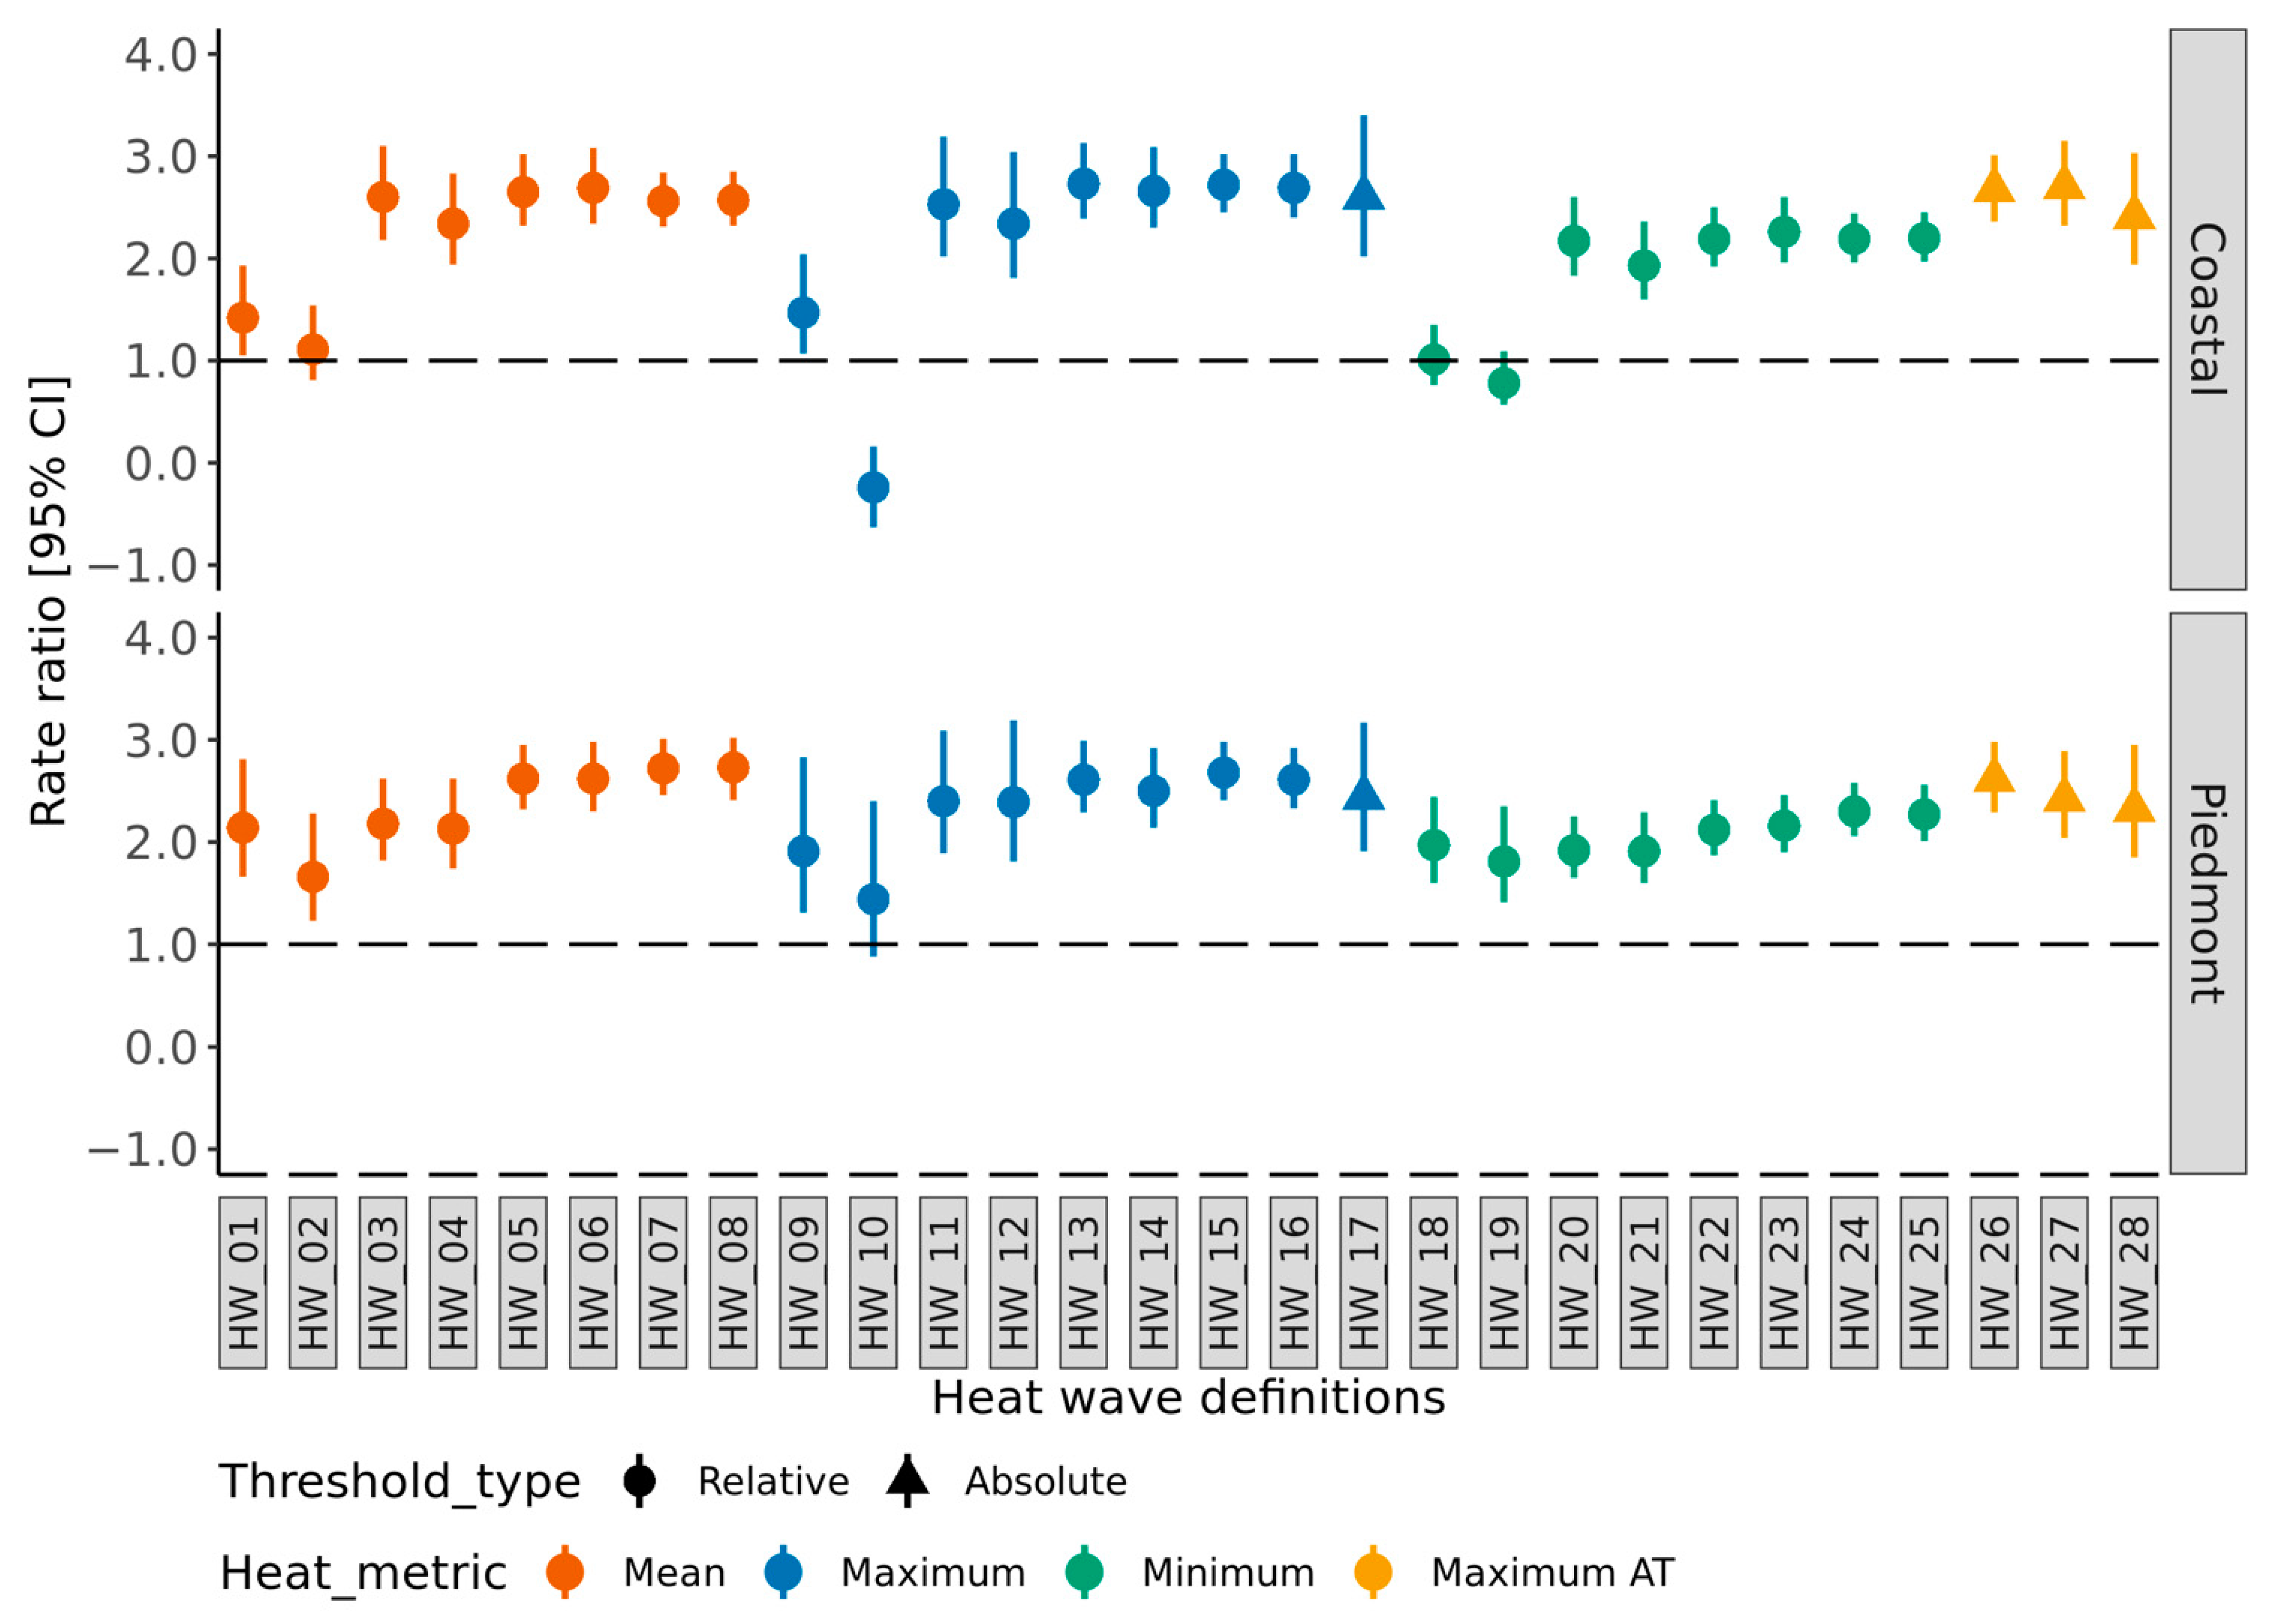
3.1. Heat Wave Definition—Sensitivity
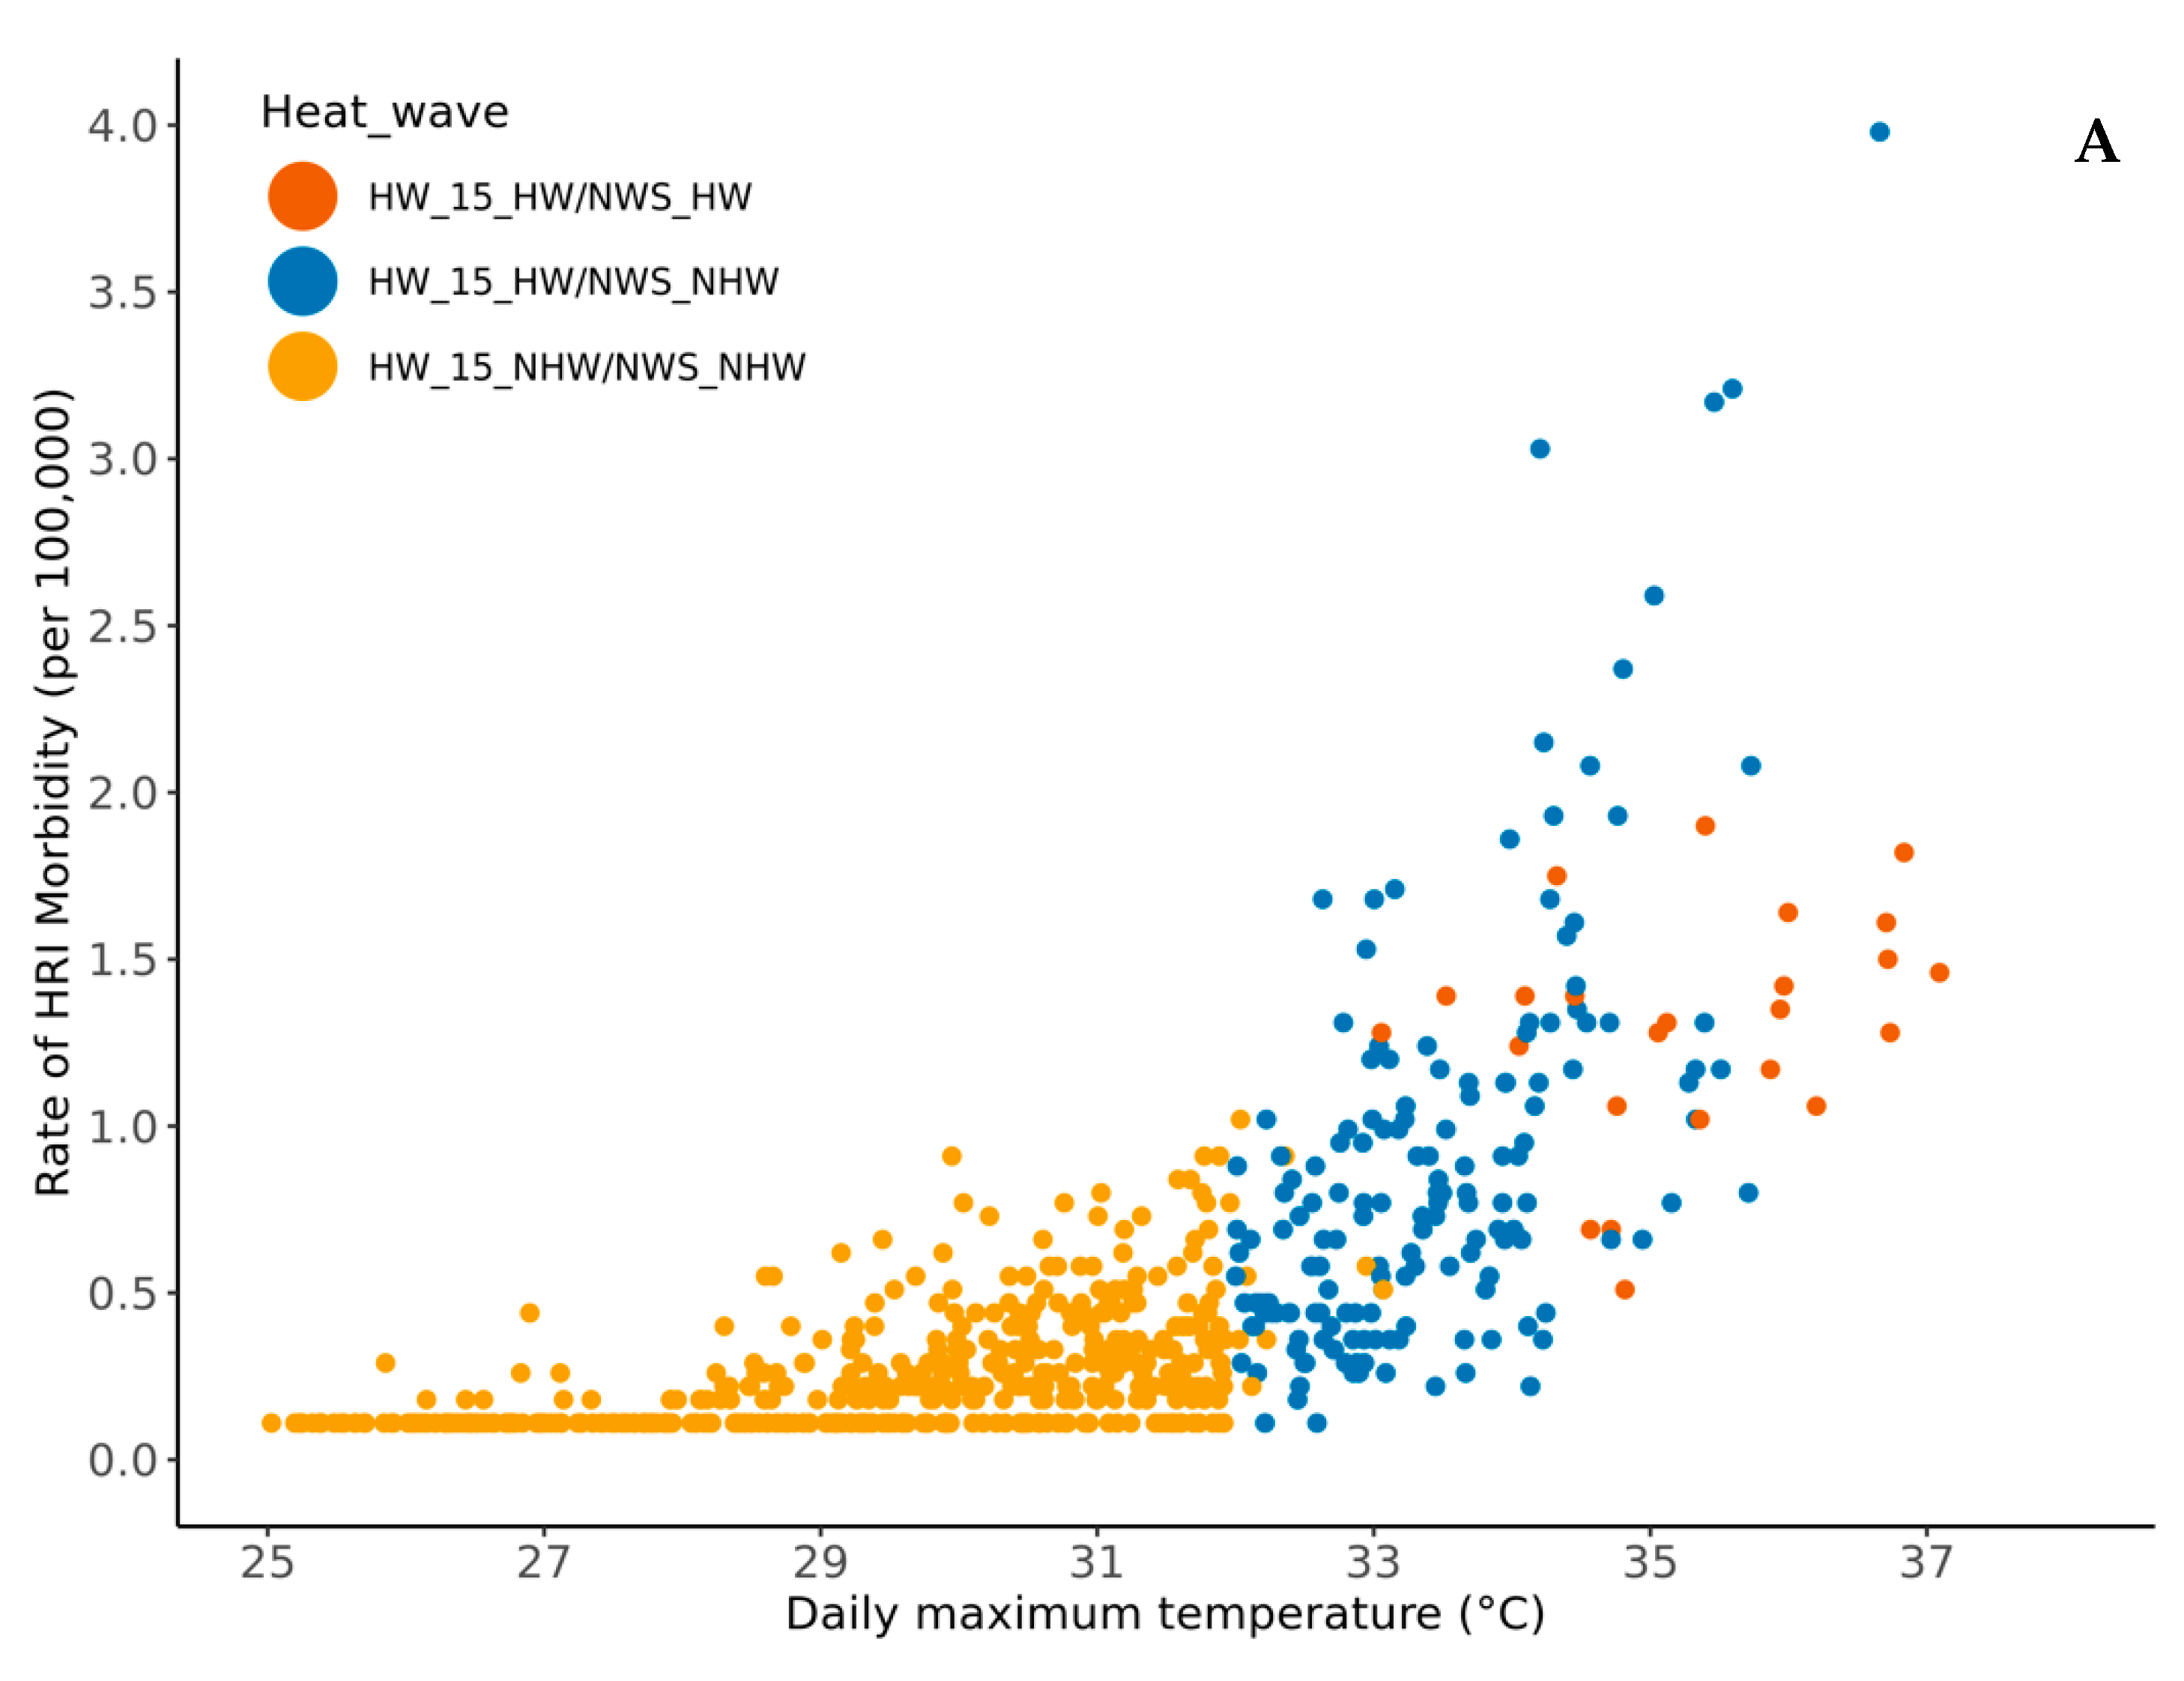
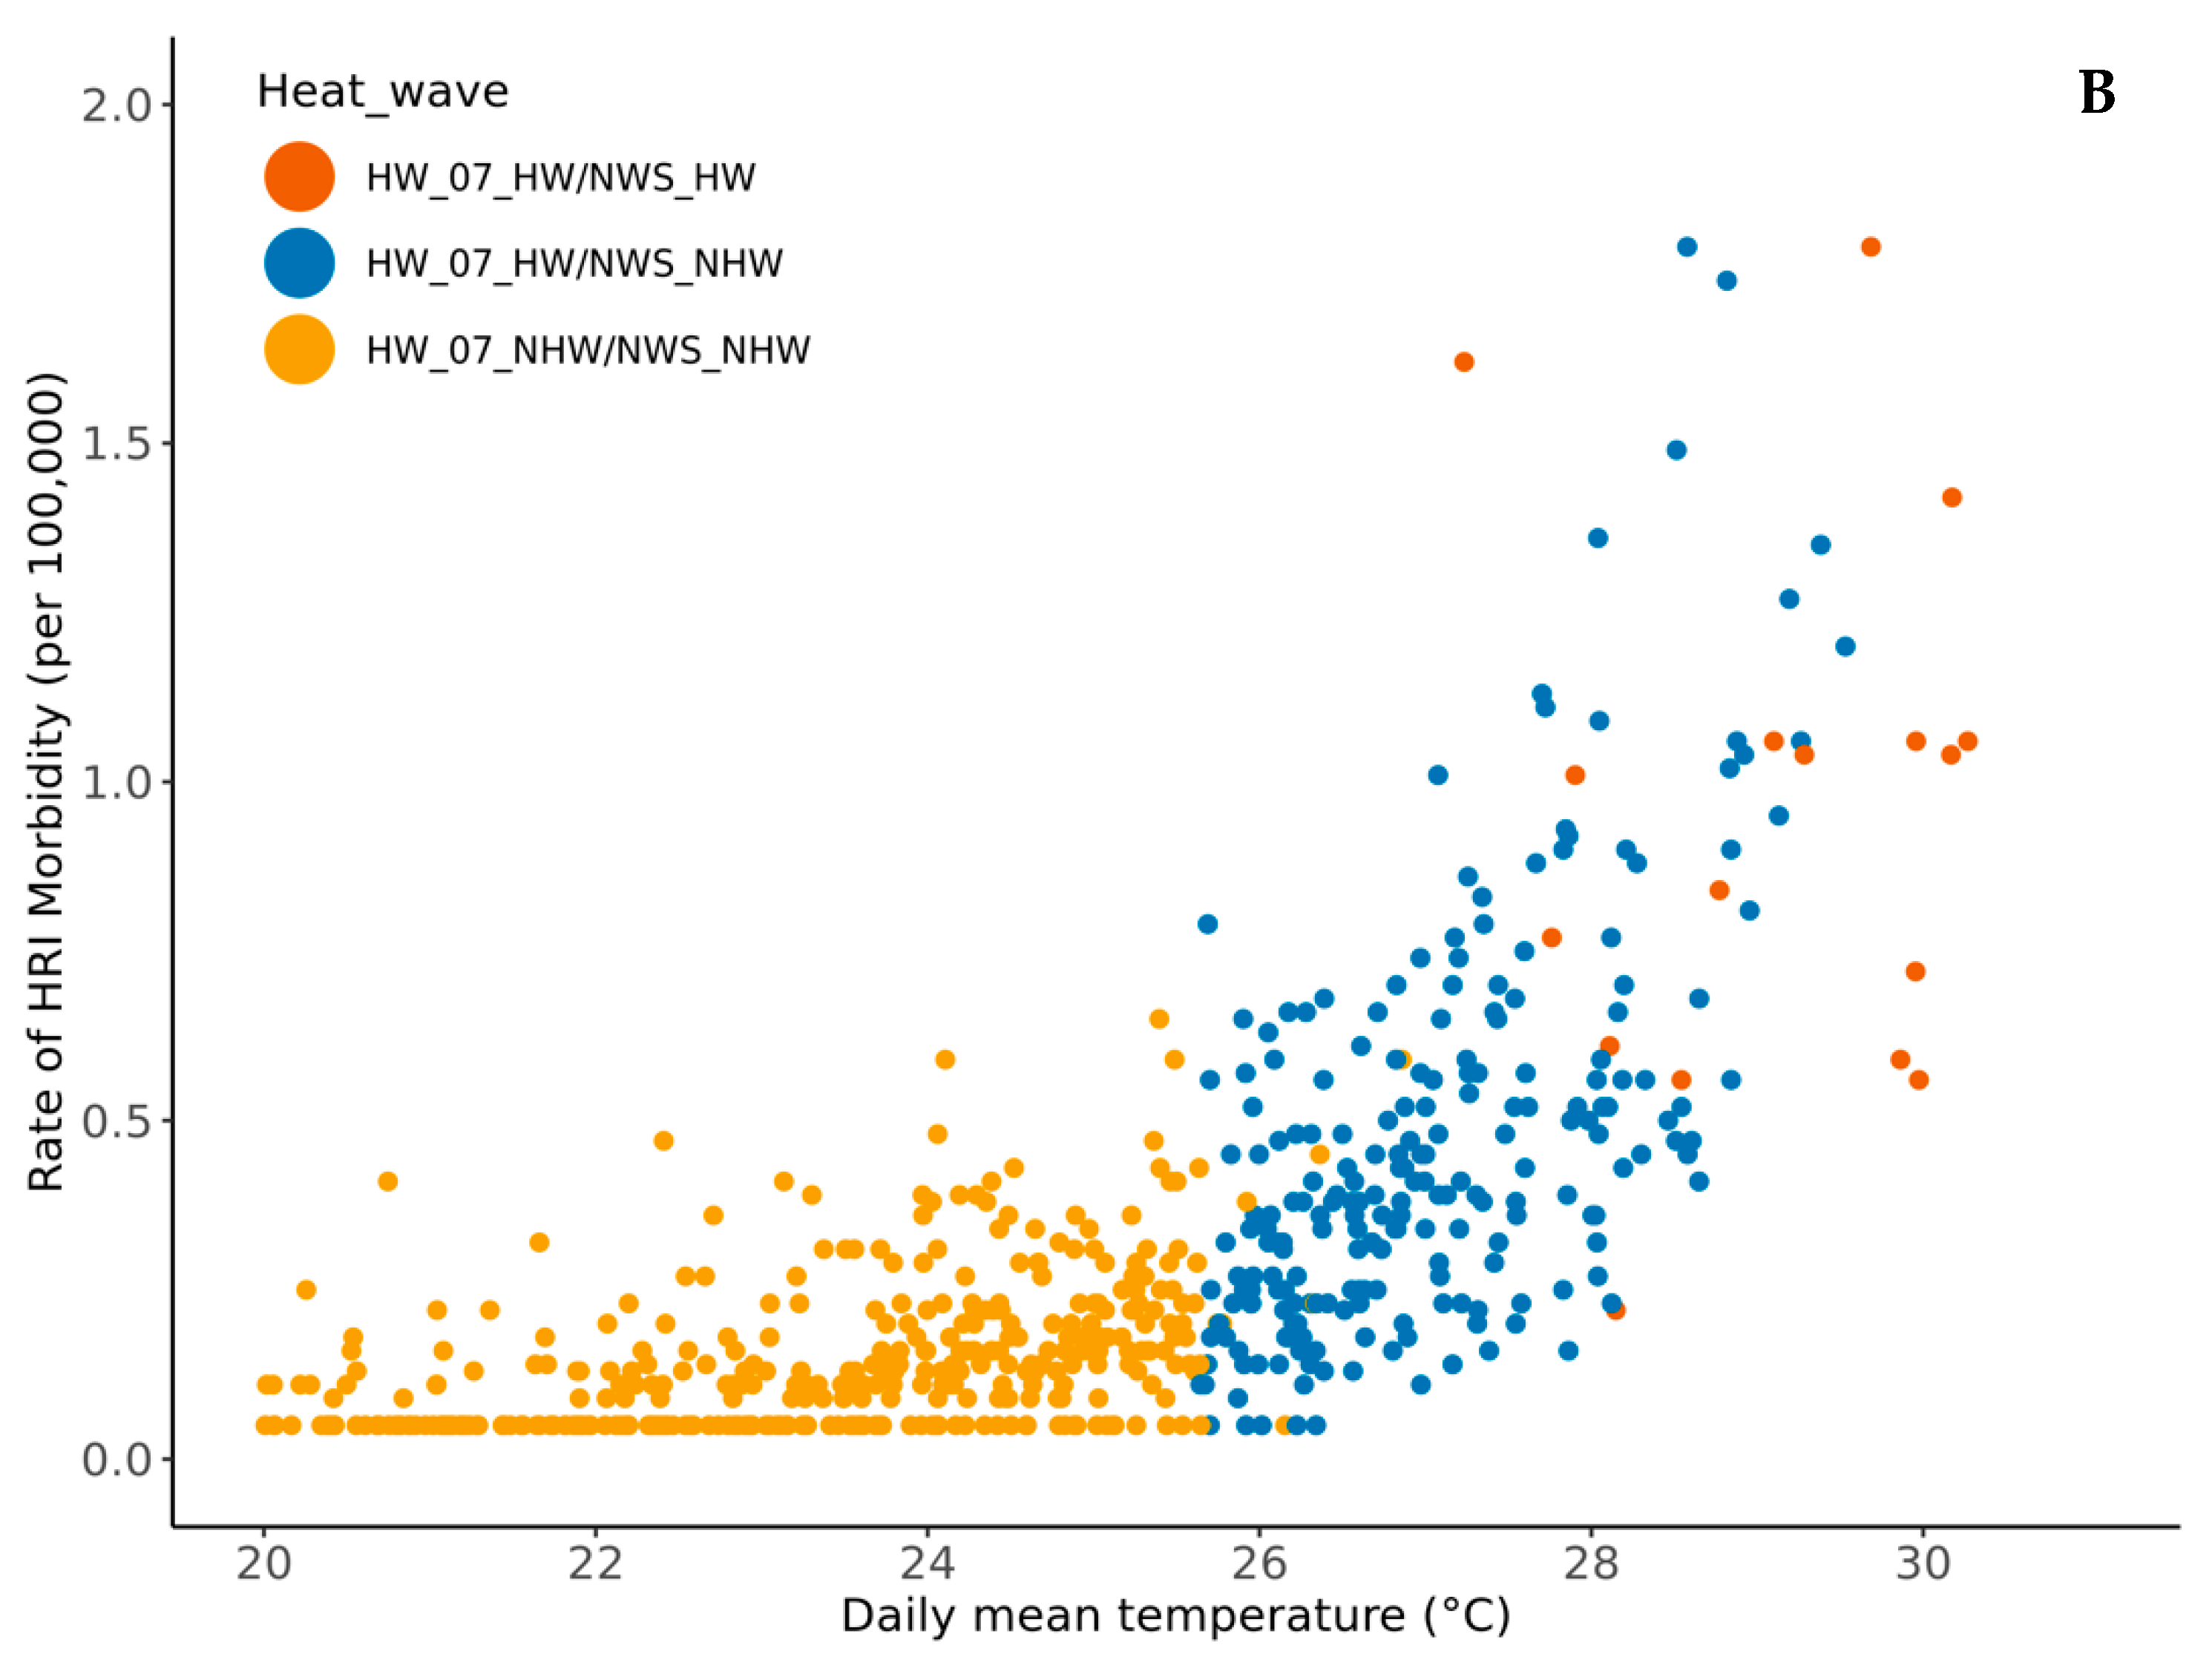
3.2. Comparing Epidemiologic-Based Heat Wave Definition and NWS Heat Products
4. Discussion
5. Conclusions
Supplementary Materials
Author Contributions
Funding
Institutional Review Board Statement
Informed Consent Statement
Data Availability Statement
Acknowledgments
Conflicts of Interest
References
- Mazdiyasni, O.; AghaKouchak, A. Substantial increase in concurrent droughts and heatwaves in the United States. Proc. Natl. Acad. Sci. USA 2015, 112, 11484–11489. [Google Scholar] [CrossRef]
- USGCRP. The Impacts of Climate Change on Human Health in the United States: A Scientific Assessment; Crimmins, A., Balbus, J., Gamble, J.L., Beard, C.B., Bell, J.E., Dodgen, D., Eisen, R.J., Fann, N., Hawkins, M.D., Herring, S.C., et al., Eds.; U.S Global Change Research Program: Washington, DC, USA, 2016.
- Hajat, S.; Sheridan, S.C.; Allen, M.J.; Pascal, M.; Laaidi, K.; Yagouti, A.; Bickis, U.; Tobias, A.; Bourque, D.; Armstrong, B.G.; et al. Heat-health warning systems: A comparison of the predictive capacity of different approaches to identifying dangerously hot days. Am. J. Public Health 2010, 100, 1137–1144. [Google Scholar] [CrossRef] [PubMed]
- Knowlton, K.; Rotkin-Ellman, M.; King, G.; Margolis, H.G.; Smith, D.; Solomon, G.; Trent, R.; English, P. The 2006 California heat wave: Impacts on hospitalizations and emergency department visits. Environ. Health Perspect. 2009, 117, 61–67. [Google Scholar] [CrossRef] [PubMed]
- Vaidyanathan, A.; Malilay, J.; Schramm, P.; Saha, S. Heat-Related Deaths—United States, 2004–2018. MMWR Morb. Mortal. Wkly. Rep. 2020, 69, 729–734. [Google Scholar] [CrossRef]
- IPCC. (Intergovernmental Panel on Climate Change) 2021: The Physical Science Basis. Contribution of Working Group I to the Sixth Assessment Report of the Intergovernmental Panel on Climate Change; Masson-Delmotte, V., Zhai, P., Pirani, A., Connors, S.L., Péan, C., Berger, S., Caud, N., Chen, Y., Goldfarb, L., Gomis, M.I., et al., Eds.; Cambridge University Press: Cambridge, UK; New York, NY, USA, 2021. [Google Scholar]
- Rennie, J.; Bell, J.E.; Kunkel, K.E.; Herring, S.; Cullen, H.; Abadi, A.M. Development of a Sub-monthly Temperature Product to Monitor Near-Real-Time Climate Conditions and Assess Long-Term Heat Events in the United States. J. Appl. Meteorol. Clim. 2019, 58, 2653–2674. [Google Scholar] [CrossRef]
- Ebi, K.L.; Teisberg, T.J.; Kalkstein, L.S.; Robinson, L.; Weiher, R.F. Heat Watch/Warning Systems Save Lives: Estimated Costs and Benefits for Philadelphia 1995–98. Bull. Am. Meteorol. Soc. 2004, 85, 1067–1074. [Google Scholar] [CrossRef]
- Kalkstein, S.L.; Jamason, F.P.; Greene, S.J. Philadelphia Hot Weather Health Watch Warning System. 1995. Available online: https://www1.udel.edu/SynClim/phl.html (accessed on 28 March 2022).
- Weinberger, K.R.; Zanobetti, A.; Schwartz, J.; Wellenius, G.A. Effectiveness of National Weather Service heat alerts in preventing mortality in 20 US cities. Environ. Int. 2018, 116, 30–38. [Google Scholar] [CrossRef]
- CDC (Center for Disease Control and Prevention). National Environmental Public Health Tracking Network. Available online: https://ephtracking.cdc.gov (accessed on 5 March 2020).
- NCDHHS (North Carolina Department of Health and Human Services) Heat Data and Prevention. Available online: https://publichealth.nc.gov/chronicdiseaseandinjury/heat.htm (accessed on 11 September 2020).
- Wellenius, G.A.; Eliot, M.N.; Bush, K.F.; Holt, D.; Lincoln, R.A.; Smith, A.E.; Gold, J. Heat-related morbidity and mortality in New England: Evidence for local policy. Environ. Res. 2017, 156, 845–853. [Google Scholar] [CrossRef]
- Anderson, G.B.; Bell, M.L. Heat waves in the United States: Mortality risk during heat waves and effect modification by heat wave characteristics in 43 U.S. communities. Environ. Health Perspect. 2011, 119, 210–218. [Google Scholar] [CrossRef]
- Vaidyanathan, A.; Kegler, S.R.; Saha, S.S.; Mulholland, J.A. A Statistical Framework to Evaluate Extreme Weather Definitions from A Health Perspective: A Demonstration Based on Extreme Heat Events. Bull. Am. Meteorol. Soc. 2016, 97, 1817–1830. [Google Scholar] [CrossRef]
- Vaidyanathan, A.; Saha, S.; Vicedo-Cabrera, A.M.; Gasparrini, A.; Abdurehman, N.; Jordan, R.; Hawkins, M.; Hess, J.; Elixhauser, A. Assessment of extreme heat and hospitalizations to inform early warning systems. Proc. Natl. Acad. Sci. USA 2019, 116, 5420–5427. [Google Scholar] [CrossRef] [PubMed]
- Xu, Z.; FitzGerald, G.; Guo, Y.; Jalaludin, B.; Tong, S. Impact of heatwave on mortality under different heatwave definitions: A systematic review and meta-analysis. Environ. Int. 2016, 89–90, 193–203. [Google Scholar] [CrossRef] [PubMed]
- Song, X.; Wang, S.; Hu, Y.; Yue, M.; Zhang, T.; Liu, Y.; Tian, J.; Shang, K. Impact of ambient temperature on morbidity and mortality: An overview of reviews. Sci. Total Environ. 2017, 586, 241–254. [Google Scholar] [CrossRef] [PubMed]
- Reid, C.E.; O’Neill, M.S.; Gronlund, C.J.; Brines, S.J.; Brown, D.G.; Diez-Roux, A.V.; Schwartz, J. Mapping community determinants of heat vulnerability. Environ. Health Perspect. 2009, 117, 1730–1736. [Google Scholar] [CrossRef] [PubMed]
- Fechter-Leggett, E.D.; Vaidyanathan, A.; Choudhary, E. Heat Stress Illness Emergency Department Visits in National Environmental Public Health Tracking States, 2005–2010. J. Community Health 2016, 41, 57–69. [Google Scholar] [CrossRef] [PubMed]
- McElroy, S.; Schwarz, L.; Green, H.; Corcos, I.; Guirguis, K.; Gershunov, A.; Benmarhnia, T. Defining heat waves and extreme heat events using sub-regional meteorological data to maximize benefits of early warning systems to population health. Sci. Total Environ. 2020, 721, 137678. [Google Scholar] [CrossRef] [PubMed]
- NCEI (National Centers for Environmental Information). Global Historical Climatology Network Daily (GHCNd). Available online: https://www.ncei.noaa.gov/products/land-based-station/global-historical-climatology-network-daily (accessed on 12 April 2019).
- PRISM (Parameter-Elevation Regression on Independent Slopes Model). Available online: https://prism.oregonstate.edu/explorer/ (accessed on 3 September 2019).
- Anderson, B.; Peng, R.; Ferreri, J. Weathermetrics: Functions to Convert Between Weather Metrics, 1.2.2; CRAN: 2016. Available online: https://cran.r-project.org/web/packages/weathermetrics/index.html (accessed on 4 November 2019).
- Smith, T.T.; Zaitchik, B.F.; Gohlke, J.M. Heat waves in the United States: Definitions, patterns and trends. Clim. Chang. 2013, 118, 811–825. [Google Scholar] [CrossRef]
- Kent, S.T.; McClure, L.A.; Zaitchik, B.F.; Smith, T.T.; Gohlke, J.M. Heat waves and health outcomes in Alabama (USA): The importance of heat wave definition. Environ. Health Perspect. 2014, 122, 151–158. [Google Scholar] [CrossRef]
- IEM (Iowa Environmental Mesonet). Archived NWS Watch, Warnings, Advisories. Available online: https://mesonet.agron.iastate.edu/vtec/search.php (accessed on 13 October 2020).
- NWS-WFO (National Weather Services—Weather Forecast Offices). Available online: https://www.weather.gov/srh/nwsoffices (accessed on 28 March 2022).
- Hawkins, M.D.; Brown, V.; Ferrell, J. Assessment of NOAA National Weather Service Methods to Warn for Extreme Heat Events. Weather Clim. Soc. 2017, 9, 5–13. [Google Scholar] [CrossRef]
- NC-DPS (North Carolina Department of Public Safety). Extreme Heat. Available online: https://www.readync.gov/stay-informed/north-carolina-hazards/extreme-heat (accessed on 5 October 2021).
- NC-DETECT (North Carolina Disease Event Tracking and Epidemiologic Collection Tool). Available online: https://ncdetect.org (accessed on 26 February 2019).
- Harduar Morano, L.; Waller, A.E. Evaluation of the Components of the North Carolina Syndromic Surveillance System Heat Syndrome Case Definition. Public Health Rep. 2017, 132 (Suppl. S1), 40S–47S. [Google Scholar] [CrossRef]
- Hibble, M.J. Poisson Regression. In Modeling Count Data; Cambridge University Press: New York, NY, USA, 2014; pp. 35–73. [Google Scholar]
- Peng, D.R.; Dominici, F. Statistical models. In Statistical Methods for Environmental Epidemiology with R: A Case Study in Air Pollution and Health; Gentleman, R., Hornik, K., Parmigiani, G., Eds.; Springer: New York, NY, USA, 2008; pp. 69–95. [Google Scholar]
- Kamo, K.I.; Yanagihara, H.; Satoh, K. Bias-corrected AIC for selecting variables in poisson regression models. Commun. Stat. Theory Methods 2013, 42, 1911–1921. [Google Scholar] [CrossRef]
- Dunn, K.P.; Smyth, K.G. Generalized Linear Models with Examples in R; Springer: New York, NY, USA, 2018. [Google Scholar]
- USCB (United States Census Bureau). Available online: https://data.census.gov/cedsci/ (accessed on 13 April 2019).
- Walker, G. Common Statistical Methods for Clinical Research with SAS Examples, 3rd ed.; Shostak, J., Ed.; SAS Institute: Cary, NC, USA, 2010. [Google Scholar]
- Ripley, B.; Venables, B.; Bates, D.M.; Hornik, K.; Gebhardt, A.; Firth, D.; Ripley, M.B. Package ‘mass’. Cran. R 2013, 538, 113–120. [Google Scholar]
- Abasilim, C.; Friedman, L.S. Comparison of health outcomes from heat-related injuries by National Weather Service reported heat wave days and non-heat wave days—Illinois, 2013–2019. Int. J. Biometeorol. 2022, 66, 641–645. [Google Scholar] [CrossRef] [PubMed]
- Danzl, D.F. Heat-Related Illnesses. In Harrison’s Principles of Internal Medicine, 20th ed.; Jameson, J.L., Fauci, A.S., Kasper, D.L., Hauser, S.L., Longo, D.L., Loscalzo, J., Eds.; McGraw-Hill Education: New York, NY, USA, 2018. [Google Scholar]
- Sorensen, C.J.; Cook-Shimanek, M.; Newman, L.S. Climate Change and Worker Health: Implications for Clinical Practice. In CURRENT Diagnosis & Treatment: Occupational & Environmental Medicine, 6th ed.; LaDou, J., Harrison, R.J., Eds.; McGraw Hill: New York, NY, USA, 2021. [Google Scholar]
- Jung, J.; Uejio, C.K.; Kintziger, K.W.; Duclos, C.; Reid, K.; Jordan, M.; Spector, J.T. Heat illness data strengthens vulnerability maps. BMC Public Health 2021, 21, 1999. [Google Scholar] [CrossRef] [PubMed]
- Jalalzadeh Fard, B.; Mahmood, R.; Hayes, M.; Rowe, C.; Abadi, A.M.; Shulski, M.; Medcalf, S.; Lookadoo, R.; Bell, J.E. Mapping Heat Vulnerability Index Based on Different Urbanization Levels in Nebraska, USA. Geohealth 2021, 5, e2021GH000478. [Google Scholar] [CrossRef]
- Niu, Y.; Li, Z.; Gao, Y.; Liu, X.; Xu, L.; Vardoulakis, S.; Yue, Y.; Wang, J.; Liu, Q. A Systematic Review of the Development and Validation of the Heat Vulnerability Index: Major Factors, Methods, and Spatial Units. Curr. Clim. Chang. Rep. 2021, 7, 87–97. [Google Scholar] [CrossRef]
- Gronlund, C.J. Racial and socioeconomic disparities in heat-related health effects and their mechanisms: A review. Curr. Epidemiol. Rep. 2014, 1, 165–173. [Google Scholar] [CrossRef]
- Guirguis, K.; Basu, R.; Al-Delaimy, W.K.; Benmarhnia, T.; Clemesha, R.E.S.; Corcos, I.; Guzman-Morales, J.; Hailey, B.; Small, I.; Tardy, A.; et al. Heat, Disparities, and Health Outcomes in San Diego County’s Diverse Climate Zones. Geohealth 2018, 2, 212–223. [Google Scholar] [CrossRef]
- Toloo, G.S.; Fitzgerald, G.; Aitken, P.; Verrall, K.; Tong, S. Are heat warning systems effective? Environ. Health 2013, 12, 27. [Google Scholar] [CrossRef]
- Kalkstein, A.J.; Sheridan, S.C. The social impacts of the heat-health watch/warning system in Phoenix, Arizona: Assessing the perceived risk and response of the public. Int. J. Biometeorol. 2007, 52, 43–55. [Google Scholar] [CrossRef]
- Beckmann, S.K.; Hiete, M. Predictors Associated with Health-Related Heat Risk Perception of Urban Citizens in Germany. Int. J. Environ. Res. Public Health 2020, 17, 874. [Google Scholar] [CrossRef] [PubMed]


| Definition | Heat Metric | Duration (No. of Days) | Threshold Type | Threshold Intensity | Coastal | Piedmont | ||||
|---|---|---|---|---|---|---|---|---|---|---|
| Threshold (°C) | HW Days | AIC | Threshold (°C) | HW Days | AIC | |||||
| HW_01 | Mean temperature | 2 + consecutive | Relative | >99th percentile | 29.16 | 33 | 4475.7 | 28.40 | 29 | 4817.9 |
| HW_02 | 3 + consecutive | Relative | >99th percentile | 25 | 4480.7 | 21 | 4843.0 | |||
| HW_03 | 2 + consecutive | Relative | >98th percentile | 28.57 | 58 | 4362.9 | 27.66 | 61 | 4778.4 | |
| HW_04 | 3 + consecutive | Relative | >98th percentile | 46 | 4396.7 | 49 | 4796.9 | |||
| HW_05 | 2 + consecutive | Relative | >95th percentile | 27.65 | 105 | 4287.3 | 26.70 | 136 | 4629.7 | |
| HW_06 | 3 + consecutive | Relative | >95th percentile | 97 | 4293.5 | 118 | 4656.9 | |||
| HW_07 | 2 + consecutive | Relative | >90th percentile | 26.65 | 217 | 4216.2 | 25.63 | 241 | 4547.9 | |
| HW_08 | 3 + consecutive | Relative | >90th percentile | 195 | 4211.8 | 227 | 4551.8 | |||
| HW_09 | Maximum temperature | 2 + consecutive | Relative | >99th percentile | 35.04 | 22 | 4475.4 | 35.52 | 20 | 4842.6 |
| HW_10 | 3 + consecutive | Relative | >99th percentile | 16 | 4479.7 | 14 | 4852.4 | |||
| HW_11 | 2 + consecutive | Relative | >98th percentile | 34.31 | 38 | 4413.7 | 34.69 | 38 | 4799.8 | |
| HW_12 | 3 + consecutive | Relative | >98th percentile | 30 | 4435.3 | 32 | 4813.2 | |||
| HW_13 | 2 + consecutive | Relative | >95th percentile | 33.13 | 98 | 4283.5 | 33.30 | 109 | 4665.9 | |
| HW_14 | 3 + consecutive | Relative | >95th percentile | 80 | 4318.0 | 85 | 4716.0 | |||
| HW_15 | 2 + consecutive | Relative | >90th percentile | 31.97 | 190 | 4192.6 | 31.94 | 194 | 4583.4 | |
| HW_16 | 3 + consecutive | Relative | >90th percentile | 168 | 4234.4 | 180 | 4615.9 | |||
| HW_17 | 1-day | Absolute | >35 °C | 35.00 | 26 | 4423.1 | 35.00 | 34 | 4801 | |
| HW_18 | Minimum temperature | 2 + consecutive | Relative | >99th percentile | 23.86 | 29 | 4488.1 | 21.86 | 45 | 4810.3 |
| HW_19 | 3 + consecutive | Relative | >99th percentile | 25 | 4479.1 | 31 | 4831.9 | |||
| HW_20 | 2 + consecutive | Relative | >98th percentile | 23.36 | 56 | 4401.1 | 21.40 | 83 | 4783.6 | |
| HW_21 | 3 + consecutive | Relative | >98th percentile | 46 | 4433.5 | 65 | 4799.5 | |||
| HW_22 | 2 + consecutive | Relative | >95th percentile | 22.57 | 108 | 4352.0 | 20.63 | 156 | 4722.0 | |
| HW_23 | 3 + consecutive | Relative | >95th percentile | 94 | 4353.0 | 136 | 4722.6 | |||
| HW_24 | 2 + consecutive | Relative | >90th percentile | 21.64 | 223 | 4305.5 | 19.72 | 265 | 4670.3 | |
| HW_25 | 3 + consecutive | Relative | >90th percentile | 199 | 4303.0 | 235 | 4693.7 | |||
| HW_26 | Maximum apparent temperature | 1-day | Absolute | >95th percentile | 37.21 | 36 | 4254.0 | 35.26 | 27 | 4659.0 |
| HW_27 | 1-day | Absolute | >90th percentile | 36.20 | 71 | 4319.9 | 35.92 | 58 | 4749.8 | |
| HW_28 | 1-day | Absolute | >85th | 35.47 | 106 | 4415.7 | 36.95 | 98 | 4799.1 | |
| Month | |||||||||||
|---|---|---|---|---|---|---|---|---|---|---|---|
| May | June | July | August | September | |||||||
| a | b | a | b | a | b | a | b | a | b | ||
| 2011 | HW | 3 | 1 | 21 | 14 | 22 | 25 | 10 | 15 | 0 | 0 |
| ED | 65 | 37 | 309 | 334 | 225 | 417 | 195 | 302 | 0 | 0 | |
| 2012 | HW | 0 | 0 | 5 | 6 | 23 | 27 | 0 | 8 | 2 | 6 |
| ED | 0 | 0 | 45 | 95 | 306 | 520 | 0 | 112 | 35 | 52 | |
| 2014 | HW | 0 | 0 | 6 | 7 | 7 | 11 | 0 | 5 | 5 | 6 |
| ED | 0 | 0 | 101 | 141 | 103 | 149 | 0 | 55 | 68 | 92 | |
| 2015 | HW | 0 | 0 | 15 | 16 | 14 | 19 | 5 | 9 | 2 | 3 |
| ED | 0 | 0 | 817 | 897 | 306 | 569 | 117 | 177 | 25 | 54 | |
| 2016 | HW | 0 | 0 | 5 | 8 | 24 | 26 | 19 | 24 | 2 | 5 |
| ED | 0 | 0 | 80 | 204 | 721 | 950 | 366 | 499 | 30 | 106 | |
Publisher’s Note: MDPI stays neutral with regard to jurisdictional claims in published maps and institutional affiliations. |
© 2022 by the authors. Licensee MDPI, Basel, Switzerland. This article is an open access article distributed under the terms and conditions of the Creative Commons Attribution (CC BY) license (https://creativecommons.org/licenses/by/4.0/).
Share and Cite
Puvvula, J.; Abadi, A.M.; Conlon, K.C.; Rennie, J.J.; Jones, H.; Bell, J.E. Evaluating the Sensitivity of Heat Wave Definitions among North Carolina Physiographic Regions. Int. J. Environ. Res. Public Health 2022, 19, 10108. https://doi.org/10.3390/ijerph191610108
Puvvula J, Abadi AM, Conlon KC, Rennie JJ, Jones H, Bell JE. Evaluating the Sensitivity of Heat Wave Definitions among North Carolina Physiographic Regions. International Journal of Environmental Research and Public Health. 2022; 19(16):10108. https://doi.org/10.3390/ijerph191610108
Chicago/Turabian StylePuvvula, Jagadeesh, Azar M. Abadi, Kathryn C. Conlon, Jared J. Rennie, Hunter Jones, and Jesse E. Bell. 2022. "Evaluating the Sensitivity of Heat Wave Definitions among North Carolina Physiographic Regions" International Journal of Environmental Research and Public Health 19, no. 16: 10108. https://doi.org/10.3390/ijerph191610108