
Temperature and Migration Intention: Evidence from the Unified National Graduate Entrance Examination in China


Abstract
:1. Introduction
2. Empirical Background
2.1. The Unified National Graduate Entrance Examination
2.2. First-Class Universities and Disciplines of the World
3. Data
3.1. Data on Applicant for the UNGEE
3.2. Weather Data
3.3. Summary Statistics
4. Empirical Strategy
5. Results
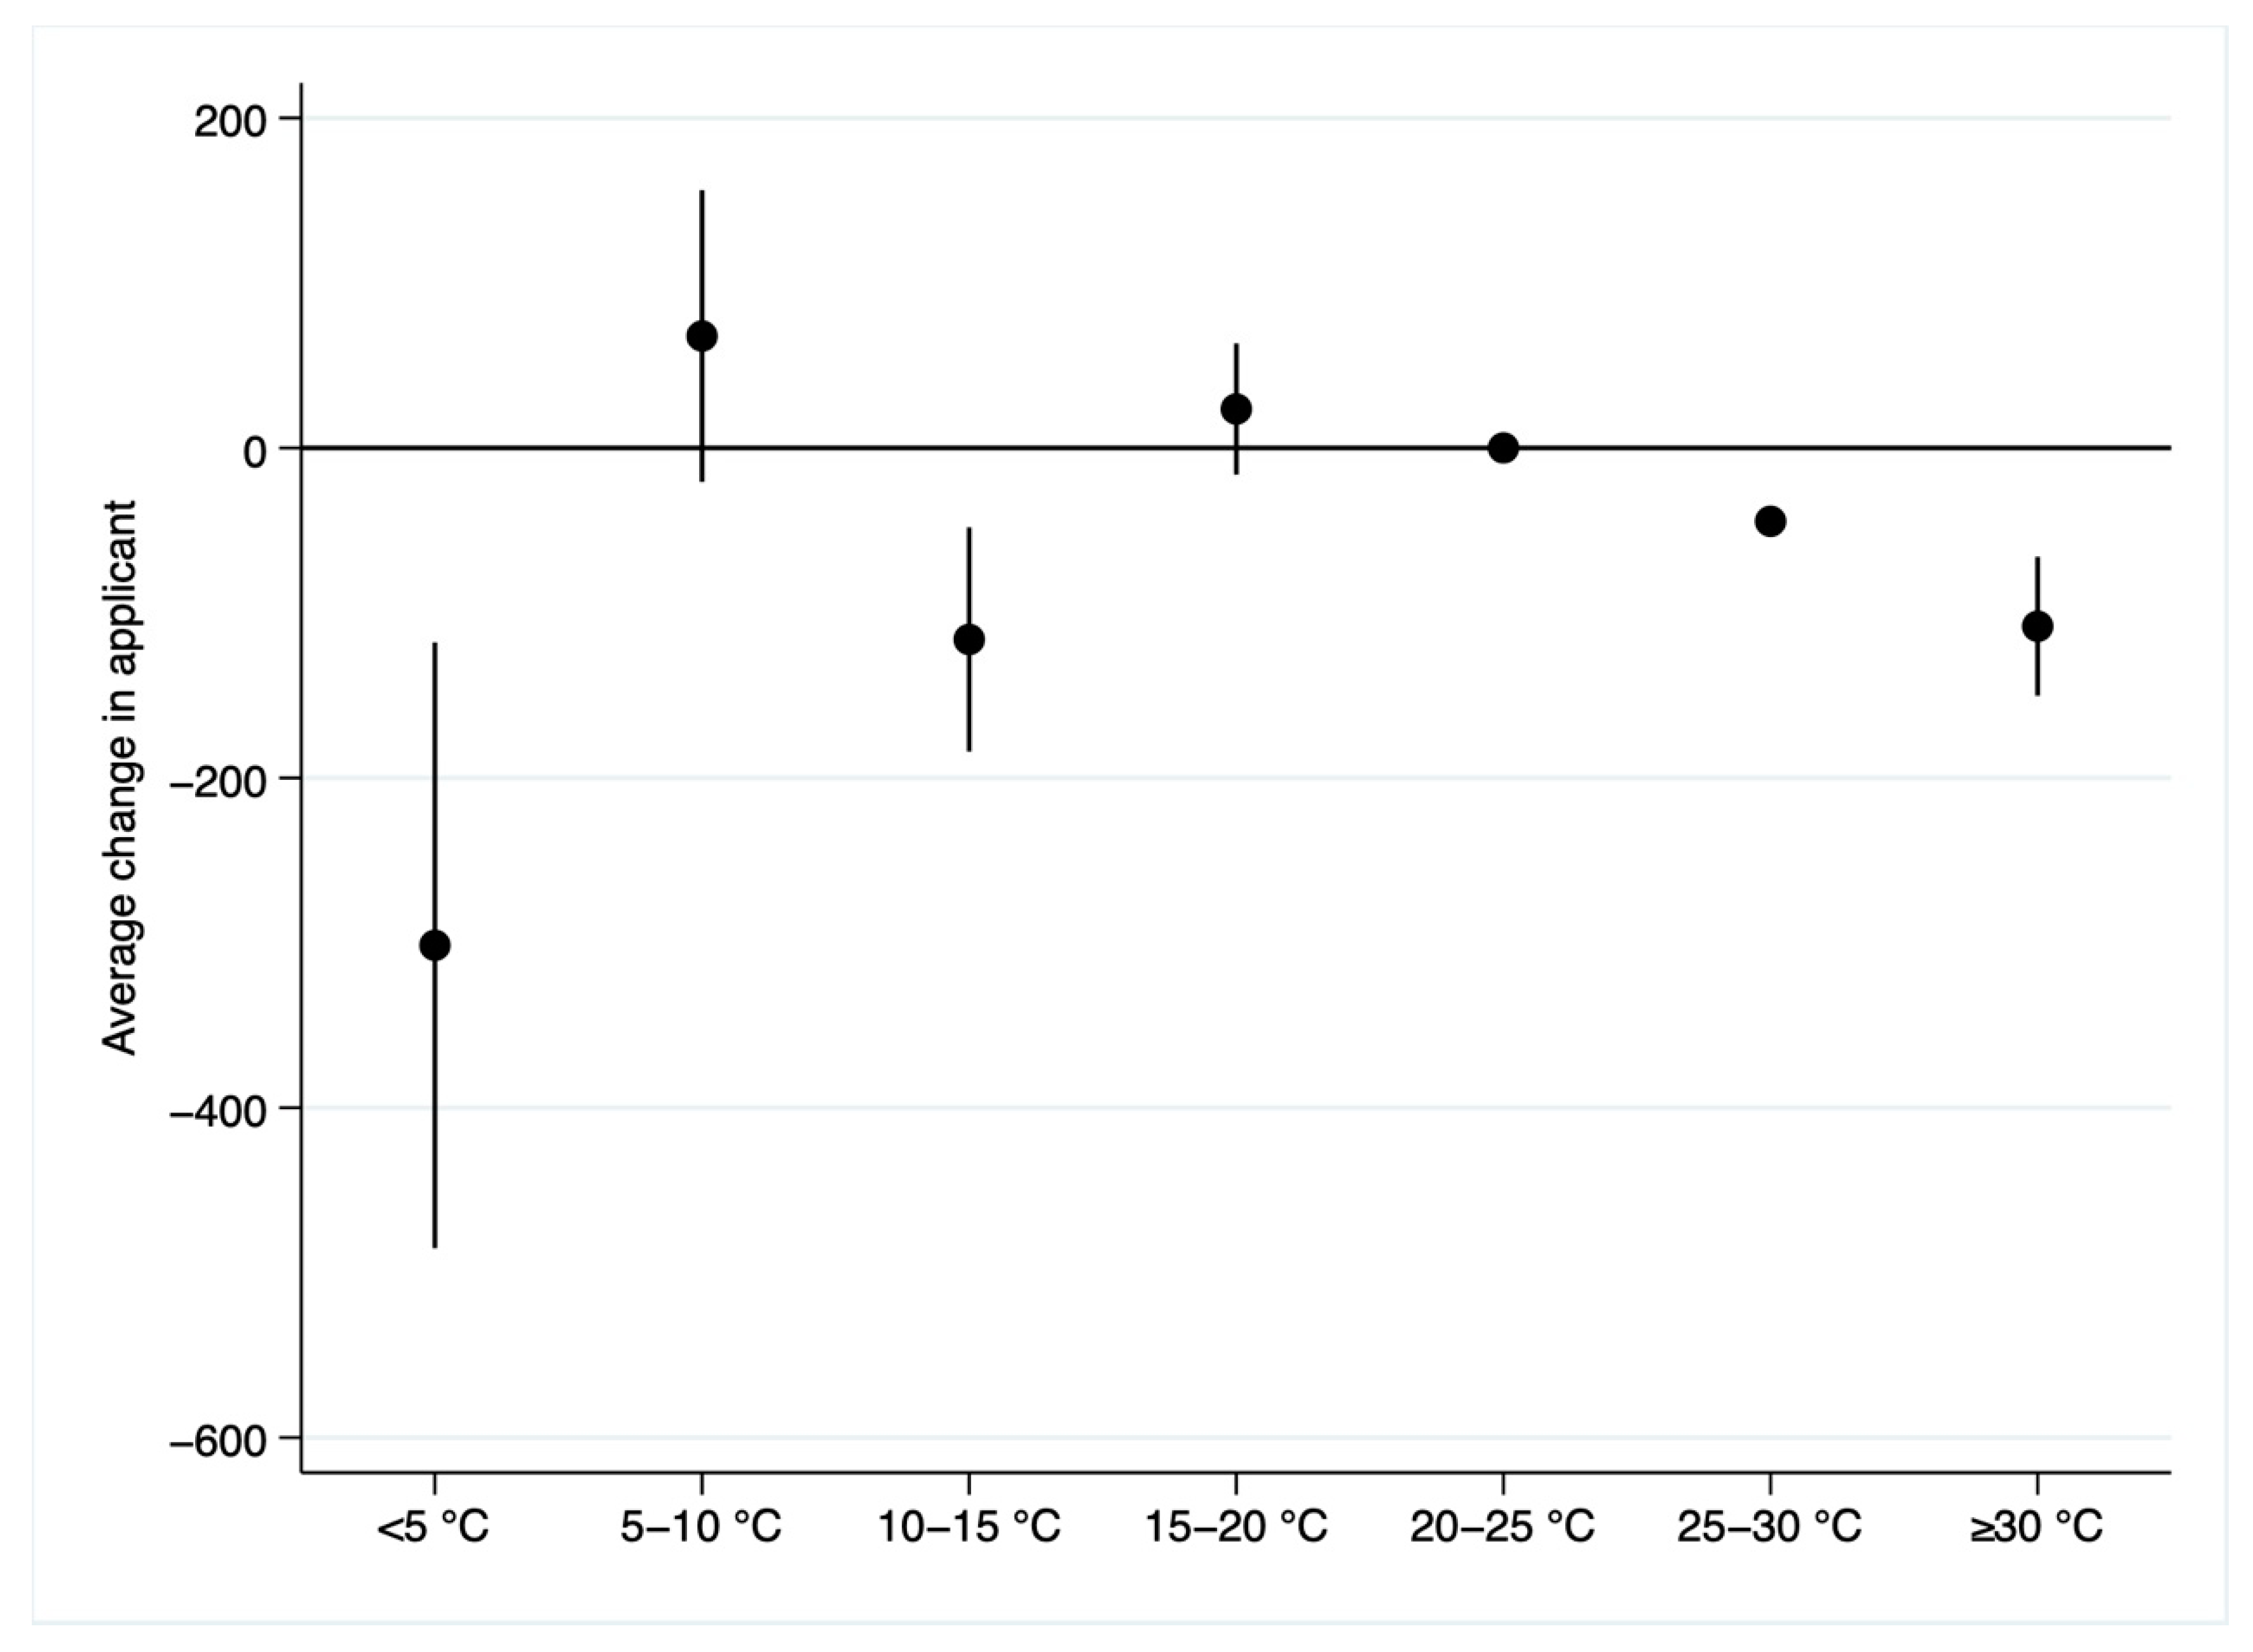
5.1. Main Results
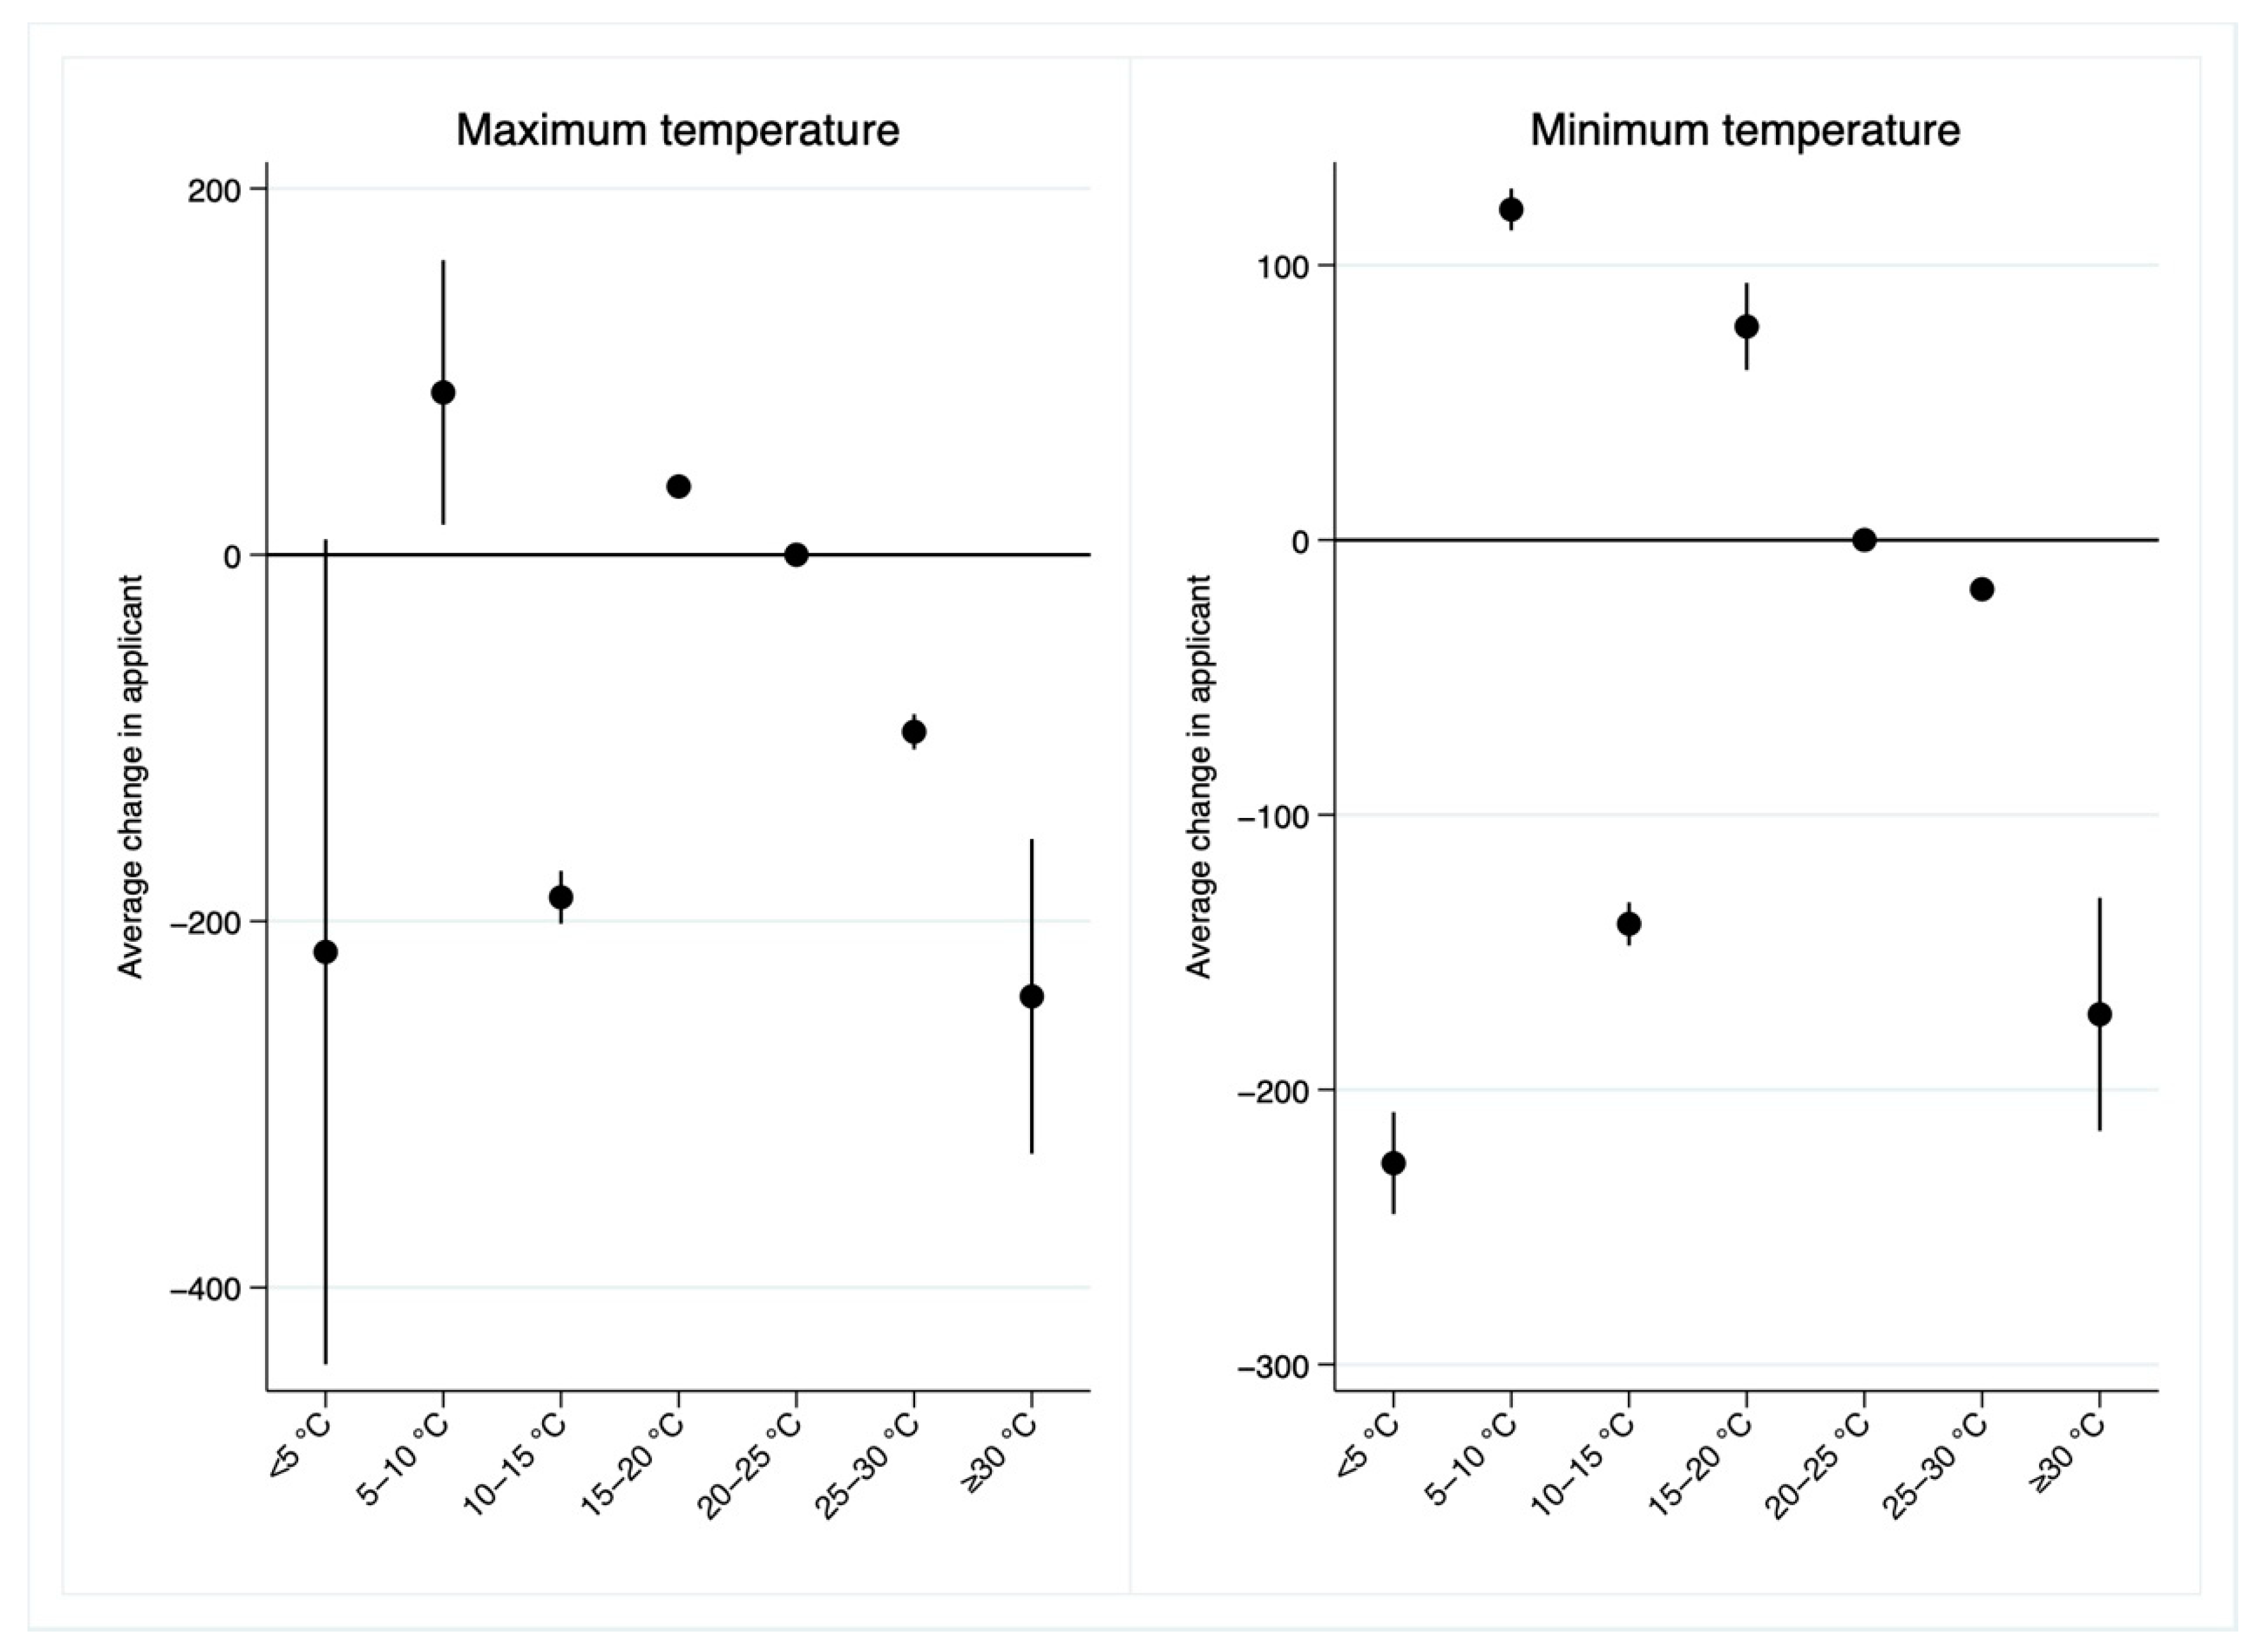
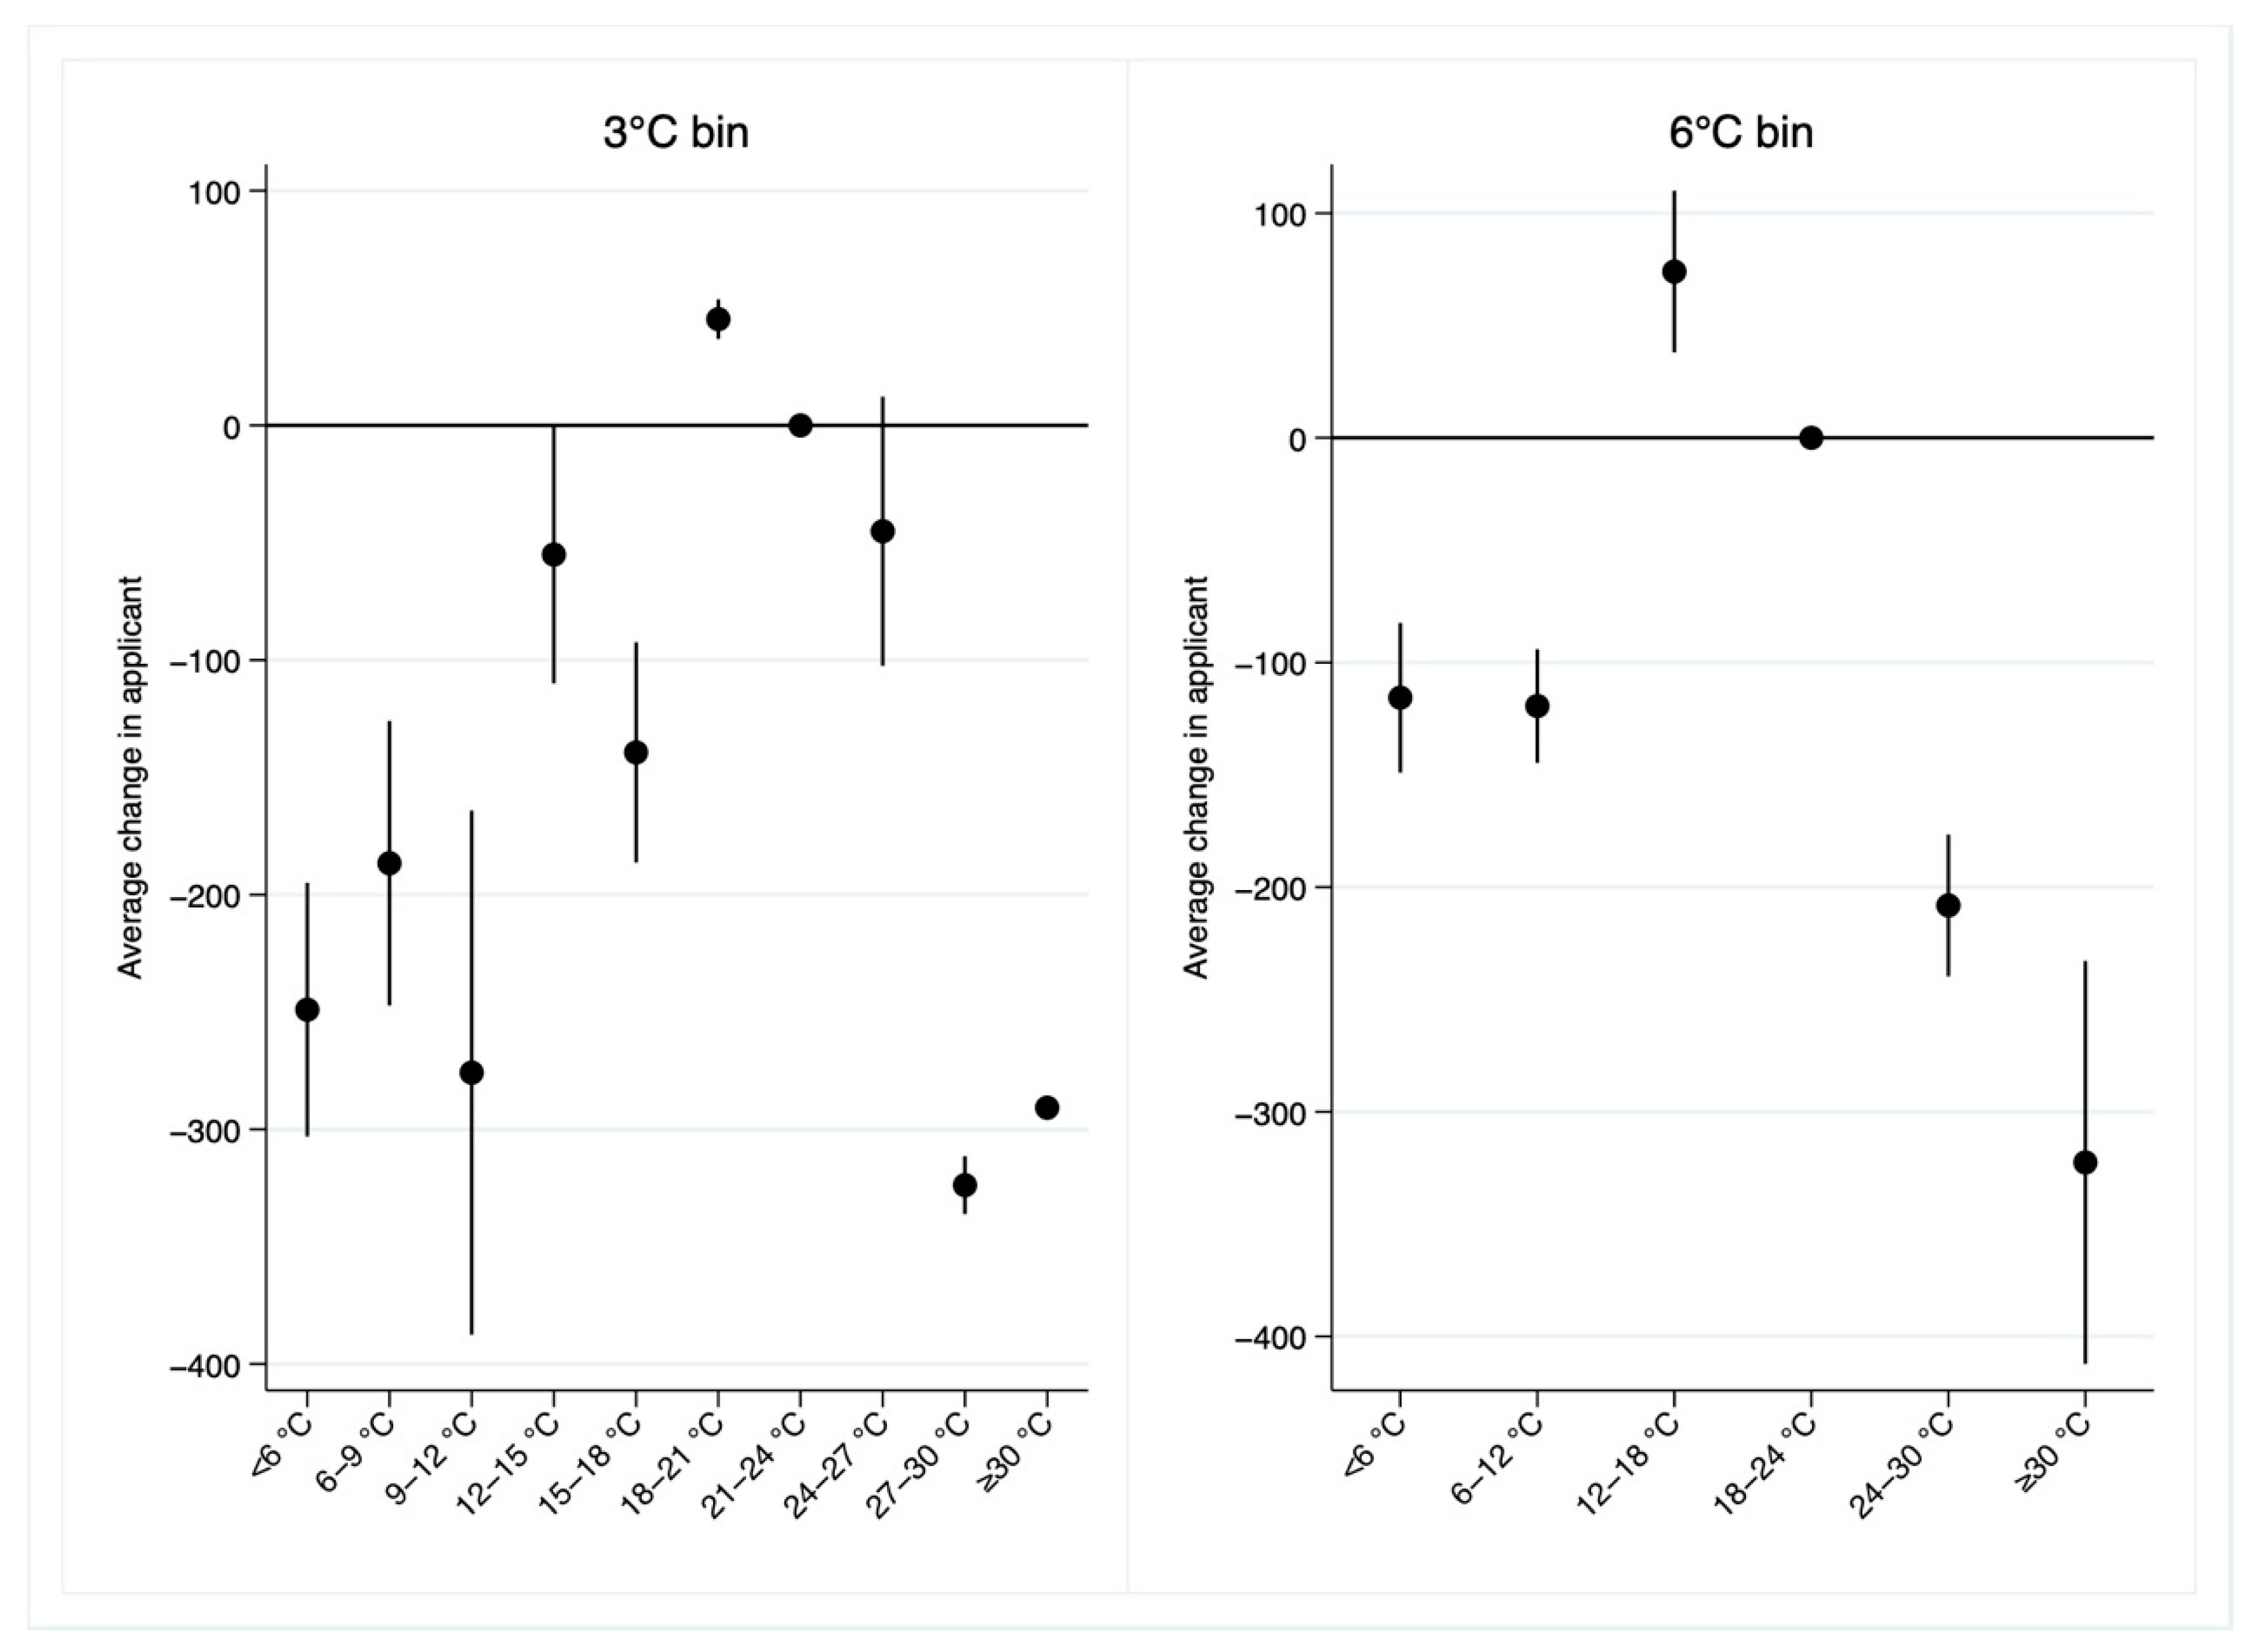
5.2. Robustness Checks
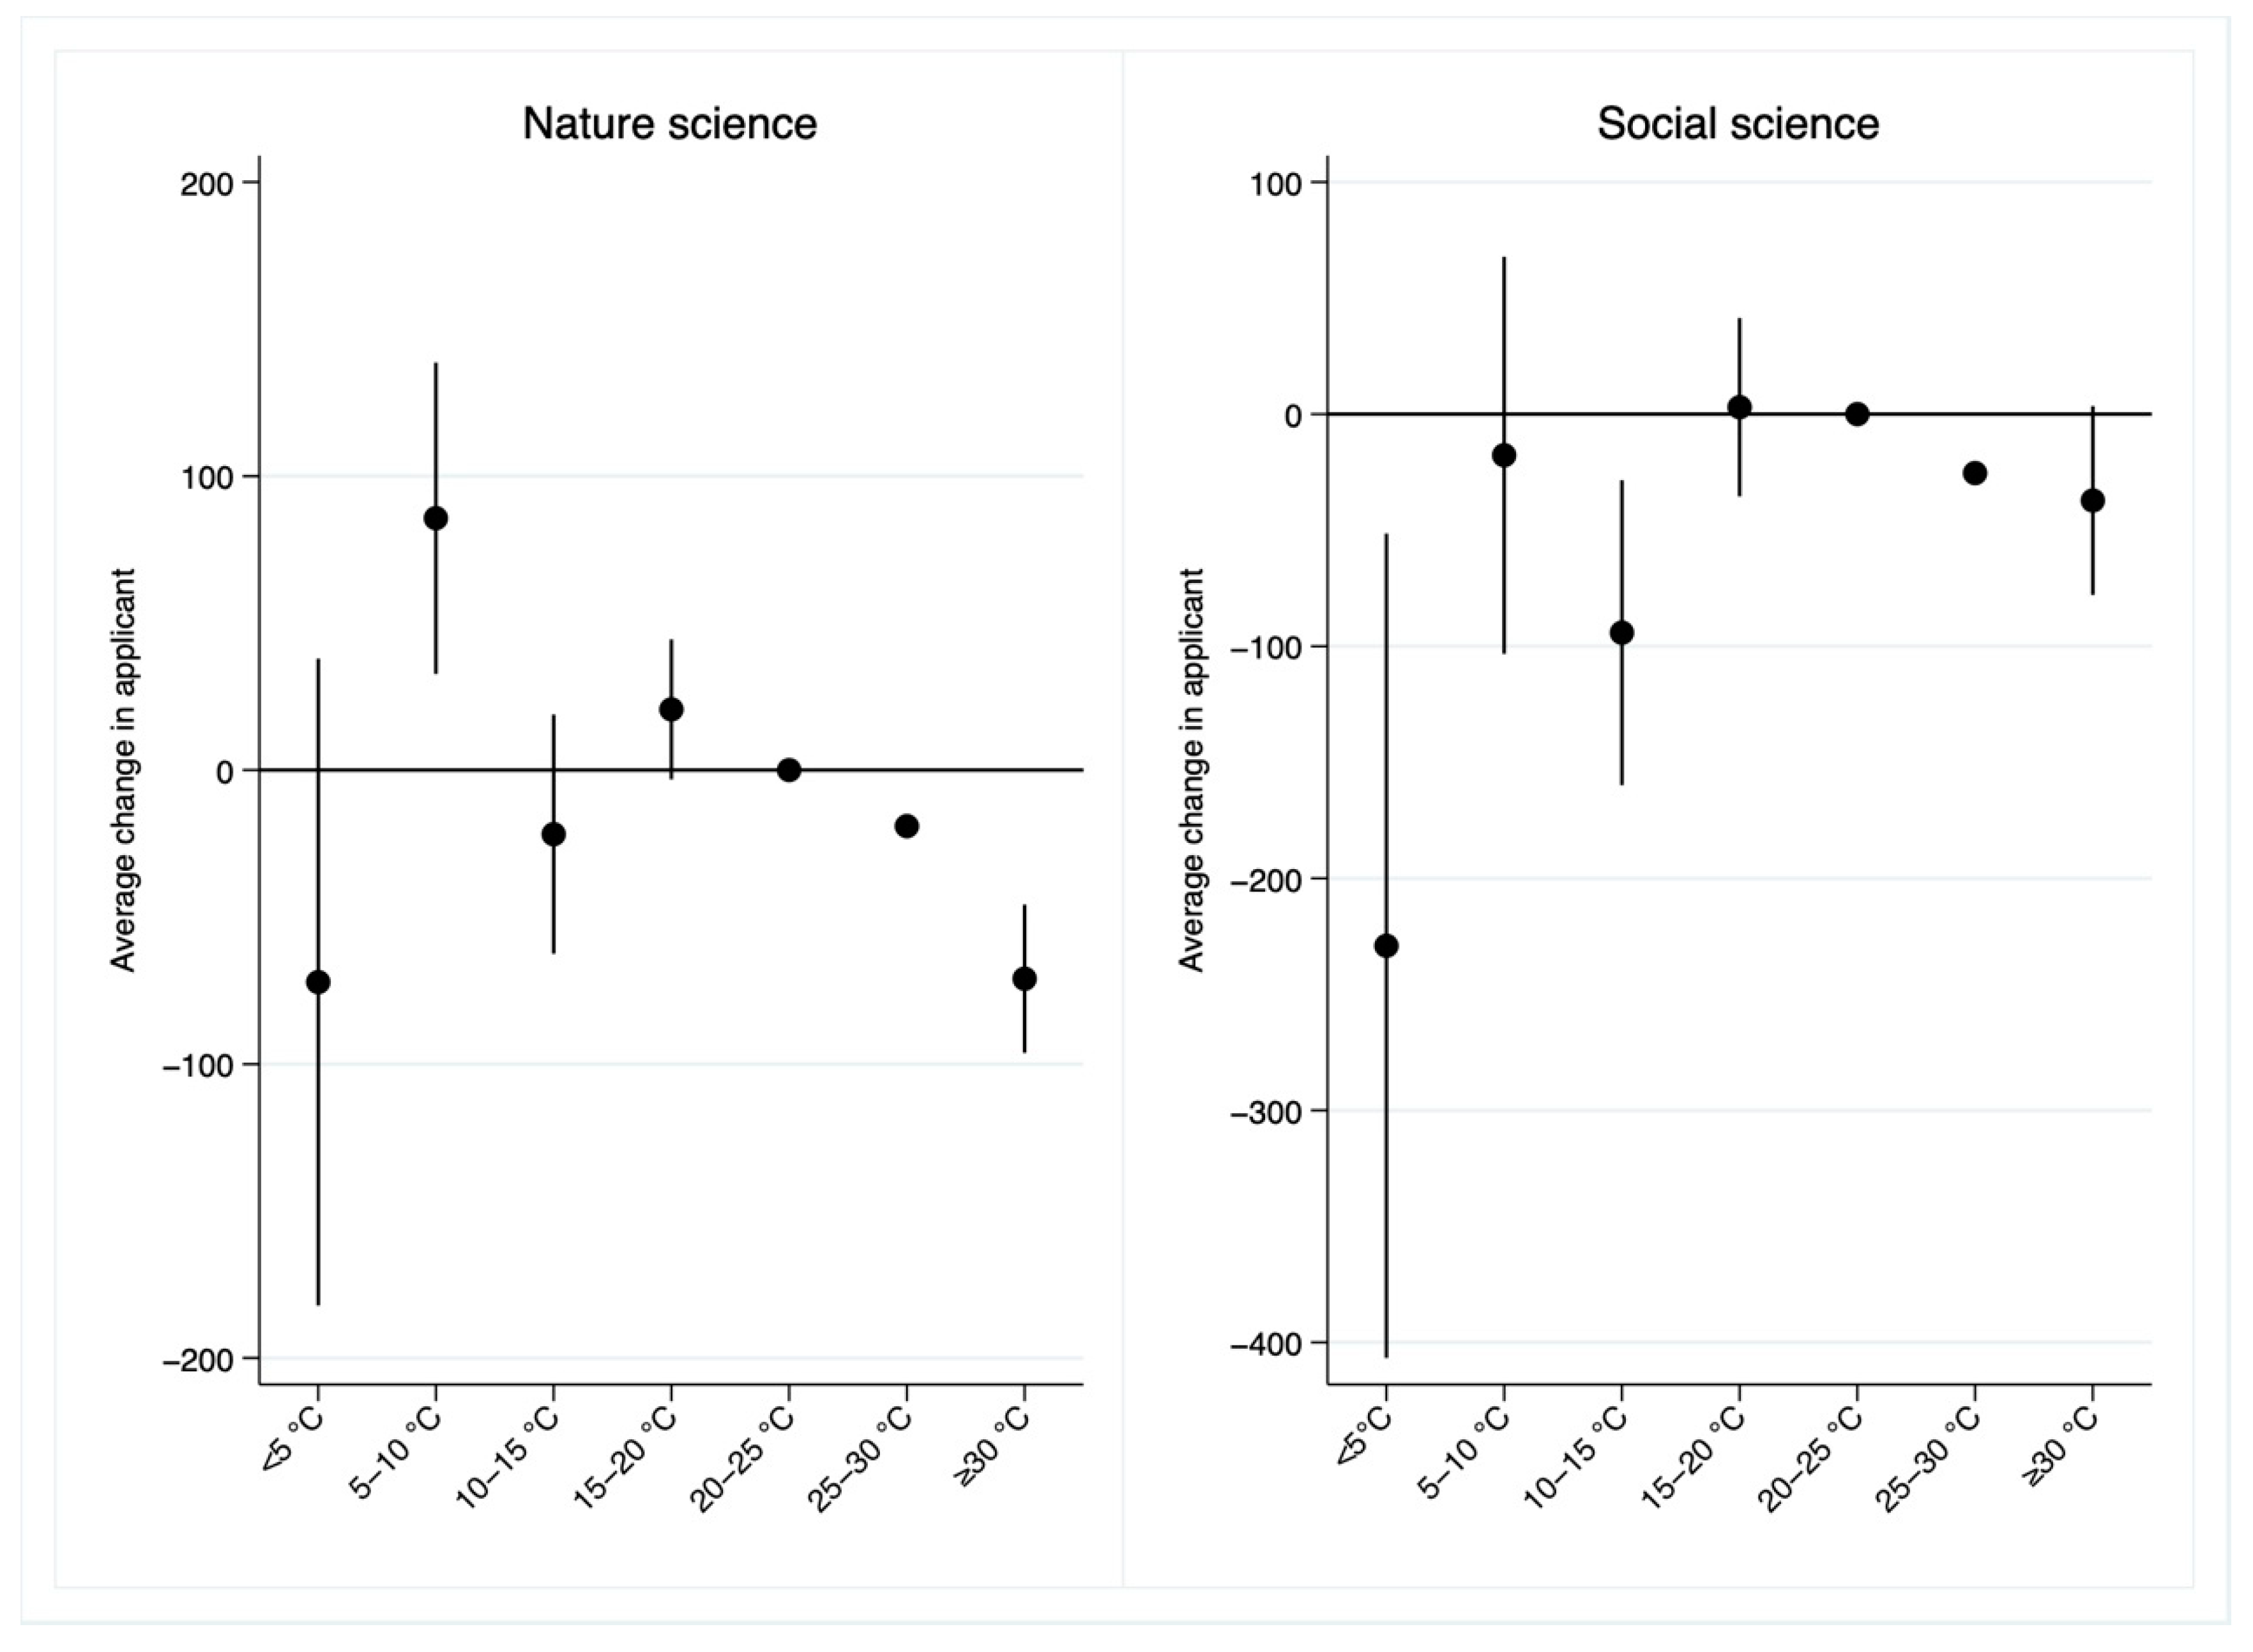
5.3. Heterogeneity Analysis
6. Discussion
6.1. The Effects of Temperature on the Number of Applicants in Different Time Spans
6.2. Tests for Mitigation
7. Conclusions
Author Contributions
Funding
Institutional Review Board Statement
Informed Consent Statement
Data Availability Statement
Conflicts of Interest
Abbreviations
Appendix A. Further Discussion of the Applicant Data for the UNGEE of Double First-Class Universities
Appendix B. List of 75 “Double First-Class” Universities

| City | University |
|---|---|
| Beijing (14) | Beijing University, Renmin University of China, Beijing University of Aeronautics and Astronautics, China Agricultural University, Beijing Normal University, Minzu University of China, Central University of Finance and Economics, University of International Business and Economics, China University of Political Science and Law, Beijing University of Posts and Telecommunications, Beijing Forestry University, Capital Normal University, Beijing Foreign Studies University, University of Chinese Academy of Sciences |
| Shanghai (7) | Tongji University, Shanghai Jiao Tong University, East China Normal University, Donghua University, Shanghai International Studies University, Shanghai University of Finance and Economics, Shanghai University |
| Nanjing (5) | Nanjing University, Southeast University, Nanjing University of Posts and Telecommunications, Nanjing Forestry University, Nanjing Agricultural University |
| Wuhan (5) | Wuhan University, China University of Geosciences (Wuhan), Huazhong Agricultural University, Zhongnan University of Economics and Law, Central China Normal University |
| Guangzhou (4) | Sun Yat-sen University, South China University of Technology, Jinan University, South China Normal University |
| Tianjin (4) | Nankai University, Hebei University of Technology, Tianjin Medical University, Tiangong University |
| Xian (4) | Xidian University, Shaanxi Normal University, Northwest University, Chang’an University |
| Changsha (3) | Central South University, Hunan University, National University of Defense Technology |
| Chengdu (2) | Sichuan University, Southwestern University of Finance and Economics |
| Qingdao (2) | Ocean University of China, China University of Petroleum (East China) |
| Shenyang (2) | Northeastern University (Shenyang), Liaoning University |
| Chongqing (1) | Southwest University |
| Dalian (1) | Dalian University of Technology |
| Fuzhou (1) | Fuzhou University |
| Haikou (1) | Hainan University |
| Hangzhou (1) | Zhejiang University |
| Harbin (1) | Harbin Engineering University |
| Hefei (1) | Anhui University |
| Huhhot (1) | Inner Mongolia University |
| Jinan (1) | Shandong University (Jinan) |
| Kunming (1) | Yunnan University |
| Lanzhou (1) | Lanzhou University |
| Lhasa (1) | Tibet University |
| Ningbo (1) | Ningbo University |
| Qinhuangdao (1) | Northeastern University (Qinhuangdao) |
| Shihezi (1) | Shihezi University |
| Suzhou (1) | Soochow University |
| Weihai (1) | Shandong University (Weihai) |
| Wuxi (1) | Jiangnan University |
| Xiamen (1) | Xiamen University |
| Xianyang (1) | Northwest A&F University, |
| Xuzhou (1) | China University of Mining and Technology (Xuzhou) |
| Yinchuan (1) | Ningxia University |
| Zhengzhou (1) | Zhengzhou University |
References
- Burke, M.; Emerick, K. Adaptation to Climate Change: Evidence from US Agriculture. Am. Econ. J. Econ. Policy 2016, 8, 106–140. [Google Scholar] [CrossRef]
- Chen, S.; Chen, X.; Xu, J. Impacts of Climate Change on Agriculture: Evidence from China. J. Environ. Econ. Manag. 2016, 76, 105–124. [Google Scholar] [CrossRef]
- Chen, S.; Gong, B. Response and Adaptation of Agriculture to Climate Change: Evidence from China. J. Dev. Econ. 2021, 148, 102557. [Google Scholar] [CrossRef]
- Zhang, P.; Deschenes, O.; Meng, K.; Zhang, J. Temperature Effects on Productivity and Factor Reallocation: Evidence from a Half Million Chinese Manufacturing Plants. J. Environ. Econ. Manag. 2018, 88, 1–17. [Google Scholar] [CrossRef]
- Chen, X.; Yang, L. Temperature and Industrial Output: Firm-level Evidence from China. J. Environ. Econ. Manag. 2019, 95, 257–274. [Google Scholar] [CrossRef]
- Jessoe, K.; Manning, D.T.; Taylor, J.E. Climate Change and Labour Allocation in Rural Mexico: Evidence from Annual Fluctuations in Weather. Econ. J. 2018, 128, 230–261. [Google Scholar] [CrossRef]
- Colmer, J. Temperature, Labor Reallocation, and Industrial Production: Evidence from India. Am. Econ. J. Appl. Econ. 2021, 13, 101–124. [Google Scholar] [CrossRef]
- Heyes, A.; Saberian, S. Hot Days, the Ability to Work and Climate Resilience: Evidence from A Representative Sample of 42,152 Indian Households. J. Dev. Econ. 2022, 155, 102786. [Google Scholar] [CrossRef]
- Graff Zivin, J.; Hsiang, S.M.; Neidell, M. Temperature and Human Capital in the Short and Long Run. J. Assoc. Environ. Resour. Econ. 2018, 5, 77–105. [Google Scholar] [CrossRef]
- Garg, T.; Jagnani, M.; Taraz, V. Temperature and Human Capital in India. J. Assoc. Environ. Resour. Econ. 2020, 7, 1113–1150. [Google Scholar] [CrossRef]
- Graff Zivin, J.; Song, Y.; Tang, L.; Zhang, P. Temperature and High-stakes Cognitive Performance: Evidence from the National College Entrance Examination in China. J. Environ. Econ. Manag. 2020, 104, 102365. [Google Scholar] [CrossRef]
- Heyes, A.; Saberian, S. Temperature and Decisions: Evidence from 207,000 Court Cases. Am. Econ. J. Appl. Econ. 2019, 11, 238–265. [Google Scholar] [CrossRef]
- Fishman, R.; Carrillo, P.; Russ, J. Long-term Impacts of Exposure to High Temperatures on Human Capital and Economic Productivity. J. Environ. Econ. Manag. 2019, 93, 221–238. [Google Scholar] [CrossRef]
- Park, R.J.; Goodman, J.; Hurwitz, M.; Smith, J. Heat and Learning. Am. Econ. J. Econ. Policy 2020, 12, 306–339. [Google Scholar] [CrossRef]
- Mukherjee, A.; Sanders, N.J. The Causal Effect of Heat on Violence: Social Implications of Unmitigated Heat among the Incarcerated. NBER Working Paper 28987. 2021. Available online: https://www.nber.org/papers/w28987 (accessed on 24 June 2022).
- Jiao, Y.; Li, Y.; Liu, M. Widening the Gap? Temperature and Time Allocation between Men and Women. Appl. Econ. 2021, 53, 595–627. [Google Scholar] [CrossRef]
- Deschenes, O.; Moretti, E. Extreme Weather Events, Mortality, and Migration. Rev. Econ. Stat. 2009, 91, 659–681. [Google Scholar] [CrossRef]
- Deschenes, O.; Greenstone, M. Climate Change, Mortality, and Adaptation: Evidence from Annual Fluctuations in Weather in the US. Am. Econ. J. Appl. Econ. 2011, 3, 152–185. [Google Scholar] [CrossRef]
- Barreca, A.; Clay, K.; Deschenes, O.; Greenstone, M.; Shapiro, J.S. Adapting to Climate Change: The Remarkable Decline in the US Temperature-mortality Relationship over the Twentieth Century. J. Polit. Econ. 2016, 124, 105–159. [Google Scholar] [CrossRef]
- Basu, R.; Gavin, L.; Pearson, D.; Ebisu, K.; Malig, B. Examining the Association between Apparent Temperature and Mental Health-related Emergency Room Visits in California. Am. J. Epidemiol. 2018, 187, 726–735. [Google Scholar] [CrossRef]
- Karlsson, M.; Ziebarth, N.R. Population Health Effects and Health-related Costs of Extreme Temperatures: Comprehensive Evidence from Germany. J. Environ. Econ. Manag. 2018, 91, 93–117. [Google Scholar] [CrossRef]
- Obradovich, N.; Migliorini, R.; Paulus, M.P.; Rahwan, I. Empirical Evidence of Mental Health Risks Posed by Climate Change. Proc. Natl. Acad. Sci. USA 2018, 115, 10953–10958. [Google Scholar] [CrossRef] [PubMed]
- Mullins, J.T.; White, C. Temperature and Mental Health: Evidence from the Spectrum of Mental Health Outcomes. J. Health Econ. 2019, 68, 102240. [Google Scholar] [CrossRef] [PubMed]
- Yu, X.; Lei, X.; Wang, M. Temperature Effects on Mortality and Household Adaptation: Evidence from China. J. Environ. Econ. Manag. 2019, 96, 195–212. [Google Scholar] [CrossRef]
- Li, M.; Ferreira, S.; Smith, T.A. Temperature and Self-reported Mental Health in the United States. PLoS ONE 2020, 15, e0230316. [Google Scholar] [CrossRef] [PubMed]
- Agarwal, S.; Qin, Y.; Shi, L.; Wei, G.; Zhu, H. Impact of Temperature on Morbidity: New Evidence from China. J. Environ. Econ. Manag. 2021, 109, 102495. [Google Scholar] [CrossRef]
- Lu, J. Household Residential Location Choice in Retirement: The Role of Climate Amenities. Reg. Sci. Urban Econ. 2020, 84, 103489. [Google Scholar] [CrossRef]
- Oliveira, J.; Pereda, P. The Impact of Climate Change on Internal Migration in Brazil. J. Environ. Econ. Manag. 2020, 103, 102340. [Google Scholar] [CrossRef]
- Feng, S.; Krueger, A.B.; Oppenheimer, M. Linkages among Climate Change, Crop Yields and Mexico–US Cross-border Migration. Proc. Natl. Acad. Sci. USA 2010, 107, 14257–14262. [Google Scholar] [CrossRef]
- Cai, R.; Feng, S.; Oppenheimer, M.; Pytlikova, M. Climate Variability and International Migration: The Importance of the Agricultural Linkage. J. Environ. Econ. Manag. 2016, 79, 135–151. [Google Scholar] [CrossRef]
- Clark, X.; Hatton, T.J.; Williamson, J.G. Explaining U.S. Immigration, 1971–1998. Rev. Econ. Stat. 2007, 89, 359–373. [Google Scholar] [CrossRef]
- So, K.S.; Orazem, P.F.; Otto, D.M. The Effects of Housing Prices, Wages, and Commuting Time on Joint Residential and Job Location Choices. Am. J. Agr. Econ. 2001, 83, 1036–1048. [Google Scholar] [CrossRef]
- Wozniak, A. Are College Graduates more Responsive to Distant Labor Market Opportunities? J. Hum. Resour. 2010, 45, 944–970. [Google Scholar] [CrossRef]
- Plantinga, A.J.; Détang-Dessendre, C.; Hunt, G.L.; Piguet, V. Housing Prices and Inter-urban Migration. Reg. Sci. Urban. Econ. 2013, 43, 296–306. [Google Scholar] [CrossRef]
- Zheng, S.; Zhang, X.; Sun, W.; Lin, C. Air Pollution and Elite College Graduates’ Job Location Choice: Evidence from China. Ann. Reg. Sci. 2019, 63, 295–316. [Google Scholar] [CrossRef]
- Lai, W.; Song, H.; Wang, C.; Wang, H. Air Pollution and Brain Drain: Evidence from College Graduates in China. China Econ. Rev. 2021, 68, 101624. [Google Scholar] [CrossRef]
- Chen, S.; Oliva, P.; Zhang, P. The Effect of Air Pollution on Migration: Evidence from China. J. Dev. Econ. 2022, 156, 102833. [Google Scholar] [CrossRef]
- Chen, S.; Chen, Y.; Lei, Z.; Tan-Soo, J.-S. Chasing Clean Air: Pollution-induced Travels in China. J. Assoc. Environ. Resour. Econ. 2021, 8, 59–89. [Google Scholar] [CrossRef]
- Jia, K.; Chen, S. Escaping from Pollution: Air Pollution and the Settlement Intentions of Floating Migrants in Chinese Cities. Migr. Stud. 2021, 9, 1480–1498. [Google Scholar] [CrossRef]
- Qin, Y.; Zhu, H. Run Away? Air Pollution and Emigration Interests in China. J. Popul. Econ. 2018, 31, 235–266. [Google Scholar] [CrossRef]
- McAusland, C.; Kuhn, P. Bidding for Brains: Intellectual Property Rights and the International Migration of Knowledge Workers. J. Dev. Econ. 2011, 95, 77–87. [Google Scholar] [CrossRef]
- Agrawal, A.; Kapur, D.; McHale, J.; Oettl, A. Brain Drain or Brain Bank? The Impact of Skilled Emigration on Poor-country Innovation. J. Urban Econ. 2011, 69, 43–55. [Google Scholar] [CrossRef]

| Variable | Obs. | Mean | Std. Dev | Min | Max |
|---|---|---|---|---|---|
| Panel A: applicants and admissions variables, university level, 2010–2021 | |||||
| Number of applicants | 580 | 11,582.600 | 7467.141 | 237.000 | 41,522.000 |
| Number of applicants (social science) | 580 | 6690.303 | 5664.556 | 5.877 | 28,297.000 |
| Number of applicants (natural science) | 580 | 4894.095 | 4114.187 | 0.000 | 21,627.000 |
| Ratio of the number of applicants and the number of admissions | 580 | 4.214 | 1.736 | 1.150 | 11.786 |
| Panel B: temperature variables, city level, 2009–2020 | |||||
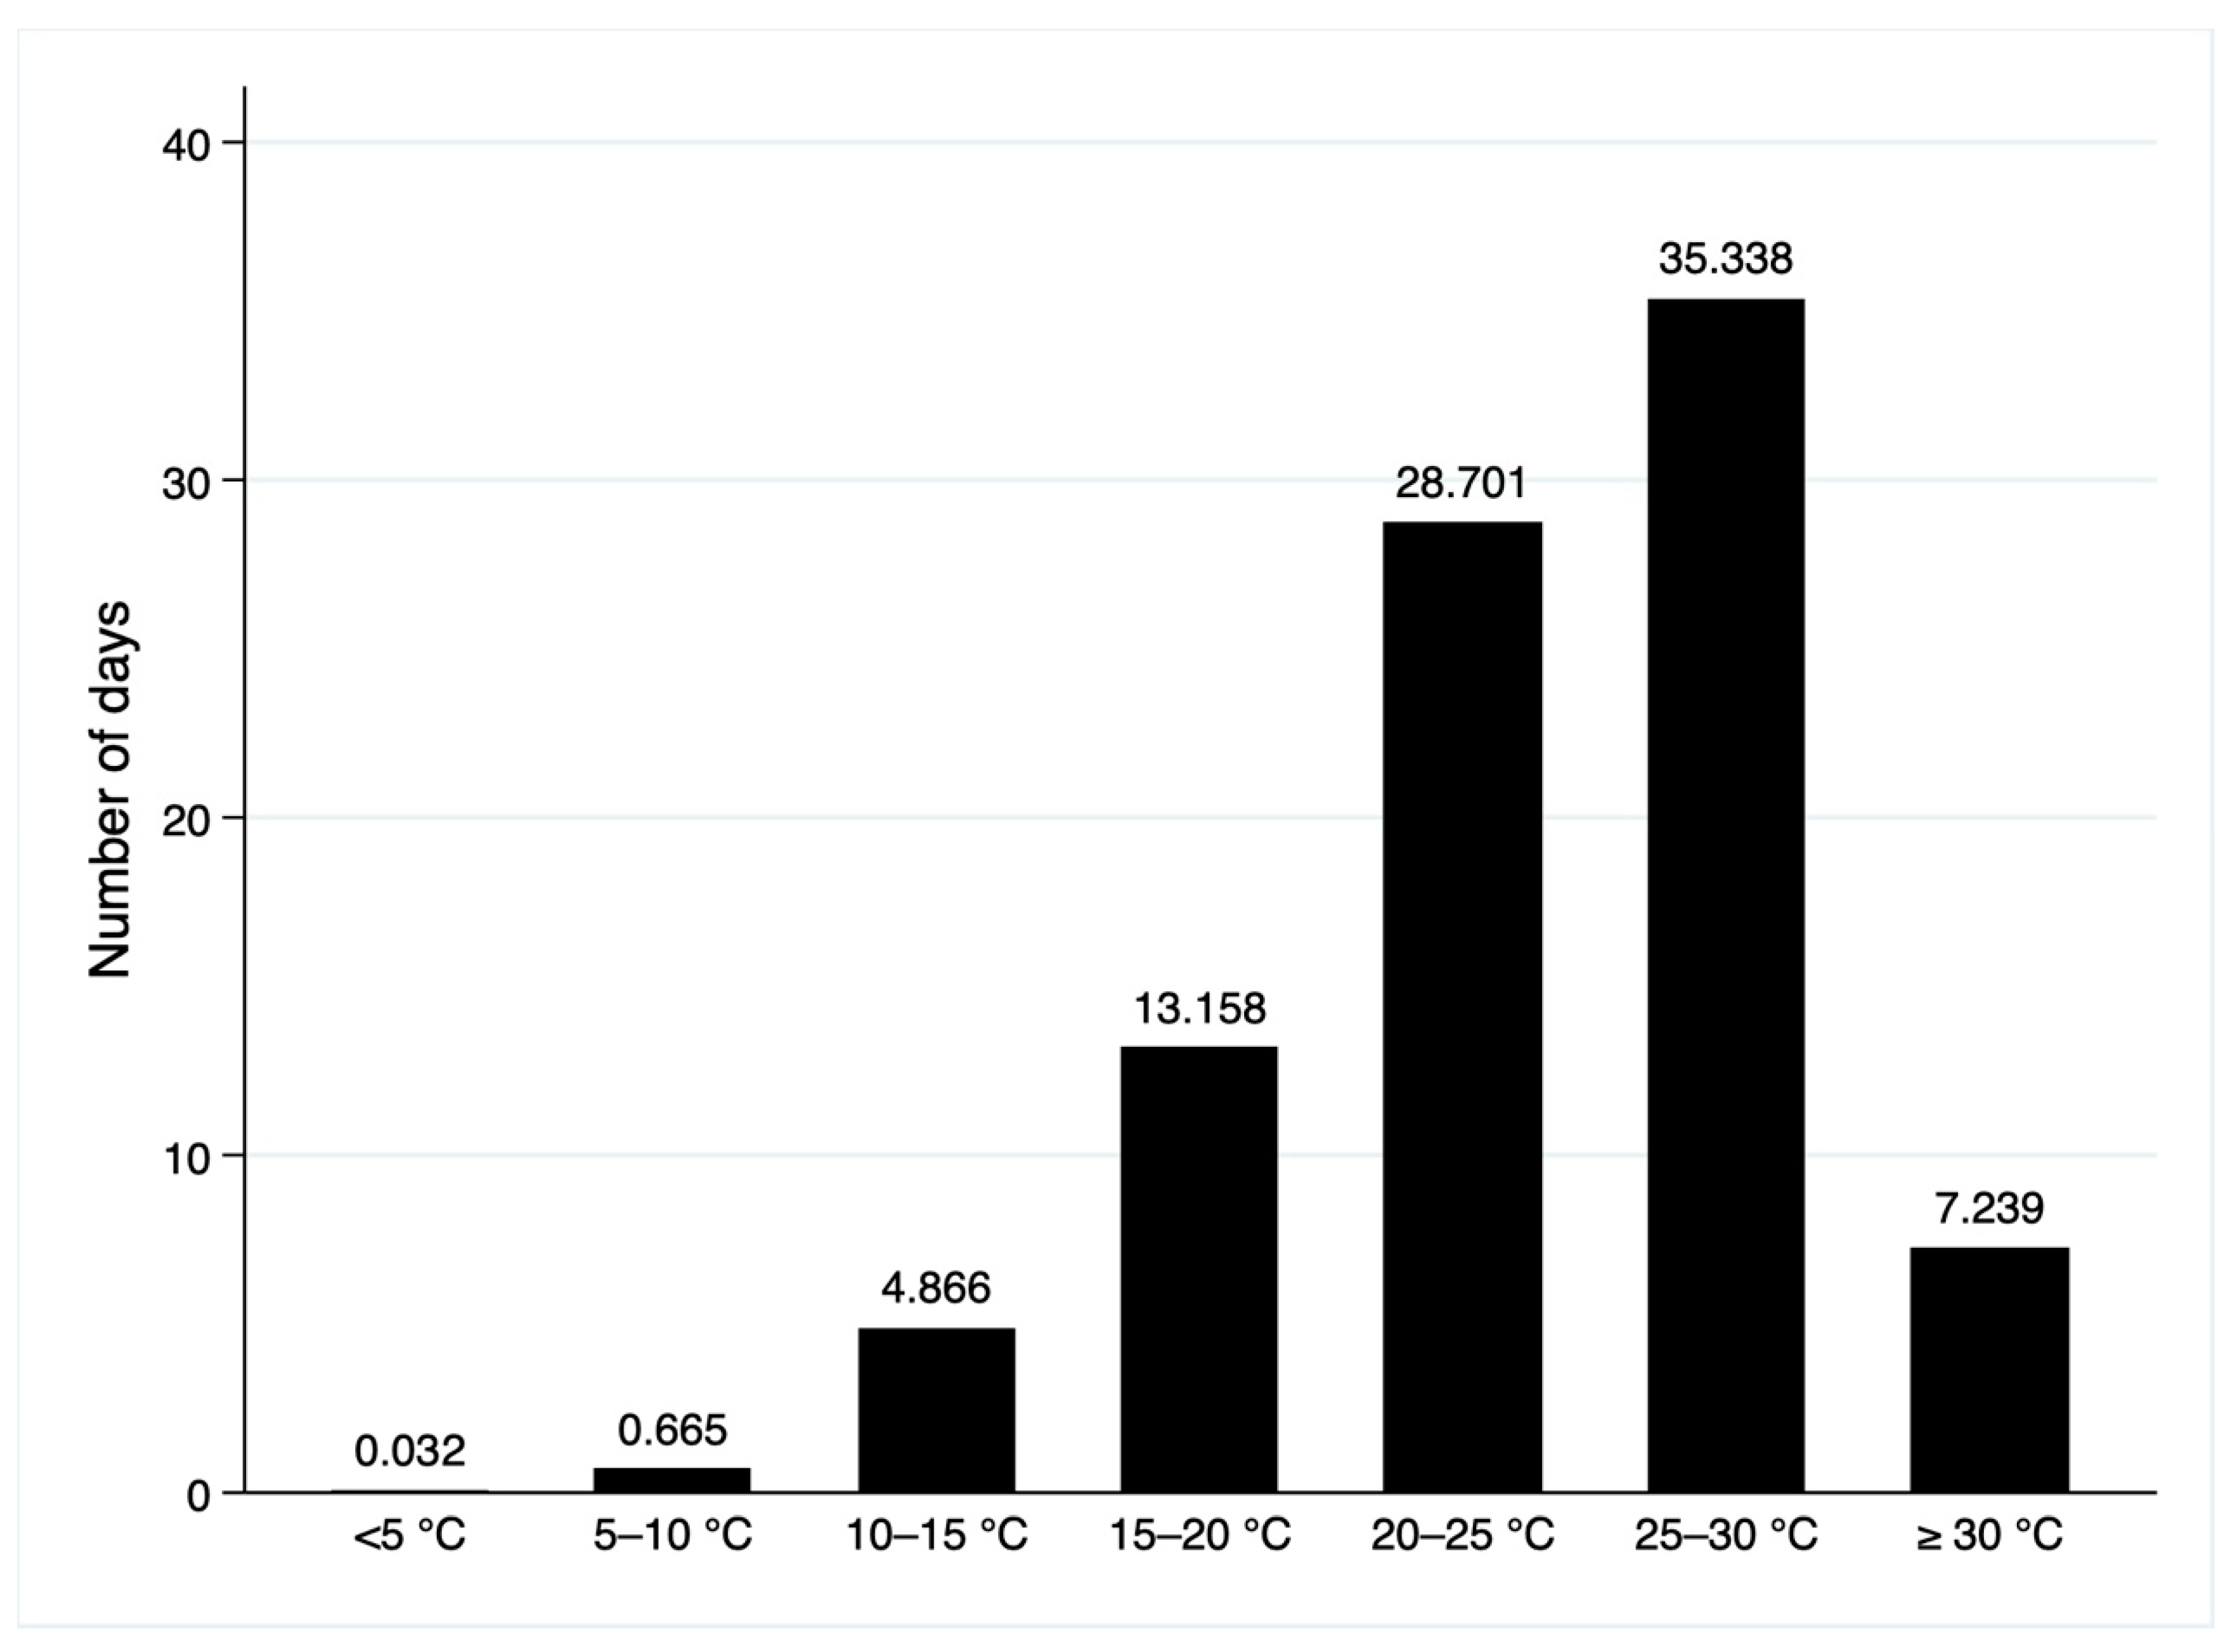
| Number of days (AT ≥ 30) | 284 | 7.239 | 9.512 | 0.000 | 38.000 |
| Number of days (AT 25–30) | 284 | 35.338 | 20.773 | 0.000 | 90.000 |
| Number of days (AT 20–25) | 284 | 28.701 | 12.955 | 0.000 | 62.000 |
| Number of days (AT 15–20) | 284 | 13.158 | 11.785 | 0.000 | 67.000 |
| Number of days (AT 10–15) | 284 | 4.866 | 11.684 | 0.000 | 77.000 |
| Number of days (AT 5–10) | 284 | 0.665 | 2.300 | 0.000 | 22.000 |
| Number of days (AT < 5) | 284 | 0.032 | 0.307 | 0.000 | 4.000 |
| Panel C: other meteorological variables, city level, 2009–2020 | |||||
| Precipitation (mm) | 284 | 4.298 | 1.786 | 0.420 | 10.872 |
| Relative humidity (%) | 284 | 74.905 | 6.247 | 48.704 | 87.095 |
| Wind speed (m/s) | 284 | 2.107 | 0.414 | 1.117 | 3.295 |
| Sunshine duration (hour) | 284 | 6.174 | 1.272 | 2.487 | 10.309 |
| Air pressure (0.1 hPa) | 284 | 9641.955 | 735.666 | 6251.155 | 10,090.170 |
| Panel D: air pollution variables, city level, 2015–2020 | |||||
| PM2.5 () | 160 | 30.557 | 11.358 | 8.240 | 71.372 |
| Panel E: economics variables, city level, 2009–2020 | |||||
| Per capital GDP (RMB) | 284 | 106,279.700 | 35,898.510 | 12,539.000 | 234,360.600 |
| Average wage (RMB) | 284 | 74,578.680 | 28,133.350 | 28,995.580 | 179,541.000 |
| (1) | (2) | (3) | (4) | (5) | |
|---|---|---|---|---|---|
| Number of days (≥30) | −6.327 | 3.955 | −34.907 | −108.094 *** | −108.288 *** |
| (31.190) | (25.071) | (28.652) | (20.694) | (28.614) | |
| Number of days (25–30 °C) | −0.950 | 12.457 | −4.093 | −44.470 *** | −104.526 *** |
| (36.127) | (31.761) | (31.774) | (1.895) | (16.136) | |
| Number of days (15–20 °C) | 64.210 | 40.421 | 62.832 ** | 23.596 | 14.321 * |
| (50.388) | (31.559) | (28.476) | (19.537) | (7.253) | |
| Number of days (10–15 °C) | 28.808 | 27.194 | 44.035 | −116.085 *** | 11.198 *** |
| (50.639) | (48.278) | (45.165) | (33.390) | (3.528) | |
| Number of days (5–10 °C) | −45.486 | −26.497 | 39.004 | 67.823 | 10.322 |
| (64.109) | (62.453) | (54.276) | (43.469) | (41.226) | |
| Number of days (<5 °C) | −387.838 * | −386.125 ** | −432.400 ** | −301.501 *** | −777.355 *** |
| (210.268) | (142.365) | (162.232) | (90.274) | (22.943) | |
| Ratio (applicants/admissions) | No | Yes | Yes | Yes | Yes |
| Weather controls | No | No | Yes | Yes | Yes |
| University FE | Yes | Yes | Yes | Yes | Yes |
| Year FE | Yes | Yes | Yes | No | No |
| City-by-year FE | No | No | No | Yes | Yes |
| Observation | 580 | 580 | 580 | 580 | 580 |
| R2 | 0.556 | 0.708 | 0.722 | 0.883 | 0.883 |
| (1) Natural Science | (2) Social Science | |
|---|---|---|
| Number of days (≥30) | −70.956 *** | −37.198 * |
| (12.394) | (20.014) | |
| Number of days (25–30 °C) | −19.070 *** | −25.406 *** |
| (1.135) | (1.833) | |
| Number of days (15–20 °C) | 20.652 * | 3.001 |
| (11.701) | (18.895) | |
| Number of days (10–15 °C) | −21.812 | −94.177 *** |
| (19.998) | (32.294) | |
| Number of days (5–10 °C) | 85.660 *** | −17.711 |
| (26.035) | (42.042) | |
| Number of days (<5 °C) | −72.126 | −229.114 ** |
| (54.069) | (87.311) | |
| Ratio (applicants/admissions) | Yes | Yes |
| Weather Controls | Yes | Yes |
| University FE | Yes | Yes |
| City-by-year FE | Yes | Yes |
| Observation | 580 | 580 |
| R2 | 0.769 | 0.839 |
| (1) Province-Year | (2) Placebo Test | |
|---|---|---|
| Number of days (≥30) | −224.911 ** | −27.802 |
| (91.044) | (56.223) | |
| Number of days (25–30 °C) | −57.369 | 30.182 |
| (45.968) | (42.718) | |
| Number of days (15–20 °C) | 247.913 ** | −13.519 |
| (97.978) | (31.539) | |
| Number of days (10–15 °C) | 508.792 | 4.224 |
| (311.789) | (41.742) | |
| Number of days (5–10 °C) | −150.861 | 24.904 |
| (1019.337) | (38.081) | |
| Number of days (<5 °C) | 152.657 | 3.796 |
| (1549.577) | (43.327) | |
| Ratio (applicants/admissions) | Yes | Yes |
| Weather Controls | Yes | Yes |
| University FE | Yes | Yes |
| City FE | Yes | No |
| City-by-year FE | No | Yes |
| Province-by-year FE | Yes | No |
| Observation | 580 | 580 |
| R2 | 0.868 | 0.641 |
| (1) | (2) | (3) | |
|---|---|---|---|
| Number of days (≥30) | −108.094 *** | −76.885 *** | −126.825 *** |
| (20.694) | (0.695) | (5.441) | |
| Number of days (25–30 °C) | −44.470 *** | −44.304 | −33.964 |
| (1.895) | (29.632) | (27.691) | |
| Number of days (15–20 °C) | 23.596 | −208.320 *** | −190.329 *** |
| (19.537) | (20.100) | (13.549) | |
| Number of days (10–15 °C) | −116.085 *** | −60.955 *** | −64.779 *** |
| (33.390) | (6.055) | (5.409) | |
| Number of days (5–10 °C) | 67.823 | −68.124 *** | −114.993 *** |
| (43.469) | (6.028) | (13.644) | |
| Number of days (<5 °C) | −301.501 *** | −73.414 *** | −178.327 *** |
| (90.274) | (9.492) | (63.460) | |
| Air pollution | - | - | −173.991 *** |
| - | - | (1.886) | |
| Ratio (applicants/admissions) | Yes | Yes | Yes |
| Weather Controls | Yes | Yes | Yes |
| University FE | Yes | Yes | Yes |
| City-by-year FE | Yes | Yes | Yes |
| Observation | 580 | 322 | 322 |
| R2 | 0.883 | 0.858 | 0.858 |
| (1) Maximum Temperature | (2) Minimum Temperature | |
|---|---|---|
| Number of days (≥30) | −241.113 *** | −172.567 *** |
| (42.239) | (20.841) | |
| Number of days (25–30 °C) | −96.596 *** | −17.917 *** |
| (4.756) | (0.837) | |
| Number of days (15–20 °C) | 37.340 *** | 77.672 *** |
| (0.956) | (7.801) | |
| Number of days (10–15 °C) | −186.982 *** | −139.684 *** |
| (7.090) | (3.859) | |
| Number of days (5–10 °C) | 88.671 ** | 120.261 *** |
| (35.508) | (3.741) | |
| Number of days (<5 °C) | −216.844 * | −226.738 *** |
| (110.715) | (9.120) | |
| Ratio (applicants/admissions) | Yes | Yes |
| Weather Controls | Yes | Yes |
| University FE | Yes | Yes |
| City-by-year FE | Yes | Yes |
| Observation | 580 | 580 |
| R2 | 0.857 | 0.857 |
| (1) | (2) | ||
|---|---|---|---|
| Number of days (≥30) | −290.772 *** | Number of days (≥30) | −322.558 *** |
| (2.556) | (44.099) | ||
| Number of days (27–30 °C) | −323.770 *** | Number of days (24–30 °C) | −208.140 *** |
| (6.059) | (15.519) | ||
| Number of days (24–27 °C) | −45.104 | Number of days (12–18 °C) | 73.994 *** |
| (28.207) | (17.695) | ||
| Number of days (18–21 °C) | 45.237 *** | Number of days (6–12 °C) | −119.389 *** |
| (4.166) | (12.448) | ||
| Number of days (15–18 °C) | −139.365 *** | Number of days (<6 °C) | −115.680 *** |
| (23.072) | (16.386) | ||
| Number of days (12–15 °C) | −55.054 ** | ||
| (27.027) | |||
| Number of days (9–12 °C) | −275.833 *** | ||
| (54.898) | |||
| Number of days (6–9 °C) | −186.594 *** | ||
| (29.825) | |||
| Number of days (<3 °C) | −248.992 *** | ||
| (26.592) | |||
| Ratio (applicants/admissions) | Yes | Yes | |
| Weather Controls | Yes | Yes | |
| University FE | Yes | Yes | |
| City-by-year FE | Yes | Yes | |
| Observation | 580 | 580 | |
| R2 | 0.857 | 0.883 |
| (1) Beijing, Shanghai, Guangzhou | (2) Beijing, Nanjing, Shanghai, Wuhan | (3) Non “Double First-Class” university | |
|---|---|---|---|
| Number of days (≥30) | −179.746 *** | −117.284 *** | −81.716 *** |
| (55.763) | (32.749) | (0.534) | |
| Number of days (25–30 °C) | −93.483 *** | −12.301 | −12.391 *** |
| (18.169) | (28.382) | (0.882) | |
| Number of days (15–20 °C) | 37.906 | 137.631 *** | −70.981 *** |
| (92.393) | (47.102) | (2.308) | |
| Number of days (10–15 °C) | −89.929 | 38.884 | −68.232 *** |
| (144.264) | (73.255) | (1.168) | |
| Number of days (5–10 °C) | 87.607 | 69.746 | −67.890 *** |
| (198.892) | (121.928) | (18.610) | |
| Number of days (<5 °C) | −411.267 | −35.566 | −112.022 *** |
| (475.404) | (257.725) | (8.772) | |
| Ratio (applicants/admissions) | Yes | Yes | Yes |
| Weather Controls | Yes | Yes | Yes |
| University FE | Yes | Yes | Yes |
| City-by-year FE | Yes | Yes | Yes |
| Observation | 370 | 288 | 1, 092 |
| R2 | 0.929 | 0.713 | 0.784 |
| (1) Type (Comprehensive University = 1) | (2) Class (World-Class Universities = 1) | (3) Tier (985 Universities = 1) | (4) Region (North = 1) | (5) Region (Cold = 1) | |
|---|---|---|---|---|---|
| Number of days (≥30) Dummy | 32.039 | 64.482 *** | 45.593 ** | −61.922 | 113.513 ** |
| (42.210) | (23.534) | (20.718) | (48.421) | (42.187) | |
| Number of days (25–30 °C) Dummy | −43.237 | 55.749 | 4.116 | −34.467 | 8.854 *** |
| (70.476) | (40.131) | (38.542) | (50.838) | (2.560) | |
| Number of days (15–20 °C) Dummy | −5.671 | 8.065 | 80.929 | −21.563 | −70.728 *** |
| (163.521) | (49.853) | (50.633) | (74.575) | (10.649) | |
| Number of days (10–15 °C) Dummy | 364.055 | 70.790 | 51.954 | 237.690 | −148.179 *** |
| (501.996) | (86.259) | (93.718) | (264.121) | (4.243) | |
| Number of days (5–10 °C) Dummy | 210.619 ** | 236.631 | 31.962 * | 41.131 | −20.164 |
| (99.789) | (140.866) | (16.855) | (54.827) | (38.969) | |
| Number of days (<5 °C) Dummy | −153.114 | 292.588 | 79.193 * | −46.389 * | −40.602 *** |
| (183.290) | (522.162) | (45.452) | (22.962) | (8.699) | |
| Ratio (applicants/admissions) | Yes | Yes | Yes | Yes | Yes |
| Weather Controls | Yes | Yes | Yes | Yes | Yes |
| University FE | Yes | Yes | Yes | Yes | Yes |
| City-by-year FE | Yes | Yes | Yes | Yes | Yes |
| Observation | 580 | 580 | 580 | 580 | 580 |
| R2 | 0.887 | 0.885 | 0.885 | 0.883 | 0.883 |
| (1) Past 3 Months | (2) Registration Period | (3) Past 1 Month | (4) Past 2 Months | (5) Past 6 Months | (7) Past 12 months | |
|---|---|---|---|---|---|---|
| Number of days (≥30) | −108.094 *** | −145.646 | −170.010 *** | −117.861 * | −46.577 *** | −16.020 *** |
| (20.694) | (119.801) | (43.813) | (60.631) | (5.876) | (0.159) | |
| Number of days (25–30 °C) | −44.470 *** | 37.646 | −47.618 *** | −38.030 *** | 1.529 | −20.539 *** |
| (1.895) | (50.257) | (1.386) | (7.018) | (1.050) | (1.765) | |
| Number of days (15–20 °C) | 23.596 | −30.909 | −23.452 *** | −10.692 *** | −10.995 *** | −26.462 *** |
| (19.537) | (42.693) | (4.727) | (1.828) | (0.998) | (1.604) | |
| Number of days (10–15 °C) | −116.085 *** | 2.931 | −4.446 | −128.229 ** | −13.295 *** | −33.779 *** |
| (33.390) | (64.488) | (13.865) | (60.091) | (1.128) | (0.780) | |
| Number of days (5–10 °C) | 67.823 | −86.310 | 1.757 | 26.178 | −14.640 *** | −21.886 *** |
| (43.469) | (177.093) | (1.045) | (15.827) | (1.274) | (3.502) | |
| Number of days (<5 °C) | −301.501 *** | 52.341 | −221.827 *** | −222.151 *** | −167.094 *** | −120.132 *** |
| (90.274) | (315.545) | (26.334) | (38.908) | (19.953) | (12.163) | |
| Ratio (applicants/admissions) | Yes | Yes | Yes | Yes | Yes | Yes |
| Weather Controls | Yes | Yes | Yes | Yes | Yes | Yes |
| University FE | Yes | Yes | Yes | Yes | Yes | Yes |
| City-by-year FE | Yes | Yes | Yes | Yes | Yes | Yes |
| Observation | 580 | 580 | 580 | 580 | 580 | 580 |
| R2 | 0.883 | 0.857 | 0.883 | 0.883 | 0.857 | 0.857 |
| (1) GDP per Capita | (2) Wage Payment per Capita | |
|---|---|---|
| Number of days (≥30) Income | 0.0023 *** | 0.0048 *** |
| (0.0000) | (0.0001) | |
| Number of days (25–30 °C) Income | 0.0011 *** | 0.0010 *** |
| (0.0002) | (0.0002) | |
| Number of days (15–20 °C) Income | 0.0032 *** | 0.0012 *** |
| (0.0007) | (0.0003) | |
| Number of days (10–15 °C) Income | 0.0022 *** | 0.0041 *** |
| (0.0001) | (0.0002) | |
| Number of days (5–10 °C) Income | 0.0008 *** | 0.0011 *** |
| (0.0000) | (0.0000) | |
| Number of days (<5 °C) Income | 0.0017 | 0.0042 * |
| (0.0011) | (0.0025) | |
| Ratio (applicants/admissions) | Yes | Yes |
| Weather Controls | Yes | Yes |
| University FE | Yes | Yes |
| City-by-year FE | Yes | Yes |
| Observation | 580 | 580 |
| R2 | 0.883 | 0.883 |
Publisher’s Note: MDPI stays neutral with regard to jurisdictional claims in published maps and institutional affiliations. |
© 2022 by the authors. Licensee MDPI, Basel, Switzerland. This article is an open access article distributed under the terms and conditions of the Creative Commons Attribution (CC BY) license (https://creativecommons.org/licenses/by/4.0/).
Share and Cite
Chen, Y.; Chen, X.; Ai, H.; Tan, X. Temperature and Migration Intention: Evidence from the Unified National Graduate Entrance Examination in China. Int. J. Environ. Res. Public Health 2022, 19, 10244. https://doi.org/10.3390/ijerph191610244
Chen Y, Chen X, Ai H, Tan X. Temperature and Migration Intention: Evidence from the Unified National Graduate Entrance Examination in China. International Journal of Environmental Research and Public Health. 2022; 19(16):10244. https://doi.org/10.3390/ijerph191610244
Chicago/Turabian StyleChen, Yan, Xiaohong Chen, Hongshan Ai, and Xiaoqing Tan. 2022. "Temperature and Migration Intention: Evidence from the Unified National Graduate Entrance Examination in China" International Journal of Environmental Research and Public Health 19, no. 16: 10244. https://doi.org/10.3390/ijerph191610244