Abstract
The felicitous tourist destination “Hills Queen” and the capital city of Himachal Pradesh, an enticing state in the Himalayan region, are met with water crisis every year and jaundice outbreaks occasionally. In 2016, there was a severe jaundice outbreak in Shimla city. In a contemporaneous investigation, we attempted to trace out the possible reason for these crises in Shimla. Samples were collected month wise from different water-supply sources and their physicochemical and microbial loads were analyzed. The microbiological examination found a totally excessive microbial load (1.064 × 10⁹ cfu/mL on common) throughout the year with a maximum (>1.98 × 10¹⁰ cfu/mL) in the wet season and minimum (>3.00 × 10⁷ cfu/mL) in the winter. Biochemical and morphological evaluation confirmed that most of the water resources reported a high number of coliforms and Gram-negative microorganisms due to sewage-water infiltration. These microorganisms in the water are responsible for the liver infection that ultimately causes jaundice. For safe and potable water, infiltration of municipal wastewater must be prevented at any cost. Scientific disposal of wastewater and purification of uncooked water have to be conducted earlier than consumption or use for different domestic functions, to avoid water crises and fetal ailment outbreaks in the near future.
1. Introduction
Water is the primary component of every living organism, with fluids derived from numerous sources on Earth. It is necessary for all known forms of life on Earth and covers 71% of the planet’s surface [1,2,3]. India is endowed with a vast range of snow-capped Himalayas and a network of rivers that contribute to the country’s water supply. Rivers play a vital role in the lives of the Indian people by providing water for drinking and various other anthropogenic activities [4,5]. There is a definite link between water availability and the prevention of numerous water-borne illnesses. Although access to clean drinking water has increased in nearly every corner of the world over the last several decades, however one billion people (globally) still lack access to drinking and sanitation [6]. The infiltration of home and industrial effluent into the water sources has degraded the available pure water. Drinking water polluted by various chemical or physical sources has the biggest impact on human health, particularly in underdeveloped nations [7]. However, it is anticipated that by 2025, more than half of the world’s population will be vulnerable to water-related hazards.
According to one of WHO’s reports, by 2030, water shortage in some developing countries may surpass 50%, resulting in 80% of water-borne or water-linked human diseases owing to biological pollution of drinking water [8]. Drinking water should ideally not include any harmful microorganisms or bacteria suggestive of fecal contaminations (increased amount of E. coli and other coliforms) [9,10]. Many cities and other rural/urban regions have had outbreaks of water-borne infections as a result of inadequate management of water supplies and poor waste disposal. Consumption of drinkable water with sewage water in the Municipal Corporation of Shimla in 2016 resulted in a jaundice epidemic, which infected more than 1600 people and reported 16 casualties [11].
Authorities halted the supply of drinking water from polluted sources (the city’s primary water sources), exacerbating Shimla’s water crisis. The epidemic was caused by a rise in fecal coliform concentrations in drinking water. Aside from jaundice, other disorders, such as ear infections, dysentery, typhoid fever, viral and bacterial gastroenteritis, and so on, are also associated with the presence of fecal coliforms such as Enterobacter, Klebsiella, Citrobacter, E.coli, etc. [12]. Regular extensive treatment and analysis of drinking water is required to keep an eye on and to minimize the microbial burden. Controlling microbiological contamination at all checkpoints might be a solution to water-borne illnesses and its link to water crises in all mega cities and significant tourist locations, such as Shimla, to prevent against any future epidemic disasters and water crises.
2. Materials and Methods
2.1. Area under Investigation
Shimla, a picturesque hill station and popular tourist destination in the Himalayas (Figure 1) faced water crisis in 2016. The city is spread out across an uneven altitude of 2100 m above sea level. This magnificent hill station is located between 31.06° N and 77.13° E. The city has a total size of 25 km2 [13,14]. Shimla’s water-supply system dates back to 1875, and additional water sources have been located to supplement the supply in order to fulfill the city’s ever-increasing demand for water. Dhalli Catchment area, Cherot Nallah, Jagroti Nallah, Chair Nallah, Gumma Khad, and Ashwani Khad pump and provide surface water from rivulets at various altitudes. The total installed capacity is 47.54 million liters. Four water treatment plants exist in Gumma Khad, Ashwani Khad, Cherot Nallah and Dhalli Catchment area.
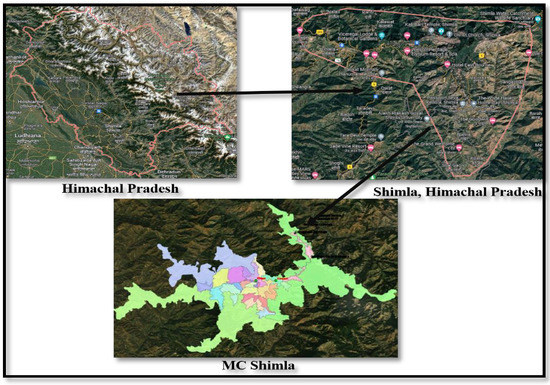
Figure 1.
Geographical location of study area.
2.2. Sample Collection
Water samples were collected as per WHO guidelines from different water-supply sources every month of one year in sterile bottles and brought to laboratory for further processing.
2.3. Analysis of Physiochemical Parameters
Various physio-chemical parameters such as temperature, pH, TDS, salt concentration, color and conductivity were recorded.
2.4. Analysis of Microbiological Load
The microbial load was analyzed by standard plate-count technique using a serial dilution agar-plate method up to 10−6-fold dilution of samples. Further, 100 µL of each dilution was spread on different basic as well as selective media (Nutrient, MacConkey, EMB, Endo) plates and incubated at 37 °C for 24 h [4]. After 24 h, the plates were analyzed for different morphological appearances on different media and then further sub-cultured to obtain pure culture by repeated streaking.
2.5. Identification of Microbes
Selected isolates were examined for various morphological as well as biochemical features such as colony morphology, Gram’s staining, methyl red, oxidase test, catalase test, glucose, lactose, maltose, sorbitol fermentation test, Vogues–Proskaure test, hydrolysis of casein, etc., following the standard protocols.
2.6. DO, BOD and COD of Collected Samples
Standard protocols were used for analysis of dissolved, biological and chemical oxygen demands [14,15].
3. Results
3.1. Collection of Samples
Samples were chronologically collected from source, i.e., raw water, to finale filtration tanks and finally to distribution points, as shown in Figure 2 of the three main water-supply sources.
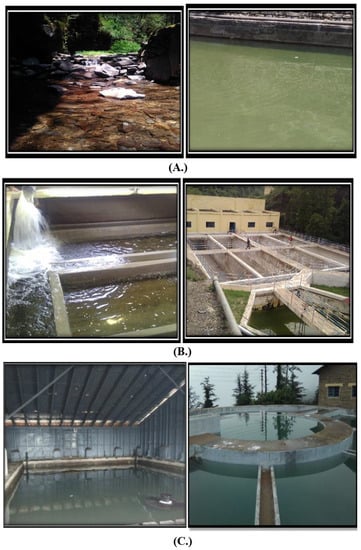
Figure 2.
Different sampling sites investigated during course of study. (A) Churat Nallah, (B) Ashwani Khad hard workers (C) Water treatment plant Dhalli.
3.2. Analysis of Physicochemical Parameters
The physical and chemical parameters of water were analyzed at the time of sampling and data generated are shown in Table 1, Table 2 and Table 3. All the water sources, i.e., Dhalli Catchment area, Cherot Nallah/Jagroti Nallah and Ashwani Khad, showed average pH (8.5), TDS (108 ppm), conductivity (131 µS) and salt (70 ppm), which were under the permitted limit of WHO norms for drinking water [10,16,17]. The above-mentioned range of parameters might be due to the presence of rocks and alkaline soil in the catchment area of water sources, but these are within the permitted limits and water is safe to use for domestic purposes. Average water temperature of all the sources was found in the range of 15–25 °C and it provides an ambient temperature for the survival of mesophilic microorganisms. This low range of temperature is due to the fact that all these water sources are fed by melting snow caps and dense forest streams. However, all these parameters are within the permitted range of WHO guidelines (Table 4), but at the same time, these factors act as add-on factors during infiltration of litter and sewage to the water sources and help in the proliferation of opportunistic pathogens.

Table 1.
Analysis of samples collected from source Churat/Jagroti Nallah.
Table 2.
Analysis of samples collected from source Ashwani Khad.
Table 3.
Analysis of samples collected from source Dhalli WTP.
Table 4.
Standard limits of different parameters in potable water.
3.3. Analysis of Microbiological Load
The standard agar-plate method was used to analyze the microbial load in the water samples. E. coli and Klebsiella sp. were most-commonly present lactose-fermenting Enterobacter, while Pseudomonas sp. and Proteus sp. were non-lactose fermenting isolates commonly present in all samples (Figure 3). More than 8.97 × 10⁹ cfu/mL of bacteria were observed in different samples based of their morphology on different media and biochemical analysis. Svanevik and Lunestad [18] also used this method to study microbial contaminations in water. During the microbial load analysis, it was found that all the water samples were heavily contaminated with microorganisms, especially opportunistic pathogens, i.e., E. coli and Pseudomonas sp., which might be responsible for the jaundice, and this microbial load was very high as compared to that of the standard limits of WHO.
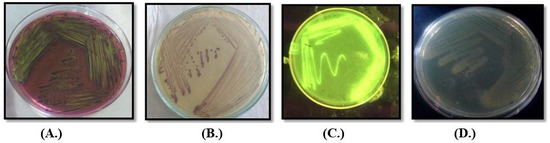
Figure 3.
Colony morphology of different microbes on different media (A.) E. coli on EMB (B.) Klebsiella on Klebsiella selective agar and (C.) Pseudomonas sp. on Kings B medium under UV transilluminator and (D.) Proteus sp. on nutrient agar.
Further, it has been also found that microbiological load was >2.25 × 10⁷ cfu/mL in January–February, >4.36 × 10⁹ cfu/mL March–April, 4.72 × 10⁹ cfu/mL May–June, >4.064 × 10¹⁰ cfu/mL July–August, September–October 5.54 × 10⁹ cfu/mL and >4.01 × 10⁹ cfu/mL in November–December. Microbiological contamination was almost similar in all the samples. E. coli and Pseudomonas sp. were prominently observed throughout the year. Presence of E. coli and Pseudomonas sp. was also even recorded in tap water. Klebsiella sp. and Proteus sp. were also reported in the Dhalli water treatment plant during rainy session, which might be due to infiltration of sewage from nearby villages/urban localities to the water streams. The standard limit is 2.7 × 10² cfu/mL [19], while the microbiological load was found to be very high as compared to standard limits. Month-wise microbiological load of all the collected samples is shown in Table 5.
Table 5.
Microbial load of different water samples.
3.4. DO, BOD and COD Analysis
DO, BOD and COD are measured by the amount of organic compounds in water. Biochemical/ biological oxygen demand is the amount of dissolved oxygen needed by a biological system in water to break down organic materials present in a given water sample at certain temperature over a specific time period. It is most commonly expressed in milligrams of oxygen consumed per liter of sample during 5 days of incubation at 20 °C and used as an index to determine organic pollution. The maximum BOD was observed in raw water of Churat Nallah, i.e., 16.8 ± 0.053 mg/L, followed by the raw water of Ashwini Khad water treatment plant (14.4 ± 0.065 mg/L). BOD value of public-tap water was in range from 0.2 to 1.0 mg/L. BOD were calculated on the basis of the difference between the DO value of the water sample on first ady and the DO value after a specific time interval (5 days).
Chemical oxygen demand (COD) is an indicative measure of the amount of oxygen that can be consumed by chemical reactions in the solution under test. It is commonly expressed in mass of oxygen consumed over volume of solution, which in SI units is milligrams per liter (mg/L). Maximum COD was observed with the raw water of Churat Nallah (0.384 ± 0.005 mg/L). Kadam and Agrawal [20] also analyzed the BOD and COD values to ensure potability of water. The DO, BOD and COD of samples are shown in Table 6. BOD and COD are measures of water contamination. The higher value of BOD indicates the presence of more biological contaminations in water [21]. The total bacterial count and the coliform density were directly related to the biochemical oxygen demand, but inversely related to the dissolved oxygen. Thus, tests for dissolved oxygen are of the utmost importance for controlling water pollution [22].
Table 6.
BOD and COD for different water samples.
4. Discussion
Different water samples were collected month-wise from different sites of the main water-supply sources of Shimla and almost all physiochemical parameters were found to be suitable for potable water according to WHO standards, except microbial load. Kistemann et al. [23] also analyzed physiochemical parameters to ensure potability of drinking water. Behailu et al. [24] also analyzes the potability of drinking water and found that the average pH of all samples was in the range 7.6–8.2. The average pH and temperature of all samples were found to be 8.5 and 19 °C, respectively. The pH and temperature of all water pumping sources were ambient and conducive for the growth of opportunistic pathogens such as E. coli, Pseudomonas sp. Klebsiella sp. and Proteus sp. etc. and resulted in higher microbial growth, which supports our findings that a microbiological load higher than that of the permissible range of water potability standards might be a possible reason for jaundice outbreak in Shimla. Further, shortage in the rainfall intensified the issue and increases the concentration of microbes in the water sources, resulting in water shortage and crisis in the hill region. The observed TDS in the present study was varied from 75 to 225 ppm. According to the WHO, the TDS standard for drinking water is <1000 ppm. The collective amount of all dissolved cation and anions in the water is known as TDS and it is mainly associated with conductivity [25]. High TDS increases the density of water, decreases solubility of gases such as oxygen, and ultimately makes the water unsuitable for drinking [26]. The measure of competence of water to pass electrical flow is its conductivity, which is directly related to the concentration of ions in water coming from dissolved salts and inorganic materials such as alkalis, chlorides, sulfides and carbonate compounds. Conductivity of drinking water is in the range of 5–50 mS/m, (5,000,000 μS/m) [27]. Conductivity was found to be high in the month of July to September when microbial load was high. Increase in conductivity leads to increase in microbial load as minerals and matter provide necessary metabolites and factors for the rapid growth of microorganisms [28]. The lower TDS and conductivity ensure the potability of water.
BOD and COD of water samples were also analyzed using standard protocol and were found to be higher than the permissible limit. E. coli and Pseudomonas sp. were prominently observed in all the samples throughout the year. Both of these bacteria are opportunistic pathogens for humans. E. coli is an indicator organism of water pollution. Water was highly contaminated with Klebsiella sp. in the months of June, July, August and September. Onyango et al. [29] also reported presence of E. coli and other coliforms in drinking water during their study. Presence of E. coli or fecal contaminants in water is the main cause for the outbreak of jaundice [30,31]. According to a report [32], the DO of drinking water must be in the range 2–5 mg/L, BOD of drinking water 2–10 mg/L and COD 5–10 mg/L. According to a report [33], the jaundice epidemic in 2016 was caused by contaminated water from Ashwami Khad, from where Shimla used to acquire its largest share of water. After the report of jaundice cases, government officials stopped the water supply from these contaminated water sources, which increased the water shortage in the city and ultimately deepened the water crisis.
5. Conclusions and Future Perspectives
All the water distribution channels in Shimla were badly contaminated with various opportunistic pathogens, as revealed through our investigation. Fortunately, much less contamination appeared in the distribution line after treatment, but microbial load was still beyond the permitted limit. Results of this research could help the MC/IPH officials to take remediate measures in good time. Authorities should also look for alternative water sources to prevent any water crisis in the future that may also arise due to a shortage of rainfall in the catchment areas. The efforts will also help to establish a cleaning schedule for the MC water-supply sources and create proper wastewater treatment facilities for the villages/towns situated nearby the catchment areas, to prevent the infiltration of domestic and industrial sewage, which will help to provide safe drinking water to the consumers in MC Shimla. Moreover, based upon our findings, the MC/IPH department may install a heavy-duty UV system to control the heavy microbial load. Using these recommended corrective measures, such future disasters could be avoided, and the public of such areas will have potable drinking water free from all types of contaminants and opportunistic pathogens.
Author Contributions
R.K.R.: Conceptualization, Data curation, Formal analysis, Validation, Visualization, and Writing-original draft, Writing- review & editing, D.S.: Data curation, Formal analysis, R.K.B.: Conceptualization, Methodology, Formal analysis, Writing- review & editing, A.K.B.: Formal analysis, Funding acquisition, Investigation. All authors have read and agreed to the published version of the manuscript.
Funding
This research was funded by SCSTE Govt. of H.P. This research was funded by HIMCOSTE, Govt. of Himachal Pradesh, grant number [SCST/E (8)-1/2016-Vol-1, 5517].
Institutional Review Board Statement
Not applicable.
Informed Consent Statement
Not applicable.
Data Availability Statement
Not applicable.
Acknowledgments
Authors are highly thankful to for funding this study and providing financial assistance in the form of project fellow to Ranju Kumari Rathour. The facilities availed from Department of biotechnology are duly acknowledged.
Conflicts of Interest
The authors declare no conflict of interest.
References
- Gleick:, P.H. Water in Crisis: A Guide to the World’s Freshwater Resources; Oxford University Press: Oxford, UK, 1993; p. 13. [Google Scholar]
- Liu, J.; Zhao, M.; Yao, L.; Liu, W.; Fan, G. Evaluating the value of ecological water considering water quality and quantity simultaneously. Water Environ. J. 2020, 34, 635–647. [Google Scholar] [CrossRef]
- Hasan, H.A.; Muhammad, M.H. A review of biological drinking water treatment technologies for contaminants removal from polluted water resources. J. Water Process Eng. 2020, 33, 101035. [Google Scholar] [CrossRef]
- Antony, R.M.; Renuga, F.B. Microbiological analysis of drinking water quality of Ananthanar channel of Kanyakumari district, Tamil Nadu, India. Rev. Ambiente Agua 2012, 7, 42–48. [Google Scholar] [CrossRef]
- Kaur, J.; Kaur, H. Water potability test of drinking water collected from sub regions of district Jalandhar, Punjab, India: A Review. Int. Res. J. Biol. Sci. 2015, 4, 62–65. [Google Scholar]
- Akoto, O.; Adiyiah, J. Chemical analysis of drinking water from some communities in the Brong Ahafo region. Int. J. Environ. Sci. Technol. 2007, 4, 211–214. [Google Scholar] [CrossRef]
- Palamuleni, L.; Akoth, M. Physico-chemical and microbial analysis of selected borehole water in Mahikeng, South Africa. Int. J. Environ. Res. Public Health 2015, 12, 8619–8630. [Google Scholar] [CrossRef] [PubMed]
- World Health Organization (W.H.O.). Guidelines for Drinking Water Quality Geneva 2006; Report No: WHO/SDE/WSH 06.07; WHO: Geneva, Switzerland, 2006. [Google Scholar]
- Estim, A.; Saufie, S.; Mustafa, S. Water quality remediation using aquaponics sub-systems as biological and mechanical filters in aquaculture. J. Water Process Eng. 2019, 30, 100566. [Google Scholar] [CrossRef]
- World Health Organization (W.H.O.). Guidelines for Drinking Water Quality, Geneva, 2004; Report No: WHO/SDE/WSH; WHO: Geneva, Switzerland, 2004; Available online: http://apps.who.int/iris/bitstream/handle/10665/42852/9241546387.pdf;jsessionid=30E7F64DE4C472C1F29E09A2034DDD15?sequence=1 (accessed on 26 July 2022).
- Bodh, A. Jaundice Outbreak Reaching Epidemic Proportions in Shimla. A Report, The Times of India. 2016. Available online: https://timesofindia.indiatimes.com/city/shimla/Jaundice-outbreak-reaching-epidemic-proportions-in-Shimla/articleshow/50517708.cms (accessed on 26 July 2022).
- Fresno County Department of Public Health (F.C.A.). E. coli or Fecal Coliform Bacteria Contamination in Your Water Supply. 2009. Available online: https://www.co.fresno.ca.us/home/showdocument?id=4747 (accessed on 26 July 2022).
- Shimla Municipal Corporation. (S.M.C.). 2007. Available online: https://web.archive.org/web/20070403005805/http://www.shimlamc.org/mcshimla.htm (accessed on 26 July 2022).
- Shimla District Census (S.D.C.). 2011 Handbook (PDF). Census of India. (Urban Section). 2016. Available online: https://censusindia.gov.in/nada/index.php/catalog/483/download/1580/DH_2011_0211_PART_B_DCHB_SHIMLA.pdf (accessed on 26 July 2022).
- Delzer, G.C.; McKenzie, S.W. Five-day biochemical oxygen demand. In USGS TWRI Book 9-a7, 3rd ed.; U.S. Geological Survey: Reston, VA, USA, 2003; pp. 11–20. [Google Scholar]
- Belkin, S.; Brenner, A.; Abeliovich, A. Effect of inorganic constituents on chemical oxygen demand-I. Bromides are unneutralizable by mercuric sulfate complexation. Water Res. 1992, 26, 1577–1581. [Google Scholar] [CrossRef]
- IS 10500-1991; Indian Standard for Drinking Water as per BIS Specifications. A Report: 010-03-21. Bureau of Indian Standards (B.I.S.): Old Delhi, India, 1991; Volume 23, p. 25.
- Svanevik, C.S.; Lunestad, B.T. Microbiological water examination during laboratory courses generates new knowledge for students, scientists and the government. FEMS Microbiol. Lett. 2015, 362, 151. [Google Scholar] [CrossRef] [PubMed]
- European Commission Council Directive (E.C.C.D.). 2006/7/EC of the European Parliament and of the Council of 15 February 2006 Concerning the Management of Bathing Water Quality and Repealing Directive 76/160/EECOJ. 2006. Available online: https://eur-lex.europa.eu/legal-content/EN/TXT/PDF/?uri=CELEX:32006L0007&from=EN (accessed on 26 July 2022).
- Kadam, S.S.; Agrawal, B.A. Microbiology and physico-chemical analysis of different sources of drinking water in Dahanu Taluka of Thane district. Eur. J. Exp. Biol. 2015, 5, 13–22. [Google Scholar]
- Kedra, M. Sensitivity of mountain catchments to global warming: A case study of the San Basin, Poland. Water Environ. J. 2020. [Google Scholar] [CrossRef]
- Olutiola, P.O.; Awojobi, K.O.; Oyedeji, O.; Ayansina, A.D.; Cole, O.O. Relationship between bacterial density and chemical composition of a tropical sewage oxidation pond. Afr. J. Environ. Sci. Technol. 2010, 4, 595–602. [Google Scholar]
- Kistemann, T.; Claben, T.; Koch, C.; Dangendorf, F.; Fischeder, R.; Gebel, J.; Vacata, V.; Exner, M. Microbial load of drinking water reservoir tributaries during extreme rainfall and runoff. Appl. Environ. Microbiol. 2002, 68, 2188–2197. [Google Scholar] [CrossRef] [PubMed] [Green Version]
- Behailu, T.W.; Badessa, T.S.; Tewodros, B.A. Analysis of physical and chemical parameters in ground water used for drinking around Konso Area, Southwestern Ethiopia. J. Anal. Bioanal. Tech. 2017, 8, 379. [Google Scholar]
- Guimaraes, J.T.; Souza, A.L.; Brígida, A.I.S.; Furtado, A.A.; Chicrala, P.C.; Santos, V.R.; Mesquita, E.F. Quantification and characterization of effluents from the seafood processing industry aiming at water reuse: A pilot study. J. Water Process Eng. 2018, 6, 138–145. [Google Scholar] [CrossRef]
- Asadullah, A.; Nisa, K.; Khan, S.I. Physico-chemical properties of drinking water available in educational institutes of Karachi city. Sci. Tech. Dev. 2013, 32, 28–33. [Google Scholar]
- Gray, R.J. Conductivity analyzers and their application. In Environ Instrumentation and Analysis Handbook; Wiley: Hoboken, NJ, USA, 2004; pp. 491–510. [Google Scholar]
- Kaptan, B.; Kayisoglu, S.; Demirci, M. The relationship between some physico-chemical, microbiological characteristics and electrical conductivity of milk stored at different temperature. J. Tekirdag Agri. Faculty 2011, 8, 13–20. [Google Scholar]
- Onyango, A.E.; Okoth, M.W.; Kunyanga, C.N.; Aliwa, B.O. Microbiological Quality and Contamination Level of Water Sources in Isiolo County in Kenya. J. Environ. Public Health 2018, 10, 2139867. [Google Scholar] [CrossRef] [PubMed] [Green Version]
- Jaiswal, B.E. Coli Cause of Jaundice Outbreak in Cuttack. TNN. 2017. Available online: https://timesofindia.indiatimes.com/city/cuttack/e-coli-cause-of-jaundice-outbreak-in-cuttack/articleshow/56523999.cms (accessed on 26 July 2022).
- Sharma, A. Jaundice outbreak in Shimla: 10 Dead. The Indian Express. 2016. Available online: https://indianexpress.com/article/india/india-news-india/jaundice-outbreak-in-shimla-10-dead (accessed on 26 July 2022).
- UNESCO/WHO/UNE. Water Quality Assessments—A guide to Use of Biota, Sediments and Water in Environmental Monitoring -2nd Edition. Selection of Water Quality Variables. 1996. Available online: http://www.earthprint.com (accessed on 26 July 2022).
- Chatterji, R. Shimla Water Crisis Explained: Sewage Contaminated a Stream, a Jaundice Outbreak Followed, then a High Court Order Left the City High and Dry 2018. Available online: https://www.huffpost.com/archive/in/entry/shimla-water-crisis-explained-sewage-contaminated-a-stream-a-jaundice-outbreak-followed-then-a-high-court-order-left-the-city-high-and-dry_a_23451060 (accessed on 26 July 2022).
Publisher’s Note: MDPI stays neutral with regard to jurisdictional claims in published maps and institutional affiliations. |
© 2022 by the authors. Licensee MDPI, Basel, Switzerland. This article is an open access article distributed under the terms and conditions of the Creative Commons Attribution (CC BY) license (https://creativecommons.org/licenses/by/4.0/).