The Spatiotemporal Evolution and Influencing Factors of the Chinese Cities’ Ecological Welfare Performance
Abstract
:1. Introduction
2. Literature Review
3. Index Construction, Methods, and Data Sources
3.1. Index Construction
3.2. Research Methods
3.2.1. Super-SBM-DEA Model
3.2.2. Theil Index
3.2.3. Spatial Autocorrelation
3.2.4. Spatial Durbin Model
3.3. Data Sources and Regional Division
4. Results
4.1. Temporal Evolution of China’s EWP
4.2. Spatial Distribution of Cities’s EWP in China
4.2.1. Regional Distribution
4.2.2. Cities’ Distribution
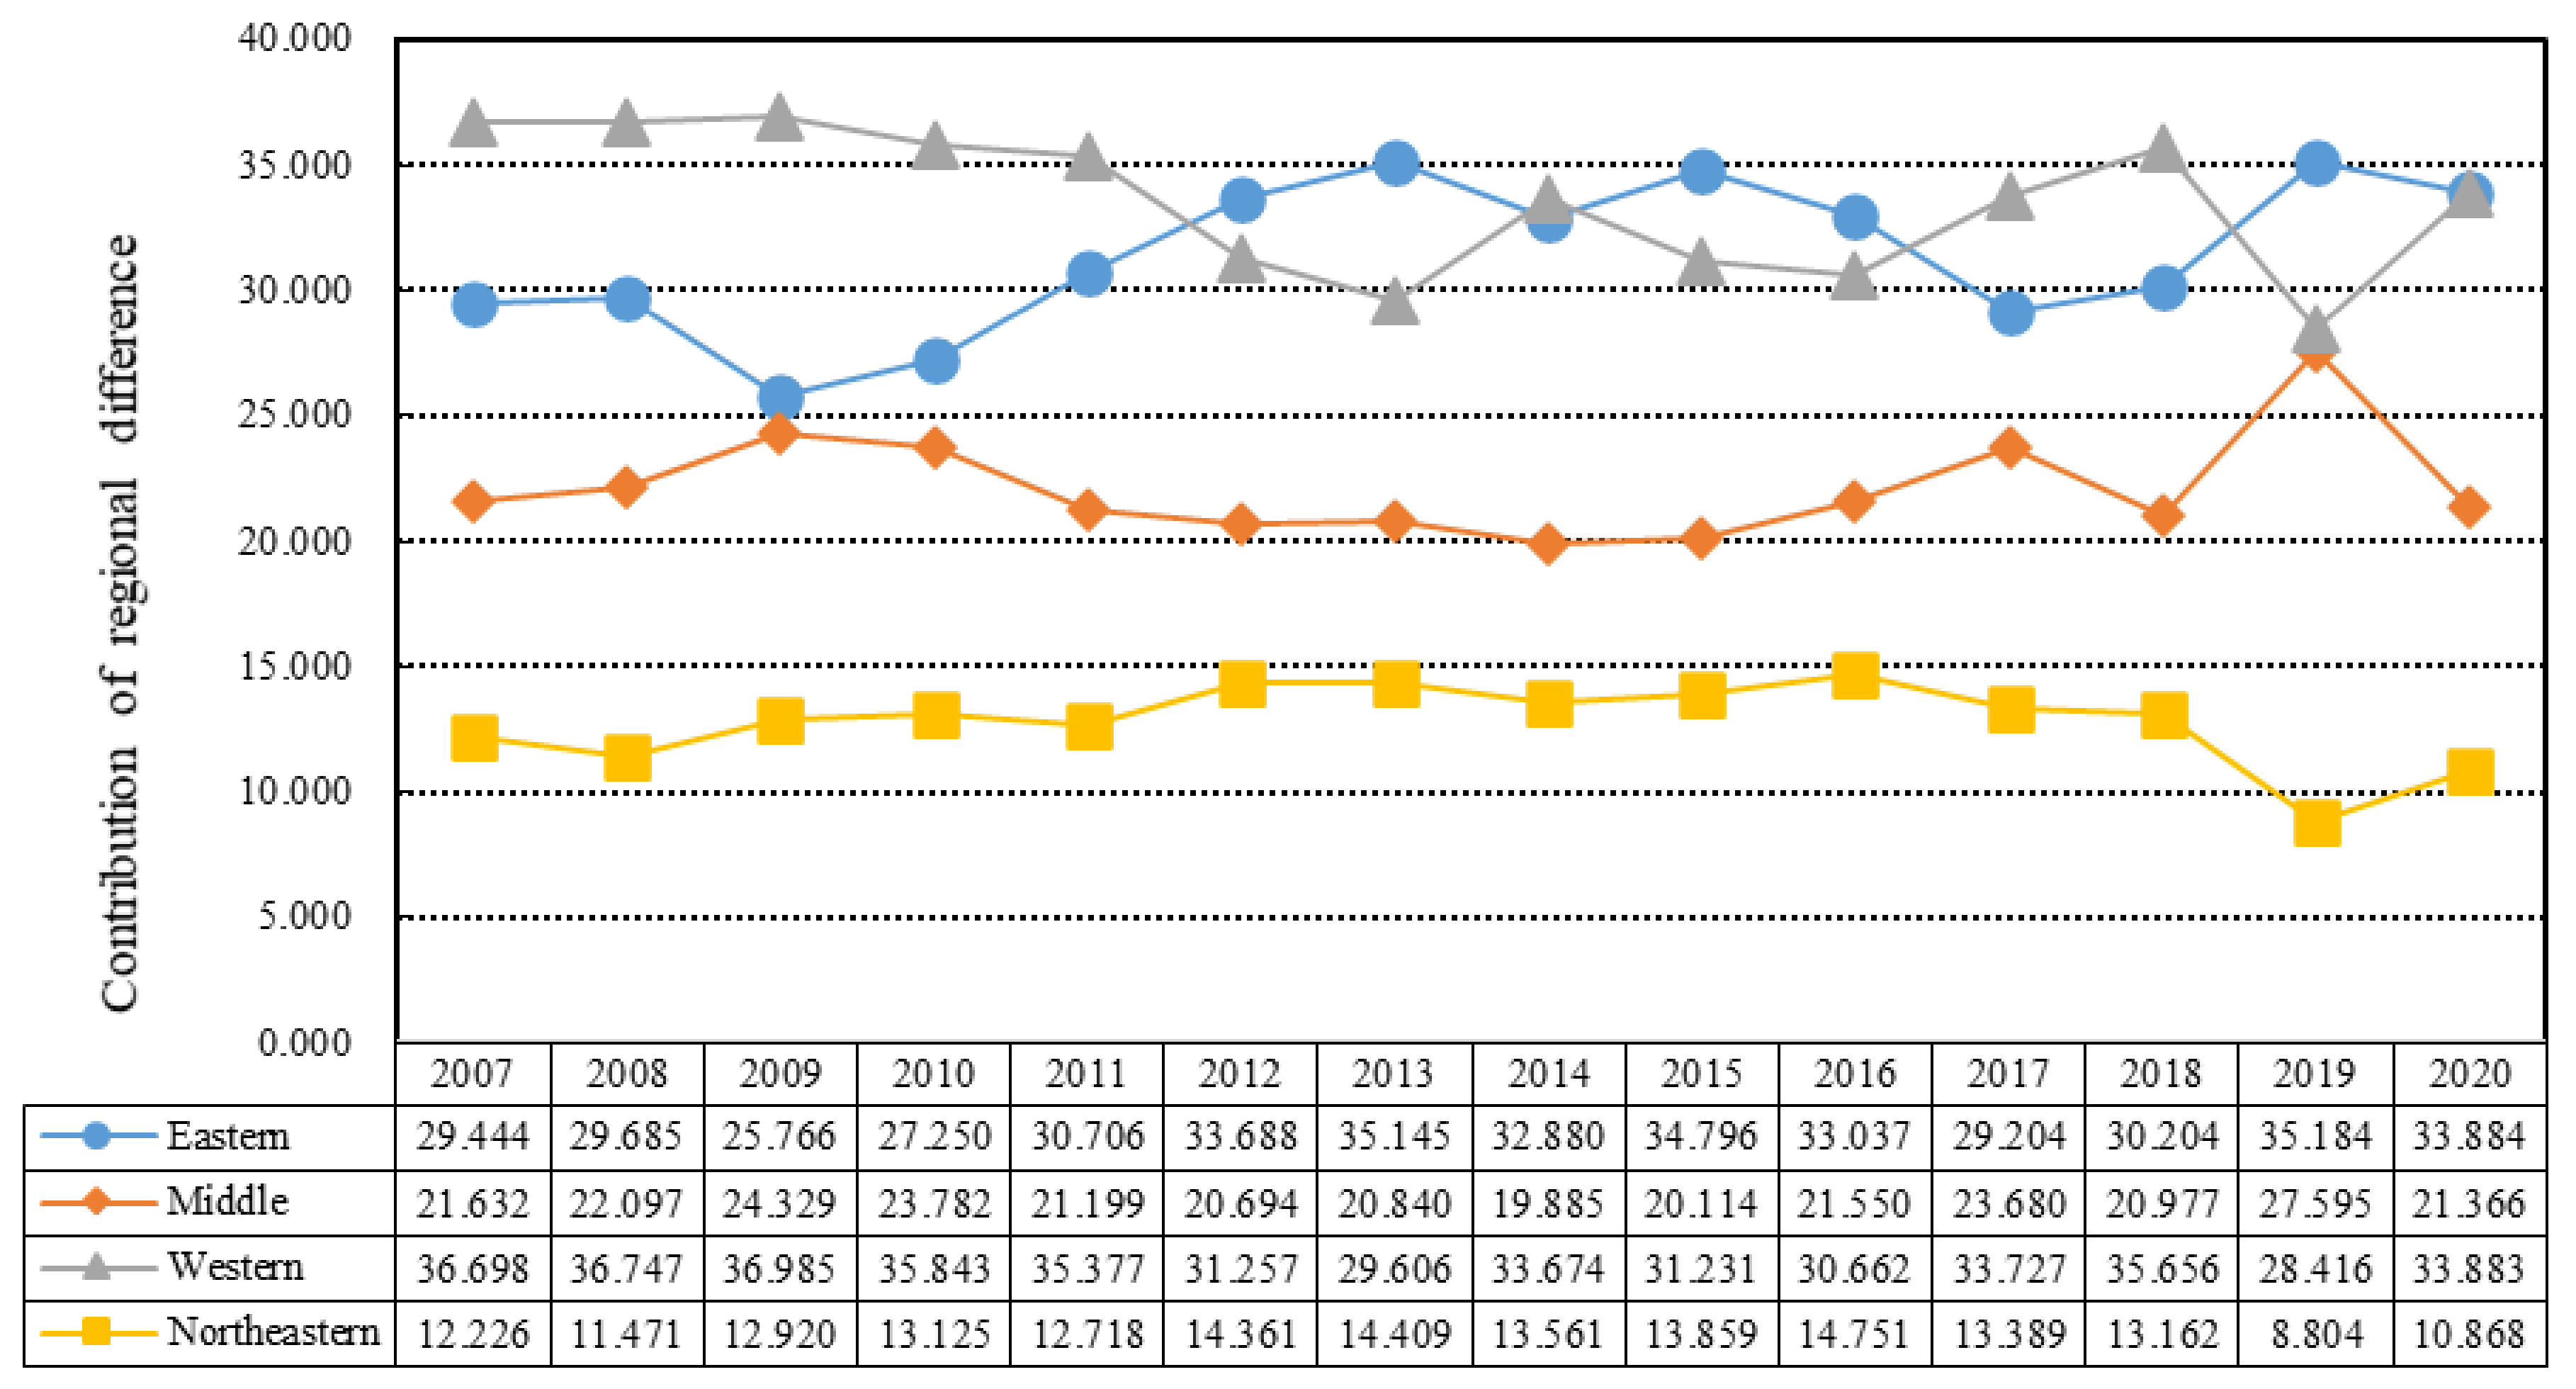
4.3. Regional Differences in China’s EWP
4.4. Spatial Autocorrelation of Cities’s EWP in China
4.4.1. Global Spatial Autocorrelation Analysis
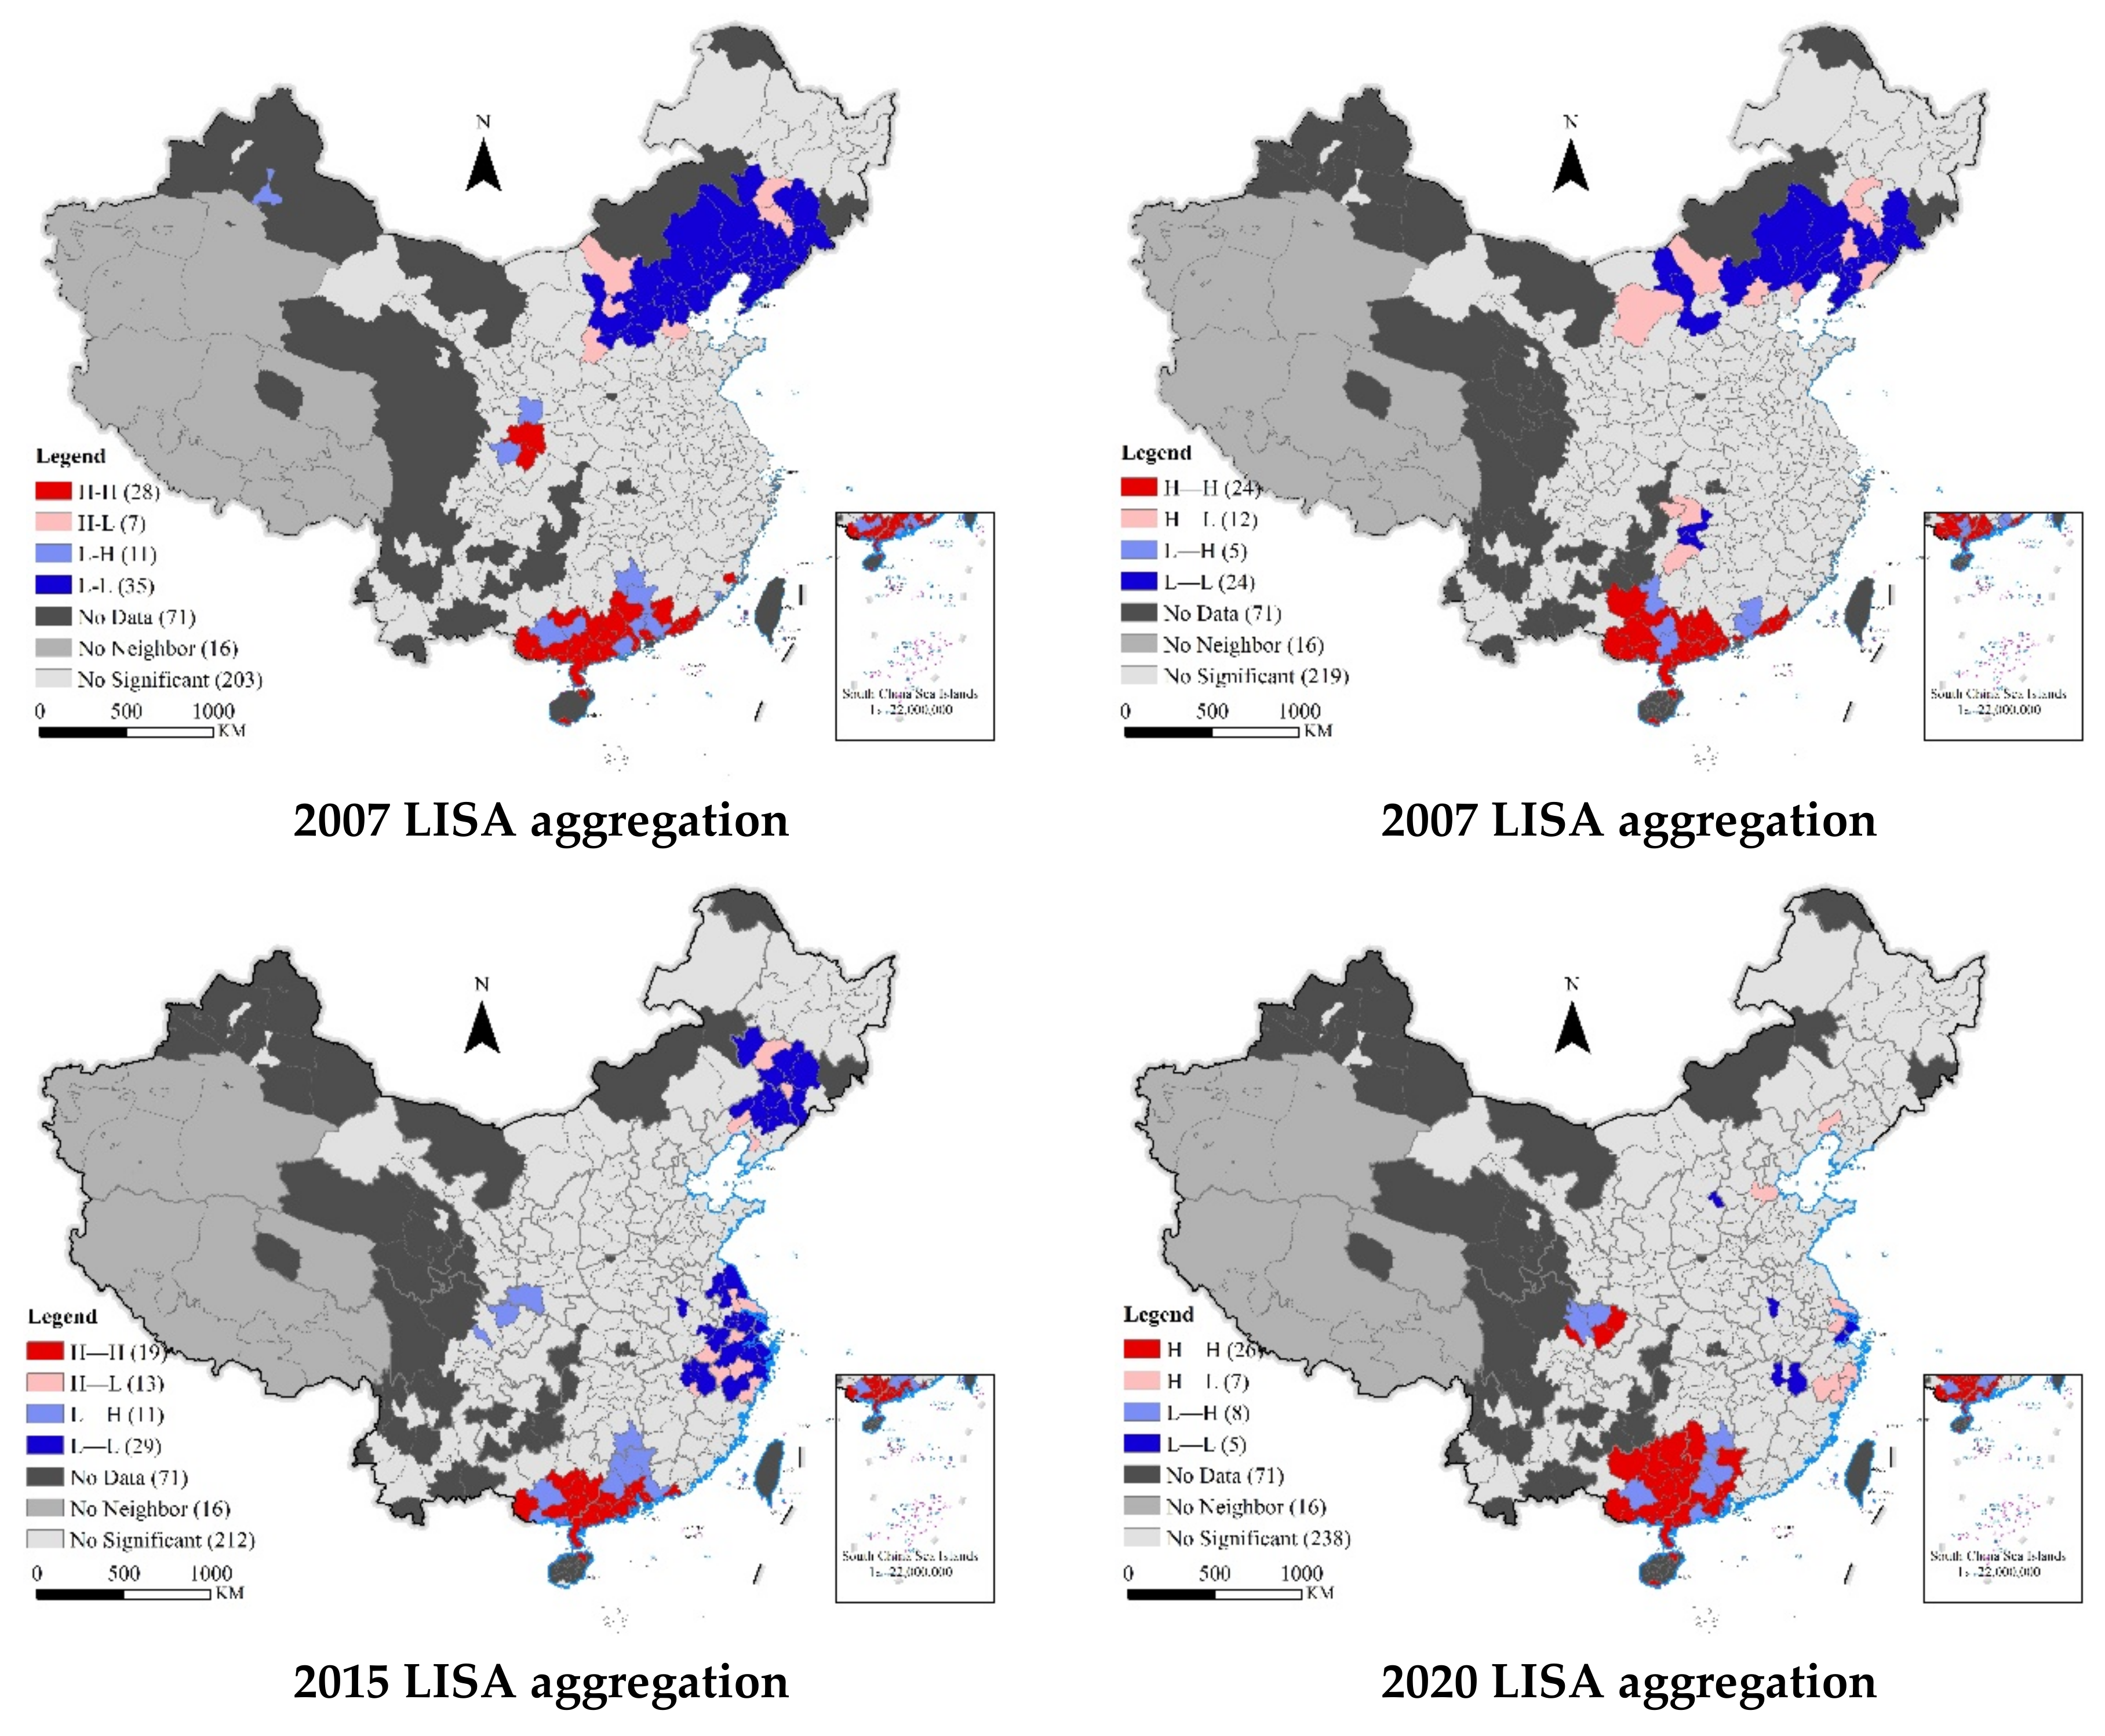
4.4.2. Local Spatial Autocorrelation Analysis
4.5. Influencing Factors of Cities’s EWP in China
4.5.1. Variable Selection and Interpretation
4.5.2. Analysis of Empirical Results
- (1)
- The level of financial development had a significant effect on the cities’ EWP. The regression coefficient of the level of financial development was 0.026, significant at the 1% confidence level. The spatial lag coefficient was 0.186, significant at the 1% confidence level, indicating that the financial development level of neighboring cities can also drive the improvement of local EWP, and there was a spatial spillover effect. A high level of financial development means that enterprises can achieve good development by building a market-risk-sharing mechanism, thus driving economic growth and welfare levels and promoting cities’ EWP.
- (2)
- The regression coefficient of industrial structure to cities’ EWP was 0.001, significant at the 10% confidence level. The spatial lag coefficient was −0.008, but this was not significant. This shows that the secondary industry structure can effectively improve EWP. Although secondary industry brings environmental pollution, it has high production efficiency and rapid technological progress, which can quickly drive economic growth. Therefore, the proportion of secondary industry can promote EWP. The proportion of the secondary industry in neighboring cities had a negative impact on local EWP, but this was not significant.
- (3)
- The regression coefficient of fiscal revenue decentralization on cities’ EWP was −0.211, significant at the 1% confidence level. The regression coefficient of the spatial lag term was 1.363, significant at the 10% confidence level. This indicates that fiscal decentralization may lead to competition among local governments, cause environmental pollution, and then inhibit the improvement of EWP in local cities. However, fiscal revenue decentralization in neighboring cities does not affect local EWP. The regression coefficient of fiscal expenditure decentralization on cities’ EWP was −0.161, and the result was not significant. The spatial lag term was −0.446, and the result was not significant. This shows that the impact of local fiscal expenditure decentralization on local EWP, and on local EWP in neighboring cities, can be ignored.
- (4)
- The regression coefficient of innovation level on cities’ EWP was 0.002, and the result was not significant. The spatial lag regression coefficient was −0.067, and the result was not significant. This indicates that technological progress did not improve local EWP or that of neighboring cities. This shows that the current level of innovation has not played a full role in promoting the economy and reducing environmental pollution. In the future, to promote cities’ EWP it will be necessary to increase the research and development of green innovative technologies.
- (5)
- The regression coefficient of opening up on EWP was 0.292, which is significant at the 10% level, indicating that the hypothesis of “pollution paradise” is untenable. The spatial lag coefficient was 2.150, but was not significant. This shows that opening up can promote the local EWP of cities. Opening up can promote the EWP by promoting employment and improving welfare levels and economic development, but the opening up of neighboring cities did not significantly improve the local EWP.
- (6)
- The regression coefficient of urbanization on EWP was 0.002, significant at the 1% confidence level. The spatial lag coefficient was −0.006, but was not significant. This shows that urbanization can narrow the gap between cities and rural areas, drive economic growth, improve the level of welfare. and promote the improvement of local EWP. The spatial spillover effect was not significant, i.e., the urbanization of neighboring cities did not significantly inhibit the improvement of local EWP.
5. Discussion and Conclusions
5.1. Discussion
5.2. Conclusions
5.3. Implications
Author Contributions
Funding
Institutional Review Board Statement
Informed Consent Statement
Data Availability Statement
Conflicts of Interest
References
- Wang, N.; Zhang, T.; Wang, E.; Song, T.; Lu, X.; Su, J. Dynamic Correlation between Industry Greenization Development and Ecological Balance in China. Sustainability 2020, 12, 8329. [Google Scholar] [CrossRef]
- Sachs, J.D. From Millennium Development Goals to Sustainable Development Goals. Lancet 2012, 379, 2206–2211. [Google Scholar] [CrossRef]
- Costanza, R.; Daly, L.; Fioramonti, L.; Giovannini, E.; Kubiszewski, I.; Mortensen, L.F.; Pickett, K.E.; Ragnarsdottir, K.V.; De Vogli, R.; Wilkinson, R. Modelling and Measuring Sustainable Wellbeing in Connection with the UN Sustainable Development Goals. Ecol. Econ. 2016, 130, 350–355. [Google Scholar] [CrossRef]
- Wang, S.; Fan, F. The efficiency of China’s sustainable development and its influence mechanism of scientific and technological innovation. J. Dalian Univ. Technol. 2022, 43, 41–50. [Google Scholar] [CrossRef]
- Behjat, A.; Tarazkar, M.H. Investigating the Factors Affecting the Ecological Well-Being Performance in Iran from 1994 to 2014. Environ. Dev. Sustain. 2021, 23, 13871–13889. [Google Scholar] [CrossRef]
- Hou, J.; Ruan, X.; Lv, J.; Guo, H. Two-Stage Super-Efficiency Slacks-Based Model to Assess China’s Ecological Wellbeing. Int. J. Environ. Res. Public Health 2020, 17, 7045. [Google Scholar] [CrossRef]
- Li, N.; Feng, C.; Shi, B.; Kang, R.; Wei, W. Does the Change of Official Promotion Assessment Standards Contribute to the Improvement of Urban Environmental Quality? J. Clean. Prod. 2022, 348, 131254. [Google Scholar] [CrossRef]
- Li, W.; Yi, P. Assessment of City Sustainability—Coupling Coordinated Development among Economy, Society and Environment. J. Clean. Prod. 2020, 256, 120453. [Google Scholar] [CrossRef]
- Song, Y.; Mei, D. Sustainable Development of China’s Regions from the Perspective of Ecological Welfare Performance: Analysis Based on GM(1,1) and the Malmquist Index. Environ. Dev. Sustain. 2022, 24, 1086–1115. [Google Scholar] [CrossRef]
- Kassouri, Y.; Altıntaş, H. Human Well-Being versus Ecological Footprint in MENA Countries: A Trade-Off? J. Env. Manag. 2020, 263, 110405. [Google Scholar] [CrossRef]
- Bian, J.; Ren, H.; Liu, P. Evaluation of Urban Ecological Well-Being Performance in China: A Case Study of 30 Provincial Capital Cities. J. Clean. Prod. 2020, 254, 120109. [Google Scholar] [CrossRef]
- Daly, H.E. Economics for a Full World. Sci. Am. 2005, 293, 100–10716. [Google Scholar] [CrossRef]
- Luo, N.; Li, J.; Luo, F. Empirical Analysis on the Relationship Between the China Urbanization and Regional Eco-efficiency. China Popul. Resour. Environ. 2013, 23, 53–60. (In Chinese) [Google Scholar] [CrossRef]
- Cheng, J.; Sun, Q.; Guo, M.; Xu, W. Regional differences and dynamic evolution of ecological efficiency in China. China Popul. Resour. Environ. 2014, 24, 47–54. (In Chinese) [Google Scholar]
- Feng, Y.; Zhong, S.; Li, Q.; Zhao, X.; Dong, X. Ecological Well-Being Performance Growth in China (1994–2014): From Perspectives of Industrial Structure Green Adjustment and Green Total Factor Productivity. J. Clean. Prod. 2019, 236, 117556. [Google Scholar] [CrossRef]
- Hu, M.; Sarwar, S.; Li, Z. Spatio-Temporal Differentiation Mode and Threshold Effect of Yangtze River Delta Urban Ecological Well-Being Performance Based on Network DEA. Sustainability 2021, 13, 4550. [Google Scholar] [CrossRef]
- Yao, L.; Yu, Z.; Wu, M.; Ning, J.; Lv, T. The Spatiotemporal Evolution and Trend Prediction of Ecological Wellbeing Performance in China. Land 2020, 10, 12. [Google Scholar] [CrossRef]
- Ma, L.; Hong, Y.; Chen, X. Can Green Economy and Ecological Welfare Achieve Synergistic Development? The Perspective of the “Two Mountains” Theory. Int. J. Environ. Res. Public Health 2022, 19, 6460. [Google Scholar] [CrossRef]
- Bian, J.; Zhang, Y.; Shuai, C.; Shen, L.; Ren, H.; Wang, Y. Have Cities Effectively Improved Ecological Well-Being Performance? Empirical Analysis of 278 Chinese Cities. J. Clean. Prod. 2020, 245, 118913. [Google Scholar] [CrossRef]
- Xia, M.; Li, J. Assessment of Ecological Well-Being Performance and Its Spatial Correlation Analysis in the Beijing-Tianjin-Hebei Urban Agglomeration. J. Clean. Prod. 2022, 362, 132621. [Google Scholar] [CrossRef]
- Zhu, D.; Zhang, S. Research on Ecological Welfare performance and deepening sustainable development. J. Tongji Univ. 2014, 25, 106–115. (In Chinese) [Google Scholar]
- Verhofstadt, E.; Van Ootegem, L.; Defloor, B.; Bleys, B. Linking Individuals’ Ecological Footprint to Their Subjective Well-Being. Ecoll. Econ. 2016, 127, 80–89. [Google Scholar] [CrossRef]
- Cordero, J.M.; Polo, C.; Salinas-Jiménez, J. Subjective Well-Being and Heterogeneous Contexts: A Cross-National Study Using Semi-Nonparametric Frontier Methods. J. Happiness Stud. 2021, 22, 867–886. [Google Scholar] [CrossRef]
- Raudsepp-Hearne, C.; Peterson, G.D.; Tengö, M.; Bennett, E.M.; Holland, T.; Benessaiah, K.; MacDonald, G.K.; Pfeifer, L. Untangling the Environmentalist’s Paradox: Why Is Human Well-Being Increasing as Ecosystem Services Degrade? BioScience 2010, 60, 576–589. [Google Scholar] [CrossRef]
- Yin, K.; Wang, R.; Zhou, C.; Liang, J. Review of eco-efficiency accounting method and its applications. Acta Ecol. Sin. 2012, 32, 3595–3605. (In Chinese) [Google Scholar] [CrossRef]
- Bian, J.; Lan, F.; Zhou, Y.; Peng, Z.; Dong, M. Spatial and Temporal Evolution and Driving Factors of Urban Ecological Well-Being Performance in China. Int. J. Environ. Res. Public Health 2022, 19, 9996. [Google Scholar] [CrossRef] [PubMed]
- Long, L.; Wang, X. Study on performance evaluation of Ecological Welfare in Shanghai. China Popul. Resour. Environ. 2017, 27, 84–92. (In Chinese) [Google Scholar]
- Wang, Z.; Wang, Z. Spatial pattern evolution and influencing factors of Ecological Welfare performance in the Yangtze River Economic Belt—Based on super efficiency SBM model. Resour. Environ. Yangtze Basin 2021, 30, 2822–2832. (In Chinese) [Google Scholar]
- Li, C.; Zhang, S.; Zhang, W.; Liao, X. A study on the performance measurement and influencing factors of inter provincial Ecological Welfare in China. Sci. Geogr. Sin. 2019, 39, 1875–1883. (In Chinese) [Google Scholar] [CrossRef]
- Cao, N.; Zhao, L. Analysis of the Spatial-temporal Pattern and Influencing Factors of Ecological Welfare Performance in Shandong Province. Resour. Dev. Mark. 2021, 37, 787–792+819. (In Chinese) [Google Scholar]
- Dyckho, H.; Allen, K. Measuring Ecological Efficiency with Data Envelopment Analysis (DEA). Eur. J. Oper. Res. 2001, 132, 312–325. [Google Scholar] [CrossRef]
- Liu, X.; Zhuang, X. Measurement of Ecological Welfare performance level and analysis of influencing factors of urban agglomeration in China. J. Tech. Econ. Manag. 2022, 43, 10–15. (In Chinese) [Google Scholar]
- Zhang, S.; Zhu, D.; Shi, Q.; Cheng, M. Which Countries Are More Ecologically Efficient in Improving Human Well-Being? An Application of the Index of Ecological Well-Being Performance. Resour. Conserv. Recycl. 2018, 129, 112–119. [Google Scholar] [CrossRef]
- Zhang, Y.; Mao, Y.; Jiao, L.; Shuai, C.; Zhang, H. Eco-Efficiency, Eco-Technology Innovation and Eco-Well-Being Performance to Improve Global Sustainable Development. Environ. Impact Assess. Rev. 2021, 89, 106580. [Google Scholar] [CrossRef]
- Da Silva, J.M.C.; Li, H.; Barbosa, L.C.F. The Ecological Intensity of Human Well-Being at the Local Level. Environ. Sustain. Indic. 2020, 8, 100061. [Google Scholar] [CrossRef]
- Xu, Z.; Xu, W.; Liu, C. Dynamic evolution of urban ecological welfare performance and its influencing factors—a case study of cities at prefecture level and above in the Yellow River Basin. Urban Probl. 2021, 40, 52–60. (In Chinese) [Google Scholar] [CrossRef]
- Wang, S.; Duan, L.; Jiang, S. Research on Spatial Differences and Driving Effects of Ecological Well-Being Performance in China. Int. J. Environ. Res. Public Health 2022, 19, 9310. [Google Scholar] [CrossRef]
- Long, X.; Yu, H.; Sun, M.; Wang, X.-C.; Klemeš, J.J.; Xie, W.; Wang, C.; Li, W.; Wang, Y. Sustainability Evaluation Based on the Three-Dimensional Ecological Footprint and Human Development Index: A Case Study on the Four Island Regions in China. J. Environ. Manag. 2020, 265, 110509. [Google Scholar] [CrossRef]
- Sweidan, O.D. Economic Performance and Carbon Intensity of Human Well-Being: Empirical Evidence from the MENA Region. J. Environ. Plan. Manag. 2018, 61, 699–723. [Google Scholar] [CrossRef]
- Cheng, G.; Wang, C. Scientific and technological innovation and regional ecological welfare performance under environmental decentralization. E China Econ. Manag. 2022, 36, 44–54. [Google Scholar]
- Wang, X.; Luo, J. Study on the ecological welfare performance and time-space evolution of Beijing Tianjin Hebei. Sci. Technol. Manag. Res. 2020, 40, 249–255. (In Chinese) [Google Scholar]
- Dietz, T.; Rosa, E.A.; York, R. Environmentally Efficient Well-Being: Rethinking Sustainability as the Relationship between Human Well-Being and Environmental Impacts. Hum. Ecol. Rev. 2009, 16, 114–123. [Google Scholar]
- Costanza, R.; d’Arge, R.; de Groot, R.; Farber, S.; Grasso, M.; Hannon, B.; Limburg, K.; Naeem, S.; O’Neill, R.V.; Paruelo, J.; et al. The Value of the World’s Ecosystem Services and Natural Capital. Nature 1997, 387, 253–260. [Google Scholar] [CrossRef]
- Xu, W.; Xu, Z.; Liu, C. Coupling analysis of land intensive use efficiency and ecological well-being performance of cities in the Yellow River Basin. J. Nat. Resour. 2021, 36, 114–130. (In Chinese) [Google Scholar] [CrossRef]
- Xiao, L.; Zhang, X. Spatio-temporal characteristics of coupling coordination between green innovation efficiency and ecological welfare performance under the concept of strong sustainability. J. Nat. Resour. 2019, 34, 312–324. (In Chinese) [Google Scholar] [CrossRef]
- Xie, H.; Shan, H. Study on the influencing factors and regional differences of urban public utilities fixed assets investment—Based on the inter provincial panel data of Hebei Province from 2001 to 2010. Econ. Probl. 2013, 35, 109–113. (In Chinese) [Google Scholar] [CrossRef]
- Hu, M.; Li, Z.; Ding, Z.; Zhou, N.; Qin, D.; Zhang, C. Urban ecological well-being intensity and driving mode based on three-dimensional well-being: Taking the Yangtze Delta as an example. J. Nat. Resour. 2021, 36, 327–341. (In Chinese) [Google Scholar] [CrossRef]
- Hu, M.; Li, Z.; Hou, B. The Effect and Formation Mechanism of“Well-being Threshold”in Cities of Yangtze River Delta. Econ. Geogr. 2021, 41, 62–72. (In Chinese) [Google Scholar] [CrossRef]
- Betti, G.; Neri, L.; Lonzi, M.; Lemmi, A. Objective Environmental Indicators and Subjective Well-Being: Are They Directly Related? Sustainability 2020, 12, 2277. [Google Scholar] [CrossRef]
- Yasin, I.; Naseem, S.; Anwar, M.A.; Madni, G.R.; Mahmood, H.; Murshed, M. An Analysis of the Environmental Impacts of Ethnic Diversity, Financial Development, Economic Growth, Urbanization, and Energy Consumption: Fresh Evidence from Less-Developed Countries. Environ. Sci. Pollut. Res. 2022. [Google Scholar] [CrossRef]
- Li, Y.; Shi, X.; Yang, M.; Liang, L. Variable Selection in Data Envelopment Analysis via Akaike’s Information Criteria. Ann. Oper. Res. 2017, 253, 453–476. [Google Scholar] [CrossRef]
- Jenkins, L.; Anderson, M. A Multivariate Statistical Approach to Reducing the Number of Variables in Data Envelopment Analysis. Eur. J. Oper. Res. 2003, 147, 51–61. [Google Scholar] [CrossRef]
- Li, B.; Peng, X.; Ouyang, M. Environmental Regulation, Green Total Factor Productivity and the Transformation of China’s Industrial Development Mode—Analysis Based on Data of China’s 36 Industries. China Ind. Econ. 2013, 4, 56–68. (In Chinese) [Google Scholar] [CrossRef]
- Fan, C.C.; Sun, M. Regional Inequality in China, 1978–2006. Eurasian Geogr. Econ. 2008, 49, 1–18. [Google Scholar] [CrossRef] [Green Version]
- Chen, Z.; Haynes, K.E. Impact of High-Speed Rail on Regional Economic Disparity in China. J. Transp. Geogr. 2017, 65, 80–91. [Google Scholar] [CrossRef]
- Wu, Y.; Song, Y. Spatial Pattern Evolution and Influence Factors of Tourism Economy in China. Sci. Geogr. Sin. 2018, 38, 1491–1498. (In Chinese) [Google Scholar] [CrossRef]
- Charnes, A.W.; Cooper, W.W.; Rhodes, E.L. Measuring the Efficiency of Decision Making Units. Eur. J. Oper. Res. 1979, 2, 429–444. [Google Scholar] [CrossRef]
- Tone, K. A Slacks-Based Measure of Efficiency in Data Envelopment Analysis. Eur. J. Oper. Res. 2001, 130, 498–509. [Google Scholar] [CrossRef] [Green Version]
- Tone, K. A Slacks-Based Measure of Super-Efficiency in Data Envelopment Analysis. Eur. J. Oper. Res. 2002, 143, 32–41. [Google Scholar] [CrossRef]
- Malakar, K.; Mishra, T.; Patwardhan, A. Inequality in Water Supply in India: An Assessment Using the Gini and Theil Indices. Environ. Dev. Sustain. 2018, 20, 841–864. [Google Scholar] [CrossRef]
- LeSage, J.P.; Pace, R.K. Spatial Econometric Modeling of Origin-Destination Flows*. J. Reg. Sci. 2008, 48, 941–967. [Google Scholar] [CrossRef]
- Wang, H.; Liu, G.; Shi, K. What Are the Driving Forces of Urban CO2 Emissions in China? A Refined Scale Analysis between National and Urban Agglomeration Levels. Int. J. Environ. Res. Public Health 2019, 16, 3692. [Google Scholar] [CrossRef] [Green Version]
- Oda, T.; Maksyutov, S.; Andres, R.J. The Open-Source Data Inventory for Anthropogenic CO2, Version 2016 (ODIAC2016): A Global Monthly Fossil Fuel CO2 Gridded Emissions Data Product for Tracer Transport Simulations and Surface Flux Inversions. Earth Syst. Sci. Data 2018, 10, 87–107. [Google Scholar] [CrossRef] [Green Version]
- Zhu, X.; Li, Y.; Zhang, P.; Wei, Y.; Zheng, X.; Xie, L. Temporal–Spatial Characteristics of Urban Land Use Efficiency of China’s 35mega Cities Based on DEA: Decomposing Technology and Scale Efficiency. Land Use Policy 2019, 88, 104083. [Google Scholar] [CrossRef]
- Liu, X.; Yang, Z. High quality development of Finance and economy: Mechanism and regional differences. J. Anhui Univ. 2022, 46, 131–137. (In Chinese) [Google Scholar] [CrossRef]
- Liao, M.; Xu, Z.; Hu, C.; Wu, Y. Can infrastructure investment still promote economic growth—— Empirical test based on provincial panel data from 1994 to 2016. J. Manag. World 2018, 34, 63–73. (In Chinese) [Google Scholar] [CrossRef]
- Eyraud, L.; Lusinyan, L. Vertical Fiscal Imbalances and Fiscal Performance in Advanced Economies. J. Monet. Econ. 2013, 60, 571–587. [Google Scholar] [CrossRef]
- Shahidullah, A.K.M.; Choudhury, M.-U.-I.; Emdad Haque, C. Ecosystem Changes and Community Wellbeing: Social-Ecological Innovations in Enhancing Resilience of Wetlands Communities in Bangladesh. Local Environ. 2020, 25, 967–984. [Google Scholar] [CrossRef]
- Liu, J. 70 years of foreign capital utilization in New China: Course, effect and main experience. J. Manag. World 2019, 35, 19–37. (In Chinese) [Google Scholar] [CrossRef]
- Guan, X.; Wei, H.; Lu, S.; Dai, Q.; Su, H. Assessment on the Urbanization Strategy in China: Achievements, Challenges and Reflections. Habitat Int. 2018, 71, 97–109. [Google Scholar] [CrossRef]
- Du, H.; Huang, L.; Zhang, C.; He, J. A study on the decomposition and convergence of regional differences in China’s Provincial Ecological Welfare performance. Ecol. Econ. 2019, 35, 187–193. (In Chinese) [Google Scholar]
- Wang, G.; Li, S.; Ma, Q. Spatial-temporal Evolution of Chinese Eco-efficiency from the Perspective of Human Well-being. Sci. Geogr. Sin. 2018, 38, 1597–1605. (In Chinese) [Google Scholar] [CrossRef]
- Wang, R.; Feng, Y. Research on China’s Ecological Welfare Performance Evaluation and Improvement Path from the Perspective of High-Quality Development. Math. Probl. Eng. 2020, 2020, 5476089. [Google Scholar] [CrossRef]
- Wang, S.; Zhang, Y.; Yao, X. Research on Spatial Unbalance and Influencing Factors of Ecological Well-Being Performance in China. Int. J. Environ. Res. Public Health 2021, 18, 9299. [Google Scholar] [CrossRef]
- Xu, W.; Li, L.; Zheng, J.; Liu, C. Comparison of regional differences between green innovation efficiency and ecological welfare performance in China. Stat. Decis. 2021, 37, 56–59. (In Chinese) [Google Scholar] [CrossRef]
- Li, J.; Gong, Y.; Jiang, C. Spatio-Temporal Differentiation and Policy Optimization of Ecological Well-Being in the Yellow River Delta High-Efficiency Eco-Economic Zone. J. Clean. Prod. 2022, 339, 130717. [Google Scholar] [CrossRef]


| Scale | Authors | Objective Area | Method | Time Period |
|---|---|---|---|---|
| Provincial Level | Yingjie Feng [15] | 30 Chinese provinces | HDI/EF | 1994–2014 |
| Wang et al. [37] | 30 Chinese provinces | 2006–2018 | ||
| Hou et al. [6] | 30 Chinese provinces | Super SBM-DEA | 2006–2017 | |
| Jing Bian [26] | 30 Chinese provinces | Super SBM-DEA | 2011–2016 | |
| City level | Hu et al. [16] | 41 cities | Network DEA | 2001–2017 |
| Liu et al. [32] | 171 Prefecture-level cities | Super SBM-DEA | 2010–2019 | |
| Xinyi Long [38] | Four islands | HDI/EF | 2017 | |
| National level | Zhang et al. [33] | 82 developed countries | 2012 | |
| Sweidan [39] | Gulf countries | 1995–2012 |
| Dimension | First-Level Index Layer | Second-Level Index Layer | Third-Level Index Layer |
|---|---|---|---|
| Input index | Resource input | Energy consumption | Total electricity consumption (100 million kwh) |
| Water resource consumption | Water consumption (100 million tons) | ||
| Land resource consumption | Built-up area (square kilometers) | ||
| Non-resource input | Labor input | Number of environmental protection personnel (people) | |
| Property input | Investment in fixed assets of cities’ public utilities construction (10,000 yuan) | ||
| Environmental protection expenditure (10,000 yuan) | |||
| Desirable output | Welfare level | Economic welfare | Cities’ GDP (100 million yuan) |
| Environmental welfare | Green space (hectares) | ||
| Social welfare | Years of education (years) | ||
| Number of doctors (people) | |||
| Cities’ road area at the end of the year (10,000 square meters) | |||
| Undesirable output | Environmental pollution | Wastewater discharge | Industrial wastewater discharge (10,000 tons) |
| Smoke and dust emissions | Industrial smoke and dust (tons) | ||
| Exhaust emissions | Industrial sulfur dioxide emissions (tons) | ||
| Carbon dioxide emissions (tons) |
| Variable | Data Sources | Variable | Data Sources |
|---|---|---|---|
| Total electricity consumption | China Urban Statistical Yearbook Statistical yearbook of each city Statistical bulletin and EPS database of each city | Green spaces | China Urban and Rural Construction Statistical Yearbook |
| Water consumption of the whole society | China Urban and Rural Construction Statistical Yearbook | Three industrial waste products | China Urban Statistical Yearbook |
| Built-up area | CO2 | Center for global environmental research | |
| Number of employees in water conservation, environment, and public facilities management | China Urban Statistical Yearbook | Deposits and loans | China Urban Statistical Yearbook |
| Public assets investment in municipal public facilities construction | China Urban and Rural Construction Statistical Yearbook | Industrial structure | China Urban Statistical Yearbook |
| Financial expenditure on energy conservation and environmental protection | Financial Bureau and Statistics Bureau apply for information disclosure | General budgetary revenues and expenditures of central and local governments | China Urban Statistical Yearbook China Statistical Yearbook |
| Per capita years of education | China Urban Statistical Yearbook | Patents | CNRDS database |
| Number of doctors | China Urban Statistical Yearbook Statistical yearbook of each city | Foreign direct investment | China Urban Statistical Yearbook Statistical yearbooks of provinces and cities |
| Urban road area at the end of the year | China Urban Construction Statistical Yearbook |
| 2007 | 2008 | 2009 | 2010 | 2011 | 2012 | 2013 | 2014 | 2015 | 2016 | 2017 | 2018 | 2019 | 2020 | |
|---|---|---|---|---|---|---|---|---|---|---|---|---|---|---|
| I | 0.042 | 0.044 | 0.028 | 0.033 | 0.037 | 0.050 | 0.031 | 0.033 | 0.023 | 0.008 | 0.016 | −0.003 | 0.004 | 0.008 |
| Z | 8.798 | 9.288 | 6.241 | 7.043 | 7.984 | 10.483 | 6.757 | 7.053 | 5.193 | 2.173 | 3.752 | 0.177 | 1.513 | 2.200 |
| P | 0.000 | 0.000 | 0.000 | 0.000 | 0.000 | 0.000 | 0.000 | 0.000 | 0.000 | 0.030 | 0.000 | 0.859 | 0.130 | 0.028 |
| Var Name | Obs | Mean | SD | Min | Median | Max |
|---|---|---|---|---|---|---|
| EWP | 3976 | 0.863 | 0.192 | 0.299 | 0.866 | 1.798 |
| FINANCE | 3976 | 2.291 | 1.109 | 0.560 | 1.966 | 8.052 |
| STRU | 3976 | 3.177 | 10.090 | 0.107 | 0.489 | 67.420 |
| FISCAL REVENUE DEC | 3976 | 0.386 | 0.165 | 0.050 | 0.363 | 0.834 |
| FISCAL EXPEN DEC | 3976 | 0.789 | 0.071 | 0.491 | 0.799 | 0.948 |
| LnPATENT | 3976 | 7.202 | 1.754 | 1.609 | 7.100 | 12.388 |
| FDI | 3976 | 0.018 | 0.028 | 0.000 | 0.011 | 0.697 |
| URBANIZATION | 3976 | 52.788 | 15.862 | 16.413 | 50.710 | 100.000 |
| Test | Statistics | p-Value |
|---|---|---|
| LM Spatial error | 18.389 *** | <0.010 |
| LM Spatial autocorrelation | 207.128 *** | <0.010 |
| LR Spatial error | 26.67 *** | <0.010 |
| LR Spatial autocorrelation | 22.82 *** | <0.010 |
| Hausman | 83.61 *** | <0.001 |
| Variable | Inverse Distance Matrix | Adjacency Matrix | Economic Distance Matrix | |||
|---|---|---|---|---|---|---|
| Coefficient | t-Value | Coefficient | t-Value | Coefficient | t-Value | |
| FINANCE | 0.026 *** | 3.469 | 0.013 * | 1.657 | 0.039 *** | 6.279 |
| STRU | 0.001 * | 1.646 | 0.001 | 1.273 | 0.001 | 1.348 |
| FISCAL REVENUE DEC | −0.211 *** | −3.029 | −0.172 ** | −2.423 | −0.159 *** | −2.598 |
| FISCAL EXPEN DEC | −0.161 | −1.444 | −0.114 | −0.994 | −0.312 *** | −3.175 |
| LnPATENT | 0.002 | 0.271 | 0.004 | 0.593 | −0.010 * | −1.789 |
| FDI | 0.292 * | 1.875 | 0.436 *** | 2.640 | 0.448 *** | 3.058 |
| URBANIZATION | 0.002 *** | 2.812 | 0.001 | 1.312 | 0.002 *** | 2.984 |
| FINANCE·W | 0.186 *** | 2.998 | 0.055 *** | 4.775 | −0.001 | −0.043 |
| STRU·W | −0.008 | −1.374 | −0.001 | −0.525 | −0.002 | −1.083 |
| FISCAL REVENUE DEC·W | 1.363 ** | 2.353 | 0.102 | 0.979 | −0.256 | −1.531 |
| FISCAL EXPEN DEC·W | −0.446 | −0.511 | −0.249 | −1.445 | 0.517 ** | 2.101 |
| LnPATENT·W | −0.067 | −1.346 | −0.030 *** | −3.151 | 0.004 | 0.257 |
| FDI·W | 2.150 | 1.418 | 0.181 | 0.648 | 2.401 *** | 3.930 |
| URBANIZATION·W | −0.006 | −1.420 | 0.003 *** | 3.041 | −0.001 | −0.329 |
| Time fixed | Yes | Yes | Yes | |||
| Individual fixed | Yes | Yes | Yes | |||
| 0.343 *** | 2.862 | 0.093 *** | 4.212 | −0.058 * | 1.793 | |
| sigma2_e | 0.014 *** | 44.560 | 0.014 *** | 44.546 | 0.014 *** | 44.575 |
| Observations | 3976 3976 | 3976 3976 | 3976 3976 | |||
Publisher’s Note: MDPI stays neutral with regard to jurisdictional claims in published maps and institutional affiliations. |
© 2022 by the authors. Licensee MDPI, Basel, Switzerland. This article is an open access article distributed under the terms and conditions of the Creative Commons Attribution (CC BY) license (https://creativecommons.org/licenses/by/4.0/).
Share and Cite
Zhang, C.; Li, J.; Liu, T.; Xu, M.; Wang, H.; Li, X. The Spatiotemporal Evolution and Influencing Factors of the Chinese Cities’ Ecological Welfare Performance. Int. J. Environ. Res. Public Health 2022, 19, 12955. https://doi.org/10.3390/ijerph191912955
Zhang C, Li J, Liu T, Xu M, Wang H, Li X. The Spatiotemporal Evolution and Influencing Factors of the Chinese Cities’ Ecological Welfare Performance. International Journal of Environmental Research and Public Health. 2022; 19(19):12955. https://doi.org/10.3390/ijerph191912955
Chicago/Turabian StyleZhang, Can, Jixia Li, Tengfei Liu, Mengzhi Xu, Huachun Wang, and Xu Li. 2022. "The Spatiotemporal Evolution and Influencing Factors of the Chinese Cities’ Ecological Welfare Performance" International Journal of Environmental Research and Public Health 19, no. 19: 12955. https://doi.org/10.3390/ijerph191912955
APA StyleZhang, C., Li, J., Liu, T., Xu, M., Wang, H., & Li, X. (2022). The Spatiotemporal Evolution and Influencing Factors of the Chinese Cities’ Ecological Welfare Performance. International Journal of Environmental Research and Public Health, 19(19), 12955. https://doi.org/10.3390/ijerph191912955


