Abstract
(1) Aims: To explore temporal trends 2010–2018 of well-being among Italian adolescents and to evaluate potential explanatory factors. (2) Methods: Italian nationality representative samples of students aged 11, 13, and 15 years were recruited in 2010, 2014, and 2018; Health Behaviour in School-aged Children (HBSC), for an overall number of 165,000 teenagers. Multivariable logistic regression models were performed to fit the trends over time of life satisfaction (LS), psychological (PSY-HC) and somatic health complaints (SOM-HC) considering the contextual factors: school work pressure, social support (family, school, peers), socioeconomic status, geographic area, and immigration background; (3) Results: From 2010 to 2018 while LS was steady, health complaints increased, mainly for PSY-HC, in all age and gender groups. Trend of PSY-HC affected mainly 15-years-olds: rates among boys varied from 29.6% to 35.9% (OR: 1.13, 95%CI: 1.02–1.25); among girls from 49.1% to 63.3% (OR: 1.56, 95%CI: 1.42–1.72). High school work pressure and poor social support play a central role in worsening well-being outcomes; (4) Conclusions: Our findings pictured a remarkable worsening trend of teenagers’ well-being, especially among 15-year-old girls. Further research will be required to investigate this breaking up of the connection between psychophysical symptomatology and cognitive perception of life satisfaction.
1. Introduction
1.1. The Concept of Health as Well-Being
In the 20th century, the concept of health evolved to include the notion of well-being: according to the World Health Organization (WHO), health is a state of complete physical, psychological, and social well-being, and not just the absence of disease and infirmity [1]. Therefore, there cannot be health without mental health: medically ill people with an optimistic attitude have better outcomes (e.g., lower rates of death from cardiovascular disease) than those with high levels of pessimism [2].
Moreover, in the last 20 years, mental health has become central for its impact on public health: 1996 WHO projections indicated that by 2020 depression would be the second leading cause of illness, emphasizing adolescence as a fundamental period in forming the features of adult mental health [3,4,5,6,7,8].
1.2. Mental Health during Adolescence: Theorization and Consequences
The Bronfenbrenner Bioecological Model of Human Development underlines how puberty could be a crucial period for adolescent mental health [3,4]. It accounts for different system levels—individual, microsystem, mesosystem, and macrosystem—and considers the maturational stage of the adolescent into his/her social background.
To the best of our knowledge, it was confirmed that measures of well-being are worse in older adolescents than in younger ones [9]. Similarly, boys show more favorable measures of happiness, confidence, helplessness, and lower psychological complaints than girls [9,10,11,12].
Thus, from a very young age, well-being can be considered a delicate balance of different determinants: if some of them wobble, the entire building can collapse, with serious consequences in term of both internalizing problems (i.e., depression, anxiety, sleep disorders, or withdrawal symptoms) and externalizing behaviors (i.e., aggression, oppositional disorders, or delinquency) [13].
1.3. Trends and Determinants
WHO estimates that 10–20% of adolescents globally experience mental illness, largely underdiagnosed and undertreated [14]. In support of this estimation, the 2018 Health Behaviour in School-aged Children survey (HBSC) observed a prevalence of multiple psychosomatic health complaints among European adolescents (30–41%) and a mean life satisfaction of 7.4–8.3 on a 0–10 scale [15].
However, the identification of trends in adolescents’ well-being is controversial: a cross-national study revealed a not homogeneous picture among European countries [16], as well as a recent worldwide meta-analysis showed a mild increase between the 1980s and 2000s and an overall stability up to the 2010s [17].
Nevertheless, an increasing trend in psychological health complaints has already been observed in the last 20 years, especially among older girls, in Canada [18] and in several European countries, like Sweden [19], Norway [10,20], and the UK [21], while life satisfaction showed an unclear evolution [22,23].
Mechanisms involved in this increasing trend have not been entirely understood yet.
A previous Sweden study found that the increasing trend in psychological complaints can be mainly associated with schoolwork pressure [24]. Recently, the importance of family and school has been emphasized in different studies on the role of scholar stress and low social support (i.e., poor family, peer, teacher relationships) towards well-being impairment [24,25,26,27,28].
In particular, Levin found an important positive association between mother–child communication and young people’s life satisfaction, especially among girls [26]. Also for immigrant adolescents, a positive scholar environment is a protective factor for better mental health outcomes [29]. Similarly, in the majority of the countries, lower socioeconomic status (SES) or worries for family finances were associated with worse mental outcomes, in terms of both life satisfaction and psychological complaints [18,28,30,31].
As these mechanisms are profoundly rooted in the socio-cultural context of each country, it is difficult to generalize the results already observed. In Italy, a slight decline in mental well-being has been observed in the last decades [16]. However, country-specific studies are needed to better understand circumstances, processes, and mechanisms involved in this complex public health issue.
The aim of this study was to explore temporal trends of health complaints and well-being among Italian adolescents from 2010 to 2018 and to evaluate potential explanatory factors.
2. Materials and Methods
2.1. Study Population
The present study was based on data from the Italian Health Behaviour in School-Aged Children (HBSC) carried out in 2010, 2014, and 2018. The HBSC is an international multicenter survey that runs every four years using a standardized research protocol to investigate health-related behaviours in adolescents (Health Behaviour in School-aged Children; World Health Organization collaborative cross-national survey; available from www.hbsc.org accessed on 14 December 2021).
For each of the three survey rounds, nationally representative samples of 11-, 13-, and 15- years old were recruited from school classes throughout Italian regions. The school class was the primary sampling unit, drawn by a stratified systematic cluster sampling from a list of all public and private schools obtained from the Ministry of Education. The Italian HBSC study included around 2500 classes in 2010, 3300 in 2014, and 4100 in 2018: the response rates were, respectively, 96% in 2010 [32], 90% in 2014 [33], and 86% in 2018 [34] of all sampled classes. Data were collected in classroom settings through standardized, self-filled questionnaires on social background, health indicators, and health-related behaviours. Anonymity and confidentiality of all participants were ensured. Participation was voluntary, and parental opt-out consent was obtained.
Italian HBSC study protocols and questionnaires were formally approved by Ethics Committees of the University of Turin (2014) and of the Italian National Institute of Health (2010 and 2018). A detailed description of the aims, theoretical framework, and protocol of the international and Italian HBSC study can be found elsewhere [32,33,34].
2.2. Measures
Adolescent mental well-being was measured by two instruments:
- Life Satisfaction (LS) was assessed with the Cantril ladder [35], a reliable instrument for subjective well-being among adolescents [36]. Participants were asked to rate their life satisfaction using a visual analogue scale (range 0–10): higher the score, greater the feeling of life satisfaction. Respondents were asked to indicate the ladder step at which they would place their lives at present. The findings presented here were categorized as low (0–8)/high LS (≥9) [37].
- Psychosomatic Health Complaints (HC) were evaluated through the HBSC Symptom Checklist (HBSC-SCL), a non-clinical measure consisting of eight items (headache, stomachache, backache, feeling low, irritability or bad-tempered, feeling nervous, sleeping difficulties, and dizziness). Adolescents indicated how often they had experienced each complaint over the last six months. Response options for each symptom ranged from about every day to rarely or never. According to the binary cut-off used in the international report [15], findings presented here were categorized as participants with multiple (two or more) health complaints more than once a week/other (reference category). This instrument has adequate test-retest reliability and psychometric properties [38,39] and is commonly used to assess adolescent mental well-being [40]. HBSC-SCL can be thought of as constituting two dimensions: somatic (SOM-HC) (i.e., headache, stomachache, backache, and dizziness) and psychological complaints (PSY-HC) (i.e., feeling low, irritability, feeling nervous, and sleeping difficulties) [41]. SOM-HC and PSY-HC were dichotomized as participants perceiving multiple (two or more) complaints more than once a week/other (reference category).
2.3. Explanatory Variables
- Gender and age. Participants were asked to indicate whether they were a boy or a girl, as well as their month and year of birth.
- Geographic area. The geographic area is derived from the school address and classified into Northern, Central, and Southern Italy [42].
- Socioeconomic Status (SES) was measured according to the family affluence scale (FAS), which has been recognized as a reliable indicator of family wealth [43]. The scale consisted of four items: family car ownership, whether adolescents have their own bedroom, number of holidays trips taken in the last year, and number of computers owned by the family. The obtained score (0–7) was categorized on a 3-point ordinal scale: low (0–3), medium (4–5), and high (≥6) SES.
- Schoolwork Pressure. Adolescents responded to the question, “How pressured do you feel by the schoolwork you have to do?”. The response options available were “not at all” (1), “a little” (2), “some’’ (3), and “a lot” (4). The responses were re-coded into high (3–4) and low (1–2) pressure, as classified by the international HBSC report [15].
- Classmate Support was measured by three items: (1) “The students in my class enjoy being together”, (2) “Most of the students in my class are kind and helpful”, and (3) “Other students accept me as I am”. Response categories for all the above items ranged from strongly agree (1) to strongly disagree (5). Original codes were reversed: strongly disagree (0) to strongly agree (4), and a sum-score was generated for each domain (range 0–12) and then divided by three. The resulting average score was categorized as low (<2.5) or high (≥2.5) classmate support [44].
- Family Support was assessed by two items. Young people were asked how easy it is for them to talk to their mother or father about things that really bother them. Response options ranged from very easy to very difficult. In this study, we dichotomized finding as easy or very easy/difficult or very difficult. Communication in the family is an indicator of social support and of the family’s connectedness [45,46,47].
- Immigration background was defined by the country of birth of the adolescents and their parents. If at least one parent was born abroad, adolescents were classified as having an immigrant status [45].
- Family structure was determined by asking adolescents to identify the people who live, most of the time, in the same house with them. Adolescents were then classified as “living with both biological parents” (traditional family) or “living with other adults” (non-traditional family) [48].
2.4. Statistical Analyses
Descriptive characteristics of the sample were reported by survey year. Differences were tested with the corrected weighted Pearson Chi square test.
Confirmatory factor analysis (CFA) was conducted. For health complaints as a continuous variable, Structural Equation Modelling (SEM) was performed on a single factor model (i.e., all items of the HBSC-SCL were supposed to be represented by the same factor) in comparison with a model comprising two correlated factors (psychological and somatic). Similarly, Generalized Structural Equation Modelling (GSEM) was used for a single factor and a two-factor model considering health complaints as a dichotomized variable. According to AIC (Akaike Information Criterion), and BIC (Bayesian Information Criterion) measures of fit (see Table A1 in Appendix A), the two-factor model for the dichotomized variable fitted the data best, so it has been adopted as an outcome variable in trend estimation [11,49]. Figure A1 shows results from the two-factor model for the dichotomized variable. Psychological and somatic symptoms, the two factors of the model, are two correlated dimensions [49].
The trends of the prevalence of mental well-being from 2010 to 2018 were estimated using several multivariable logistic regression models considering LS and HC (as overall and PSY-HC and SOM-HC (yes/no)) as the dependent variables and the survey year, Family Affluence Scale, geographic area, schoolwork pressure, classmate support, mother support, father support, family structure, and immigration background as independent variables. In the regression models, survey year was entered first as a categorical variable to estimate differences between rounds; second, as a continuous variable to estimate an overall trend per year in the considered time period.
An interaction term between gender and the survey year was also included in the model to examine whether the trends were moderated by gender. Because of the interaction, the analyses were stratified by gender and age class.
In the analyses, the effect of the survey design, including stratification, clustering, and weighting were considered. A statistical significance level of 5% was set up. Analyses were carried out using STATA v16.1 (StataCorp LLC: College Station, TX, USA).
3. Results
More than 165,000 students participated in the survey in the three waves (35.6% in 2010, 28.8% in 2014, and 35.6% in 2018) with similar gender and age distribution among the three time-points. Table 1 gives an overview of the characteristics of the total sample by survey wave. Across the surveys, the percentage of youths with missing responses ranged from 0% (gender, age, geographic area) to 5.2% (easy communication with father).

Table 1.
Descriptive characteristics (%) of the total sample and across surveys.
Low SES index (measured according to the FAS) increased from 13.3% in 2010 to 22.3% in 2018 as well as non-traditional family structure (from 14.7% to 18.0%). Despite an important increase in schoolwork pressure (41.8–54.9% in the period 2010–2018) being observed, social support remained substantially stable (family support) or even decreased (classmate support, from 81.0% to 75.7%).
Adolescents perceived more psychosomatic health complaints (HC) in 2018 (52.2%) compared to 2010 (47.3%), and it was seen mainly for psychological symptoms (PSY-HC). Considering psychological and somatic symptoms (SOM-HC) as separated, mental illness complaints seemed to be the major issue. As shown in Figure 1, an increasing gender gap was observed over time: PSY-HC grew more among 13- (55.9–64.3%) and 15-year-old females (63.5–72.9%) than among boys of the same age. However, it was not true for life satisfaction (LS), which showed an overall stability over time. For a more detailed description of endpoint variables, see Table A2, included in the Appendix A.
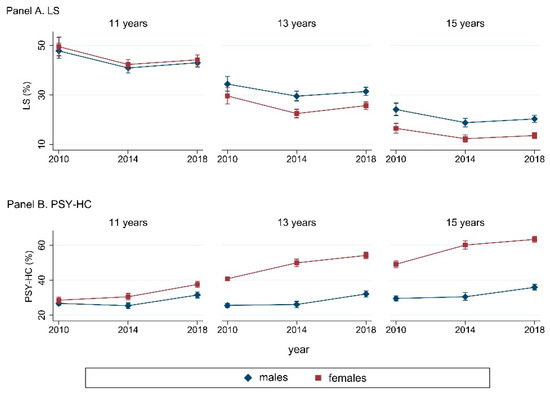
Figure 1.
Prevalence (% (95%CI)) of LS (Panel A) and PSY-HC (Panel B), stratified by gender and age groups. Abbreviations: LS: life satisfaction ≥9; PSY-HC: ≥2 psychological health complaints more than once a week.
3.1. Trend in Well-being Measures (LS, HC, PSY-HC and SOM-HC): Gender and Age Disparities
Results from the multivariable regression analysis were reported in Table 2.
Table 2.
Trend 2010–2018 of LS, HC, PSY-HC, and SOM-HC, stratified by gender and age groups. Results are reported as OR (95%CI).
From 2010, the increasing trend per year in psychosomatic HC was statistically significant among older adolescents, weaker for 13-year-old boys (yearly OR: 1.02; 95%CI: 1.00–1.03) and girls (OR: 1.03; 95%CI: 1.02–1.04), stronger for 15-year-old females (OR: 1.04; 95%CI: 1.02–1.05) and boys (OR: 1.02; 95%CI: 1.01–1.04).
The increasing prevalence of HCs referred mainly to PSY-HC, in all age and gender groups: as represented in Figure 2, respectively, in 11-, 13-, and 15-year olds a mean significant growth of 2% (OR: 1.02; 95%CI: 1.00–1.03), 3% (OR: 1.03; 95%CI: 1.02–1.05) and 4% (OR: 1.04; 95%CI: 1.02–1.05) per year was seen from 2010 to 2018 among boys, while a mean raise of 3% (OR: 1.03; 95%CI: 1.01–1.05), 5% (OR: 1.05; 95%CI: 1.04–1.07) and 6% (OR: 1.06; 95%CI: 1.05–1.07) was observed among girls. In other words, among 11–15 years old girls, respectively, a 26% (OR: 1.26; 95%CI: 1.11–1.44)–56% (OR: 1.56; 95%CI: 1.42–1.72) mean raise of PSY-HC was registered in 2018, compared to 2010, more than among boys, with a mean growth of 13% (OR: 1.13; 95%CI: 1.02–1.25)–33% (OR: 1.33; 95%CI: 1.20–1.48).
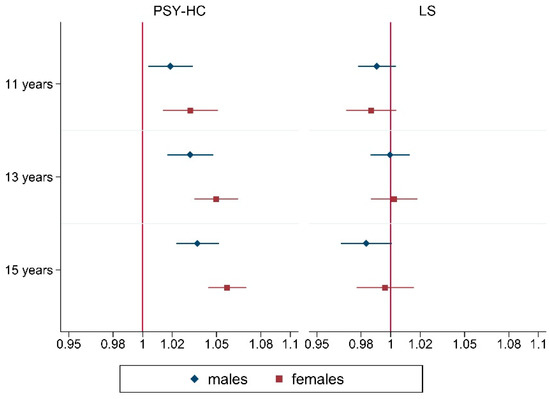
Figure 2.
Yearly adjusted trends of PSY-HC and LS from 2010 to 2018, stratified by gender and age groups. Results from multivariable logistic regression (OR (95%CI)). Abbreviations. LS: life satisfaction ≥9; PSY-HC: ≥2 psychological health complaints more than once a week. Adjustment variables: survey year, family affluence scale, schoolwork pressure, classmate support, mother support, father support, family structure, immigration background, geographic area.
As shown in Table A3 (Appendix A), among psychological symptoms, sleeping difficulty increased the most, in mean between 3% (OR: 1.03; 95%CI: 1.00–1.06) and 9% (OR: 1.09; 95%CI: 1.07–1.10) per year from 2010 to 2018 across gender and age groups. Also, irritability and feeling nervous showed a relevant raise, respectively, between 3% (OR: 1.03; 95%CI: 1.01–1.04)–7% (OR: 1.07; 95%CI: 1.05–1.08) and 2% (OR: 1.02; 95%CI: 1.00–1.04) and 5% (OR: 1.05; 95%CI: 1.04–1.07) per year, feeling low did not present a statistically significant trend in the last decade.
In contrast to PSY-HC, we found a slight worsening in SOM-HC, which achieved statistical significance among older females.
LS did not show a statistically significant trend from 2010 to 2018, except for a slight decrease from 2010 to 2014, in both gender and age groups.
All the measures of well-being showed an increasing gender gap: girls were always more affected than boys and differences by age already grew from 11 years old for HC, PSY-HC and SOM-HC, while it happened later for LS (from 13 years old).
3.2. Social Determinants of Well-Being
Figure 3 shows the association between social determinants (individual and family variables) and well-being outcomes (see also Table A4 in the Appendix A).
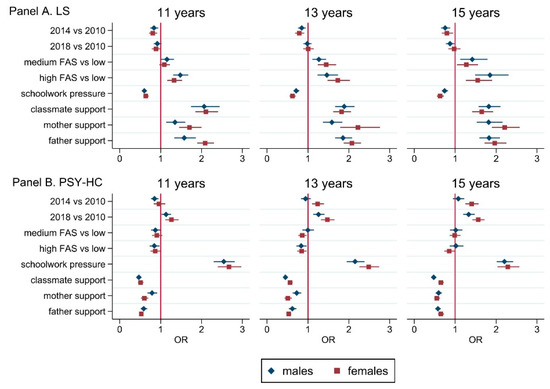
Figure 3.
Multivariable regression analysis (OR (95%CI)) performed on LS (Panel A) and PSY-HC (Panel B), stratified by gender and age groups. Abbreviations. LS: life satisfaction ≥ 9; PSY-HC: ≥2 psychological health complaints more than once a week. Adjustment variables: survey year, family affluence scale, schoolwork pressure, classmate support, mother support, father support, family structure, immigration background, geographic area.
Schoolwork pressure, family structure, easy communication with mother and father, and classmate support were all predictors of well-being. Among variables included in the multivariable regression models, schoolwork pressure showed the strongest association with health complaints, especially psychological. Family easy communication and peer support have been significantly associated with better well-being outcomes, mostly for psychological symptoms and among females. Higher socioeconomic status was seen to affect LS strongly, especially for 15-year-old boys (OR: 1.85; 95%CI: 1.49–2.30) and girls (OR: 1.55; 95%CI: 1.26–1.90), in comparison to lower SES. Similarly, HCs were registered significantly lower among adolescents with high SES families, psychological ones (feeling low, irritability, feeling nervous) in all age and gender groups, and somatic ones among 15-year olds, both boys (OR: 0.69; 95%CI: 0.56–0.84) and girls (OR: 0.82; 95%CI: 0.71–0.94). Migrant condition and geographic area seemed to be other predictors for well-being: being a migrant was associated with higher levels of HC among 11 years old boys. We also observed a northern–southern gradient in the association with well-being: higher levels of LS were found in southern regions, especially in males, in conjunction with more HCs, somatic and psychological (feeling nervous, irritability and feeling low), both in boys and girls.
4. Discussion
In the last decades, an unclear pattern in time trend of mental well-being was observed, with high heterogeneity among European countries [16,17]. Although there is some prior evidence of a slight decline in mental well-being in Italy [16], country-specific studies are needed to better understand circumstances, processes, and mechanisms involved in this complex public health issue.
The present study investigated time trends in adolescent mental well-being between 2010 and 2018 in Italy.
Globally, the findings of the present study enforce the Dual Factor Model conceptualization of well-being [50,51] as a multidimensional construct, in which the different components (i.e., psychological HC and life satisfaction) can have different but correlated temporal trends. According to this, good mental health is achieved just when two conditions are both satisfied: the presence of well-being and positive functioning and the absence of mental illness [52].
Our data showed that older adolescents have a higher vulnerability to mental health problems than the youngers, and this difference increases across years, as in Potrebny [20]. As suggested by some authors, a possible hypothesis that can explain this phenomenon lies in the observed decrease in the age of onset of puberty over the last decades. That aspect might expose early maturing adolescents, especially girls [53], to a higher risk of psychopathology, as depression [54].
Moreover [10,11,16,21,24,45,55], girls seem to be at higher risk of psychosomatic health complaints and lower life satisfaction than boys and this gender gap is growing over time [24]. They also seem to be affected by mental health problems earlier and most marked in life. Why it happens is not yet completely understood. Possible explanations, beyond those exposed before, could be related to the tendency of girls to experience more internalizing than externalizing symptoms [56], but also to more restricted gender rules and higher levels of body dissatisfaction among females, and higher perception of stress related to school performance [24,57,58,59].
In support of this evidence, our results confirmed the strong association between schoolwork pressure and well-being indicators in accordance with Högberg [24]. Intending to give a partial explanation, some authors focused on the negative effects of grading systems with higher educational expectations: these effects could be directly associated with school-related stress and academic self-esteem and indirectly to psychosomatic symptoms and life satisfaction [57,58]. That issue partially justifies why performance stress is increasing health complaints in recent years. However, school stress accounts for a portion of increasing Italian trends, as shown in the present study [16,24].
A second major environmental factor involved in well-being is social support [24,27], both from family and peers, which can also be a crucial protective factor during economic downturns [28].
In agreement with a Scottish study among 13- and 15-year olds [60], we found that those from two-parent families had higher life satisfaction and fewer health complaints compared to adolescents from nontraditional families. However, it was observed that both well-being indicators were more strongly associated with parent–child communication than with family structure or family affluence, as also shown in Levin [60].
According to literature, the family setting could influence well-being not just directly influencing individual relationships but also as a safe place to learn to handle the school environment and adversity [61,62]. Moreover, positive peer support also seemed to benefit psychosomatic complaints [63,64]. Among possible explanations, this kind of support may moderate the negative effects of academic stress [64]. However, adolescents with better communication in both social contexts showed minor psychological complaints [65].
The trend of psychosomatic health complaints has overall increased in the last few years [17,24]. While this trend seems to follow a stable global pattern in Italy between 2001 and 2010 [66], at the European level, a weak increase in psychosomatic symptoms was noted during the period 1993–2010 [10]. In agreement with CFA, our assessment focused on different trends of the two factors of health complaints considered separately (i.e., somatic and psychological health complaints).
On the one hand, the trend of somatic health complaints is controversial: while among 11-year olds, there is a slight decreasing movement over time, among 13- and 15-year-old girls, it is weakly escalating. This minute growth is in line with previous evidence at the European level in 1994–2010 among 15-year olds, where a modest increment in health complaints has been observed in both gender groups [10,11,20]. A possible explanation for higher levels of somatic health complaints in recent years could be found in the increasing use of computers and smartphones (e.g., on social media and online chatting), especially during mid adolescence [67,68]. Such screen-based activities have been found to be associated with weekly backache and headache among adolescents [69]. This hypothesis could partially account for the divergent trend between younger and older adolescents.
On the other hand, the present study revealed that psychological health complaints are more prevalent and increasing at a greater rate over time than somatic ones. This significant growth in psychological health complaints in the last decade is similar to other European countries [10,18,19,20,21,55]. Our results showed that the escalating trend in psychological symptoms in the last years is due mainly to feeling nervous and sleeping difficulties in both sexes and irritability, especially in girls. However, feeling low seems to have a stable development over the years. The forces driving this trend are not yet fully understood.
Again, exposure to social media and digital technology has rapidly increased in the past decade, and a growing body of evidence suggests that this binge media consumption may harm mental health [67,70,71,72,73,74] for all the psychological issues included in the present work [67,73]. In particular, for sleeping difficulties, the strength of the association between screen time and sleep-onset difficulties increased over time, which may reflect a change in screen time (e.g., the increased use of easily accessible screens such as smartphones and tablets) [75].
Understanding why in our study irritability, being nervous, and sleeping difficulties are growing more than feeling low will request further research.
Despite growing health complaints, no overall trends in life satisfaction emerged in the examined period. In agreement with some studies performed in other European countries, overall good life satisfaction was observed in the last two decades [22,23]. However, a slight decrease in 2014 compared to 2010 was figured out, maybe reflecting the worldwide economic deflection that struck Italian families hard [28,31].
Beyond the Dual Factor Model formalization, the observation of different trends of LS and psychological HC in the last decade suggests a breaking up of the connection between cognitive and physical well-being. Further research is needed to better understand this deep change in our adolescents’ lives.
Strengths and Limitations
This study has several strengths, such as the large, nationally representative sample of Italian adolescents, a standardized international protocol for data collection and the focus on recent data.
Limitations include the cross-sectional and self-report nature of the data. The variables used were restricted to those available in the HBSC study and focused on specific elements of mental well-being. Particularly, our study would have benefitted from the inclusion of other mental well-being outcomes, such as anxiety, depression, behavioral or conduct problems, as these elements would have provided us with a complete picture of time trends in adolescent mental health. In addition, studies including a wider time period could provide a more comprehensive picture of the topic. Further research using HBSC data from the 2022 survey that includes a wider range of time, more mental health outcome measures and other potential determinants of adolescent mental health trends, such as social media use, could help to better understand this complex issue.
5. Conclusions
Overall, the present study showed an increasing trend of psychosomatic health complaints from 2010 to 2018, mainly for psychological symptoms, whereas life satisfaction was steady.
High school work pressure and poor social support (family and classmates) seem to play a central role in worsening well-being outcomes.
Our findings require further research to investigate this change in the well-being of Italian adolescents and what could be capable of breaking up the connection between psychophysical symptomatology and cognitive perception of life satisfaction.
Author Contributions
Conceptualization, P.D., L.C. and P.B.; methodology, P.D., P.B., L.C., R.I.C. and M.B.; formal analysis, M.B. and P.D.; data curation, D.P., M.B. and P.D.; writing—original draft preparation, M.B., P.B., L.C. and P.D.; writing—review and editing, M.B., P.B., L.C., R.I.C., P.N., S.C., P.L., A.B. and P.D.; supervision: P.D., P.B. and L.C.; funding acquisition: P.N., S.C. and D.P. All authors have read and agreed to the published version of the manuscript.
Funding
Italian HBSC surveys are promoted and funded by the Ministry of Health/National Centre for Disease Prevention and Control (CCM) and the Italian National Institute of Health (Project “Behavioral Risk Survey System for Ages 6–17”, cap. 4393/2005-CCM,4393/2013-CCM). The present study was also funded by the University of Torino (DALP_RILO_21_01).
Institutional Review Board Statement
The study was conducted according to the guidelines of the Declaration of Helsinki. In 2010, the Italian HBSC study protocol and questionnaire were formally approved by the Ethics Committee of the Italian National Institute of Health (PROT-PRE/414/09); on 26 September 2013, some amendments were approved by the Ethics Committee of the University of Torino, which coordinated the 2014 HBSC Italian study. In 2018, the Italian survey was approved by the Ethics Committee of the Italian National Institute of Health (Ref. PROT-PRE876/17).
Informed Consent Statement
Students’ parents received an information note with the description of the purpose of the survey before the data collection. Families could refuse participation by filling in the note that was returned to the teachers of the involved class.
Data Availability Statement
The data presented in this study are available in accordance with the Italian HBSC data access policy. Requests should be directed to paola.nardone@iss.it, member of the National Centre for Disease Prevention and Health Promotion, Italian National Institute of Health.
Acknowledgments
We are grateful to all students who completed the questionnaires, school head teachers, class teachers, and other school staff who actively participated in the implementation of the HBSC surveys. We thank all the Regional and Local Health Unit coordinators and the health workers for their fundamental contribution to the HBSC. We further thank all the members of the 2010 and 2018 HBSC-Italia Group.
Conflicts of Interest
The authors declare no conflict of interest. The funders had no role in the design of the study; in the collection, analyses, or interpretation of data; in the writing of the manuscript, or in the decision to publish the results.
Appendix A
Figure A1. Confirmatory Factor Analysis on health complaints. Results from the double factor (PSY-HC and SOM-HC) model for the dichotomized variable. Standardized coefficients of correlation between latent and observed variables; Table A1. Confirmatory factor analysis (SEM, GSEM). Measures of fit (AIC, BIC) between a single factor (HC) and a double factor (PSY-HC and SOM-HC) model for health complaints, both dichotomized variable and score; Table A2. Prevalence (%) of outcome variables across surveys stratified by gender and age groups; Table A3. Multivariable logistic regression (OR (95%CI)) predicting feeling low, irritability, feeling nervous, and sleeping difficulty (PSY-HC), stratified by gender and age groups; Table A4. Multivariable logistic regression (OR (95%CI)) predicting LS, HC, PSY-HC, and SOM-HC, stratified by gender and age groups.

Figure A1.
Confirmatory Factor Analysis on health complaints. Results from the double factor (PSY-HC and SOM-HC) model for the dichotomized variable. Standardized coefficients of correlation between latent and observed variables. Abbreviations. HC: ≥2 health complaints more than once a week; PSY-HC: ≥2 psychological health complaints more than once a week; SOM-HC: ≥2 somatic health complaints more than once a week.

Table A1.
Confirmatory factor analysis (SEM, GSEM). Measures of fit (AIC, BIC) between a single factor (HC) and a double factor (PSY-HC and SOM-HC) model for health complaints, both dichotomized variable and score.
Table A1.
Confirmatory factor analysis (SEM, GSEM). Measures of fit (AIC, BIC) between a single factor (HC) and a double factor (PSY-HC and SOM-HC) model for health complaints, both dichotomized variable and score.
| AIC | BIC | df | |
|---|---|---|---|
| Continuous (SEM) | |||
| single factor | 4,101,076 | 4,101,316 | 24 |
| double factor | 4,057,805 | 4,058,056 | 25 |
| Dichotomized (GSEM) | |||
| single factor | 1,171,920 | 1,172,160 | 24 |
| double factor | 1,141,340 | 1,141,591 | 25 |
Abbreviations. SEM: Structural equation modeling; GSEM: Generalized Structural Equation Modeling; AIC: Akaike Information Criterion; BIC: Bayesian Information Criterion; df: degrees of freedom; HC: ≥2 health complaints more than once a week; PSY-HC: ≥2 psychological health complaints more than once a week; SOM-HC: ≥2 somatic health complaints more than once a week.
Table A2.
Prevalence (%) of outcome variables across surveys stratified by gender and age groups.
Table A2.
Prevalence (%) of outcome variables across surveys stratified by gender and age groups.
| Males | Females | |||||||
|---|---|---|---|---|---|---|---|---|
| 2010 | 2014 | 2018 | Overall | 2010 | 2014 | 2018 | Overall | |
| LS | ||||||||
| Age | ||||||||
| 11 years | 47.8 | 40.9 | 43.0 | 44.0 | 49.5 | 42.3 | 44.2 | 45.3 |
| 13 years | 34.4 | 29.5 | 31.4 | 31.8 | 29.6 | 22.5 | 25.7 | 26.0 |
| 15 years | 24.1 | 18.8 | 20.3 | 21.1 | 16.5 | 12.3 | 13.6 | 14.2 |
| HC | ||||||||
| Age | ||||||||
| 11 years | 41.7 | 36 | 42.9 | 40.4 | 48.4 | 46.4 | 50.7 | 48.6 |
| 13 years | 36.5 | 35.3 | 41.5 | 38.0 | 55.9 | 61.3 | 64.3 | 60.6 |
| 15 years | 38.2 | 39.4 | 44.2 | 40.7 | 63.5 | 69.9 | 72.9 | 68.7 |
| PSY-HC | ||||||||
| Age | ||||||||
| 11 years | 26.7 | 25.4 | 31.5 | 28.0 | 28.6 | 30.5 | 37.6 | 32.5 |
| 13 years | 25.6 | 26.1 | 32.1 | 28.2 | 40.8 | 49.9 | 54.1 | 48.4 |
| 15 years | 29.6 | 30.5 | 35.9 | 32.1 | 49.1 | 60.1 | 63.3 | 57.3 |
| SOM-HC | ||||||||
| Age | ||||||||
| 11 years | 16.9 | 12.3 | 15.2 | 14.9 | 23.6 | 22.8 | 22.6 | 23.0 |
| 13 years | 12.1 | 11.2 | 13.7 | 12.4 | 23.1 | 27.5 | 28.2 | 26.3 |
| 15 years | 11.5 | 11.2 | 13.6 | 12.1 | 27.3 | 31.8 | 32.1 | 30.3 |
Abbreviations. LS: life satisfaction ≥ 9; HC: ≥2 health complaints more than once a week; PSY-HC: ≥2 psychological health complaints more than once a week; SOM-HC: ≥2 somatic health complaints more than once a week.
Table A3.
Multivariable logistic regression (OR (95%CI)) predicting feeling low, irritability, feeling nervous and sleeping difficulty (PSY-HC), stratified by gender and age groups.
Table A3.
Multivariable logistic regression (OR (95%CI)) predicting feeling low, irritability, feeling nervous and sleeping difficulty (PSY-HC), stratified by gender and age groups.
| Males | Females | |||||
|---|---|---|---|---|---|---|
| 11 Years | 13 Years | 15 Years | 11 Years | 13 Years | 15 Years | |
| Feelinglow | ||||||
| Overall trend from 2010 to 2018 (per year) | 0.99 (0.98–1.01) | 1.00 (0.98–1.01) | 1.00 (0.98–1.01) | 1.00 (0.98–1.02) | 1.00 (0.98–1.01) | 1.01 (0.99–1.02) |
| Survey | ||||||
| 2014 vs. 2010 | 0.93 (0.82–1.06) | 0.99 (0.88–1.13) | 0.97 (0.85–1.11) | 0.98 (0.83–1.16) | 1.07 (0.95–1.22) | 1.23 (1.08–1.40) |
| 2018 vs. 2010 | 0.93 (0.83–1.04) | 0.99 (0.88–1.12) | 0.98 (0.87–1.10) | 1.02 (0.87–1.19) | 0.99 (0.88–1.11) | 1.06 (0.94–1.18) |
| Irritability | ||||||
| Overall trend from 2010 to 2018 (per year) | 1.03 (1.01–1.04) | 1.03 (1.02–1.04) | 1.03 (1.02–1.05) | 1.03 (1.02–1.04) | 1.06 (1.04–1.08) | 1.07 (1.05–1.08) |
| Survey | ||||||
| 2014 vs. 2010 | 0.89 (0.78–1.01) | 0.95 (0.84–1.07) | 0.99 (0.87–1.12) | 1.09 (0.96–1.23) | 1.30 (1.12–1.51) | 1.32 (1.19–1.48) |
| 2018 vs. 2010 | 1.17 (1.05–1.31) | 1.21 (1.08–1.35) | 1.27 (1.14–1.40) | 1.26 (1.13–1.40) | 1.62 (1.41–1.85) | 1.68 (1.53–1.85) |
| Feelingnervous | ||||||
| Overall trend from 2010 to 2018 (per year) | 1.02 (1.00–1.04) | 1.03 (1.01–1.04) | 1.04 (1.02–1.06) | 1.03 (1.01–1.04) | 1.05 (1.04–1.07) | 1.05 (1.04–1.07) |
| Survey | ||||||
| 2014 vs. 2010 | 0.77 (0.67–0.88) | 0.81 (0.80–1.03) | 1.03 (0.90–1.18) | 0.89 (0.79–0.99) | 1.23 (1.07–1.41) | 1.14 (1.01–1.28) |
| 2018 vs. 2010 | 1.14 (1.00–1.30) | 1.21 (1.07–1.36) | 1.34 (1.20–1.51) | 1.22 (1.10–1.34) | 1.51 (1.33–1.72) | 1.46 (1.31–1.61) |
| Sleepingdifficulty | ||||||
| Overall trend from 2010 to 2018 (per year) | 1.03 (1.00–1.06) | 1.04 (1.02–1.06) | 1.08 (1.06–1.10) | 1.04 (1.01–1.07) | 1.09 (1.07–1.10) | 1.07 (1.06–1.09) |
| Survey | ||||||
| 2014 vs. 2010 | 0.83 (0.71–0.97) | 1.07 (0.92–1.25) | 1.27 (1.07–1.49) | 1.01 (0.79–1.28) | 1.37 (1.17–1.60) | 1.32 (1.17–1.48) |
| 2018 vs. 2010 | 1.22 (1.05–1.41) | 1.31 (1.14–1.51) | 1.79 (1.56–2.07) | 1.37 (1.10–1.71) | 1.91 (1.65–2.21) | 1.75 (1.58–1.94) |
In bold if p ≤ 0.05. Abbreviations. PSY-HC: ≥2 psychological health complaints more than once a week. Adjustment variables: survey year, family affluence scale, schoolwork pressure, classmate support, mother support, father support, family structure, immigration background, geographic area.
Table A4.
Multivariable logistic regression (OR (95%CI)) predicting LS, HC, PSY-HC, and SOM-HC, stratified by gender and age groups.
Table A4.
Multivariable logistic regression (OR (95%CI)) predicting LS, HC, PSY-HC, and SOM-HC, stratified by gender and age groups.
| Males | Females | |||||
|---|---|---|---|---|---|---|
| 11 Years | 13 Years | 15 Years | 11 Years | 13 Years | 15 Years | |
| LS | ||||||
| Survey | ||||||
| 2014 vs. 2010 | 0.84 (0.74–0.94) | 0.85 (0.76–0.95) | 0.75 (0.65–0.88) | 0.81 (0.72–0.91) | 0.79 (0.69–0.91) | 0.80 (0.67–0.95) |
| 2018 vs. 2010 | 0.92 (0.83–1.02) | 0.99 (0.89–1.09) | 0.97 (0.77–0.99) | 0.89 (0.79–1.00) | 1.01 (0.89–1.14) | 0.97 (0.83–1.13) |
| FAS | ||||||
| Middle vs. low | 1.15 (1.00–1.33) | 1.27 (1.11–1.45) | 1.42 (1.12–1.79) | 1.09 (0.97–1.23) | 1.45 (1.24–1.69) | 1.27 (1.04–1.56) |
| High vs. low | 1.48 (1.31–1.68) | 1.46 (1.23–1.74) | 1.85 (1.49–2.30) | 1.33 (1.16–1.52) | 1.73 (1.48–2.03) | 1.55 (1.26–1.90) |
| High school work pressure | 0.60 (0.55–0.66) | 0.71 (0.65–0.79) | 0.74 (1.67–0.82) | 0.64 (0.58–0.70) | 0.62 (0.56–0.70) | 0.63 (0.55–0.72) |
| Nontraditional family structure | 0.64 (0.57–0.72) | 0.70 (0.62–0.79) | 0.89 (0.7–1.08) | 0.68 (0.58–0.81) | 0.60 (0.49–0.71) | 0.84 (0.63–1.11) |
| Good mother support | 1.35 (1.14–1.60) | 1.59 (1.37–1.84) | 1.82 (1.53–2.16) | 1.71 (1.45–2.00) | 2.22 (1.79–2.76) | 2.21 (1.90–2.58) |
| Good father support | 1.58 (1.34–1.86) | 1.86 (1.66–2.08) | 1.83 (1.59–2.10) | 2.09 (1.89–2.30) | 2.08 (1.87–2.30) | 1.97 (1.72–2.25) |
| Good classmate support | 2.06 (1.75–2.44) | 1.89 (1.66–2.14) | 1.82 (1.57–2.11) | 2.11 (1.85–2.40) | 1.82 (1.62–2.06) | 1.65 (1.41–1.93) |
| Geographic area | ||||||
| Centre vs. northern | 1.15 (1.04–1.28) | 1.17 (1.04–1.32) | 1.10 (0.96–1.27) | 1.07 (0.94–1.21) | 1.07 (0.94–1.22) | 0.93 (0.79–1.08) |
| Southern vs. northern | 1.21 (1.09–1.35) | 1.46 (1.23–1.74) | 1.19 (1.04–1.36) | 1.20 (1.07–1.34) | 1.12 (0.99–1.27) | 1.09 (0.93–1.26) |
| Immigration background | 0.91 (0.79–1.05) | 0.95 (0.82–1.09) | 1.16 (0.96–1.41) | 0.91 (0.80–1.03) | 0.89 (0.77–1.03) | 1.01 (0.83–1.24) |
| HC | ||||||
| Survey | ||||||
| 2014 vs. 2010 | 0.70 (0.63–0.78) | 0.90 (0.79–1.01) | 1.04 (0.93–1.17) | 0.83 (0.72–0.94) | 1.11 (0.99–1.24) | 1.17 (1.02–1.33) |
| 2018 vs. 2010 | 0.92 (0.83–1.02) | 1.13 (1.01–1.26) | 1.20 (1.09–1.32) | 0.93 (0.83–1.05) | 1.26 (1.14–1.38) | 1.33 (1.19–1.49) |
| FAS | ||||||
| Middle vs. low | 0.81 (0.72–0.91) | 0.96 (0.85–1.09) | 0.89 (0.77–1.04) | 0.88 (0.77–0.99) | 0.82 (0.71–0.94) | 0.85 (0.74–0.97) |
| High vs. low | 0.77 (0.67–0.89) | 0.84 (0.73–0.95) | 0.84 (0.71–0.98) | 0.83 (0.72–0.96) | 0.77 (0.67–0.88) | 0.75 (0.64–0.88) |
| High school work pressure | 2.50 (2.29–2.74) | 2.15 (1.95–2.37) | 2.21 (2.03–2.41) | 2.64 (2.40–2.90) | 2.55 (2.32–2.80) | 2.22 (2.00–2.47) |
| Nontraditional family structure | 1.29 (1.12–1.49) | 1.37 (1.19–1.58) | 1.23 (1.06–1.44) | 1.35 (1.19–1.53) | 1.25 (1.09–1.44) | 1.20 (1.02–1.41) |
| Good mother support | 0.77 (0.66–0.90) | 0.77 (0.68–0.87) | 0.67 (0.59–0.76) | 0.69 (0.57–0.79) | 0.56 (0.45–0.70) | 0.57 (0.51–0.64) |
| Good father support | 0.63 (0.56–0.71) | 0.62 (0.54–0.72) | 0.59 (0.54–0.66) | 0.56 (0.51–0.61) | 0.49 (0.44–0.55) | 0.66 (0.59–0.73) |
| Good classmate support | 0.49 (0.43–0.55) | 0.50 (0.45–0.55) | 0.51 (0.46–0.56) | 0.54 (0.46–0.63) | 0.61 (0.56–0.67) | 0.64 (0.57–0.73) |
| Geographic area | ||||||
| Centre vs. northern | 1.24 (1.11–1.40) | 1.10 (0.98–1.24) | 1.08 (0.98–1.20) | 1.19 (1.07–1.33) | 1.19 (1.07–1.33) | 1.36 (1.22–1.53) |
| Southern vs. northern | 1.35 (1.22–1.49) | 1.19 (1.06–1.33) | 1.24 (1.06–1.44) | 1.53 (1.36–1.72) | 1.59 (1.44–1.76) | 1.63 (1.44–1.85) |
| Immigration background | 1.17 (1.02–1.35) | 0.90 (0.79–1.04) | 1.03 (0.89–1.19) | 0.98 (0.85–1.12) | 1.10 (0.91–1.33) | 1.04 (0.87–1.24) |
| SOM-HC | ||||||
| Survey | ||||||
| 2014 vs. 2010 | 0.67 (0.57–0.78) | 0.88 (0.75–1.03) | 0.85 (0.66–1.10) | 0.93 (0.82–1.05) | 1.17 (1.04–1.31) | 1.15 (0.98–1.36) |
| 2018 vs. 2010 | 0.86 (0.74–0.99) | 1.04 (0.91–1.19) | 1.07 (0.85–1.33) | 0.86 (0.76–0.96) | 1.20 (1.09–1.33) | 1.20 (1.03–1.39) |
| FAS | ||||||
| Middle vs. low | 0.79 (0.67–0.93) | 0.98 (0.83–1.18) | 0.75 (0.62–0.90) | 0.84 (0.74–0.97) | 0.95 (0.92–1.10) | 0.83 (0.72–0.94) |
| High vs. low | 0.85 (0.71–1.02) | 0.89 (0.73–1.09) | 0.69 (0.56–0.84) | 0.86 (0.75–1.00) | 0.95 (0.83–1.08) | 0.82 (0.71–0.94) |
| High school work pressure | 1.91 (1.65–2.21) | 1.92 (1.63–2.27) | 1.74 (1.53–1.99) | 1.89 (1.69–2.11) | 1.87 (1.68–2.09) | 1.79 (1.61–2.00) |
| Nontraditional family structure | 1.12 (0.95–1.33) | 1.39 (1.13–1.71) | 1.12 (0.87–1.43) | 1.31 (1.10–1.57) | 1.30 (1.09–1.55) | 1.02 (0.85–1.23) |
| Good mother support | 0.79 (0.66–0.96) | 0.83 (0.71–0.98) | 0.90 (0.77–1.05) | 0.74 (0.61–0.89) | 0.75 (0.65–0.87) | 0.78 (0.71–0.86) |
| Good father support | 0.84 (0.71–0.99) | 0.80 (0.69–0.92) | 0.73 (0.63–0.86) | 0.74 (0.66–0.83) | 0.69 (0.63–0.77) | 0.77 (0.70–0.85) |
| Good classmate support | 0.74 (0.64–0.87) | 0.66 (0.56–0.77) | 0.63 (0.53–0.73) | 0.79 (0.68–0.92) | 0.72 (0.64–0.81) | 0.78 (0.70–0.86) |
| Geographic area | ||||||
| Centre vs. northern | 1.21 (1.03–1.43) | 1.08 (0.93–1.29) | 1.11 (0.95–1.30) | 1.28 (1.13–1.45) | 1.10 (0.96–1.25) | 1.30 (1.15–1.46) |
| Southern vs. northern | 1.63 (1.42–1.88) | 1.30 (1.12–1.51) | 1.22 (1.02–1.47) | 1.65 (1.46–1.87) | 1.53 (1.38–1.69) | 1.41 (1.24–1.59) |
| Immigration background | 1.09 (0.90–1.32) | 0.92 (0.76–1.11) | 1.13 (0.92–1.38) | 1.01 (0.86–1.19) | 1.03 (0.87–1.21) | 1.10 (0.94–1.27) |
| PSY-HC | ||||||
| Survey | ||||||
| 2014 vs. 2010 | 0.85 (0.76–0.95) | 0.94 (0.83–1.07) | 1.08 (0.95–1.22) | 0.96 (0.83–1.11) | 1.24 (1.10–1.39) | 1.40 (1.25–1.57) |
| 2018 vs. 2010 | 1.13 (1.02–1.25) | 1.26 (1.13–1.41) | 1.33 (1.20–1.48) | 1.26 (1.11–1.44) | 1.48 (1.32–1.65) | 1.56 (1.42–1.72) |
| FAS | ||||||
| Middle vs. low | 0.87 (0.77–0.99) | 1.00 (0.87–1.15) | 1.01 (0.87–1.18) | 0.91 (0.79–1.04) | 0.86 (0.77–0.97) | 0.99 (0.86–1.13) |
| High vs. low | 0.85 (0.73–0.98) | 0.84 (0.72–0.97) | 1.02 (0.86–1.20) | 0.87 (0.75–1.00) | 0.85 (0.74–0.97) | 0.85 (0.74–0.99) |
| High school work pressure | 2.54 (2.30–2.81) | 2.15 (1.95–2.38) | 2.20 (2.01–2.42) | 2.67 (2.60–2.97) | 2.49 (2.26–2.74) | 2.29 (2.04–2.57) |
| Nontraditional family structure | 1.25 (1.08–1.44) | 1.37 (1.18–1.59) | 1.21 (1.05–1.40) | 1.28 (1.11–1.48) | 1.23 (1.06–1.43) | 1.30 (1.11–1.51) |
| Good mother support | 0.79 (0.68–0.92) | 0.73 (0.63–0.84) | 0.59 (0.52–0.67) | 0.60 (0.52–0.70) | 0.51 (0.43–0.61) | 0.55 (0.59–0.63) |
| Good father support | 0.59 (0.51–0.67) | 0.62 (0.53–0.72) | 0.58 (0.51–0.65) | 0.53 (0.48–0.58) | 0.53 (0.48–0.59) | 0.65 (0.58–0.73) |
| Good classmate support | 0.47 (0.41–0.54) | 0.45 (0.40–0.51) | 0.48 (0.43–0.53) | 0.51 (0.45–0.58) | 0.57 (0.51–0.63) | 0.65 (0.59–0.72) |
| Geographic area | ||||||
| Centre vs. northern | 1.20 (1.06–1.34) | 1.10 (0.96–1.24)) | 1.10 (0.99–1.23) | 1.06 (0.94–1.19) | 1.09 (0.96–1.24) | 1.28 (1.15–1.42) |
| Southern vs. northern | 1.20 (1.08–1.34) | 1.10 (0.98–1.24) | 1.19 (1.06–1.33) | 1.23 (1.08–1.40) | 1.40 (1.26–1.57) | 1.61 (1.44–1.79) |
| Immigration background | 1.18 (1.03–1.36) | 0.94 (0.81--1.08) | 0.98 (0.84–1.14) | 0.98 (0.86–1.13) | 1.10 (0.93–1.30) | 1.08 (0.92–1.27) |
In bold if p ≤ 0.05. Abbreviations. LS: life satisfaction ≥ 9; HC: ≥2 health complaints more than once a week; PSY-HC: ≥2 psychological health complaints more than once a week; SOM-HC: ≥2 somatic health complaints more than once a week; FAS: family affluence scale. Adjustment variables: survey year, family affluence scale, schoolwork pressure, classmate support, mother support, father support, family structure, immigration background, geographic area.
References
- WHO. Preamble to the Constitution of the World Health Organization as Adopted by the International Health Conference, New York, 19–22 June 1946; World Health Organization: Geneva, Switzerland, 1948; p. 2. [Google Scholar]
- Giltay, E.J.; Geleijnse, J.M.; Zitman, F.G.; Hoekstra, T.; Schouten, E.G. Dispositional Optimism and All-Cause and Cardiovascular Mortality In a Prospective Cohort of Elderly Dutch Men and Women. Arch. Gen. Psychiatry 2004, 61, 1126. [Google Scholar] [CrossRef] [PubMed]
- Bronfenbrenner, U. Ecological Systems Theory. In Six Theories of Child Development: Revised Formulations and Current Issues; Jessica Kingsley Publishers: London, UK, 1992; pp. 187–249. ISBN 1-85302-137-7. [Google Scholar]
- Bronfenbrenner, U.; Ceci, S.J. Nature-Nurture Reconceptualized in Developmental Perspective: A Bioecological Model. Psychol. Rev. 1994, 101, 568–586. [Google Scholar] [CrossRef] [PubMed]
- Herrman, H.; Saxena, S.; Moodie, R.; World Health Organization; Victorian Health Promotion Foundation; University of Melbourne (Eds.) Promoting Mental Health: Concepts, Emerging Evidence, Practice; World Health Organization: Geneva, Switzerland, 2005; ISBN 978-92-4-156294-2.
- Murray, C.J.L.; Lopez, A.D.; Harvard School of Public Health; World Health Organization; World Bank (Eds.) The Global Burden of Disease: A Comprehensive Assessment of Mortality and Disability from Diseases, Injuries, and Risk Factors in 1990 and Projected to 2020; Global Burden of Disease and Injury Series; Harvard School of Public Health on behalf of the World Health Organization and the World Bank: Cambridge, MA, USA, 1996; ISBN 978-0-674-35448-7. [Google Scholar]
- Sawyer, S.M.; Afifi, R.A.; Bearinger, L.H.; Blakemore, S.-J.; Dick, B.; Ezeh, A.C.; Patton, G.C. Adolescence: A Foundation for Future Health. Lancet 2012, 379, 1630–1640. [Google Scholar] [CrossRef]
- Solmi, M.; Radua, J.; Olivola, M.; Croce, E.; Soardo, L.; Salazar de Pablo, G.; Il Shin, J.; Kirkbride, J.B.; Jones, P.; Kim, J.H.; et al. Age at Onset of Mental Disorders Worldwide: Large-Scale Meta-Analysis of 192 Epidemiological Studies. Mol. Psychiatry 2021. [Google Scholar] [CrossRef] [PubMed]
- Levin, K.A.; Currie, C.; Muldoon, J. Mental Well-Being and Subjective Health of 11- to 15-Year-Old Boys and Girls in Scotland, 1994–2006. Eur. J. Public Health 2009, 19, 605–610. [Google Scholar] [CrossRef]
- Braverman, M.T.; Stawski, R.S.; Samdal, O.; Aarø, L.E. Daily Smoking and Subjective Health Complaints in Adolescence. Nicotine Tob. Res. 2017, 19, 102–110. [Google Scholar] [CrossRef]
- Dey, M.; Jorm, A.F.; Mackinnon, A.J. Cross-Sectional Time Trends in Psychological and Somatic Health Complaints among Adolescents: A Structural Equation Modelling Analysis of ‘Health Behaviour in School-Aged Children’ Data from Switzerland. Soc. Psychiatry Psychiatr. Epidemiol. 2015, 50, 1189–1198. [Google Scholar] [CrossRef]
- Savoye, I.; Moreau, N.; Brault, M.-C.; Levêque, A.; Godin, I. Well-Being, Gender, and Psychological Health in School-Aged Children. Arch. Public Health 2015, 73, 52. [Google Scholar] [CrossRef]
- Kim, K.J.; Conger, R.D.; Elder, G.H.; Lorenz, F.O. Reciprocal Influences Between Stressful Life Events and Adolescent Internalizing and Externalizing Problems. Child Dev. 2003, 74, 127–143. [Google Scholar] [CrossRef]
- Kessler, R.C.; Angermeyer, M.; Anthony, J.C.; DE Graaf, R.; Demyttenaere, K.; Gasquet, I.; DE Girolamo, G.; Gluzman, S.; Gureje, O.; Haro, J.M.; et al. Lifetime Prevalence and Age-of-Onset Distributions of Mental Disorders in the World Health Organization’s World Mental Health Survey Initiative. World Psychiatry 2007, 6, 168–176. [Google Scholar]
- Inchley, J.; Currie, D.; Budisavljević, S.; Torsheim, T.; Jaastad, A.; Cosma, A.; Kelly, C.; Arnarsson, A.; Samdal, O.; Weber, M. Spotlight on Adolescent Health and Well-Being Findings from the 2017/2018 Health Behaviour in School-Aged Children (HBSC) Survey in Europe and Canada International Report Volume 2. Key Data; WHO Regional Office for Europe: Copenhagen, Denmark, 2020; ISBN 978-92-890-5501-7. [Google Scholar]
- Cosma, A.; Stevens, G.; Martin, G.; Duinhof, E.L.; Walsh, S.D.; Garcia-Moya, I.; Költő, A.; Gobina, I.; Canale, N.; Catunda, C.; et al. Cross-National Time Trends in Adolescent Mental Well-Being From 2002 to 2018 and the Explanatory Role of Schoolwork Pressure. J. Adolesc. Health 2020, 66, S50–S58. [Google Scholar] [CrossRef]
- Potrebny, T.; Wiium, N.; Lundegård, M.M.-I. Temporal Trends in Adolescents’ Self-Reported Psychosomatic Health Complaints from 1980-2016: A Systematic Review and Meta-Analysis. PLoS ONE 2017, 12, e0188374. [Google Scholar] [CrossRef]
- Gariépy, G.; Elgar, F.J. Trends in Psychological Symptoms among Canadian Adolescents from 2002 to 2014: Gender and Socioeconomic Differences. Can. J. Psychiatry 2016, 61, 797–802. [Google Scholar] [CrossRef] [PubMed]
- Hagquist, C. Discrepant Trends in Mental Health Complaints Among Younger and Older Adolescents in Sweden: An Analysis of WHO Data 1985–2005. J. Adolesc. Health 2010, 46, 258–264. [Google Scholar] [CrossRef] [PubMed]
- Potrebny, T.; Wiium, N.; Haugstvedt, A.; Sollesnes, R.; Torsheim, T.; Wold, B.; Thuen, F. Health Complaints among Adolescents in Norway: A Twenty-Year Perspective on Trends. PLoS ONE 2019, 14, e0210509. [Google Scholar] [CrossRef] [PubMed]
- Fink, E.; Patalay, P.; Sharpe, H.; Holley, S.; Deighton, J.; Wolpert, M. Mental Health Difficulties in Early Adolescence: A Comparison of Two Cross-Sectional Studies in England From 2009 to 2014. J. Adolesc. Health 2015, 56, 502–507. [Google Scholar] [CrossRef]
- Cavallo, F.; Dalmasso, P.; Ottova-Jordan, V.; Brooks, F.; Mazur, J.; Valimaa, R.; Gobina, I.; Gaspar de Matos, M.; Raven-Sieberer, U. The Positive Health Focus Group Trends in Life Satisfaction in European and North-American Adolescents from 2002 to 2010 in over 30 Countries. Eur. J. Public Health 2015, 25, 80–82. [Google Scholar] [CrossRef] [PubMed]
- Hodačová, L.; Hlaváčková, E.; Sigmundová, D.; Kalman, M.; Kopčáková, J. Trends in Life Satisfaction and Self-Rated Health in Czech School-Aged Children: HBSC Study. Cent. Eur. J. Public Health 2017, 25, S51–S56. [Google Scholar] [CrossRef]
- Högberg, B.; Strandh, M.; Hagquist, C. Gender and Secular Trends in Adolescent Mental Health over 24 Years—The Role of School-Related Stress. Soc. Sci. Med. 2020, 250, 112890. [Google Scholar] [CrossRef]
- Bi, S.; Stevens, G.W.J.M.; Maes, M.; Boer, M.; Delaruelle, K.; Eriksson, C.; Brooks, F.M.; Tesler, R.; van der Schuur, W.A.; Finkenauer, C. Perceived Social Support from Different Sources and Adolescent Life Satisfaction Across 42 Countries/Regions: The Moderating Role of National-Level Generalized Trust. J. Youth Adolesc. 2021, 50, 1384–1409. [Google Scholar] [CrossRef] [PubMed]
- Levin, K.A.; Currie, C. Family Structure, Mother-child Communication, Father-child Communication, and Adolescent Life Satisfaction: A Cross-sectional Multilevel Analysis. Health Educ. 2010, 110, 152–168. [Google Scholar] [CrossRef]
- Moore, G.F.; Cox, R.; Evans, R.E.; Hallingberg, B.; Hawkins, J.; Littlecott, H.J.; Long, S.J.; Murphy, S. School, Peer and Family Relationships and Adolescent Substance Use, Subjective Wellbeing and Mental Health Symptoms in Wales: A Cross Sectional Study. Child Indic. Res. 2018, 11, 1951–1965. [Google Scholar] [CrossRef] [PubMed]
- Zozaya, N.; Vallejo, L. The Effect of the Economic Crisis on Adolescents’ Perceived Health and Risk Behaviors: A Multilevel Analysis. Int. J. Environ. Res. Public Health 2020, 17, 643. [Google Scholar] [CrossRef]
- Walsh, S.D.; Harel-Fisch, Y.; Fogel-Grinvald, H. Parents, Teachers and Peer Relations as Predictors of Risk Behaviors and Mental Well-Being among Immigrant and Israeli Born Adolescents. Soc. Sci. Med. 2010, 70, 976–984. [Google Scholar] [CrossRef]
- Kim, Y.; Hagquist, C. Trends in Adolescent Mental Health during Economic Upturns and Downturns: A Multilevel Analysis of Swedish Data 1988-2008. J. Epidemiol. Community Health 2018, 72, 101–108. [Google Scholar] [CrossRef] [PubMed]
- Weinberg, D.; Stevens, G.W.J.M.; Duinhof, E.L.; Finkenauer, C. Adolescent Socioeconomic Status and Mental Health Inequalities in the Netherlands, 2001–2017. Int. J. Environ. Res. Public Health 2019, 16, 3605. [Google Scholar] [CrossRef] [PubMed]
- Lazzeri, G.; Giacchi, M.V.; Dalmasso, P. The Methodology of the Italian HBSC 2010 Study (Health Behaviour in School-Aged Children). Ann. Ig. Med. Prev. E Comunità 2013, 25, 225–233. [Google Scholar] [CrossRef]
- Cavallo, F.; Lemma, P.; Dalmasso, P.; Vieno, A.; Lazzeri, G.; Galeone, D. Report Nazionale dati HBSC Italia 2014: 4° Rapporto sui dati HBSC Italia 2014; Stampatre s.r.l: Torino, Italy, 2016. [Google Scholar]
- Nardone, P.; Pierannunzio, D.; Ciardullo, S.; Lazzeri, G.; Cappello, N.; Spinelli, A. 2018 HBSC-Italia Group; the 2018 HBSC-Italia Group. Dietary Habits among Italian Adolescents and Their Relation to Socio-Demographic Characteristics. Ann. Dell'istituto Super Sanità 2020, 56, 504–513. [Google Scholar] [CrossRef]
- Cantril, H. Pattern of Human Concerns; Rutgers University Press: New Brunswick, NJ, USA, 1965. [Google Scholar]
- Levin, K.A.; Currie, C. Reliability and Validity of an Adapted Version of the Cantril Ladder for Use with Adolescent Samples. Soc. Indic. Res. 2014, 119, 1047–1063. [Google Scholar] [CrossRef]
- Mazur, J.; Szkultecka-Dębek, M.; Dzielska, A.; Drozd, M.; Małkowska-Szkutnik, A. What Does the Cantril Ladder Measure in Adolescence? Arch. Med. Sci. 2018, 1, 182–189. [Google Scholar] [CrossRef]
- Haugland, S.; Wold, B. Subjective Health Complaints in Adolescence—Reliability and Validity of Survey Methods. J. Adolesc. 2001, 24, 611–624. [Google Scholar] [CrossRef]
- Ravens-Sieberer, U.; Gosch, A.; Rajmil, L.; Erhart, M.; Bruil, J.; Power, M.; Duer, W.; Auquier, P.; Cloetta, B.; Czemy, L.; et al. The KIDSCREEN-52 Quality of Life Measure for Children and Adolescents: Psychometric Results from a Cross-Cultural Survey in 13 European Countries. Value Health 2008, 11, 645–658. [Google Scholar] [CrossRef]
- Hagquist, C.; Välimaa, R.; Simonsen, N.; Suominen, S. Differential Item Functioning in Trend Analyses of Adolescent Mental Health—Illustrative Examples Using HBSC-Data from Finland. Child Indic. Res. 2017, 10, 673–691. [Google Scholar] [CrossRef]
- Haugland, S. Subjective Health Complaints in Adolescence: A Cross-National Comparison of Prevalence and Dimensionality. Eur. J. Public Health 2001, 11, 4–10. [Google Scholar] [CrossRef] [PubMed]
- Istituto Nazionale di Statistica—ISTAT. Annuario Statistico Italiano 2019; ISTAT: Roma, Italy, 2019. [Google Scholar]
- Currie, C.; Molcho, M.; Boyce, W.; Holstein, B.; Torsheim, T.; Richter, M. Researching Health Inequalities in Adolescents: The Development of the Health Behaviour in School-Aged Children (HBSC) Family Affluence Scale. Soc. Sci. Med. 2008, 66, 1429–1436. [Google Scholar] [CrossRef]
- Torsheim, T.; Wold, B.; Samdal, O. The Teacher and Classmate Support Scale: Factor Structure, Test-Retest Reliability and Validity in Samples of 13-and 15-Year-Old Adolescents. Sch. Psychol. Int. 2000, 21, 195–212. [Google Scholar] [CrossRef]
- Growing up Unequal: Gender and Socioeconomic Differences in Young People’s Health and Well-Being: Health Behaviour in School-Aged Children (HBSC) Study: International Report from the 2013/2014 Survey; Health policy for children and adolescents; Inchley, J., Currie, D., Young, T., Samdal, O., Torsheim, T., Augustson, L., Mathison, F., Aleman-Diaz, A.Y., Molcho, M., Weber, M.W., et al., Eds.; World Health Organization Regional Office for Europe: Copenhagen, Denmark, 2016; ISBN 978-92-890-5136-1. [Google Scholar]
- Le Poire, B.A. Family Communication Nurturing and Control in a Changing World; SAGE: Thousand Oaks, CA, USA; London, UK, 2006; ISBN 978-1-4522-3304-8. [Google Scholar]
- Inchley, J.; Currie, D.; Cosma, A.; Samdal, O. (Eds.) Health Behaviour in School-Aged Children (HBSC) Study Protocol: Background, Methodology and Mandatory Items for the 2017/18 Survey; CAHRU: St Andrews, UK, 2018. [Google Scholar]
- Bjarnason, T.; Bendtsen, P.; Arnarsson, A.M.; Borup, I.; Iannotti, R.J.; Löfstedt, P.; Haapasalo, I.; Niclasen, B. Life Satisfaction Among Children in Different Family Structures: A Comparative Study of 36 Western Societies: Life Satisfaction and Family Structures. Child. Soc. 2012, 26, 51–62. [Google Scholar] [CrossRef]
- Hetland, J.; Torsheim, T.; Aarø, L.E. Subjective Health Complaints in Adolescence: Dimensional Structure and Variation across Gender and Age. Scand. J. Public Health 2002, 30, 223–230. [Google Scholar] [CrossRef] [PubMed][Green Version]
- Greenspoon, P.J.; Saklofske, D.H. Toward an Integration of Subjective Well-Being and Psychopathology. Soc. Indic. Res. 2001, 54, 81–108. [Google Scholar] [CrossRef]
- Westerhof, G.J.; Keyes, C.L.M. Mental Illness and Mental Health: The Two Continua Model Across the Lifespan. J. Adult Dev. 2010, 17, 110–119. [Google Scholar] [CrossRef] [PubMed]
- Keyes, C.L.M. Mental Health as a Complete State: How the Salutogenic Perspective Completes the Picture. In Bridging Occupational, Organizational and Public Health; Springer: Dordrecht, The Netherlands, 2014; pp. 179–192. ISBN 978-94-007-5639-7. [Google Scholar]
- Wang, H.; Lin, S.L.; Leung, G.M.; Schooling, C.M. Age at Onset of Puberty and Adolescent Depression: “Children of 1997” Birth Cohort. Pediatrics 2016, 137, e20153231. [Google Scholar] [CrossRef] [PubMed]
- Galvao, T.F.; Silva, M.T.; Zimmermann, I.R.; Souza, K.M.; Martins, S.S.; Pereira, M.G. Pubertal Timing in Girls and Depression: A Systematic Review. J. Affect. Disord. 2014, 155, 13–19. [Google Scholar] [CrossRef] [PubMed]
- Bor, W.; Dean, A.J.; Najman, J.; Hayatbakhsh, R. Are Child and Adolescent Mental Health Problems Increasing in the 21st Century? A Systematic Review. Aust. N. Z. J. Psychiatry 2014, 48, 606–616. [Google Scholar] [CrossRef] [PubMed]
- Kramer, M.D.; Krueger, R.F.; Hicks, B.M. The Role of Internalizing and Externalizing Liability Factors in Accounting for Gender Differences in the Prevalence of Common Psychopathological Syndromes. Psychol. Med. 2008, 38, 51–61. [Google Scholar] [CrossRef]
- Högberg, B.; Lindgren, J.; Johansson, K.; Strandh, M.; Petersen, S. Consequences of School Grading Systems on Adolescent Health: Evidence from a Swedish School Reform. J. Educ. Policy 2021, 36, 84–106. [Google Scholar] [CrossRef]
- West, P.; Sweeting, H. Fifteen, Female and Stressed: Changing Patterns of Psychological Distress over Time: Increased Psychological Distress among Females over Time. J. Child Psychol. Psychiatry 2003, 44, 399–411. [Google Scholar] [CrossRef] [PubMed]
- Wiklund, M.; Malmgren-Olsson, E.-B.; Öhman, A.; Bergström, E.; Fjellman-Wiklund, A. Subjective Health Complaints in Older Adolescents Are Related to Perceived Stress, Anxiety and Gender—A Cross-Sectional School Study in Northern Sweden. BMC Public Health 2012, 12, 993. [Google Scholar] [CrossRef] [PubMed]
- Levin, K.A.; Dallago, L.; Currie, C. The Association Between Adolescent Life Satisfaction, Family Structure, Family Affluence and Gender Differences in Parent–Child Communication. Soc. Indic. Res. 2012, 106, 287–305. [Google Scholar] [CrossRef]
- Elgar, F.J.; Craig, W.; Trites, S.J. Family Dinners, Communication, and Mental Health in Canadian Adolescents. J. Adolesc. Health 2013, 52, 433–438. [Google Scholar] [CrossRef]
- Matos, M.G.; Dadds, M.R.; Barrett, P.M. Family-Related School Issues and the Mental Health of Adolescents: Post Hoc Analyses of the Portuguese National Health Behaviour in School-Aged Children Survey Data 1. J. Fam. Stud. 2006, 12, 261–275. [Google Scholar] [CrossRef]
- Freeman, J.G.; Samdal, O.; Băban, A.; Bancila, D. The Relationship Between School Perceptions and Psychosomatic Complaints: Cross-Country Differences Across Canada, Norway, and Romania. Sch. Ment. Health 2012, 4, 95–104. [Google Scholar] [CrossRef]
- Torsheim, T.; Wold, B. School-Related Stress, Support, and Subjective Health Complaints among Early Adolescents: A Multilevel Approach. J. Adolesc. 2001, 24, 701–713. [Google Scholar] [CrossRef]
- Moreno, C.; Sánchez-Queija, I.; Muñoz-Tinoco, V.; de Matos, M.G.; Dallago, L.; Bogt, T.T.; Camacho, I.; Rivera, F. The HBSC Peer Culture Focus Group Cross-National Associations between Parent and Peer Communication and Psychological Complaints. Int. J. Public Health 2009, 54, 235–242. [Google Scholar] [CrossRef] [PubMed]
- Ottova-Jordan, V.; Smith, O.R.F.; Augustine, L.; Gobina, I.; Rathmann, K.; Torsheim, T.; Mazur, J.; Valimaa, R.; Cavallo, F.; Jericek Klanscek, H.; et al. Trends in Health Complaints from 2002 to 2010 in 34 Countries and Their Association with Health Behaviours and Social Context Factors at Individual and Macro-Level. Eur. J. Public Health 2015, 25, 83–89. [Google Scholar] [CrossRef]
- Marino, C.; Lenzi, M.; Canale, N.; Pierannunzio, D.; Dalmasso, P.; Borraccino, A.; Cappello, N.; Lemma, P.; Vieno, A. Problematic Social Media Use: Associations with Health Complaints among Adolescents. Ann. Dell'istituto Super. Di Sanità 2020, 56, 514–521. [Google Scholar] [CrossRef]
- Nelson, M.C.; Neumark-Stzainer, D.; Hannan, P.J.; Sirard, J.R.; Story, M. Longitudinal and Secular Trends in Physical Activity and Sedentary Behavior during Adolescence. Pediatrics 2006, 118, e1627–e1634. [Google Scholar] [CrossRef]
- Torsheim, T.; Eriksson, L.; Schnohr, C.W.; Hansen, F.; Bjarnason, T.; Välimaa, R. Screen-Based Activities and Physical Complaints among Adolescents from the Nordic Countries. BMC Public Health 2010, 10, 324. [Google Scholar] [CrossRef] [PubMed]
- Kelly, Y.; Zilanawala, A.; Booker, C.; Sacker, A. Social Media Use and Adolescent Mental Health: Findings From the UK Millennium Cohort Study. EClinicalMedicine 2018, 6, 59–68. [Google Scholar] [CrossRef]
- Lin, L.Y.; Sidani, J.E.; Shensa, A.; Radovic, A.; Miller, E.; Colditz, J.B.; Hoffman, B.L.; Giles, L.M.; Primack, B.A. Association Between Social Media Use and Depression Among U.S. Young Adults. Depress. Anxiety 2016, 33, 323–331. [Google Scholar] [CrossRef]
- Nesi, J.; Prinstein, M.J. Using Social Media for Social Comparison and Feedback-Seeking: Gender and Popularity Moderate Associations with Depressive Symptoms. J. Abnorm. Child Psychol. 2015, 43, 1427–1438. [Google Scholar] [CrossRef] [PubMed]
- Paakkari, L.; Tynjälä, J.; Lahti, H.; Ojala, K.; Lyyra, N. Problematic Social Media Use and Health among Adolescents. Int. J. Environ. Res. Public Health 2021, 18, 1885. [Google Scholar] [CrossRef] [PubMed]
- Twenge, J.M.; Joiner, T.E.; Rogers, M.L.; Martin, G.N. Increases in Depressive Symptoms, Suicide-Related Outcomes, and Suicide Rates Among U.S. Adolescents After 2010 and Links to Increased New Media Screen Time. Clin. Psychol. Sci. 2018, 6, 3–17. [Google Scholar] [CrossRef]
- Ghekiere, A.; Van Cauwenberg, J.; Vandendriessche, A.; Inchley, J.; Gaspar de Matos, M.; Borraccino, A.; Gobina, I.; Tynjälä, J.; Deforche, B.; De Clercq, B. Trends in Sleeping Difficulties among European Adolescents: Are These Associated with Physical Inactivity and Excessive Screen Time? Int. J. Public Health 2019, 64, 487–498. [Google Scholar] [CrossRef] [PubMed]


Publisher’s Note: MDPI stays neutral with regard to jurisdictional claims in published maps and institutional affiliations. |
© 2022 by the authors. Licensee MDPI, Basel, Switzerland. This article is an open access article distributed under the terms and conditions of the Creative Commons Attribution (CC BY) license (https://creativecommons.org/licenses/by/4.0/).