Abstract
Adolescence represents a vulnerable phase of life for psychological health. The practice of physical activity (PA) appears to have a positive influence on adolescents, increasing self-esteem and producing a more positive body image. A systematic review of published articles over the past 10 years until June 2022 was conducted according to the PRISMA statement employing the electronic databases MEDLINE and Web of Science (639 records) to summarize the literature on the relationship between body image dissatisfaction (BID) and assessed by figural scales and practice of structured and unstructured PA in adolescents (10–18 years), taking into account BMI and/or weight status. All articles were independently reviewed using inclusion/exclusion criteria, retrieved data, and assessed quality with the adapted Newcastle-Ottawa Scale for observational studies. The main finding of interest that emerged from most of the 28 included studies is the negative association between BID and PA during adolescence: as PA increases, BID decreases. However, this updated systematic review also identified some flaws in the existing literature, highlighting the need for high-quality adolescent research using validated figural scales and objective PA assessments. In conclusion, the reviewed studies showed that PA involvement can be efficacious in protecting from body image perception concerns and enhancing body satisfaction. Future interventions should promote structured and unstructured PA during adolescence to improve self-esteem and body image.
1. Introduction
Overweight/obesity is a public health problem constituting an independent risk factor for several chronic non-communicable diseases and increased mortality [1,2]. Globally, there has been an increase in obesity and a decline in the underweight: the increase in obesity, including severe obesity, may be linked to increasing social disparities that limit healthy food access for people at the greatest risk of malnutrition [3]. According to WHO [4], the worldwide obesity prevalence nearly increased three-fold between 1975 and 2016, and more than 340 million children and adolescents (ages 5 to 19) were overweight or obese in 2016. During the recent COVID-19 pandemic, the increase in the rate of body mass index (BMI) almost doubled in comparison with the pre-pandemic period in persons aged 2–19 years [5].
There is scientific evidence that an unhealthy body image (BI) is linked to obesity and physical inactivity, exerting a key role in the emergence of eating disorders during adolescence. The image we have of our bodies is a dynamic feature that can change over a lifetime but the stage of adolescence is crucial for the development of a healthy BI due to the age-related transitions that occur during this period [6]. Sociocultural context greatly influences how adolescents perceive their bodies. The influence of body ideals interacts with the critical period of adolescence characterized by fast and diversified physical modifications that include changes in primary and secondary sexual characteristics, body shape, size, and composition. Key influences on BI include media, which target adolescents, and peers, which contribute to perceived body ideal beliefs. Especially the mass media can lead adolescents to internalize Western society’s ideals of physical attractiveness and beauty, leading to body dissatisfaction when these standards are perceived as not being met [7,8]. Recent findings have also shown that greater use of social media (Instagram and Snapchat) is associated with higher body dissatisfaction [9]. In accordance with sociocultural models of the development of body dissatisfaction and eating disorders [10], pressures on appearance from peers, family, and the media, and psychological processes participate in the onset and persistence of body dissatisfaction: internalization and pressures to conform to these socially prescribed body ideals explain the associations between weight status and BI [11].
Following Sirard and Pate [12], physical activity (PA) can be identified as any type of body motion generated by skeletal musculature that causes an expenditure of energy. Physical inactivity is one of the possible negative health consequences that may result from the interaction between weight status and BI. However, this consequence is controversial: overweight/obese individuals tend to avoid PA according to some studies [13], while others found no significant differences in reaching the recommended level of PA based on weight status [14]. PA is a health-promoting behavior, although it should be pointed out that compulsive exercise is a commonly used strategy to offset caloric intake or reduce body weight. A recent review [10] found that a positive BI is associated with greater participation in PA and sports, in contrast to a negative BI. The association between PA and BI is complex: while, on the one hand, PA practice results in perceptible physical changes (weight, body composition, etc.), thus contributing to self-confidence and consequently leading to improved BI, on the other hand, BI may discourage or motivate PA and sports participation [15]. Furthermore, sex affects the association between PA and BI differently, with girls showing a more complex relationship [16]. The role of sex in the relationship between BI and PA is still not fully elucidated probably due to possible differences between the two genders “in moderating variables that impact the relationship between PA and body image” [17]. The same notion of femininity complicates this relationship, driving girls to worry about their appearance when they are engaged in PA. In confirmation of this, a recent study showed a positive association between MVPA and self-esteem among boys only [18].
Previous studies have particularly emphasized BI in the female sex, due to its greater dissatisfaction and the prevalent desire to be thinner with significant differences between actual and ideal silhouettes [19]. The pattern in the two genders is indeed different with higher female body image dissatisfaction (BID), indicating the greater importance given by females to physical appearance compared to males [19]. The relationship between body dissatisfaction and BMI was found to be linear in females [20]. In males, less dissatisfaction has been evidenced, although this concerns both the overweight (wanting to be thinner) and the underweight (wanting to be larger): the relationship between BID and BMI is curvilinear [21].
A major limitation of some previous syntheses is to compare BI assessed by different methodologies (25 different measures of BI were found in the studies reviewed by the synthesis of Hausenblas and Downs [22]), including questionnaires, surveys, and figural scales. A recent systematic review [23] pointed out that figural scales are the most widely adopted visual tools for assessing BI and body perception, by measuring the discrepancy between perceived and ideal BI; they are quick, convenient, and inexpensive to administer.
Given the controversial findings in the literature and some limitations of the currently available syntheses, we thought it might be of major interest to explore the relationships between PA and BI assessed by figural stimuli, taking into account sex and weight status or BMI during adolescence, a phase of great physical and psychological changes and characterized by a strong reduction/abandonment of previously undertaken sports activities. Due to the lack of explicit theory to guide the study of BI and PA, within the framework usually employed [17,24,25], we considered sex, age, BI assessed by figural stimuli, and PA characteristics as specific key variables. In addition, BMI was considered as an additional variable related to individual characteristics. Therefore, the aims of this review are: i. to evaluate the associations between BI or BID and PA according to BMI or weight status in adolescents; ii. to allow a more complete and up-to-date synthesis of the studies that have been carried out in this area by figural scales over the past decade; iii. to extend the analysis on BI or BID to PA contexts related to lifestyle -not just structured PA. In addition, finding possible gaps in the existing literature can direct future research on specific aspects of the relationship between PA and BID.
2. Materials and Methods
This review was carried out according to the PRISMA guidelines (Preferred Reporting Items for Systematic Reviews and Meta-Analyses) [26]. The PRISMA checklist was reported in Supplementary Materials (Table S1). The protocol of this review was registered with PROSPERO (CRD42022342891).
2.1. Search Strategy and Selection Criteria
The systematic search was conducted in the PubMed and Web of Science databases on articles published in the last ten years until 13 June 2022 by the following combination of search terms: (“body image” or “body dissatisfaction” or “body satisfaction” or “body representation” or “silhouette scale”) and (anthropometry or BMI or weight or “fat mass” or adiposity or “body composition”) and (“sport activity” or “physical activity”) and adolescen*. No geographical or cultural limitations were applied. The topic analysis was first discussed and agreed upon by all three reviewers. Articles resulting from database searches were then imported into Covidence software (Veritas Health Innovation Ltd, Melbourne, Australia), where duplicate records were removed. The search was then continued manually and independently by two reviewers (L.Z. and N.R.), discussing with the third reviewer (E.G.-R.) in case of discrepancies. Further eligible studies were included through consultation of the reference lists of previously selected articles.
All quantitative studies that investigated the possible association between BI or BID and PA, taking body composition into account, were included. Editorials and commentaries, case studies, protocol studies, conference proceedings, books and book chapters, and theses were excluded. In addition, excluded were studies related to the development and/or validation of BI screening tools, and studies in which BI assessment focused on specific features (e.g., muscularity) or parts of the body (e.g., breasts). We detailed the selection criteria used in Table 1.

Table 1.
Inclusion and exclusion criteria used in the articles screening.
The relevant data were extracted from the selected articles as follows: article authors and year of publication; study design; geographical location; race/ethnicity; sample size; sex; age; BMI and/or weight status; PA assessment; silhouette rating scale used; BID and/or satisfaction; main outcomes according to the aims of this study. Due to the lack of quantitative homogeneity in the reviewed studies, we could not conduct a meta-analysis. The findings are therefore presented as a narrative analysis: all studies selected from the database searches were summarized in tabular form and organized in alphabetical order.
2.2. Quality Assessment
The quality assessment of selected studies was performed according to the adapted Newcastle-Ottawa Scale (NOS) [27] for observational studies. NOS is based on (1) clarity of the study objective, (2) sample selection (representativeness of the sample; sample size; response rate; ascertainment of exposure), (3) comparability (control of confounding factors; comparability of participants from different outcome groups), (4) outcome (assessment; statistical tests). Ascertainment of exposure (within criterion 2) was made with reference to the figural scale used (validated or not validated). The overall score for each study (range 0–16) is derived from the ratings of the single reported components. Based on Hillen et al. [27], studies that received 13 to 16 out of 16 possible points (scores > 75%) were considered of high quality, 9 to 12 points of moderate quality (scores > 50%), 8 and below of low quality (scores ≤ 50%). A low overall score is indicative of a higher risk of bias in the study. This assessment was independently carried out by two reviewers (N.R and E.G.-R.). Any disagreements between the two reviewers were discussed and resolved with the assistance of the third reviewer (L.Z.).
3. Results
3.1. Study Selection and Description
A total of 639 articles were identified through the search conducted on the databases. Following the article selection procedure (Figure 1), 28 studies were included in the systematic review. After removing 139 duplicates, 500 articles were screened against title and abstract for eligibility for inclusion criteria. Studies excluded after the title and abstract screening were 217. Therefore, 283 studies were assessed for full-text eligibility; however, one study could not be retrieved. Thus, 282 studies were the number of articles assessed for full-text eligibility. Of these, 257 were excluded for several reasons: BI assessed by questionnaire (n = 117); conference proceedings, book or book chapters, case studies, commentary, protocol (n = 6); not written in English language (n = 1); non-compliance with other inclusion/exclusion criteria (n = 114); not related to the topic (n = 19). Therefore, 26 articles met the inclusion criteria. Two additional articles were included in the review from citation searching, so the articles included in the review were 28.
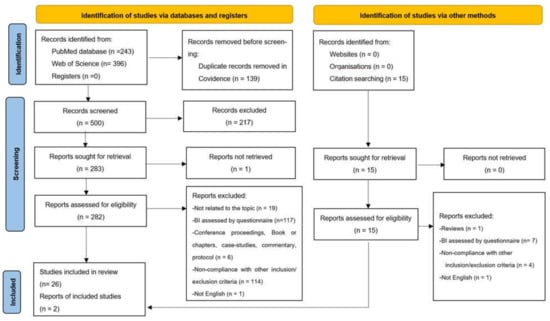
Figure 1.
Flow chart of the study selection process (PRISMA 2020 flow diagram).
3.2. Characteristics of Studies
Twenty-eight studies were included in this review (Table 2): 13 of which were carried out in Europe (7 in Spain, 4 in Italy, and 1 each in Finland and Portugal), 8 in Asia (2 in Malaysia, 2 in China, and 1 each in Thailand, Indonesia, Kuwait, and Israel), 3 in North America (all in the USA), 3 in South America (all in Brazil), and 1 in Africa (in Ghana).
Table 2.
Literature studies reported in chronological order on body image dissatisfaction, PA, anthropometric profile in adolescents.
The number of subjects surveyed in the studies ranged from a minimum of 36 subjects (a study on selected athletes—male soccer players) to a maximum of 10,496 Finnish adolescents. In particular, looking at the number of subjects examined, only 1 study (3.6%) had fewer than 100 subjects, 14 studies (50.0%) had fewer than 1000 subjects, 11 studies (39.3%) had fewer than 5000 subjects, and only two studies (7.1%) had more than 5000 subjects. Studies with the smallest sample sizes preferably involved only one sex and longitudinal or repeated measures design. Most samples included both genders, 5 studies (17.8%) included only females, and one (3.6%) only males. All the studies were conducted on samples of students except two studies on athletes, two studies on Chinese samples [46,69], that employed a secondary-analyses of data from the China Health and Nutrition Survey (CHNS), and the Indonesian household survey [59]. The majority of studies had a cross-sectional design, and only three studies had a longitudinal or repeated measures design [38,42,63].
For what concerns BMI and weight status, 12 studies (42.9%) reported the percentage of weight status categories (the majority determined from the cut-off proposed by Cole et al. [70,71] adjusted by age and sex, and two by the BMI percentiles (Underweight: <5th BMI-P; Normal weight: 5th to 85th; Overweight: 85th to 95th; Obese: ≥95th), while two others used Z-score of BMI for age (BMIZ) (thinness was defined as BMIZ less than −2 and overweight or obesity above 1), 7 (25%) reported mean values of BMI, and nine (32.1%) reported both mean values of BMI and the percentages of weight status categories.
The mean BMI of the participants included in the samples retrieved in the present review ranged from 16.9 kg/m2 of the youngest female sample of rhythmic gymnasts aged 10.7 years [53] to 22.5 kg/m2 of Spanish male sedentary students aged 12–17 years [50]. The female adolescents of Kuwait reported the highest percentage of OW/obesity (61.4%), of which 44.3% of obese. In addition, the USA samples reported a high percentage of overweight/obesity: 50.7% in the girls [45], of which 31.6% of obese, and 45% in the mixed sample in the longitudinal study of Schuster et al. (survey 1) [38]. The lowest percentage of OW/obese was reported in the Indonesian sample [59], with 14% of OW/obese for boys and 11% OW/obese for girls, but a high percentage of stunting and thinness (19% and 10% in males; 23% and 4% in females, respectively) was also reported. Africans [44] and Israelians [35] showed a low percentage of OW/obese (19.5% in the former, 20.4% (for males), and 16.9% (for females) in the latter).
PA was assessed with different instruments: the majority with indirect methods such as questionnaires, validated (IPAQ, PAQ, 24 h Physical Activity Recall, Baecke questionnaire) or not validated (a single question on h/week of sports training or questions on PA) to divide the samples in active and sedentary or in categories according to PA levels (low, moderate or high PA). Only three studies have directly assessed PA: one by the pedometer, the other by the pedometer plus the 24 h PA recall, and the last one by the accelerometer to determine the sedentary time, light PA, moderate PA, and vigorous PA (min/h) plus a self-reported questionnaire. In epidemiological studies, self-reporting is usually the most feasible method of assessing PA, especially when a high number of participants are interviewed due to the relative inexpensiveness, the minimal inconvenience to the participant, and the relative ease of administration.
According to the inclusion criteria, we chose only studies performed using the body silhouette scales for the assessment of BI and BID. Eleven studies assessed BI using the Stunkard Rating Scale with nine silhouettes, six studies used the seven silhouettes developed by Collins for preadolescents, three studies used the Contour Drawing Rating Scale proposed by Thompson and Gray, three studies on Brazilian samples used the silhouettes developed by Kakeshita et al. [48], one study each the BIDA questionnaire, the Body Silhouette Chart developed by Sanchez-Villegas et al., and the 13 silhouettes developed by Gardner et al. adapted for Spanish by Rodriguez et al. [52]. Zach et al. [35] used five silhouettes (not reported) drawn by an artist, and Min et al. [46] used nine new silhouettes reported in the paper. From the current (also called actual or feel) and ideal figures, the researchers calculated some indices of dissatisfaction, which, under different names, generally assessed the discrepancy between feel and ideal BI, thus coming to define the percentage of satisfied/dissatisfied (without discrepancy between current and ideal figures or with the discrepancy, respectively) subjects or mean value of dissatisfaction (negative values mean a desire of a bigger body and positive values mean a desire of a thinner body).
3.3. Association between Weight Status, PA, and Body Dissatisfaction
Several studies underlined the association between BI and BMI, especially in overweight and obesity categories [38,41,43,46,57,59,60,63,65,67]. In almost all the studies that reported this association, overweight and obese adolescents had higher body dissatisfaction and less body perception consistency, evaluating themselves as slimmer than they were. In contrast, Zach et al. [35] reported that a large percentage of overweight and obese adolescents were satisfied with their body shape and size, regardless of sex. Moreover, Michels et al. [44] did not find any significant association between the level of body dissatisfaction and BMI.
Ten studies [31,33,36,38,46,63,65,66,67,69], despite evaluating both body dissatisfaction and PA or sports levels, did not assess the association between these variables.
Six studies that analyzed the association between PA and BID found no significant association or correlation between these two variables [28,35,43,44,54,55], and nine studies reported a negative association between PA and BID or body perception [39,41,42,45,53,57,58,62,68], whereas one study reported an increase in body dissatisfaction with an increase in PA level [47].
3.4. Quality of Studies
Half of the examined studies showed a high level of quality with an overall score ≥ 13 (Table 2), and the remaining 14 were found to be studies of moderate quality (8 < score < 13). No study received an overall score of <9 (Table 2, Table S2).
In more detail, 15 studies (53.6%) provided an adequate description of the random sampling process, 16 studies (57%) provided an adequate description of the study sample, 25 studies (89.3%) used a validated measurement of BI, and 21 studies (75%) controlled for potential confounders.
4. Discussion
The principal aim of this systematic review was to investigate the association between body image dissatisfaction (BI and BID) and PA practice in adolescents, taking BMI or weight status into account. The hurdles we addressed primarily involved the assessment of dissatisfaction with BI, which was reported as an index of the discrepancy between the actual and ideal figure in some studies, while others reported the percentage of satisfaction or dissatisfaction. The type of BI rating scale used differed in the studies reviewed, although the use of Stunkard’s scale [29] prevailed. Second, we found a variety of methods for assessing PA in the studies reviewed. Because of the different measures of BI and BID, and PA, a narrative review of the 28 included studies was conducted.
Despite the difficulties faced, this review provides an important update of the literature related to PA and BID in adolescents over the past decade, highlighting a slightly higher interest in the female sex (5 out of 28 studies; while 1 out of 28 studies involved only the male sex and 4 were mixed-sex studies). Although the limited number of reviewed studies on adolescents and the different survey methodologies applied to preclude a decisive view of the relationship between BI/BID and PA, the main findings of this systematic review indicate mostly (56.3% of studies) a negative association (moderate-medium) between PA and BID in adolescents, coming to highlight a better body perception in the physically active adolescents [50] and an association between BI disorders and reduced moderate-to-vigorous physical activity (MVPA) [58]. However, due to differences among samples in PA practiced (amount and type of activity), weight status, and sex of participants, this relationship is complex, and the results contradictory, so much so that 37.5% of reviewed studies detected no association between these variables and 6.3% showed a positive association. In contrast, generally, higher body satisfaction results in active adolescents or those with high PA levels, and lower body dissatisfaction in sedentary or physically inactive girls was also reported [47]. In the field of sports, Fernandez-Bustos et al. [50] found greater dissatisfaction in girls who practiced aesthetic/light PA or were inactive than in those who practiced other types of PA, confirming the importance of the type of PA practiced. Furthermore, Zaccagni et al. [53], analyzing a sample of rhythmic gymnasts, pointed to a possible source of misunderstanding in the ideal BI, showing that the ideal figure in sport does not coincide with the ideal figure in everyday life—the dissatisfaction between perceived and sport ideal figure was greater than the dissatisfaction between perceived and general ideal figure.
Diverse physical, cultural, social, and psychological changes that characterize early and medium adolescence interact with BI and BID between ages 10 and 18. Restricting to physical changes during this period, sex-specific differences occur that result in an increase in body fat mass and a decrease in lean mass in the female sex compared to the male, with consequent changes in body shape and size. The eventual practice of PA and sports may also interact, leading to eventual improvements in the perception of BI [15]. However, a decline in PA practice during the period of adolescence is well known [72,73], leading especially girls to be less active than boys and not following the WHO recommendations of at least 60 min of MVPA per day [74], as confirmed by this review with a percentage of inactivity reaching almost three times as high in females as in males in Spain [50] and exceeding 80% inactivity in Brazilian girls [47] with less than 10% of girls participating in the recommended 60 min/day of MVPA for seven days in the USA [45]. Inactivity in China was high (about 60%) but similar in the two sexes [69], while in Indonesia, girls met the daily PA recommendations slightly less than boys [59]. The only exception is the high MVPA averages (over 5 h per day, value not disaggregated by sex) reported for Ghanaian adolescents [44].
Because body weight dissatisfaction is reported as a factor associated with lack of PA, physical inactivity can result, as a consequence, of the interaction between weight status and BI, according to Duarte et al. [73]. An alternative hypothesis is that, instead of discouraging, BI may motivate PA and sports participation [15]. In general, adolescent girls of all ethnic groups showed greater body dissatisfaction than boys. However, in addition to Malaysia, dissatisfaction appears lower in adolescents from African countries and African Americans than in adolescents from Western countries, in agreement with the literature [75]. In Ghanaian adolescents, in particular, the greatest body dissatisfaction involved a body that was too thin [44], unlike the other studies reviewed. This result is consistent with the known tendency of non-White populations (particularly Africans and African Americans) toward a more favorable BI than Whites and a preference for a heavier body [25,76] according to a different beauty ideal. Despite the greater dissatisfaction that generally characterizes Western countries, Finnish adolescents show a high percentage of satisfaction with their BI (about 60%), with small differences between genders [68]. This pattern may at least partly be explained by a possible larger presence of preadolescents in the sample characterized by a lower age range (9–12 years) than in most of the studies considered. Indeed, it is believed that the physical, cultural, and diminished self-esteem changes that occur during adolescence can contribute to an increased awareness of BI, resulting in greater concerns about weight (particularly in females) and musculature (in males) [77,78].
Other previous analyses conducted on adults had shown small/medium associations between PA and BI [17,25], pointing to a stronger PA impact of PA on BID among young people, according to Bassett-Gunter et al. [17]. In particular, the number of hours spent in sports activities was found to be a predictor of body dissatisfaction with a decrease in BID as the number of hours spent in sports activities increases [19]. In this review, a positive effect of sports training on BID was found in a study [42] carried out by a repeated measure design: a decrease in BID and changes in anthropometric measurements were evident after 12 weeks of soccer training.
An important aspect of the relationship between PA and BI/BID may be the intensity of PA. Although it is plausible that this factor, as well as multiple others, is involved in the association, it is not possible to explore it in depth because of the limited data provided by the studies reviewed and the heterogeneity in the methods used to assess PA (from different types of questionnaires to accelerometers). Taking into account the accuracy and reliability of accelerometry [79], we emphasize the need for adequate studies designed to allow an understanding of the actual role of PA on BI/BID. According to Gualdi-Russo et al. [80], a decrease in body adiposity occurs in children and adolescents as MVPA increases and sedentary time decreases. If PA affects adiposity and, in particular, weight status, this could reverberate on BI/BID.
Several anthropometric parameters (BMI, waist circumference, waist-to-hip ratio, waist-to-height ratio) are possible indicators of overall and central obesity and predictors of weight status [81,82]. However, the vast majority of examined studies have only considered BMI, classifying adolescents into weight categories. According to NCD-RisC [83], BMI can be regarded as “an imperfect measure of the extent and distribution of fat in the body, but it has the major advantage of having consistent and comparable data in many population-based surveys”. The relationship between weight status and BI/BID is complicated and could significantly affect the health behaviors of adolescents. Specifically, negative health consequences that may result from the interaction between weight status and BI include eating disorders, physical inactivity, and dysfunctional exercise [6]. Adolescent girls, in particular, will be at higher risk of developing clinical eating disorders because of intense BID and peer pressure to look thinner. At the same time, although PA is usually encouraged as a behavior that promotes health [79,84], compulsive exercise is a commonly used purging strategy to balance caloric intake or modify weight, body size, or shape [85]. This is probably the source of some apparent inconsistencies in the examined literature indicating greater PA practice in overweight/obese adolescents or those who perceived themselves as fat [35], although some examined studies show little awareness of the importance of PA among overweight/obese adolescents [46,59]. Lastly, further inconsistencies in the analysis of relationships between BID and BMI may arise from the study of sex-mixed samples (n = 4) due to the different characteristic patterns of the two genders (linear relationship in females, curvilinear relationship in males).
Strengths, Limitations, and Directions for the Future
This systematic review provided an overview of the literature of the last 10 years and identified eventual gaps in the literature to improve future studies. Among the strengths of this review is the systematic search of articles from the literature by evaluating a wide variety of evidence. A specific strength relates to including only studies that have assessed BID through figure scales. A limitation of this review is that we screened only two major databases, and we purposely decided to exclude gray literature. Moreover, other limitations reflect the limitations of the studies analyzed. First, we chose to consider only studies that used figural stimuli, but there is evident heterogeneity in the figural scales used, as well as in the methods employed to assess PA. With particular reference to BI, some studies have relied on unclearly defined or non-validated body image rating scales or inappropriate BI rating scales (e.g., scales developed for preadolescents or adults but applied to adolescents) with results of weak or unknown value. The use of small convenience samples in several studies is an additional limiting factor in assessing an association between BID and PA. Concerning PA, the limited information on this variable did not allow us to detect any abnormal compulsive exercise behavior. Accurate measurements of the PA level would be needed to assess the real impact on BI. In future studies, we suggest further investigation of the quality and quantity of exercise performed to discriminate behaviors attributable to dysfunctional exercise. The same assessment of overall and central obesity, limited in this review to BMI because it was found to be the most widely used, was obtained from directly measured anthropometric measurements in some studies and in other studies from self-reported height and weight values resulting in a possibly incorrect estimate. Secondly, the studies reviewed were generally cross-sectional, the limit of which is often ascribed to the impossibility of establishing causal relations. However, Wunsch et al. [86] think that this possibility is rather related to “whether or not our modeling strategy is structural”. Therefore, more robust study designs and/or modeling strategies should be employed in the future to facilitate the understanding of causal relations between PA and BI/BID. Given the significant differences between genders in BID (dissatisfaction more pronounced with a clear preference toward slimmer figures in girls) and PA (lower amount in girls that are also less interested in vigorous PA), it is recommended that statistical analyses be conducted separately by reporting data by sex. Moreover, there is a need for future research to improve and standardize the methodologies used, especially in PA and BI assessments.
Finally, the exclusion of non-English articles certainly resulted in a loss of information, but we felt this choice was in line with current international systematic syntheses.
5. Conclusions
Up-to-date local data on adolescents’ BI perception and PA practice are indispensable for planning health strategies and supporting non-communicable disease management. Monitoring changes in ideal BI during adolescence should be a primary health objective to guarantee the psychological and physical well-being of adolescents: health interventions should include strategies to promote health-related benefits and positive BI through PA among adolescents. The results highlighted in this review show a ubiquitous prevalence of unsatisfactory BI, although more pronounced in Western countries, with a concurrent trend toward inactivity and overweight in adolescents. This picture implies a high risk of the spread of nutritional disorders. Considering social and behavioral differences among subgroups based on sex, BMI, and PA, a unique approach may be inadequate: specific recommendations tailored to the needs of adolescents should be provided by researchers and health professionals.
Supplementary Materials
The following supporting information can be downloaded at: https://www.mdpi.com/article/10.3390/ijerph192013190/s1; Table S1: Prisma 2020 Checklist; Table S2: NOS scores for all included studies in alphabetical order (range: 0–16 stars, with higher scores indicating better quality research). The range of each item was reported.
Author Contributions
Conceptualization, E.G.-R. and L.Z.; methodology, E.G.-R. and N.R.; software, N.R.; formal analysis, L.Z. and N.R.; investigation, E.G.-R., N.R. and L.Z.; data curation, N.R. and L.Z.; writing—original draft preparation, E.G.-R. and L.Z.; writing—review and editing, E.G.-R., N.R. and L.Z.; supervision, E.G.-R.; project administration, E.G.-R. All authors have read and agreed to the published version of the manuscript.
Funding
This research received no external funding.
Institutional Review Board Statement
Not applicable.
Informed Consent Statement
Not applicable.
Data Availability Statement
Not applicable.
Conflicts of Interest
The authors declare no conflict of interest.
References
- Nicolucci, A.; Maffeis, C. The adolescent with obesity: What perspectives for treatment? Ital. J. Pediatr. 2022, 48, 9. [Google Scholar] [CrossRef] [PubMed]
- NCD Risk Factor Collaboration (NCD-RisC). Worldwide trends in body-mass index, underweight, overweight, and obesity from 1975 to 2016: A pooled analysis of 2416 population-based measurement studies in 128·9 million children, adolescents, and adults. Lancet 2017, 390, 2627–2642. [Google Scholar] [CrossRef]
- NCD Risk Factor Collaboration (NCD-RisC). Heterogeneous contributions of change in population distribution of body mass index to change in obesity and underweight. Elife 2021, 10, e60060. [Google Scholar] [CrossRef] [PubMed]
- Childhood Obesity Surveillance Initiative HIGHLIGHTS 2015-17. Available online: https://www.euro.who.int/__data/assets/pdf_file/0006/372426/WH14_COSI_factsheets_v2.pdf (accessed on 30 August 2022).
- Lange, S.J.; Kompaniyets, L.; Freedman, D.S.; Kraus, E.M.; Porter, R.; Blanck, H.M.; Goodman, A.B. Longitudinal Trends in Body Mass Index Before and During the COVID-19 Pandemic Among Persons Aged 2–19 Years—United States, 2018–2020. Morb. Mortal. Wkly. Rep. 2021, 70, 1278–1283. [Google Scholar] [CrossRef] [PubMed]
- Voelker, D.K.; Reel, J.J.; Greenleaf, C. Weight status and body image perceptions in adolescents: Current perspectives. Adolesc. Health Med. Ther. 2015, 6, 49–58. [Google Scholar]
- Uchôa, F.N.M.; Uchôa, N.M.; Daniele, T.M.D.C.; Lustosa, R.P.; Garrido, N.D.; Deana, N.F.; Aranha, Á.C.M.; Alves, N. Influence of the Mass Media and Body Dissatisfaction on the Risk in Adolescents of Developing Eating Disorders. Int. J. Environ. Res. Public Health 2019, 16, 1508. [Google Scholar] [CrossRef] [PubMed]
- Gualdi-Russo, E.; Rinaldo, N. Antropometria e percezione dell’immagine corporea. In Manuale di Antropologia; Sineo, L., Moggi Cecchi, J., Eds.; UTET: Torino, Italy, 2022; pp. 491–496. [Google Scholar]
- Vuong, A.T.; Jarman, H.K.; Doley, J.R.; McLean, S.A. Social Media Use and Body Dissatisfaction in Adolescents: The Moderating Role of Thin- and Muscular-Ideal Internalisation. Int. J. Environ. Res. Public Health 2021, 18, 13222. [Google Scholar] [CrossRef] [PubMed]
- Thompson, J.K.; Heinberg, L.J.; Altabe, M.; Tantleff-Dunn, S. Exacting Beauty. Theory, Assessment, and Treatment of Body Image Disturbance; American Psychological Association: Washington, DC, USA, 1999. [Google Scholar]
- Mitchell, S.H.; Petrie, T.A.; Greenleaf, C.A.; Martin, S.B. Moderators of the internalization—Body dissatisfaction relationship in middle school girls. Body Image 2012, 9, 431–440. [Google Scholar] [CrossRef] [PubMed]
- Sirard, J.R.; Pate, R.R. Physical activity assessment in children and adolescents. Sport. Med. 2001, 31, 439–454. [Google Scholar] [CrossRef]
- Stankov, I.; Olds, T.; Cargo, M. Overweight and obese adolescents: What turns them off physical activity? Int. J. Behav. Nutr. Phys. 2012, 9, 53. [Google Scholar] [CrossRef]
- Whitt-Glover, M.C.; Taylor, W.C.; Floyd, M.F.; Yore, M.M.; Yancey, A.K.; Matthews, C.E. Disparities in physical activity and sedentary behaviors among US children and adolescents: Prevalence, correlates, and intervention implications. J. Public Health Policy 2009, 30, S309–S334. [Google Scholar] [CrossRef] [PubMed]
- Sabiston, C.M.; Pila, E.; Vani, M.; Thogersen-Ntoumani, C. Body image, physical activity, and sport: A scoping review. Psychol. Sport Exerc. 2019, 42, 48–57. [Google Scholar] [CrossRef]
- Spencer, R.A.; Rehman, L.; Kirk, S.F.L. Understanding gender norms, nutrition, and physical activity in adolescent girls: A scoping review. Int. J. Behav. Nutr. Phys. Act. 2015, 12, 6. [Google Scholar] [CrossRef] [PubMed]
- Bassett-Gunter, R.; McEwan, D.; Kamarhie, A. Physical activity and body image among men and boys: A meta-analysis. Body Image 2017, 22, 114–128. [Google Scholar] [CrossRef] [PubMed]
- Ojala, K.; Huotari, P.; Villberg, J.; Tynjälä, J. The Associations between Physical Activity and Body-Esteem in 15-Year-Old Adolescents: A Cross-Sectional Study from Finland. Phys. Act. Health 2021, 5, 154–165. [Google Scholar] [CrossRef]
- Gualdi-Russo, E.; Rinaldo, N.; Masotti, S.; Bramanti, B.; Zaccagni, L. Sex Differences in Body Image Perception and Ideals: Analysis of Possible Determinants. Int. J. Environ. Res. Public Health 2022, 19, 2745. [Google Scholar] [CrossRef]
- Kostanski, M.; Fisher, A.; Gullone, E. Current conceptualisation of body image dissatisfaction: Have we got it wrong? J. Child Psychol. Psychiatry 2004, 45, 1317–1325. [Google Scholar] [CrossRef]
- Frederick, D.A.; Peplau, L.A.; Lever, J. The swimsuit issue: Correlates of body image in a sample of 52,677 heterosexual adults. Body Image 2006, 3, 413–419. [Google Scholar] [CrossRef]
- Hausenblas, H.A.; Downs, D.S. Comparison of body image between athletes and nonathletes: A meta-analytic review. J. Appl. Sport Psychol. 2001, 13, 323–339. [Google Scholar] [CrossRef]
- Jayawardena, R.; Sooriyaarachchi, P.; Kagawa, M.; Hills, A.P.; King, N.A. Methods to develop figure rating scales (FRS): A systematic review. Diabetes Metab. Syndr. 2021, 15, 687–693. [Google Scholar] [CrossRef]
- Martin Ginis, K.A.; Bassett-Gunter, R.L.; Conlin, C. Body Image and Exercise. In The Oxford Handbook of Exercise Psychology; Acevedo, E.O., Ed.; Oxford Library of Psychology: Oxford, UK, 2012; pp. 55–75. [Google Scholar] [CrossRef]
- Campbell, A.; Hausenblas, H.A. Effects of exercise interventions on body image: A meta-analysis. J. Health Psychol. 2009, 14, 780–793. [Google Scholar] [CrossRef] [PubMed]
- Page, M.J.; McKenzie, J.E.; Bossuyt, P.M.; Boutron, I.; Hoffmann, T.C.; Mulrow, C.D.; Shamseer, L.; Tetzlaff, J.M.; Moher, D. Updating guidance for reporting systematic reviews: Development of the PRISMA 2020 statement. J. Clin. Epidemiol. 2021, 134, 103–112. [Google Scholar] [CrossRef]
- Hillen, M.A.; Medendorp, N.M.; Daams, J.G.; Smets, E.M.A. Patient-driven second opinions in oncology: A systematic review. Oncologist 2017, 22, 1197–1211. [Google Scholar] [CrossRef] [PubMed]
- Chen, X.; Wang, Y. Is ideal body image related to obesity and lifestyle behaviours in African American adolescents? Child Care Health Dev. 2012, 38, 219–228. [Google Scholar] [CrossRef] [PubMed]
- Stunkard, A.J.; Sorensen, T.; Schulsinger, F. Use of the Danish Adoption Register for the study of obesity and thinness. Res. Publ. Assoc. Res. Nerv. Ment. Dis. 1983, 60, 115–120. [Google Scholar] [PubMed]
- Stevens, J.; Cornell, C.E.; Story, M.; French, S.A.; Levin, S.; Becenti, A.; Gittelsohn, J.; Going, S.B.; Reid, R. Development of a questionnaire to assess knowledge, attitudes, and behaviors in American Indian children. Am. J. Clin. Nutr. 1999, 69, 773S–781S. [Google Scholar] [CrossRef]
- Bibiloni, M.M.; Pich, J.; Córdova, A.; Pons, A.; Tur, J.A. Association between sedentary behaviour and socioeconomic factors, diet and lifestyle among the Balearic Islands adolescents. BMC Public Health 2012, 12, 718. [Google Scholar] [CrossRef]
- Stunkard, A.; Stellar, E. Eating and its disorders. In Body Images; Cash, T., Pruzinsky, T., Eds.; Guilford Press: New York, NY, USA, 1990; pp. 3–20. [Google Scholar]
- Petracci, E.; Cavrina, G. The effect of weight status, lifestyle, and body image perception on health-related quality of life in children: A quantile approach. Qual. Life Res. 2013, 22, 2607–2615. [Google Scholar] [CrossRef]
- Collins, M.E. Body figure perceptions and preferences among preadolescent children. Int. J. Eat. Disord. 1991, 10, 199–208. [Google Scholar] [CrossRef]
- Zach, S.; Zeev, A.; Dunsky, A.; Goldbourt, U.; Shimony, T.; Goldsmith, R.; Netz, Y. Perceived body size versus healthy body size and physical activity among adolescents—Results of a national survey. Eur. J. Sport Sci. 2013, 13, 723–731. [Google Scholar] [CrossRef]
- Cheah, W.L.; Helmy, H.; Chang, C.T. Factors associated with physical inactivity among female and male rural adolescents in Borneo—A cross-sectional study. Int. J. Adolesc. Med. Health 2014, 26, 47–53. [Google Scholar] [CrossRef] [PubMed][Green Version]
- Thompson, M.A.; Gray, J.J. Development and validation of a new body image assessment scale. J. Pers. Assess. 1995, 64, 258–269. [Google Scholar] [CrossRef] [PubMed]
- Schuster, M.A.; Elliott, M.N.; Bogart, L.M.; Klein, D.J.; Feng, J.Y.; Wallander, J.L.; Cuccaro, P.; Tortolero, S.R. Changes in obesity between fifth and tenth grades: A longitudinal study in three metropolitan areas. Pediatrics 2014, 134, 1051–1058. [Google Scholar] [CrossRef] [PubMed]
- Chongwatpol, P.; Gates, G.E. Differences in body dissatisfaction, weight-management practices and food choices of high-school students in the Bangkok metropolitan region by gender and school type. Public Health Nutr. 2016, 19, 1222–1232. [Google Scholar] [CrossRef] [PubMed][Green Version]
- Janz, K.F.; Lutuchy, E.M.; Wenthe, P.; Levy, S.M. Measuring activity in children and adolescents using self-report: PAQ-C and PAQ-A. Med. Sci. Sport. Exerc. 2008, 40, 767–772. [Google Scholar] [CrossRef]
- Coelho, E.M.; Fonseca, S.C.; Pinto, G.S.; Mourão-Carvalhal, M.I. Factors associated with body image dissatisfaction in Portuguese adolescents: Obesity, sports activity and TV watching. Motricidade 2016, 12, 18–26. [Google Scholar] [CrossRef]
- Rinaldo, N.; Zaccagni, L.; Gualdi-Russo, E. Soccer training programme improved the body composition of pre-adolescent boys and increased their satisfaction with their body image. Acta Paediatr. 2016, 105, e492–e495. [Google Scholar] [CrossRef] [PubMed]
- Shaban, L.H.; Vaccaro, J.A.; Sukhram, S.D.; Huffman, F.G. Perceived Body Image, Eating Behavior, and Sedentary Activities and Body Mass Index Categories in Kuwaiti Female Adolescents. Int. J. Pediatr. 2016, 2016, 1092819. [Google Scholar] [CrossRef]
- Michels, N.; Amenyah, S.D. Body size ideals and dissatisfaction in Ghanaian adolescents: Role of media, lifestyle and well-being. Public Health 2017, 146, 65–74. [Google Scholar] [CrossRef]
- Robbins, L.B.; Ling, J.; Resnicow, K. Demographic differences in and correlates of perceived body image discrepancy among urban adolescent girls: A cross-sectional study. BMC Pediatr. 2017, 17, 201. [Google Scholar] [CrossRef] [PubMed]
- Min, J.; Yan, A.F.; Wang, V.H.C.; Wang, Y. Obesity, body image, and its impact on children’s eating and exercise behaviors in China: A nationwide longitudinal study. Prev. Med. 2018, 106, 101–106. [Google Scholar] [CrossRef] [PubMed]
- Miranda, V.P.N.; Morais, N.S.; Faria, E.R.; Amorim, P.R.D.S.; Marins, J.C.B.; Franceschini, S.D.C.C.; Teixeira, P.C.; Priore, S.E. Body dissatisfaction, physical activity, and sedentary behavior in female adolescents. Rev. Paul. Pediatr. 2018, 36, 482–490. [Google Scholar] [CrossRef] [PubMed]
- Kakeshita, I.S.; Silva, A.I.; Zanatta, D.P.; Almeida, S.S. A figure rating scales for Brazilian adults and children: Development and test-retest reliability. Psic. Teor. Pesq. 2009, 25, 263–270. [Google Scholar] [CrossRef]
- Laus, M.F.; Almeida, S.S.; Murarole, M.B.; Braga-Costa, T.M. Validation and reliability study of the figure rating scales applied to Brazilian adolescents. Psic. Teor. Pesq. 2013, 29, 403–409. [Google Scholar] [CrossRef]
- Fernández-Bustos, J.G.; Infantes-Paniagua, Á.; Gonzalez-Martí, I.; Contreras-Jordán, O.R. Body Dissatisfaction in Adolescents: Differences by Sex, BMI and Type and Organisation of Physical Activity. Int. J. Environ. Res. Public Health 2019, 27, 3109. [Google Scholar] [CrossRef] [PubMed]
- Gardner, R.M.; Stark, K.; Jackson, N.A.; Friedman, B.N. Development and Validation of Two New Scales for Assessment of Body-Image. Percept. Mot. Skills 1999, 89, 981–993. [Google Scholar] [CrossRef] [PubMed]
- Rodríguez, M.A.; Beato, L.; Rodríguez, T.; Martínez-Sánchez, F. Adaptación española de la escala de evaluación de la imagen corporal de Gardner en pacientes con trastornos de la conducta alimentaria [Spanish adaptation of the Gardner’s scale of body image assessment in patients with eating disorders]. Actas Españolas Psiquiatr. 2003, 31, 59–64. [Google Scholar]
- Zaccagni, L.; Rinaldo, N.; Gualdi-Russo, E. Anthropometric Indicators of Body Image Dissatisfaction and Perception Inconsistency in Young Rhythmic Gymnastics. Asian J. Sport. Med. 2019, 10, e87871. [Google Scholar] [CrossRef]
- Boraita, R.J.; Ibort, E.G.; Torres, J.M.D.; Alsina, D.A. Gender differences relating to lifestyle habits and health-related quality of life of adolescents. Child Indic. Res. 2020, 13, 1937–1951. [Google Scholar] [CrossRef]
- Boraita, R.J.; Ibort, E.G.; Torres, J.M.D.; Alsina, D.A. Factors associated with a low level of physical activity in adolescents from La Rioja (Spain). An. Pediatr. (Engl. Ed.) 2022, 96, 326–333. [Google Scholar] [CrossRef]
- Marrodan, V.; Montero, M.S.; Mesa, J.L.; Pacheco, M.; Gonzalez, I.; Bejarano, I.; Lomaglio, D.B.; Verón, J.A.; Carmenate, M. Realidad, percepción y atractivo de la imagen corporal: Condicionantes biológicos y socioculturales. Zainak Cuad. Antropol.-Etnogr. 2008, 30, 15–28. [Google Scholar]
- Tebar, W.R.; Gil, F.C.S.; Scarabottolo, C.C.; Codogno, J.S.; Fernandes, R.A.; Christofaro, D.G.D. Body size dissatisfaction associated with dietary pattern, overweight, and physical activity in adolescents: A cross-sectional study. Nurs. Health Sci. 2020, 22, 749–757. [Google Scholar] [CrossRef] [PubMed]
- Miranda, V.P.; Amorim, P.R.S.; Bastos, R.R.; Souza, V.G.; Faria, E.R.; Franceschini, S.C.; Teixeira, P.C.; de Morais, N.S.; Priore, S.E. Body image disorders associated with lifestyle and body composition of female adolescents. Public Health Nutr. 2021, 24, 95–105. [Google Scholar] [CrossRef] [PubMed]
- Niswah, I.; Rah, J.H.; Roshita, A. The Association of Body Image Perception with Dietary and Physical Activity Behaviors Among Adolescents in Indonesia. Food Nutr. Bull. 2021, 42, S109–S121. [Google Scholar] [CrossRef]
- Sánchez-Miguel, P.A.; Sevil-Serrano, J.; Sánchez-Oliva, D.; Vaquero-Solís, M.; Tapia-Serrano, M.A. Does gender moderate the relationship between physical activity and body dissatisfaction among adolescents? J. Gend. Stud. 2021, 30, 676–686. [Google Scholar] [CrossRef]
- Martínez-Gómez, D.; Martínez-de-haro, V.; Pozo, T.; Welk, G.J.; Villagra, A.; Calle, M.E.; Marcos, A.; Veiga, O.L. Fiabilidad y validez del cuestionario de actividad física PAQ-A en adolescentes españoles. Rev. Española Salud Públ. 2009, 83, 427–439. [Google Scholar] [CrossRef] [PubMed]
- Sánchez-Miguel, P.A.; Vaquero-Solís, M.; Sánchez-Oliva, D.; Pulido-González, J.J.; Segura-García, C.; Tapia-Serrano, M.A. Validation of the body image dimensional assessment in adolescents from Spanish high school. Eat. Weight Disord. 2021, 26, 1749–1756. [Google Scholar] [CrossRef] [PubMed]
- Toselli, S.; Grigoletto, A.; Zaccagni, L.; Rinaldo, N.; Badicu, G.; Grosz, W.R.; Campa, F. Body image perception and body composition in early adolescents: A longitudinal study of an Italian cohort. BMC Public Health 2021, 21, 1381. [Google Scholar] [CrossRef]
- Sânchez-Villegas, A.; Madrigal, H.; Martinez-Gonzâlez, M.A.; Kearney, J.; Gibney, M.J.; de Irala, J.; Martinez, J.A. Perception of body image as indicator of weight status in the European Union. J. Hum. Nutr. Dietet. 2001, 14, 93–102. [Google Scholar] [CrossRef]
- Vaquero-Solis, M.; Moreno-Diaz, M.I.; Tapia-Serrano, M.A.; Sanchez-Miguel, P.A. Self-concept profiles: Differences in body satisfaction, body mass index and physical activity in school children. Publicaciones 2021, 51, 77–88. [Google Scholar]
- Sánchez-Miguel, P.A.; Leo, F.M.; Amado Alonso, D.; Hortigüela-Alcalá, D.; Tapia-Serrano, M.A.; De La Cruz-Sánchez, E. Children’s Physical Self-Concept and Body Image According to Weight Status and Physical Fitness. Sustainability 2020, 12, 782. [Google Scholar] [CrossRef]
- Lai, W.K.; Mohd Sidik, S.; Lekhraj, R.; Gan, W.Y.; Ismail, S.I.F. Prevalence and Predictors of Overweight and Obesity Among Adolescents in Seremban, Negeri Sembilan, Malaysia. Cureus 2022, 14, e21795. [Google Scholar] [CrossRef] [PubMed]
- Leppänen, M.H.; Lehtimäki, A.V.; Roos, E.; Viljakainen, H. Body Mass Index, Physical Activity, and Body Image in Adolescents. Children 2022, 9, 202. [Google Scholar] [CrossRef] [PubMed]
- Song, L.; Zhang, Y.; Chen, T.; Maitusong, P.; Lian, X. Association of body perception and dietary weight management behaviours among children and adolescents aged 6–17 years in China: Cross-sectional study using CHNS (2015). BMC Public Health 2022, 22, 175. [Google Scholar] [CrossRef] [PubMed]
- Cole, T.J.; Bellizzi, M.C.; Flegal, K.M.; Dietz, W.H. Establishing a standard definition for child overweight and obesity worldwide: International survey. BMJ 2000, 320, 1240–1243. [Google Scholar] [CrossRef]
- Cole, T.J.; Flegal, K.M.; Nicholls, D.; Jackson, A.A. Body mass index cut offs to define thinness in children and adolescents: International survey. BMJ 2007, 335, 194. [Google Scholar] [CrossRef]
- Dumith, S.C.; Gigante, D.P.; Domingues, M.R.; Kohl, H.W. Physical activity change during adolescence: A systematic review and a pooled analysis. Int. J. Epidemiol. 2011, 40, 685–698. [Google Scholar] [CrossRef]
- Duarte, L.S.; Palombo, C.N.T.; Solis-Cordero, K.; Kurihayashi, A.Y.; Steen, M.; Borges, A.L.V.; Fujimori, E. The association between body weight dissatisfaction with unhealthy eating behaviors and lack of physical activity in adolescents: A systematic review. J. Child Health Care 2021, 25, 44–68. [Google Scholar] [CrossRef]
- Physical Activity (World Health Organization). Available online: https://www.who.int/en/news-room/fact-sheets/detail/physical-activity (accessed on 30 August 2022).
- Gualdi-Russo, E. Body image perception in ethnic minorities: Implications for prevention. In Ethnic Diversities, Hypertension and Global Cardiovascular Risk; Modesti, P.A., Cappuccio, F.P., Parati, G., Eds.; Springer: Cham, Switzerland, 2018; pp. 201–206. [Google Scholar]
- Toselli, S.; Rinaldo, N.; Gualdi-Russo, E. Body image perception of African immigrants in Europe. Glob Health 2016, 12, 48. [Google Scholar] [CrossRef]
- Smolak, L. Body image in children and adolescents: Where do we go from here? Body Image 2004, 1, 15–28. [Google Scholar] [CrossRef]
- Ata, R.N.; Ludden, A.B.; Lally, M.M. The Effects of Gender and Family, Friend, and Media Influences on Eating Behaviors and Body Image During Adolescence. J. Youth Adolesc. 2007, 36, 1024–1037. [Google Scholar] [CrossRef]
- Gualdi-Russo, E.; Zaccagni, L. Physical Activity for Health and Wellness. Int. J. Environ. Res. Public Health 2021, 18, 7823. [Google Scholar] [CrossRef] [PubMed]
- Gualdi-Russo, E.; Rinaldo, N.; Toselli, S.; Zaccagni, L. Associations of Physical Activity and Sedentary Behaviour Assessed by Accelerometer with Body Composition among Children and Adolescents: A Scoping Review. Sustainability 2021, 13, 335. [Google Scholar] [CrossRef]
- Lo, W.S.; Ho, S.Y.; Mak, K.K.; Lam, T.H. The use of Stunkard’s figure rating scale to identify underweight and overweight in Chinese adolescents. PLoS ONE 2012, 7, e50017. [Google Scholar] [CrossRef] [PubMed]
- Rinaldo, N.; Toselli, S.; Gualdi-Russo, E.; Khyatti, M.; Gihbid, A.; Zaccagni, L. Anthropometric Assessment of General and Central Obesity in Urban Moroccan Women. Int. J. Environ. Res. Public Health 2022, 19, 6819. [Google Scholar] [CrossRef]
- NCD Risk Factor Collaboration (NCD-RisC). Height and body-mass index trajectories of school-aged children and adolescents from 1985 to 2019 in 200 countries and territories: A pooled analysis of 2181 population-based studies with 65 million participants. Lancet 2020, 396, 1511–1524. [Google Scholar] [CrossRef]
- De Santi, M.; Contisciani, D.; Baldelli, G.; Brandi, G.; Schiavano, G.F.; Amagliani, G. Physical activity as a tool for health promotion: The evolution of international strategies and interventions. Ann. Ist. Super Sanita 2020, 56, 419–429. [Google Scholar]
- Hausenblas, H.A.; Cook, B.J.; Chittester, N.I. Can exercise treat eating disorders? Exerc. Sport Sci. Rev. 2008, 36, 43–47. [Google Scholar] [CrossRef]
- Wunsch, G.; Russo, F.; Mouchart, M. Do We Necessarily Need Longitudinal Data to Infer Causal Relations? BMS Bull. Sociol. Methodol. Bull. Méthodol. Sociol. 2010, 106, 5–18. [Google Scholar] [CrossRef]

Publisher’s Note: MDPI stays neutral with regard to jurisdictional claims in published maps and institutional affiliations. |
© 2022 by the authors. Licensee MDPI, Basel, Switzerland. This article is an open access article distributed under the terms and conditions of the Creative Commons Attribution (CC BY) license (https://creativecommons.org/licenses/by/4.0/).