Abstract
One of the most important effects of the smog phenomenon is the presence of high concentrations of substances hazardous to human life and health in the air. Environmental monitoring, including the monitoring of substances hazardous to human life or health, is an element of preventive measures that allow to identify current hazards and to define future actions aimed to improve (protect) the state of the environment. The article presents the results of measurements of the concentration of PM10 and PM2.5 as well as SO2, NO, NOx and O3 based on a mobile laboratory located on the campus of the Silesian University of Technology. By treating the following weeks as “objects”, points in the multidimensional space (the concentrations of PM10 and PM2.5 as well as SO2, NO, NOx and O3 were the measures/describing features), similarities between them were determined, and then they were grouped into the “summer period” (from 01/04/2020 to 30/09/2020) and “winter period” (from 01/01/2020 to 31/03/2020 and from 01/10/2020 to 31/12/2020). The article aimed to determine a linear ordering of weeks divided into the “summer period” and the “winter period”. The software MaCzek v. 3.0 (an application working in Windows) was used in the computing layer.
1. Introduction
Numerous toxicological and epidemiological studies provide more and more evidence that air pollution is related to health problems [1,2]. The exposure to air pollutants is highly dependent on their concentration. Importantly, according to the report by the World Health Organization [3], nine out of ten people breathe polluted air and this causes around seven million deaths worldwide each year. With high levels of particulate matter PM10 or PM2.5 concentrations, and with gaseous pollutants such as CO, O3 and NO2 in cities around the world, the weather and specific climatic conditions have a significant impact on the confirmed rise in COVID-19 rates and deaths [4,5].
Most research is currently focusing on the respirable PM2.5 fraction, which is considered the most harmful because, when inhaled, fine particles can penetrate deep into the lungs together with organic and inorganic compounds adsorbed on their surface [6]. The concentrations of PM2.5 in the air vary significantly in different regions of the world.
Poland is one of the countries where air quality standards have been surpassed in the prevailing area, and according to the European Environment Agency, Poland has for many years been occupying one of the top places in the classification of countries with the most polluted air in Europe. The European Union has implemented a number of legal instruments to change the quality of atmospheric air, and consequently the situation has improved in terms of the content of such pollutants, e.g., lead, sulfur dioxide or benzene. Unfortunately, the fractions of suspended particulate matter PM10 and PM2.5 and their components, such as benzo(a)pyrene, as well as gaseous pollutants, such as nitrogen oxides (NOx), are still a problem in a large area of Poland, where the recorded concentrations are ranked as the highest in Europe. The problem, which negatively contributes to bad air quality in Poland, is the use of old motor vehicles, especially those with diesel engines, which are significant sources of PM emissions. Exceeding the air quality standards for PM10 and PM2.5 is not only effected by their emission, but also by their gaseous precursors commonly emitted into the atmosphere (mainly SO2, NOx, ammonia and hydrocarbons). Legal changes involving emissions standards will bring about a further reduction of emissions, mainly in relation to gaseous pollutants, especially sulfur dioxide, nitrogen oxides and PM pollutants. The current state of air quality in Poland, and in many European Union countries, is mainly effected by the so-called low emissions from the household and municipal sector, comprising individual heat generation sources and small municipal heating plants or small service providers, as well as emissions from car transport [7]. The dominant emission sources are energy production and home heating. The factors that negatively affect air quality, especially in the case of low emission sources, are unfavorable meteorological conditions such as: no wind conditions, low temperature or fog. High wind speeds and intense rainfall result in a significant decrease in the concentration of pollutants. There are many reasons for poor air quality in Poland. One of the main ones is the dominance of coal. Despite a significant development of heating systems based on renewable energy sources, taking into account the size of hard coal or lignite resources and energy security, it can be assumed that coal will continue to be the basic fuel in the industrial and communal energy sector and in households. The combustion processes of fuels generate 55 to 80% of the total PM emissions. Coal power plants are a significant source of emissions of most hazardous substances, including bioavailable forms of elements such as: As, Cd, Cr and Ni [8].
This problem does not only concern Poland, but also other countries where energy production is based on coal. Problems related to air quality in the vicinity of large emission sources related to coal processing will be increasing.
According to antismog resolutions in Poland, the combustion of lignite and solid fuels produced with its use, coal sludge, flotoconcentrates and their mixtures, and solid biomass, the humidity of which exceeds 20%, is prohibited.
Wood and coal burning in homes are estimated to cause almost 40% of outdoor fine particulate air pollution.
In this article, measurements of PM10 and PM2.5, as well as SO2, NO, NOx and O3 dust content made on the basis of a mobile laboratory located on the campus of the Silesian University of Technology (Gliwice, 20B Konarskiego St., 50.292934 N, 18.682164 E), were used to develop comparative statements in the adopted measurement periods (weeks). These statements are based on replacing the entire set of characteristics describing the object (primary data) with one variable that is an aggregate (synthetic) quantity. Treating measurement periods as points in a multidimensional space, the relationship for determining Euclidean distances between them and the Czekanowski method for determining clusters of the above-mentioned objects was used. The application of Czekanowski’s method allowed the linear ordering of objects and to determine grouping of the objects.
2. Materials and Methods
2.1. The Use of Czekanowski’s Procedure in the Process of Data Grouping—Theoretical Basis
In the process of a broadly understood assessment, synthetic measures are becoming more and more important. They make it possible to replace the entire set of features describing the object (primary data, partial assessments) with one variable being an aggregated (synthetic) value. Czekanowski’s procedure (Czekanowski’s diagram, Czekanowski’s diagraphic method), which is the oldest numerical taxonomic method, originally developed for the needs of anthropology [9,10,11], belongs to the category of data grouping/clustering analysis. This method is used especially when complex dependencies between objects in the series prevent an effective use of hierarchical grouping methods. In this method, the starting point is a symmetrical, square Euclid’s distance matrix D between the study objects [9,10,11]:
- where:
- drs—distance between the r-th and s-th object;
- n—number of objects.
The algorithm of proceeding in Czekanowski’s method consists in rearranging the lines and the corresponding to them columns in the matrix D in such a way that the smallest possible elements are along the diagonal of the matrix and that, with the distance from the diagonal, the values of the distance measures become larger and larger. All distance measures are divided into several classes, and then individual classes are assigned graphic symbols, which allows for a visual assessment of fit of the matrix D. In Czekanowski’s method, the matching degree depends on many subjective elements, including, e.g., the adopted average difference between the examined objects (so as to consider it significant) or whether an object that shows close relations with two groups is accepted. The requirement of the maximum concentration of the objects along the main diagonal is possible only by the method of successive approximations, yet it is never known whether the obtained ultimate image is really final [12].
As the final effect of the application of Czekanowski’s method, we obtain [9,10] the so-called ordered distance matrix between objects (linear ordering of the classified objects), which in turn enables to define the so called clusters of objects (objects located close to each other in the multidimensional space).
In the opinion of the Authors, the results of the measurements obtained by stationary environmental monitoring stations supplemented with additional measurements (e.g., the ones carried out on the basis of mobile laboratories), along with selected methods of multicriteria assessment (e.g., Czekanowski’s diagram, Hellwig’s method, CLUSTER procedure under Matlab, etc.) may be used in the so-called environmental management. The authors of the manuscript consider this by creating groups (clusters) of objects characterized by a high degree of mutual similarity, which may be helpful in creating risk maps related to the occurrence of atmospheric pollution. The development of databases containing, for example, information on the emission levels of substances hazardous to human life or health, information on weather conditions and on the location of measuring points will allow to identify areas containing objects similar to each other in terms of the presence of many features occurring at the same time. In 2020, due to the threat posed by the SARS-CoV-2 virus (lockdown), the measurements were carried out only at one measurement point (Gliwice, Konarskiego 20B, 50.292934 N, 18.682164 E), which resulted in the adoption of successive weeks of the year 2020 as “objects”. In addition, the adoption of weeks as “objects” was intended to ensure the appropriate quality of the presented diagrams (Figure 1 and Figure 2), and it was also connected with the limitations of the software used. Program MaCzek v. 3.0 is a Windows-based application (Windows 95 and newer versions) which, in addition to creating Czekanowski’s diagrams, allows also to standardize data and to determine the distances between objects. The maximum size of the diagram covers 250 objects and 100 features describing the object [13]. Ultimately, these “objects” are to be the measuring points located in the area of the Silesian Voivodeship, including places located far away from the existing environmental monitoring stations, in the immediate vicinity of kindergartens, schools, hospitals, etc.
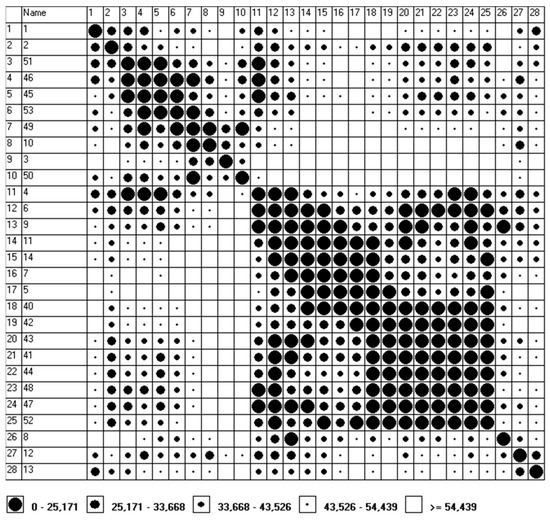
Figure 1.
Czekanowski’s diagram—“winter period”. (The MaCzek v. 3.0 program generates the graphic image of the grouping of objects by itself: the first column and the horizontal axis (the row at the top of the drawing) contain the numbers assigned to the following weeks (the second column is the number of the weeks counted from the beginning of the year).)
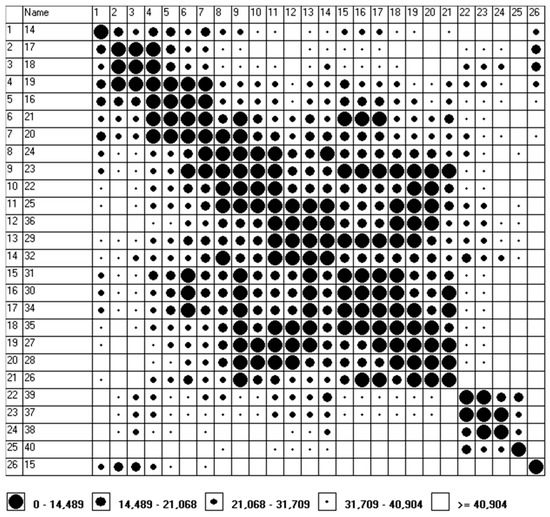
Figure 2.
Czekanowski’s diagram—“summer period”. (The MaCzek v. 3.0 program generates the graphic image of the grouping of objects by itself: the first column and the horizontal axis (the row at the top of the drawing) contain the numbers assigned to the following weeks (the second column is the number of the weeks counted from the beginning of the year).)
2.2. Location of the Measuring Point
Since the fourth quarter of 2018, the Silesian University of Technology has been equipped with a mobile laboratory built on a Ford Transit chassis. The mobile air pollution laboratory is equipped with: SO2—T100/Teledyne API analyzer; NOx—T200/Teledyne API analyzer; O3—T400/Teledyne API analyzer; PM10/PM2.5 BAM1020 m; a meteo kit WS 500 Lufft, an Envimet Services intake; an Envimet Services calibration system; an Envimet Services data logger with a display; an Envimet Services power supply system. The laboratory allows to measure the concentrations of:
- SO2—continuous automatic measurement using the fluorescence method in accordance with PN-EN 14212: 2013-02/AC: 2014-06E [14];
- NOx—continuous automatic measurement using the chemiluminescence method in accordance with PN-EN 14211: 2013-02 [15];
- O3—continuous automatic measurement by ultraviolet photometry in accordance with PN-EN 14625: 2013-02 [16];
- PM10—continuous automatic measurement with the method for which equivalence with the reference method was demonstrated according to PN-EN 12341: 2014-07 [17];
- PM2.5—continuous automatic measurement with the method for which equivalence with the reference method was demonstrated according to PN-EN 12341: 2014-07 [17].
Owing to the cofinancing granted by the Voivodship Fund for Environmental Protection and Water Management in Katowice and by the Silesian University of Technology, the launched mobile laboratory allows to carry out measurements of air pollution concentrations in the vicinity of the selected emissions sources, e.g., energy facilities, municipal sources or sources of fugitive emissions. It is extremely important because it allows to supplement and expand the spectrum of information on air quality in places not covered by systematic monitoring, and to show the significance of the so-called ‘hot spots’.
The article uses the results of measurements made in 2020 on the campus of the Silesian University of Technology: collection point PP: 20B Konarskiego St., 50.292934 N, 18.682164 E.
The town of Gliwice (177,049 inhabitants with a population density of 1322.4 people/km2) [18] neighbors on the eastern and southern sides with the towns of Zabrze and Knurów, and on the north and northeastern sides with the poviats of Tarnowskie Góry and Pyskowice, and on the west side with the forest complexes of the poviats of Kędzierzyn-Koźle and Strzelce Opolskie (Opolskie Voivodeship). The sampling point, located in the urban agglomeration with the highest population density in Poland (4,492,300.000 inhabitants of the Śląskie Voivodeship with a population density of 364 people/km2) [18], is located on the campus of the Silesian University of Technology. The distance to the nearest building is approx. 12 m and it is greater than the distance required for the sampling point [19]. There are the following communication routes in the vicinity of PP:
- from the northeastern part, approximately 500 m away—road DW902;
- in the northwest direction at a distance of about 450 m—road DW901;
- in the west direction, approximately 600 m away—road DK78.
In addition, in the north direction, at a distance of about 600 m, there is a well-developed railway infrastructure (Gliwice railway station).
In the immediate vicinity of the PP, there is a typical urban development including public utility buildings, a shopping center and multifamily residential buildings. Some of the buildings near the measuring point are connected to the heating system located on the outskirts of the city, approximately 2 km east of the PP.
In addition, there are the following facilities in the vicinity:
- Five steelworks (in the northwest direction (approx. 8.50 km)—Huta Łabędy SA, in the east direction (approx. 8.50 km—Huta Zabrze SA, 13.5 km—Huta Pokój SA, 18.5 km—Huta Batory Ltd.), and in the south direction (at a distance of 20.5 km)—Huta Łaziska S.A.);
- Twenty-nine iron foundries (including GZUT Gliwice (approx. 0.5 km) and Łabędy (approx. 8 km));
- Three coal-fired power plants (in the east direction (approx. 38 km)—power plant Jaworzno, to the south—power plants Łaziska (approximately 21.3 km) and Rybnik (approximately 20.5 km)).
3. Results and Discussion
The measurements of PM10 (µg/m3), PM2.5 (µg/m3), SO2 (µg/m3), NO (µg/m3), NOx (µg/m3) and O3 (µg/m3) concentrations in the external air for the entire year 2020 concerned only one measuring point (50.292934 N, 18.682164 E), and therefore to define “objects”, an additional parameter (feature) was introduced—time (time moments) of taking the measurements (sampling). Thus, the “objects” described by the above-mentioned features were described in the consecutive weeks of 2020 (due to the limitations of the program MaCzek v. 3.0 (the maximum size of the diagram covers 250 objects and 100 features describing the object), the average values of the concentrations of the above-mentioned parameters were accepted for calculations for the particular weeks). The measurement results were divided into two periods:
- the so-called “winter period”, i.e., from 01/01/2020 to 31/03/2020 and from 01/10/2020 to 31/12/2020;
- the so-called “summer period”, i.e., from 01/04/2020 to 30/09/2020.
The lists of the measured values of PM10 (µg/m3), PM2.5 (µg/m3), SO2 (µg/m3), NO (µg/m3), NOx (µg/m3) and O3 (µg/m3) (average daily and weekly values) are presented in Table 1, Table 2 and Table 3.

Table 1.
The lists of the measured values of PM10 (µg/m3), PM2.5 (µg/m3), SO2 (µg/m3), NO (µg/m3), NOx (µg/m3) and O3 (µg/m3) (average daily).
Table 2.
Summary (weekly average values) of the concentration of PM10 (µg/m3) and PM2.5 (µg/m3) and the content of SO2 (µg/m3), NO (µg/m3), NOx (µg/m3) and O3 (µg/m3)—“winter period”.
Table 3.
Summary (weekly average values) of the concentration of PM10 (µg/m3), PM2.5 (µg/m3), SO2 (µg/m3), NO (µg/m3), NOx (µg/m3) and O3 (µg/m3)—“summer period”.
The atmospheric conditions recorded during the measurement days (wind direction and speed, temperature, air pressure, humidity, etc.) undoubtedly had an impact on the measurement results of the harmful/noxious substance concentrations in the atmosphere. Examples of correlation relationships between the above-mentioned elements are discussed in more detail at the end of the article (Conclusions).
Based on the program MaCzek v. 3.0, the distance types between “objects” (Euclid’s distance) were determined; in the process of variable normalization, data standardization by standard deviation was used. Then, using the measured values of PM10 (µg/m3), PM2.5 (µg/m3), SO2 (µg/m3), NO (µg/m3), NOx (µg/m3) and O3 (µg/m3) (VAR1–VAR 6), and the option Simple auto algorithm (the section Order), the diagram was ordered according to an algorithm consisting in selecting objects that are the most similar to each other (Figure 1 and Figure 2).
For both periods (“winter period” and “summer period”), five ranges of similarities (I–V) were defined: from groups that are very similar (distances 0–25.171 for the “winter period” and 0–14.489 for the “summer period”) to very dissimilar groups (distances > 54.439 for the “winter period” and > 40.904 for the “summer period”).
In the case of the “winter period”, five groups were distinguished, and in the case of the “summer period”, seven groups with the greatest similarity (the similarity range I, i.e., very similar groups). In the “winter period”, in this range (Euclid’s distances between objects are not greater than 25.171), the following was distinguished:
- Group no. 1, which includes the weeks numbered: 45 (02/11–08/11), 46 (09/11–15/11) and 51 (14/12–20/12), and, allowing a slightly longer distance, an additional 53rd week (28/12–31/12), which differs to a greater extent from the 51st week (the distance between the 51st and the 53rd week is 29.304). A summary of the basic average measures and measures of relative variability for group no. 1 is presented in Table 4.
Table 4. Average measures and measures of relative variability for group no. 1.
- Group no. 2, which includes weeks numbered: 49 (30/11–06/12) and 53 (28/12–31/12), and, allowing a slightly longer distance, an additional 10th week (02/03–08/03), which differs to a greater extent from the week 53rd (the distance between week 53 and week 10 is 26.871). A summary of the basic average measures and measures of relative variability for group no. 2 is presented in Table 5.
Table 5. Average measures and measures of relative variability for group no. 2.
- Group no. 3, which includes the weeks numbered: 4 (20/01–26/01), 6 (03/02–09/02) and 9 (24/02–01/03), and, allowing for a slightly longer distance an additional 11th week (09/03–15/03), which differs to a greater extent from the 4th week (the distance between the 11th and 4th week is 33.603). A summary of the basic average measures and measures of relative variability for group no. 3 is presented in Table 6.
Table 6. Average measures and measures of relative variability for the group no. 3.
- Group no. 4, which includes the weeks numbered: 5 (27/01–02/02), 7 (10/02–16/02), 11 (09/03–15/ 03), 14 (03/03–03/03) and 40 (01/10–04/10). A summary of the basic average measures and measures of relative variability for group no. 4 is presented in Table 7.
Table 7. Average measures and measures of relative variability for group no. 4.
- Group no. 5, which includes weeks numbered: 40 (01/10–04/10), 41 (05/10/–11/10), 42 (12/10–18/10), 43 (19/10–25/10), 44 (26/10–01/11), 47 (16/11–22/11), 48 (23/11–29/11) and 52 (21/12–27/12). A summary of the basic average measures and measures of relative variability for group no. 5 is presented in Table 8.
Table 8. Average measures and measures of relative variability for group no. 5.
Similarly, (the range of similarity I, i.e., very similar groups), within the “summer period”, we can distinguish the following groups (in this case, the Euclid distances between “objects” do not exceed 14.489):
- group no. 1, which includes weeks no.: 17 (20/04–26/04), 18 (27/04/–03/05) and 19 (04/05–10/05);
- group no. 2, which includes weeks no.: 16 (13/04–19/04), 19 (04/05–10/05), 20 (11/05–17/05) and 21 (18/05 –24/05);
- group no. 3, which includes weeks no.: 22 (25/05–31/05), 23 (01/06–07/06), 24 (08/06–14/06) and 25 (15/06–21/06);
- group no. 4, which includes weeks no.: 25 (15/06–21/06), 29 (13/07–19/07), 32 (03/08–09/08) and 36 (31/08–06/09);
- group no. 5, which includes weeks no.: 30 (20/07–26/07), 31 (27/07–02 08), 34 (17/08–23/08) and 35 (24/08–30/08);
- group no. 6, which includes weeks no.: 27 (29/06–05/07), 28 (06/07–12/07) and 35 (24/08–30/08), or, allowing a slightly longer distance, an additional 26th week (22/06–28/06), which differs more than the other two weeks from the week no. 35;
- group no. 7, which includes weeks no.: 37 (07/09–13/09) and 39 (21/09–27/09), or, allowing a slightly longer distance, an additional 38th week (14/09–20/09), which differs to a greater extent from the 39th week.
An example of a summary of the basic average measures and measures of relative variability for the “summer period” is presented in Table 9.
Table 9.
A summary of the basic average measures and measures of relative variability for the “summer period”—examples.
In the “summer period”, the smallest distances between “objects” were recorded throughout 2020:
- Euclid’s distance between the 30th (20/07–26/07) and the 31st week (27/07–02/08) was 1.694;
- Euclid’s distance between the 30th (20/07–26/07) and the 34th week (17/08–23/08) was 2.336;
- Euclid’s distance between the 31st (27/07–02/08) and the 34th week (17/08–23/08) was 2.717;
- Euclid’s distance between the 27th (29/06–05/07) and the 28th week (06/07–12/07) was 4.230.
Thus, the above “objects”/weeks are the most “similar” to each other due to the simultaneous presence of PM10, PM2.5, SO2, NO, NOx and O3 in the atmosphere over the entire period of study time.
The analysis of the results shows that in the weeks of the “summer period” there is a much greater homogeneity of the results (concentrations of the measured substances) as compared to the “winter period”:
- for the group consisting of weeks 26 (22/06–28/06), 27 (29/06–05/07), 28 (06/07–12/07) and 35 (24/08–30/08), the values of the standard deviation of the measurement results of PM10 and PM2.5 concentrations did not exceed 1.0 µg/m3;
- the lowest values of the standard deviation of the SO2 concentration (below 1.0 µg/m3) were recorded for the groups including, respectively:
- 17th week (20/04–26/04), 18th week (27/04–03/05), 19th week (04/05–10/05) − S (x) = 0.573 µg/m3;
- 16th week (13/04–19/04), 19th week (04/05–10/05), 20th week (11/05–17/05), 21st week (18/05–24/05) − S (x) = 0.798 µg/m3;
- 30th week (20/07–26/07), 31st week (27/07–02/08), 34th week (17/08–23/08), 35th week (24/08–30/08) − S (x) = 0.604 µg/m3;
- 37th week (07/09–13/09), 38th week (14/09–20/09), 39th week (21/09–27/09) − S (x) = 0.686 µg/m3;
- the mean values of the coefficients of variation for the groups of weeks in the “summer period” were much below 25%: in the case of PM10 and PM2.5—12.664%; SO2—11.269%; NO—15.816%; NOx—9.092%, where the mean value of the coefficient of variation in relation to the content of SO2 in the “winter period” was over 32.794% (in the case of the group comprising weeks 27/01–02/02, 10/02–16/02, 09/03–15/03, 30/03–31/03, 01/10–04/10, V (x) exceeded 50%), and for NO, it was more than 20% (21.743%).
4. Conclusions
The progress of civilization, apart from the improvement of living standards, also has negative consequences. One of them is manifested as smog, which is a phenomenon effected by the accumulation of a significant amount of pollutants in a given area. The most dangerous effect of smog is the presence of high concentrations of substances hazardous to human life and health in the atmosphere. Exceeding the acceptable standards, especially those of PM10, PM2.5, nitrogen oxides and benzo(a)pyrene, causes the deterioration of the life quality of the inhabitants, health problems and the growing dissatisfaction of citizens.
Measurements of PM and gas pollutants are carried out not only in air quality monitoring stations (State Environmental Monitoring [20]), but also more and more frequently by mobile measuring points. As part of the article, the authors, using the results of the concentration measurements of PM10, PM2.5, SO2, NO, NOx and O3 at the measurement point located on the campus of the Silesian University of Technology (parking lot at Konarskiego 20B; 50.292934 N, 18.682164 E), proposed the use of a symmetrical, square, distance matrix D (Euclid’s distances to determine the similarity/difference of “objects” (in this case, measurement periods, i.e., weeks) and their grouping. The application of Czekanowski’s method allowed for a linear arrangement of the classified “objects” (in the space where dimensions were produced by the measurement results of the concentrations of PM and the above-mentioned chemical compounds) and for the determination of their clusters broken down into the “summer period” (from 01/04/2020 to 30/09/2020) and the “winter period” (from 01/01/2020 to 31/03/2020 and from 01/10/2020 to 31/12/2020). In the “winter period”, there were separated five groups and in the “summer period” there were seven groups with the highest similarity (similarity interval I). For example, in the “winter period”, group no. 1 is formed by weeks (“objects”) no. 45 (02/11–08/11), no. 46 (09/11–15/11), no. 51 (14/12–20/12) and no. 53 (28/12–31/12). In the period from 02/11 to 08/11, the coordinates describing the week were respectively: 39.609 (µg/m3) (PM10 concentration), 27.726 (µg/m3) (PM2.5 concentration), 10.799 (µg/m3) (SO2 concentration), 20.236 (µg/m3) (NO concentration), 53.607 (µg/m3) (NOx concentration), 18.328 (µg/m3) (O3 concentration). Similarly, the coordinates of the other weeks within the group can be determined:
- in the period from 09/11 to 15/11, the descriptive coordinates were, respectively, 49.407 (µg/m3) (PM10 concentration), 34.585 (µg/m3) (PM2.5 concentration), 13.512 (µg/m3) (SO2 concentration), 21.274 (µg/m3) (NO concentration), 52.203 (µg/m3) (NOx concentration) and 21.683 (µg/m3) (O3 concentration);
- in the period from 14/12 to 20/12, the descriptive coordinates were, respectively, 53.828 (µg/m3) (PM10 concentration), 37.680 (µg/m3) (PM2.5 concentration), 16.560 (µg/m3) (SO2 concentration), 13.224 (µg/m3) (NO concentration), 41.706 (µg/m3) (NOx concentration) and 18.528 (µg/m3) (O3 concentration);
- in the period from 28/12 to 31/12, the descriptive coordinates were, respectively, 41.457 (µg/m3) (PM10 concentration), 29.020 (µg/m3) (PM2.5 concentration), 23.863 (µg/m3) (SO2 concentration), 21.613 (µg/m3) (NO concentration), 64.024 (µg/m3) (NOx concentration) and 21.507 (µg/m3) (O3 concentration).
In future, the authors plan to use the above-mentioned method to analyze the results of measurements of air pollution recorded at various points located throughout the entire Silesian agglomeration, which will allow for a better description of the concentration levels of the selected air pollutants in the vicinity of various emissions sources and in places away from already existing monitoring stations. The measurements of PM10, PM2.5, SO2, NO, NOx and O3, carried out also on the basis of a mobile laboratory (collecting information about weather conditions in places far away from the existing environmental monitoring stations, or located in the immediate vicinity of kindergartens, schools, hospitals, etc.), will allow, in the opinion of the authors, to obtain more comprehensive knowledge of the risk level posed by substances hazardous to health and will allow to distinguish areas with a similar risk level of the above-mentioned substances. The application of Czekanowski’s model will allow to determine the so-called clusters of objects, taking into account the presence of many features (substances hazardous to human life and health) occurring at the same time. By comparing the measurement results of the concentrations of harmful/onerous substances in the atmosphere and the groupings of “objects” with the observation results of atmospheric conditions (wind direction and speed, temperature, pressure and air humidity, etc.), we can determine the levels of correlation relationships between the above-mentioned elements, which in turn can be used to estimate the risk involving the occurrence of hazards related with air pollution, to develop maps of areas with a similar level of risk and to take preventive action when we have identified “objects” with “similar characteristics”. For example, using the Pearson’s linear correlation coefficient (rxy), we can postulate that in the “winter period”, for weeks with the numbers 4 (20/01–26/01), 6 (03/02–09/02), 9 (24/02–01/03) and 11 (09/03–15/03), the correlation relationship (a measure of the strength of a linear relationship) between the concentration levels of PM10 and PM2.5 and the air temperature is very strongly negative (rxy = −0.937). We also find a negative correlation, but a significant one, between the level of concentrations of PM10 or PM2.5 and wind speed (rxy = −0.869), the level of PM10 or PM2.5 content and wind direction (rxy = −0.769) or also of NOx content and wind speed (rxy =−0.744). For comparison, in the case of the weeks numbered 5 (27/01–02/02), 7 (10/02–16/02), 11 (09/03–15/03), 14 (01/ 04–05/04) and 40 (28/09–30/09), the correlation between the level of PM10 or PM2.5 concentrations and air temperature is only moderately negative (rxy = −0.518). Both in the “winter” and “summer periods”, the correlation dependencies between the content of SO2 or NO and air temperature, as well as between air direction and air velocity, are weak (rxy) or they do not show linear relationship (rxy < 0.2). Hence, we can affirm that, in the conditions of the dominant winds from the south and southwest, the main cause of the registered pollutants should be attributed to the emission of pollutants emitted by industrial plants (steelworks Łaziska, power plants Łaziska and Rybnik) and to the heating system based mainly on the use of coal. A consistent implementation of antismog regulations [21], and the use of already existing communication routes located along the longitudinal (DK 78) or close to longitudinal (DW 902) arrangement as a kind of air corridors, especially in the conditions of increasingly stringent emission standards for pollutants produced by internal combustion engines (EURO 6 standard in force since 2014), can be a tool to improve the quality of air pollution in the study area. When formulating conclusions, however, it should be remembered that due to the restrictions introduced by the SARS-CoV-2 virus (from mid-March 2020, the work was performed remotely), the intensity of street traffic, and hence the traffic intensity in the parking lot of the Silesian University of Technology (sampling places) were smaller than during the periods of normal economic functioning and they do not accurately reflect pollution of the atmosphere. According to the General Directorate for National Roads and Motorways, based on obtained data analysis from 32 measuring stations equipped with the viaToll system, the average vehicle traffic from 9 March to 17 May 2020, amounted to approximately 16,500.000 vehicles per day, while in the same period of 2019, it was 25,300.000 vehicles, which means a decrease by about 35%.
Author Contributions
Conceptualization, E.Z.-Z. and Z.K.; Methodology, E.Z.-Z. and Z.K.; Supervision, E.Z.-Z. and Z.K.; Writing—original draft, E.Z.-Z. and Z.K.; Writing—review & editing, E.Z.-Z. and Z.K. All authors have read and agreed to the published version of the manuscript.
Funding
This research received no external funding.
Institutional Review Board Statement
Not applicable.
Informed Consent Statement
Not applicable.
Data Availability Statement
Not applicable.
Acknowledgments
This work was supported by the Faculty of Energy and Environmental Engineering, Silesian University of Technology (statutory research).
Conflicts of Interest
The authors declare no conflict of interest.
References
- Manisalidis, I.; Stavropoulou, E.; Stavropoulos, A.; Bezirtzoglou, E. Environmental and Health Impacts of Air Pollution: A Review. Front. Public Health 2020, 8, 14. [Google Scholar] [CrossRef] [PubMed]
- Juda-Rezler, K.; Zajusz-Zubek, E.; Reizer, M.; Kurek, E.; Bulska, E.; Klejnowski, K. Bioavailability of elements in atmospheric PM2.5 during winter episodes at Central Eastern European urban background site. Atmos. Environ. 2021, 245, 117993. [Google Scholar] [CrossRef]
- World Health Organization (WHO). Air Pollution; World Health Organization (WHO): Geneva, Switzerland, 2022. [Google Scholar]
- Meo, S.A.; Alqahtani, S.A.; Binmeather, F.S.; AlRasheed, R.A.; Aljedaie, G.M.; Albarrak, R.M. Effect of environmental pollutants PM2.5, CO, O3 and NO2, on the incidence and mortality of SARS-COV-2 in largest metropolitan cities, Delhi, Mumbai and Kolkata, India Sultan. J. King Saud Univ.–Sci. 2022, 34, 101687. [Google Scholar] [CrossRef] [PubMed]
- Zoran, M.A.; Savastru, R.S.; Savastru, D.M.; Tautan, M.N. Assessing the relationship between surface levels of PM2.5 and PM10 particulate matter impact on COVID-19 in Milan, Italy. Sci. Total. Environ 2020, 738, 139825. [Google Scholar] [CrossRef] [PubMed]
- Feng, X.D.; Dang, Z.; Huang, W.L.; Yang, C. Chemical speciation of fine particle bound trace metals. Int. J. Environ. Sci. Technol. 2009, 6, 337–346. [Google Scholar] [CrossRef]
- Kaczmarczyk, M. Niska Emisja. Efektywność Energetyczna w Gminach i Samorządach; Geosystem: Kraków, Poland, 2017; p. 135. [Google Scholar]
- Zajusz-Zubek, E. Evaluation of Forms in Which Occur Selected Trace Elements in Suspended Dust (PM10) and Respirable Fraction (PM2.5) in the Surroundings of Coal-Fired Power Plants and Coking Plants in the Non-Heating Season; Publishing House of Silesian University of Technology: Gliwice, Poland, 2016; p. 127. [Google Scholar]
- Czekanowski, J. Zur Differentialdiagnose der Neandertalgruppe, Korespondentblatt der Deutschen Gesellschaft für Anthropologie. Ethnol. Urgesch. 1909, XL, 44–47. [Google Scholar]
- Czekanowski, J. Zarys metod statystycznych w zastosowaniach do antropologii. Pr. Tow. Nauk. Warsz. 1913, 5, 167–173. [Google Scholar]
- Czekanowski, J. Metoda podobieństwa w zastosowaniu do badań psychometrycznych. Bad. Psychol. 1926, 3, 1–40. [Google Scholar]
- PN-EN 14625:2013-02; Ambient air–Standard. PKN: Warszawa, Poland, 2013.
- Jaskulski, P. Instrukcja Użytkownika Programu MaCzek 3.0; 2010; pp. 1–10. Available online: http://www.antropologia.uw.edu.pl/MaCzek/manual_30_pl.pdf (accessed on 8 July 2022).
- PN-EN 14212:2013-02/AC:2014-06E; Ambient Air Quality—Standard Method for the Measurement of the Concentration of Sulphur Dioxide by Ultraviolet Fluorescence. PKN: Warszawa, Poland, 2013.
- PN-EN 14211:2013-02; Ambient Air Quality. Standard Method for the Measurement of the Method for the Measurement of the Concentration of Ozone by Ultraviolet Photometry. PKN: Warszawa, Poland, 2013.
- PN-EN 12341:2014-07; Ambient Air—Standard Gravimetric Measurement Method for the Determination of the PM10 or PM2.5 Mass Concentration of Suspended Particulate Matter. PKN: Warszawa, Poland, 2014.
- Available online: https://www.polskawliczbach.pl/Gliwice (accessed on 8 July 2022).
- Statistical Office in Katowice. Population, Vital Statistics and Migrations in Śląskie Voivodship in 2020; Statistical Office in Katowice: Katowice, Poland, 2021.
- Rozporządzenie Ministra Środowiska z Dnia 11 Grudnia 2020 r. w Sprawie Dokonywania Oceny Poziomów Substancji w Powietrzu (Dz.U. z 2020 r.; poz. 2279). Available online: https://isap.sejm.gov.pl/isap.nsf/DocDetails.xsp?id=WDU20200002279 (accessed on 8 July 2022).
- Ustawa z Dnia 20 Lipca 1991 Roku o Inspekcji Ochrony Środowiska (Dz. U. z 2018 r. poz. 1471, 1479). Available online: https://isap.sejm.gov.pl/isap.nsf/download.xsp/WDU20180001479/T/D20181479L.pdf (accessed on 8 July 2022).
- Uchwała NR V/36/1/2017 Sejmiku Województwa Śląskiego z Dnia 7 Kwietnia 2017 r. w Sprawie Wprowadzenia na Obszarze Województwa śląskiego Ograniczeń w Zakresie Eksploatacji Instalacji, w Których Następuje Spalanie Paliw. Available online: https://www.infor.pl/akt-prawny/U85.2017.066.0002624,metryka,uchwala-nr-v3612017-sejmiku-wojewodztwa-slaskiego-w-sprawie-wprowadzenia-na-obszarze-wojewodztwa-slaskiego-ograniczen-wzakresie-eksploatacji-instalacji-w-ktorych-nastepuje-spalanie-paliw.html (accessed on 8 July 2022).


Publisher’s Note: MDPI stays neutral with regard to jurisdictional claims in published maps and institutional affiliations. |
© 2022 by the authors. Licensee MDPI, Basel, Switzerland. This article is an open access article distributed under the terms and conditions of the Creative Commons Attribution (CC BY) license (https://creativecommons.org/licenses/by/4.0/).