
Knowledge and Farmers’ Adoption of Green Production Technologies: An Empirical Study on IPM Adoption Intention in Major Indica-Rice-Producing Areas in the Anhui Province of China
Abstract
:
1. Introduction
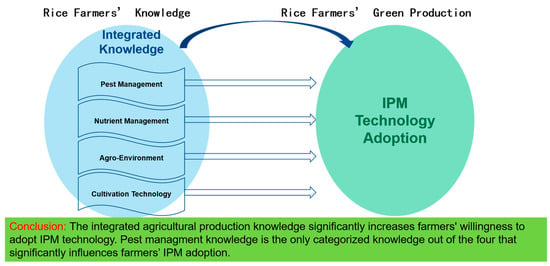
2. Conceptual Framework
3. Materials and Methods
3.1. Data and Research Design
3.1.1. Description of the Study Region
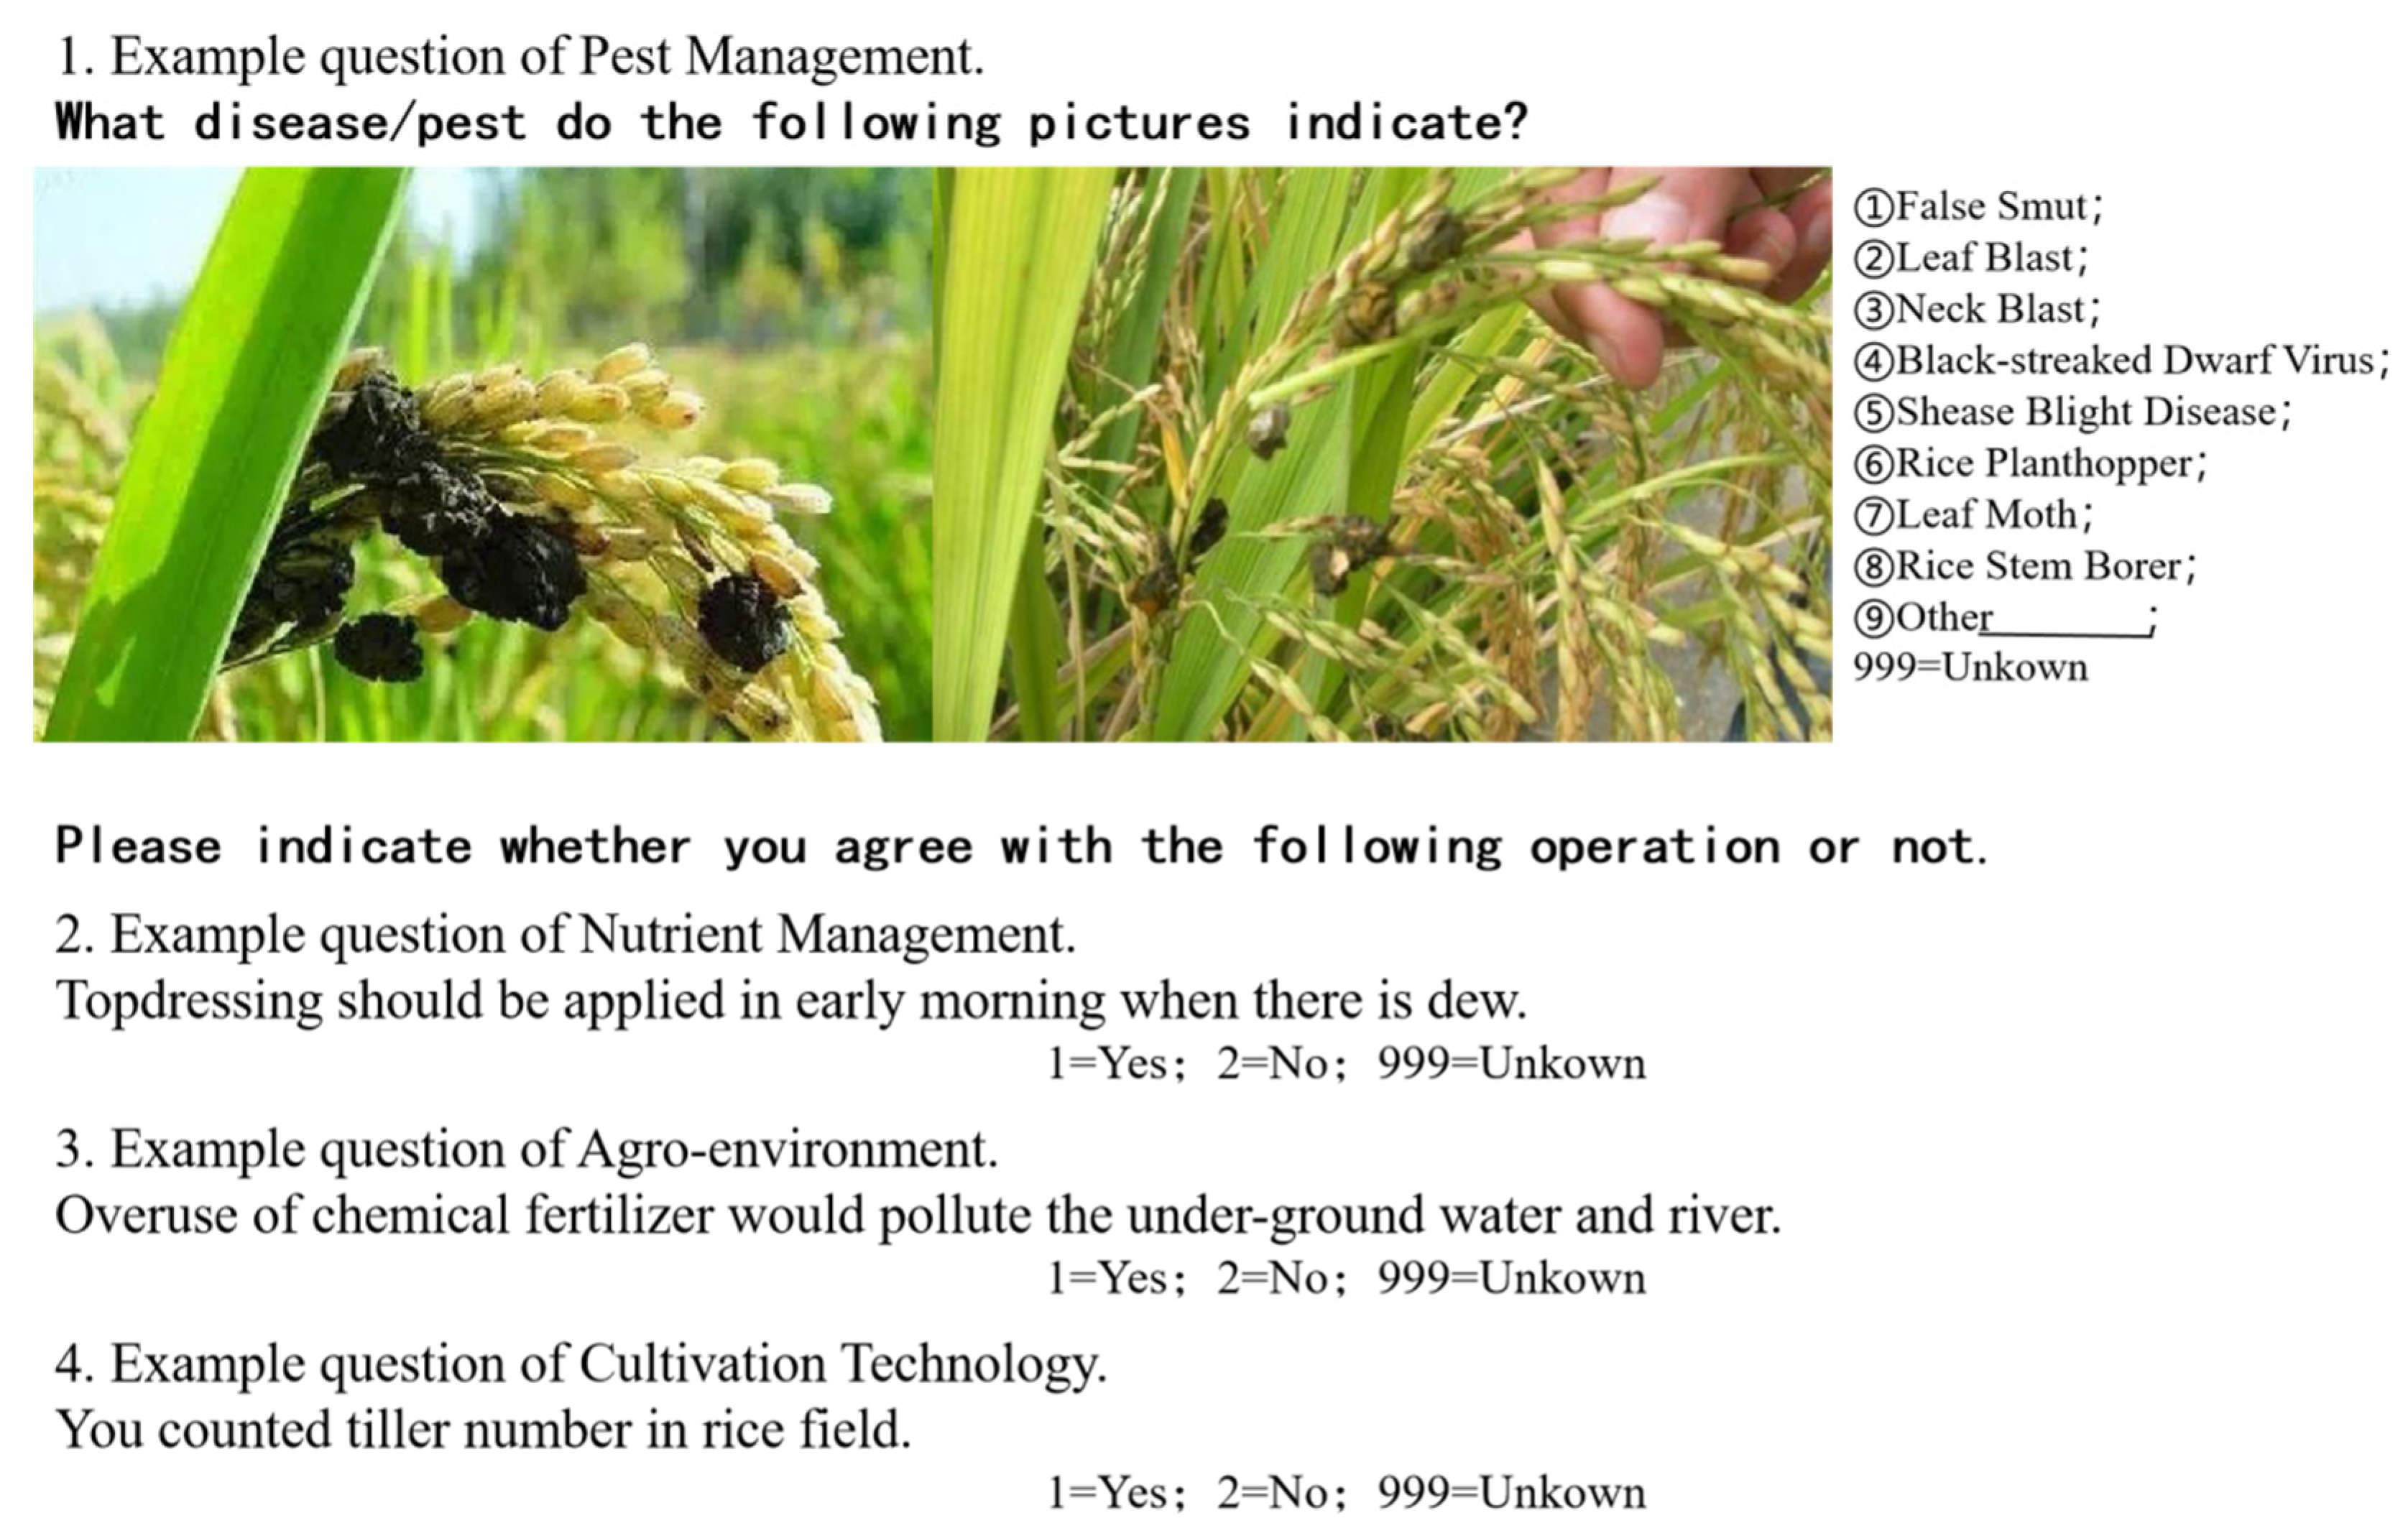
3.1.2. Survey Design and Data Collection
3.2. Methods
3.2.1. Theoretical Model
3.2.2. Empirical Model and Variable Descriptions
3.2.3. Estimation Method
4. Results
4.1. Descriptive Statistics
4.1.1. Summary Statistics of Respondents
4.1.2. Agricultural Production Knowledge and Farmers’ Willingness to Adopt IPM Technology
4.1.3. Other Factors and Farmers’ Willingness to Adopt IPM Technology
4.2. Regression Results
4.2.1. Comprehensive Agricultural Production Knowledge and Farmers’ IPM Adoption Intention
4.2.2. Disciplinary Knowledge and Farmers’ IPM Adoption Intention
5. Conclusions
Supplementary Materials
Author Contributions
Funding
Institutional Review Board Statement
Informed Consent Statement
Data Availability Statement
Acknowledgments
Conflicts of Interest
References
- Zhang, C.; Shi, G.; Shen, J.; Hu, R. Productivity effect and overuse of pesticide in crop production in China. J. Integr. Agric. 2015, 14, 1903–1910. [Google Scholar] [CrossRef]
- Yaguana, V.C.; Alwang, J.; Norton, G.; Barrera, V. Does IPM have staying power? revisiting a potato-producing area years after formal training ended. J. Agric. Econ. 2016, 67, 308–323. [Google Scholar] [CrossRef]
- Sun, S.; Hu, R.; Zhang, C.; Shi, G. Do farmers misuse pesticides in crop production in China? evidence from a farm household survey. Pest Manag. Sci. 2019, 75, 2133–2141. [Google Scholar] [CrossRef]
- Damalas, C.A.; Eleftherohorinos, L.G. Pesticide exposure, safety issues, and risk assessment indicators. Int. J. Environ. Res. Public Health 2011, 8, 1402–1419. [Google Scholar] [CrossRef]
- Yang, P.Y.; Zhao, Z.H.; Shen, Z.R. Experiences with implementation and adoption of integrated pest management in China. Integr. Pest Manag. 2014, 4, 307–330. [Google Scholar] [CrossRef]
- Rezaei, R.; Safa, L.; Damalas, C.A.; Ganjkhanloo, M.M. Drivers of farmers’ in-tention to use integrated pest management: Integrating theory of planned behavior and norm activation model. J. Environ. Manag. 2019, 236, 328–339. [Google Scholar] [CrossRef]
- Gautam, S.; Schreinemachers, P.; Uddin, M.N.; Srinivasan, R. Impact of training vegetable farmers in Bangladesh in integrated pest management (IPM). Crop Prot. 2017, 102, 161–169. [Google Scholar] [CrossRef]
- Kabir, M.H.; Rainis, R.; Azad, M.J. Are spatial factors important in the adoption of eco-friendly agricultural technologies? Evidence on integrated pest management (IPM). J. Geogr. Inf. Syst. 2017, 9, 98–113. [Google Scholar] [CrossRef] [Green Version]
- Young, S.L. A systematic review of the literature reveals trends and gaps in integrated pest management studies conducted in the united states. Pest Manag. Sci. 2017, 73, 1553–1558. [Google Scholar] [CrossRef]
- Zhao, L.; Cai, S. Farmers’ IPM technology adoption: Based on empirical analysis on Wuhu, Anhui Province. Issues Agric. Econ. 2012, 33, 50–57+111. (In Chinese) [Google Scholar]
- Geng, Y.; Zheng, S.; Lu, Q. Impact of economic incentives and social networks on farmers’ adoption of integrated pest management technology-evidence from the kiwifruit main production areas of Shaanxi Province. J. Huazhong Agric. Univ. 2017, 6, 59–69+150. (In Chinese) [Google Scholar]
- Mohankumar, S.; Ramasubramanian, T. Role of genetically modified insect- resistant crops in IPM: Agricultural, ecological and evolutionary implications. In Integrated Pest Management; Academic Press: Cambridge, MA, USA, 2014. [Google Scholar] [CrossRef]
- Cuyno, L.C.; Norton, G.W.; Rola, A. Economic analysis of environmental benefits of integrated pest management: A philippine case study. Agric. Econ. 2001, 25, 227–233. [Google Scholar] [CrossRef]
- Ahuja, D.B.; Ahuja, U.R.; Singh, S.K.; Singh, N. Comparison of Integrated Pest Management approaches and conventional (non-IPM) practices in late-winter-season cauliflower in northern India. Crop Prot. 2015, 78, 232–238. [Google Scholar] [CrossRef]
- Pretty, J.; Bharucha, Z.P. Integrated Pest Management for Sustainable Intensific-ation of Agriculture in Asia and Africa. Insects 2015, 6, 152–182. [Google Scholar] [CrossRef]
- Rahman, S.; Norton, G.W.; Rashid, M.H. Economic impacts of integrated pest management on vegetables production in Bangladesh. Crop Prot. 2018, 113, 6–14. [Google Scholar] [CrossRef]
- Zhao, L.; Cai, S. Cost-saving and yield-increasing effect of IPM technology adopted by farmers in late rice planting. Chin. Rural Econ. 2013, 5, 78–87. (In Chinese) [Google Scholar]
- Korir, J.K.; Affognon, H.D.; Ritho, C.N.; Kingori, W.S.; Irungu, P.; Mohamed, S.A.; Ekesi, S. Grower adoption of an integrated pest management package for management of mango-infesting fruit flies (Diptera: Tephritidae) in Embu, Kenya. Int. J. Trop. Insect Sci. 2015, 35, 80–89. [Google Scholar] [CrossRef]
- Allahyari, M.S.; Damalas, C.A.; Ebadattalab, M. Determinants of integrated pest management adoption for olive fruit fly (Bactrocera oleae) in Roudbar, Iran. Crop Prot. 2016, 84, 113–120. [Google Scholar] [CrossRef]
- Gao, Y.; Zhang, X.; Lu, J.; Wu, L. Research on adoption behavior of green control techniques by family farms. Resour. Sci. 2017, 39, 934–944. (In Chinese) [Google Scholar]
- Githiomi, C.; Muriithi, B.; Irungu, P.; Mwungu, C.M.; Diiro, G.; Affognon, H.; Mburu, J.; Ekesi, S. Economic analysis of spillover effects of an integrated pest management (IPM) strategy for suppression of mango fruit fly in Kenya. Food Policy 2019, 84, 121–132. [Google Scholar] [CrossRef]
- Chu, C. Study on farmers’ adoption decision and adoption density of integrated pest control technology. J. Agrotech. Econ. 2015, 9, 117–127. (In Chinese) [Google Scholar]
- Liu, D.; Sun, J.; Huang, M.; Hu, W. Research on Cooperative Effect of Market and Government on Farmers’ Adoption of Integrated Pest Management Technology. Resour. Environ. Yangtze Basin 2019, 28, 1154–1163. (In Chinese) [Google Scholar]
- Muthuraman, P.; Sain, M. Sociology of Integrated Pest Management in Rice. In Proceedings of the Resources Management in Plant Protection during Twenty First Century, Hyderabad, India, 14–15 November 2002; Volume 2, pp. 14–15. [Google Scholar]
- Shojaei, S.H.; Hosseini, S.J.F.; Mirdamadi, M.; Zamanizadeh, H.R. Investigating Barriers to Adoption of Integrated pest management Technologies in Iran. Ann. Biol. Res. 2013, 4, 39–42. [Google Scholar]
- Pouratashi, M.; Iravani, H. Farmers’ knowledge of integrated pest management and learning style preferences: Implications for information delivery. Int. J. Pest Manag. 2012, 58, 347–353. [Google Scholar] [CrossRef]
- NBS. 2021. Available online: http://data.stats.gov.cn/easyquery.htm?cn=C01 (accessed on 25 July 2022).
- Agrochemical Information Net. The Commercial Pesticide Usage of China Was 1.46 Million Tons in 2019. 2021. Available online: http://jsppa.com.cn/news/jingji/2556.html (accessed on 26 July 2022).
- China Industrial Information Net. The 2020 General Situation and Future Development Trend of Pesticide Industry, and Impact Analyses of Sino-US Trade Friction on Pesticide Industry. 2021. Available online: https://www.chyxx.com/ (accessed on 26 July 2022).
- Yu, G.; Xu, C.; Wu, Y.; Xiu, X.; Tong, H. Thoughts on supply-side structural reform of the rice industry in China. Chin. J. Agric. Resour. Reg. Plan. 2020, 41, 53–62. (In Chinese) [Google Scholar]
- Fan, L.; Niu, H.; Yang, X.; Qin, W.; Bento, C.P.M.; Ritsema, C.J.; Geissen, V. Factors affecting farmers’ behaviour in pesticide use: Insights from a field study in northern China. Sci. Total Environ. 2015, 537, 360–368. [Google Scholar] [CrossRef]
- Shu, L. Theoretical review and realistic thinking of farmers’ economic behavior. Enterp. Guide 2009, 4, 111. (In Chinese) [Google Scholar]
- Antle, J.M.; Crissman, C.C. Risk, efficiency, and the adoption of modern crop varieties: Evidence from the philippines. Econ. Dev. Cult. Chang. 1990, 38, 517–537. [Google Scholar] [CrossRef]
- Fairweather, J.R.; Keating, N.C. Goals and management styles of New Zealand farmers. Agric. Syst. 1994, 44, 181–200. [Google Scholar] [CrossRef]
- Austin, E.J.; Willock, J.; Deary, I.J.; Gibson, G.J.; Dent, J.B.; Edwards-Jones, G.; Morgan, O.; Grieve, R.; Sutherland, A. Empirical models of farmer behaviour using psychological, social and economic variables. part I: Linear modelling. Agric. Syst. 1998, 58, 203–224. [Google Scholar] [CrossRef]
- Leeuwis, C.; Ban, A.V.D. Communication for rural innovation: Rethinking agricultural extension. Int. J. Agric. Manag. 2004, 3, 187–188. [Google Scholar] [CrossRef]
- He, G.; Liang, S.; Liu, J. Effects of gender stereotypes and task frames on risk preference predictions. Chin. J. Appl. Psychol. 2002, 8, 19–23. [Google Scholar] [CrossRef]
- Steiro, A.L.; Kvakkestad, V.; Breland, T.A.; Vatn, A. Integrated Pest Management adoption by grain farmers in Norway: A novel index method. Crop Prot. 2020, 135, 105201. [Google Scholar] [CrossRef]


| Comprehensive Test | Knowledge Disciplines | ||||
|---|---|---|---|---|---|
| Pest Management | Nutrient Management | Agro-Environment | Cultivation Technology | ||
| Full Score | 400 | 100 | 100 | 100 | 100 |
| Score | 161 | 40 | 44 | 22 | 56 |
| Variable Name | Definitions | Mean | Std Dev. |
|---|---|---|---|
| Explanatory variable | |||
| Wi | The ith farmer’s willingness to adopt IPM technology 1 = Yes, 0 = No | 0.49 | 0.50 |
| Key explanatory variables | |||
| Scorei0 | score of comprehensive test | 160.87 | 44.94 |
| Scorei1 | score of the pest management discipline | 39.52 | 10.95 |
| Scorei2 | score of the nutrient management discipline | 43.78 | 22.55 |
| Scorei3 | score of the agro-environment discipline | 21.84 | 20.37 |
| Scorei4 | score of the cultivation technology discipline | 55.73 | 13.75 |
| Individual variables | |||
| Gender | 1 = Female, 0 = Male | 0.44 | 0.50 |
| Age | year | 54.23 | 10.53 |
| Education | education years | 4.26 | 3.94 |
| Training | agrotechnical training experience 1 = Yes, 0 = No | 0.46 | 0.50 |
| Family variables | |||
| NA employment | Non-agricultural employment ratio (%) | 26.81 | 33.35 |
| Land | Per capita arable land area (acre) | 0.13 | 0.11 |
| Income | Average family income (¥1000) | 36.20 | 42.27 |
| Characteristics | Min | Max | Category | Sample Size | Percentage (%) |
|---|---|---|---|---|---|
| Age | 28 | 79 | (20,30] | 1 | 0.10 |
| (30,40] | 69 | 7.03 | |||
| (40,50] | 326 | 33.23 | |||
| (50,60] | 247 | 25.18 | |||
| (60,80] | 338 | 34.45 | |||
| Education Years | 0 | 16 | [0,6) | 419 | 42.71 |
| [6,9) | 325 | 33.13 | |||
| [9,12) | 207 | 21.10 | |||
| [12,16) | 28 | 2.85 | |||
| [16,19) | 2 | 0.20 | |||
| Training | 0 | 1 | 0 | 525 | 53.52 |
| 1 | 456 | 46.48 | |||
| NA employment | 0 | 100 | 0 | 544 | 55.45 |
| (0,20] | 32 | 3.26 | |||
| (20,40] | 75 | 7.65 | |||
| (40,60] | 111 | 11.31 | |||
| (60,80] | 165 | 16.82 | |||
| (80,100] | 54 | 5.50 | |||
| Land Size | 0.01 | 2.30 | (0,0.3] | 942 | 96.02 |
| (0.3,0.6] | 33 | 3.36 | |||
| (0.6,0.9] | 5 | 0.51 | |||
| (0.9,2.3] | 1 | 0.10 |
| Sample Size | Willing to Adopt IPM (%) | |
|---|---|---|
| Integrated score | ||
| (0,140] | 349 | 42 |
| (140,180] | 337 | 46 |
| >180 | 295 | 59 |
| Score of pest management discipline | ||
| (0,35] | 325 | 49 |
| (35,45] | 377 | 54 |
| >45 | 279 | 57 |
| Score of nutrient management discipline | ||
| (0,50] | 501 | 46 |
| >50 | 480 | 51 |
| Score of agro-environment discipline | ||
| (0,25) | 343 | 44 |
| [25,50] | 604 | 57 |
| >50 | 34 | 76 |
| Score of cultivation technology discipline | ||
| (0,50] | 507 | 49 |
| (50,75] | 312 | 45 |
| >75 | 162 | 54 |
| Sample Size | Willing to Adopt IPM (%) | |
|---|---|---|
| Gender | ||
| Female | 428 | 42 |
| Male | 553 | 54 |
| Age | ||
| ≤45 | 248 | 57 |
| (45,55] | 253 | 56 |
| (55,60] | 192 | 47 |
| >60 | 288 | 36 |
| Education years | ||
| 0 | 419 | 40 |
| (0,6] | 325 | 51 |
| >6 | 237 | 60 |
| Agrotechnical training experience | ||
| Yes | 456 | 54 |
| No | 525 | 44 |
| Non-agricultural employment ratio in the family (%) | ||
| [0,35] | 196 | 30 |
| (35,50] | 203 | 48 |
| (50,75] | 327 | 48 |
| >75 | 255 | 64 |
| Per capita arable land area of the family (acre) | ||
| (0,0.08] | 301 | 44 |
| (0.08,0.14] | 357 | 48 |
| >0.14 | 323 | 54 |
| Average family income (¥1000) | ||
| (0,16] | 328 | 44 |
| (16,46] | 391 | 47 |
| >46 | 262 | 57 |
| Variables | Model ① | Model ② | Model ③ | Model ④ |
|---|---|---|---|---|
| Key explanatory variables | ||||
| Scorei0 | 0.004 ** (0.002) [0.001] ** | 0.001 ** (0.000) | 0.004 ** (0.002) [0.001] ** | 0.001 ** (0.000) |
| Individual variables | ||||
| Gender | −0.479 *** (0.160) [−0.108] *** | −0.110 *** (0.036) | −0.305 * (0.165) [−0.065] | −0.066 * (0.036) |
| Age | −0.018 ** (0.008) [−0.004] ** | −0.004 ** (0.002) | −0.007 (0.008) [−0.002] | −0.002 (0.002) |
| Education | 0.025 (0.020) [0.006] | 0.006 (0.005) | 0.023 (0.021) [0.005] | 0.005 (0.005) |
| Training | 0.323 ** (0.137) [0.073] ** | 0.072 ** (0.031) | 0.379 *** (0.145) [0.081] *** | 0.081 ** (0.031) |
| Family variables | ||||
| NA employment | 0.014 *** (0.003) [0.003] *** | 0.003 *** (0.001) | 0.009 *** (0.003) [0.002] *** | 0.002 *** (0.001) |
| Land | 0.398 (0.683) [0.089] | 0.094 (0.154) | 0.001 (0.525) [0.000] | 0.002 (0.112) |
| Income | 0.001 (0.002) [0.000] | 0.000 (0.000) | −0.001 (0.002) [−0.000] | −0.000 (0.000) |
| Regional dummies | Controlled | Controlled | ||
| Intercept | −0.705 (0.644) | 0.343 ** (0.145) | −1.363 ** (0.678) | 0.196 (0.145) |
| Sample size | 981 | |||
| Variables | Model ⑤ | Model ⑥ | Model ⑦ | Model ⑧ |
|---|---|---|---|---|
| Key explanatory variables | ||||
| Pest-management knowledge | 0.027 *** (0.007) [0.006] *** | 0.006 *** (0.002) | 0.026 *** (0.008) [0.006] *** | 0.006 *** (0.002) |
| Nutrient-management knowledge | 0.000 (0.004) [0.000] | 0.000 (0.001) | 0.003 (0.004) [0.001] | 0.001 (0.001) |
| Agro-environment knowledge | −0.001 (0.004) [0.000] | −0.000 (0.001) | −0.003 (0.004) [−0.001] | −0.001 (0.001) |
| Cultivation-technology knowledge | 0.001 (0.005) [0.000] | 0.000 (0.001) | −0.000 (0.005) [−0.000] | −0.000 (0.001) |
| Individual variables | ||||
| Gender | −0.487 *** (0.161) [−0.108] *** | −0.111 *** (0.036) | −0.311 * (0.165) [−0.066] * | −0.067 * (0.036) |
| Age | −0.017 ** (0.008) [−0.004] ** | −0.004 ** (0.002) | −0.007 (0.008) [−0.001] | −0.001 (0.002) |
| Education | 0.024 (0.021) [0.005] | 0.005 (0.005) | 0.020 (0.021) [0.004] | 0.004 (0.005) |
| Training | 0.262 (0.139) [0.058] | 0.058 * (0.031) | 0.329 ** (0.148) [0.069] ** | 0.070 ** (0.032) |
| Family variables | ||||
| NA employment | 0.014 *** (0.003) [0.003] *** | 0.003 *** (0.001) | 0.008 *** (0.003) [0.002] *** | 0.002 *** (0.001) |
| Land | 0.354 (0.641) [0.079] | 0.084 (0.147) | −0. 042 (0.524) [−0.009] | −0.006 (0.105) |
| Income | 0.001 (0.002) [0.000] | 0.000 (0.000) | −0.001 (0.002) [−0.000] | −0.000 (0.000) |
| Regional dummies | Controlled | Controlled | ||
| Intercept | −1.187 * (0.684) | 0.239 (0.151) | −1.671 ** (0.710) | 0.134 (0.149) |
| Sample size | 981 | |||
Publisher’s Note: MDPI stays neutral with regard to jurisdictional claims in published maps and institutional affiliations. |
© 2022 by the authors. Licensee MDPI, Basel, Switzerland. This article is an open access article distributed under the terms and conditions of the Creative Commons Attribution (CC BY) license (https://creativecommons.org/licenses/by/4.0/).
Share and Cite
Sun, X.; Lyu, J.; Ge, C. Knowledge and Farmers’ Adoption of Green Production Technologies: An Empirical Study on IPM Adoption Intention in Major Indica-Rice-Producing Areas in the Anhui Province of China. Int. J. Environ. Res. Public Health 2022, 19, 14292. https://doi.org/10.3390/ijerph192114292
Sun X, Lyu J, Ge C. Knowledge and Farmers’ Adoption of Green Production Technologies: An Empirical Study on IPM Adoption Intention in Major Indica-Rice-Producing Areas in the Anhui Province of China. International Journal of Environmental Research and Public Health. 2022; 19(21):14292. https://doi.org/10.3390/ijerph192114292
Chicago/Turabian StyleSun, Xiaolong, Jing Lyu, and Candi Ge. 2022. "Knowledge and Farmers’ Adoption of Green Production Technologies: An Empirical Study on IPM Adoption Intention in Major Indica-Rice-Producing Areas in the Anhui Province of China" International Journal of Environmental Research and Public Health 19, no. 21: 14292. https://doi.org/10.3390/ijerph192114292