
The Spatial-Temporal Transition and Influencing Factors of Green and Low-Carbon Utilization Efficiency of Urban Land in China under the Goal of Carbon Neutralization
 ,
,
Abstract
:1. Introduction
2. Literature Review
3. Data and Methods
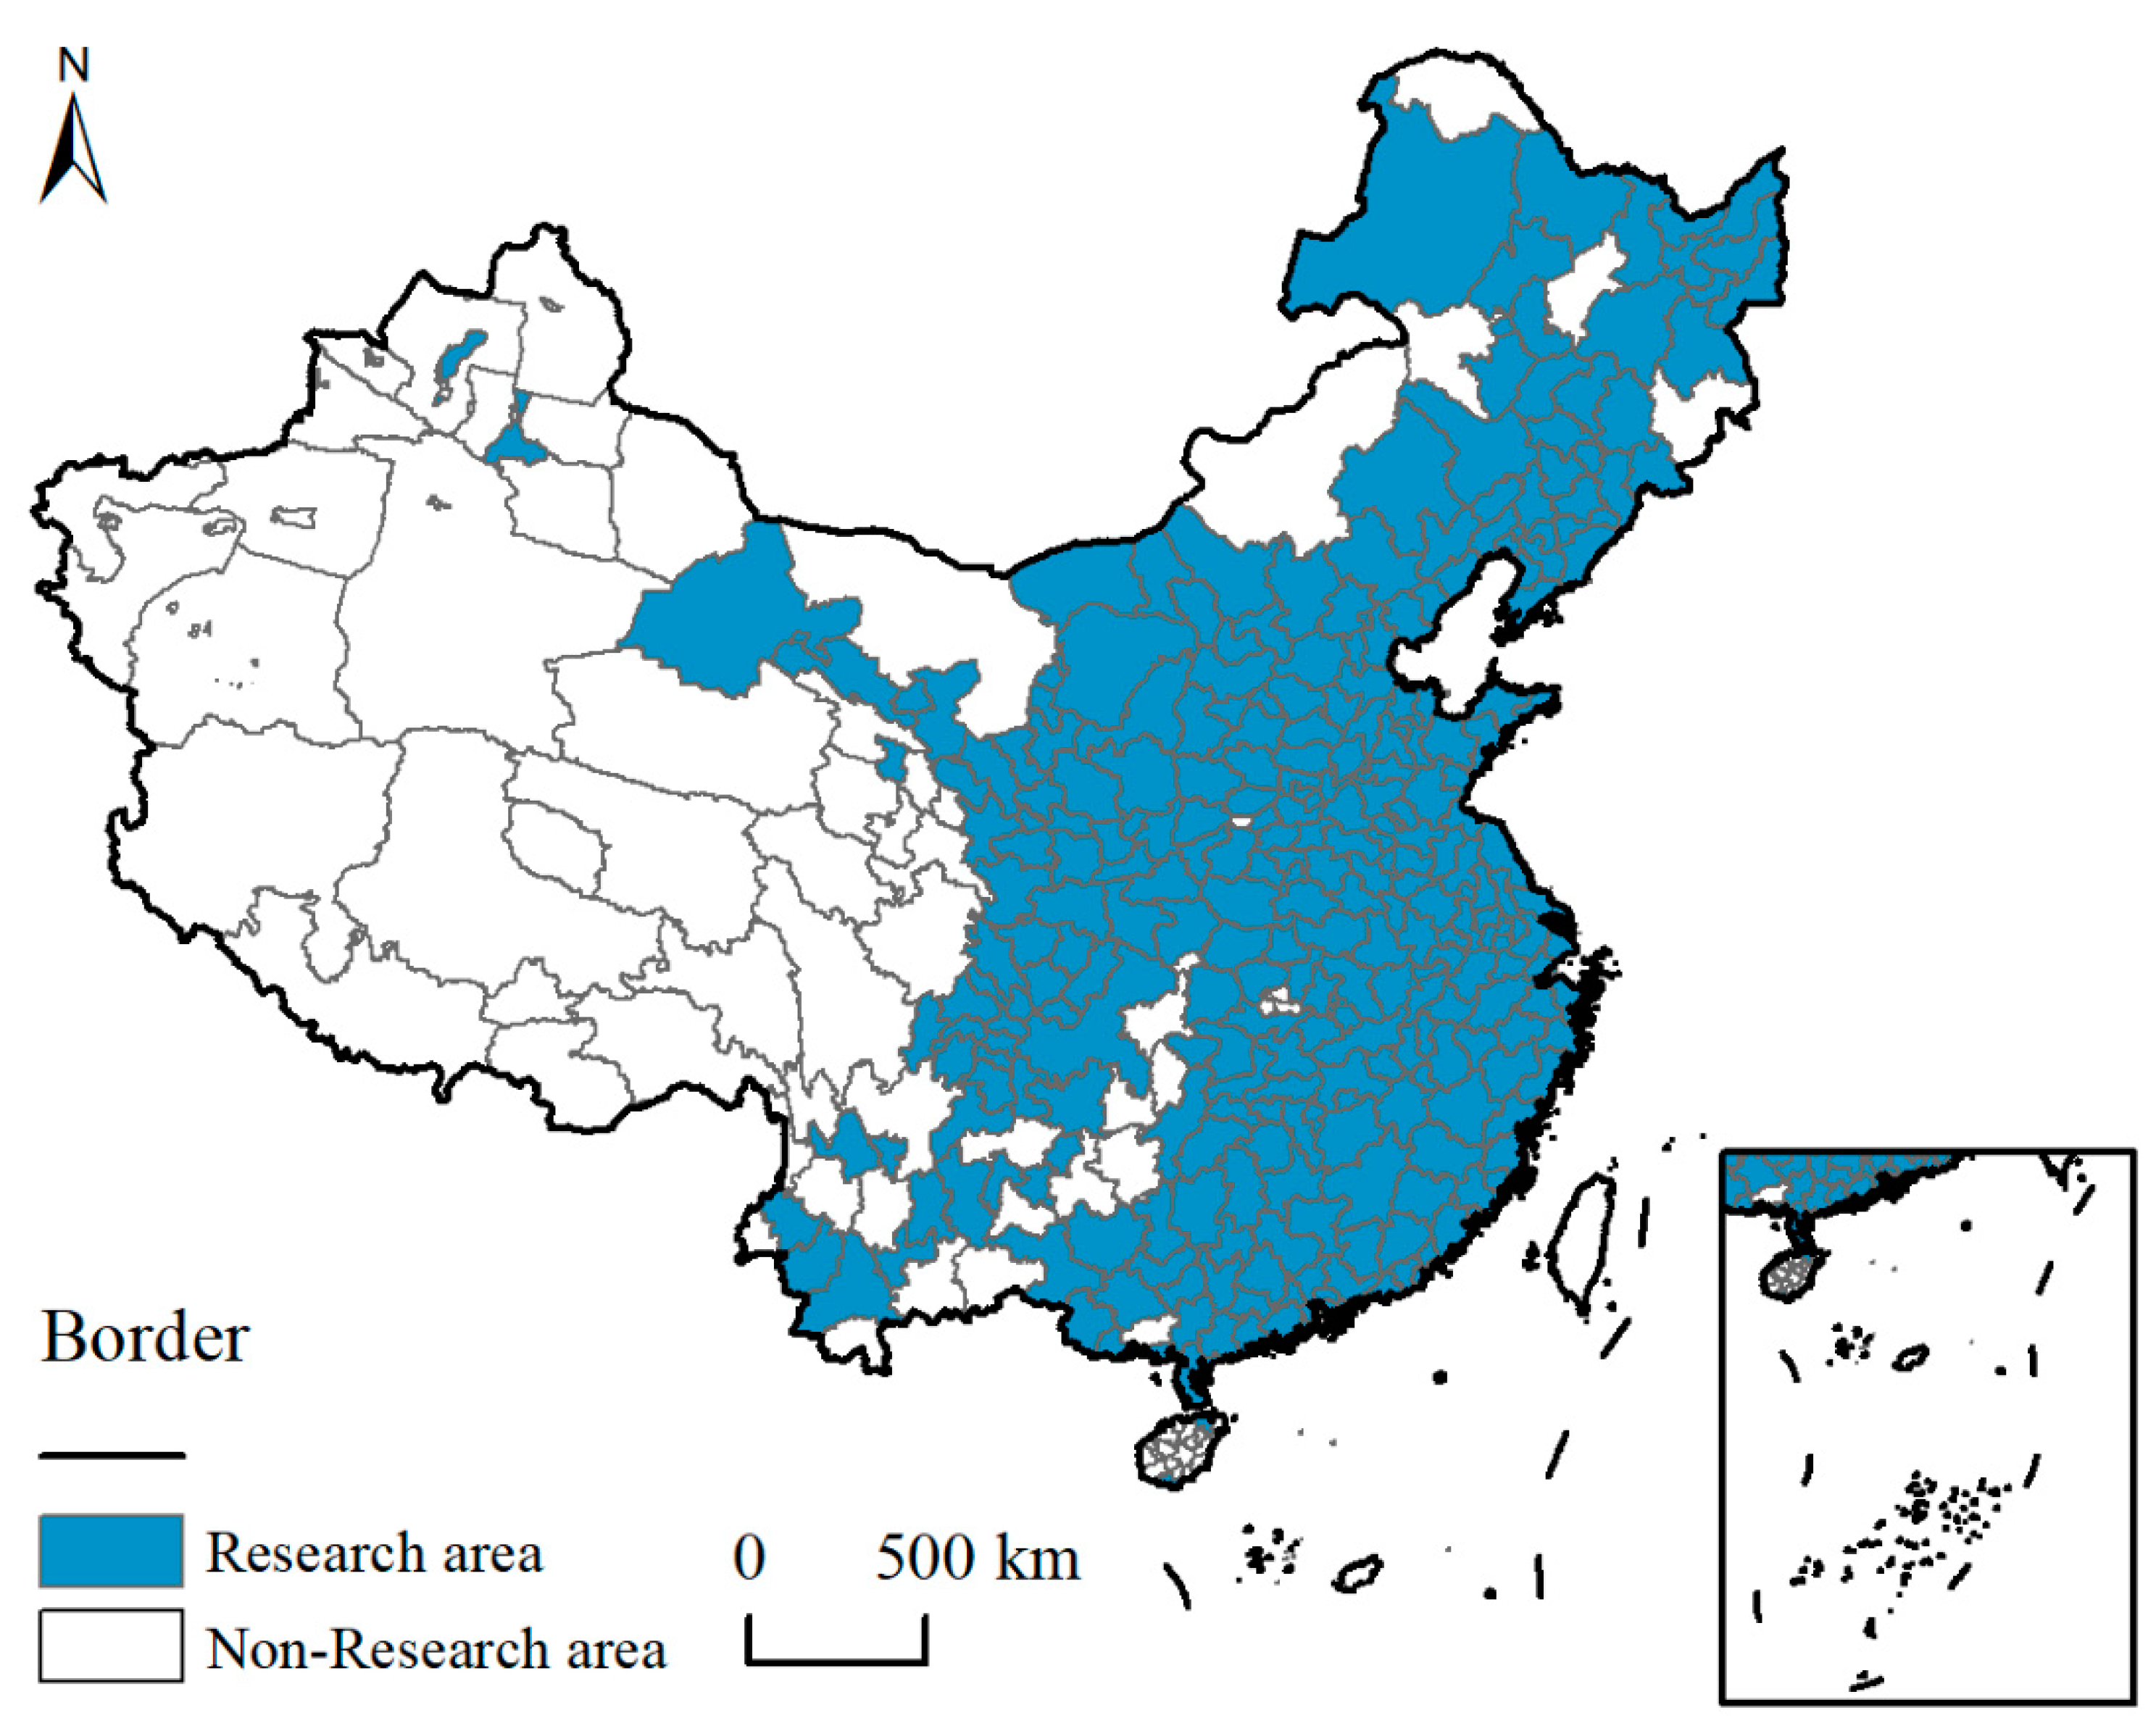
3.1. Research Area
3.2. Description of the GLUEUL Measure and Data Sources
3.3. Research Methodology
3.3.1. Super-Efficient SBM Models Incorporating Unexpected Outputs
3.3.2. Exploratory Spatial-Temporal Data Analysis (ESTDA)
3.3.3. Geographically and Temporally Weighted Regression (GTWR)
4. The Spatial-Temporal Evolutionary Characteristics of GLUEUL
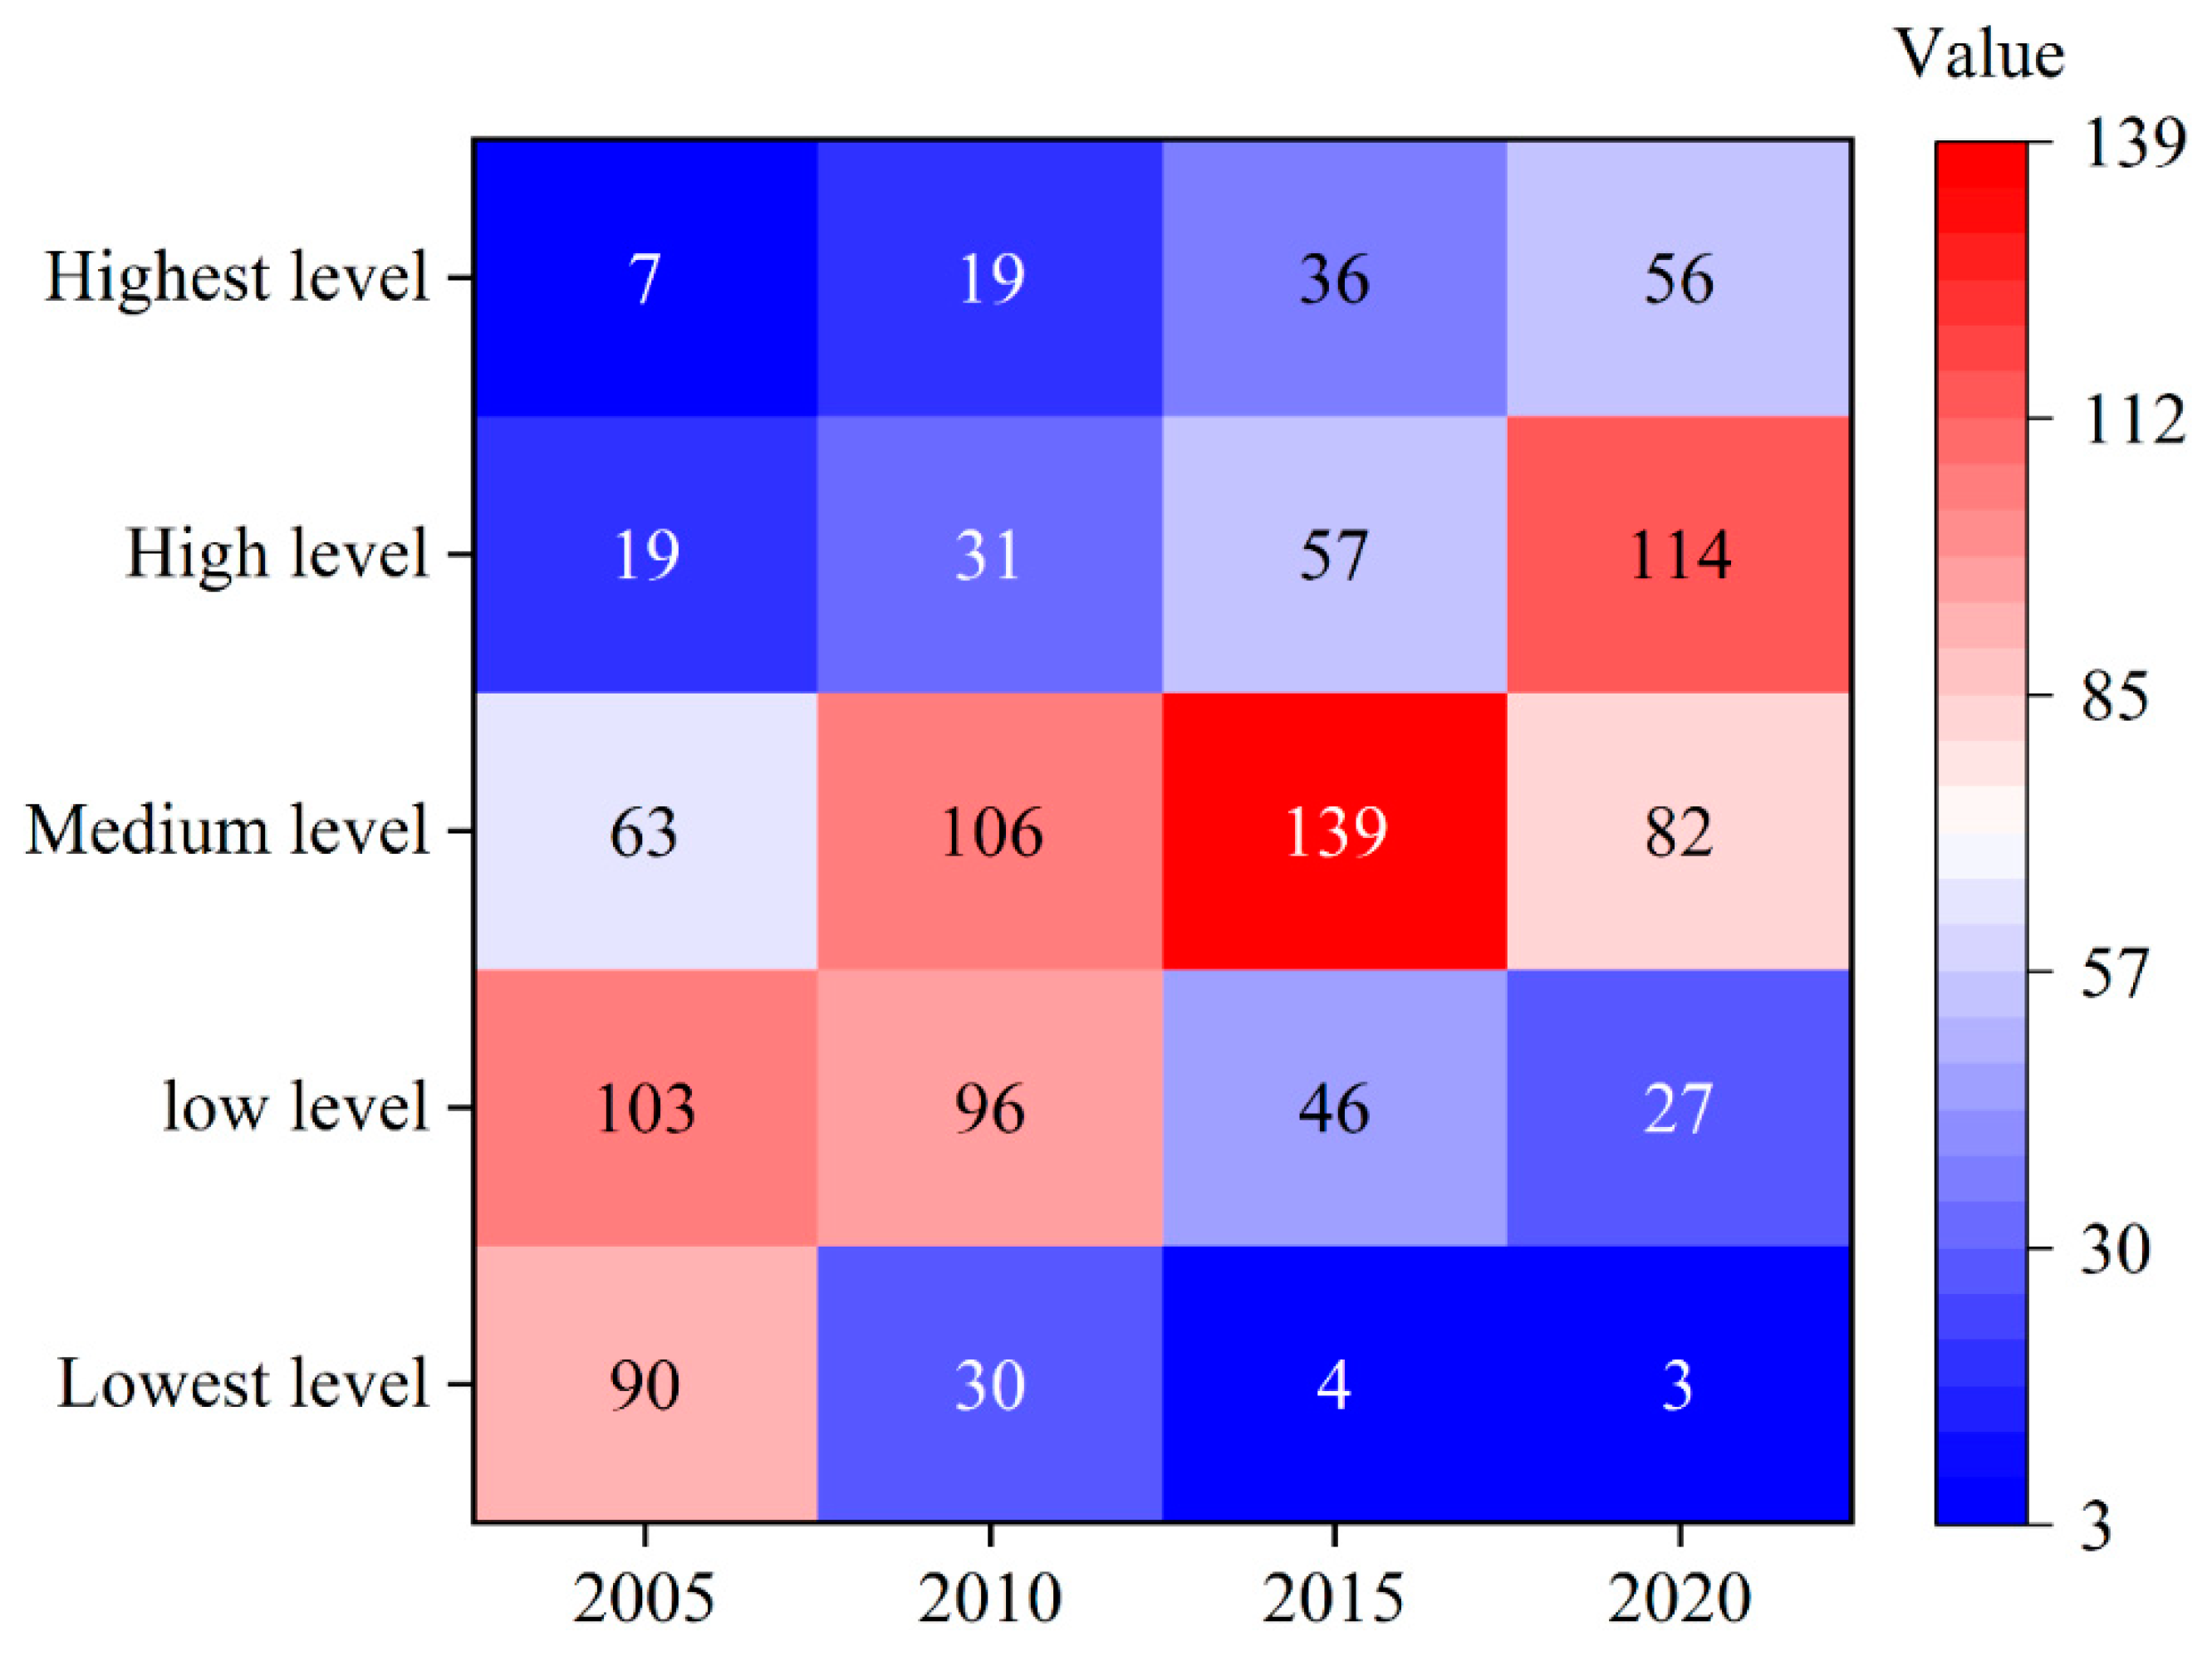
4.1. Analysis of Temporal Evolutionary Characteristics
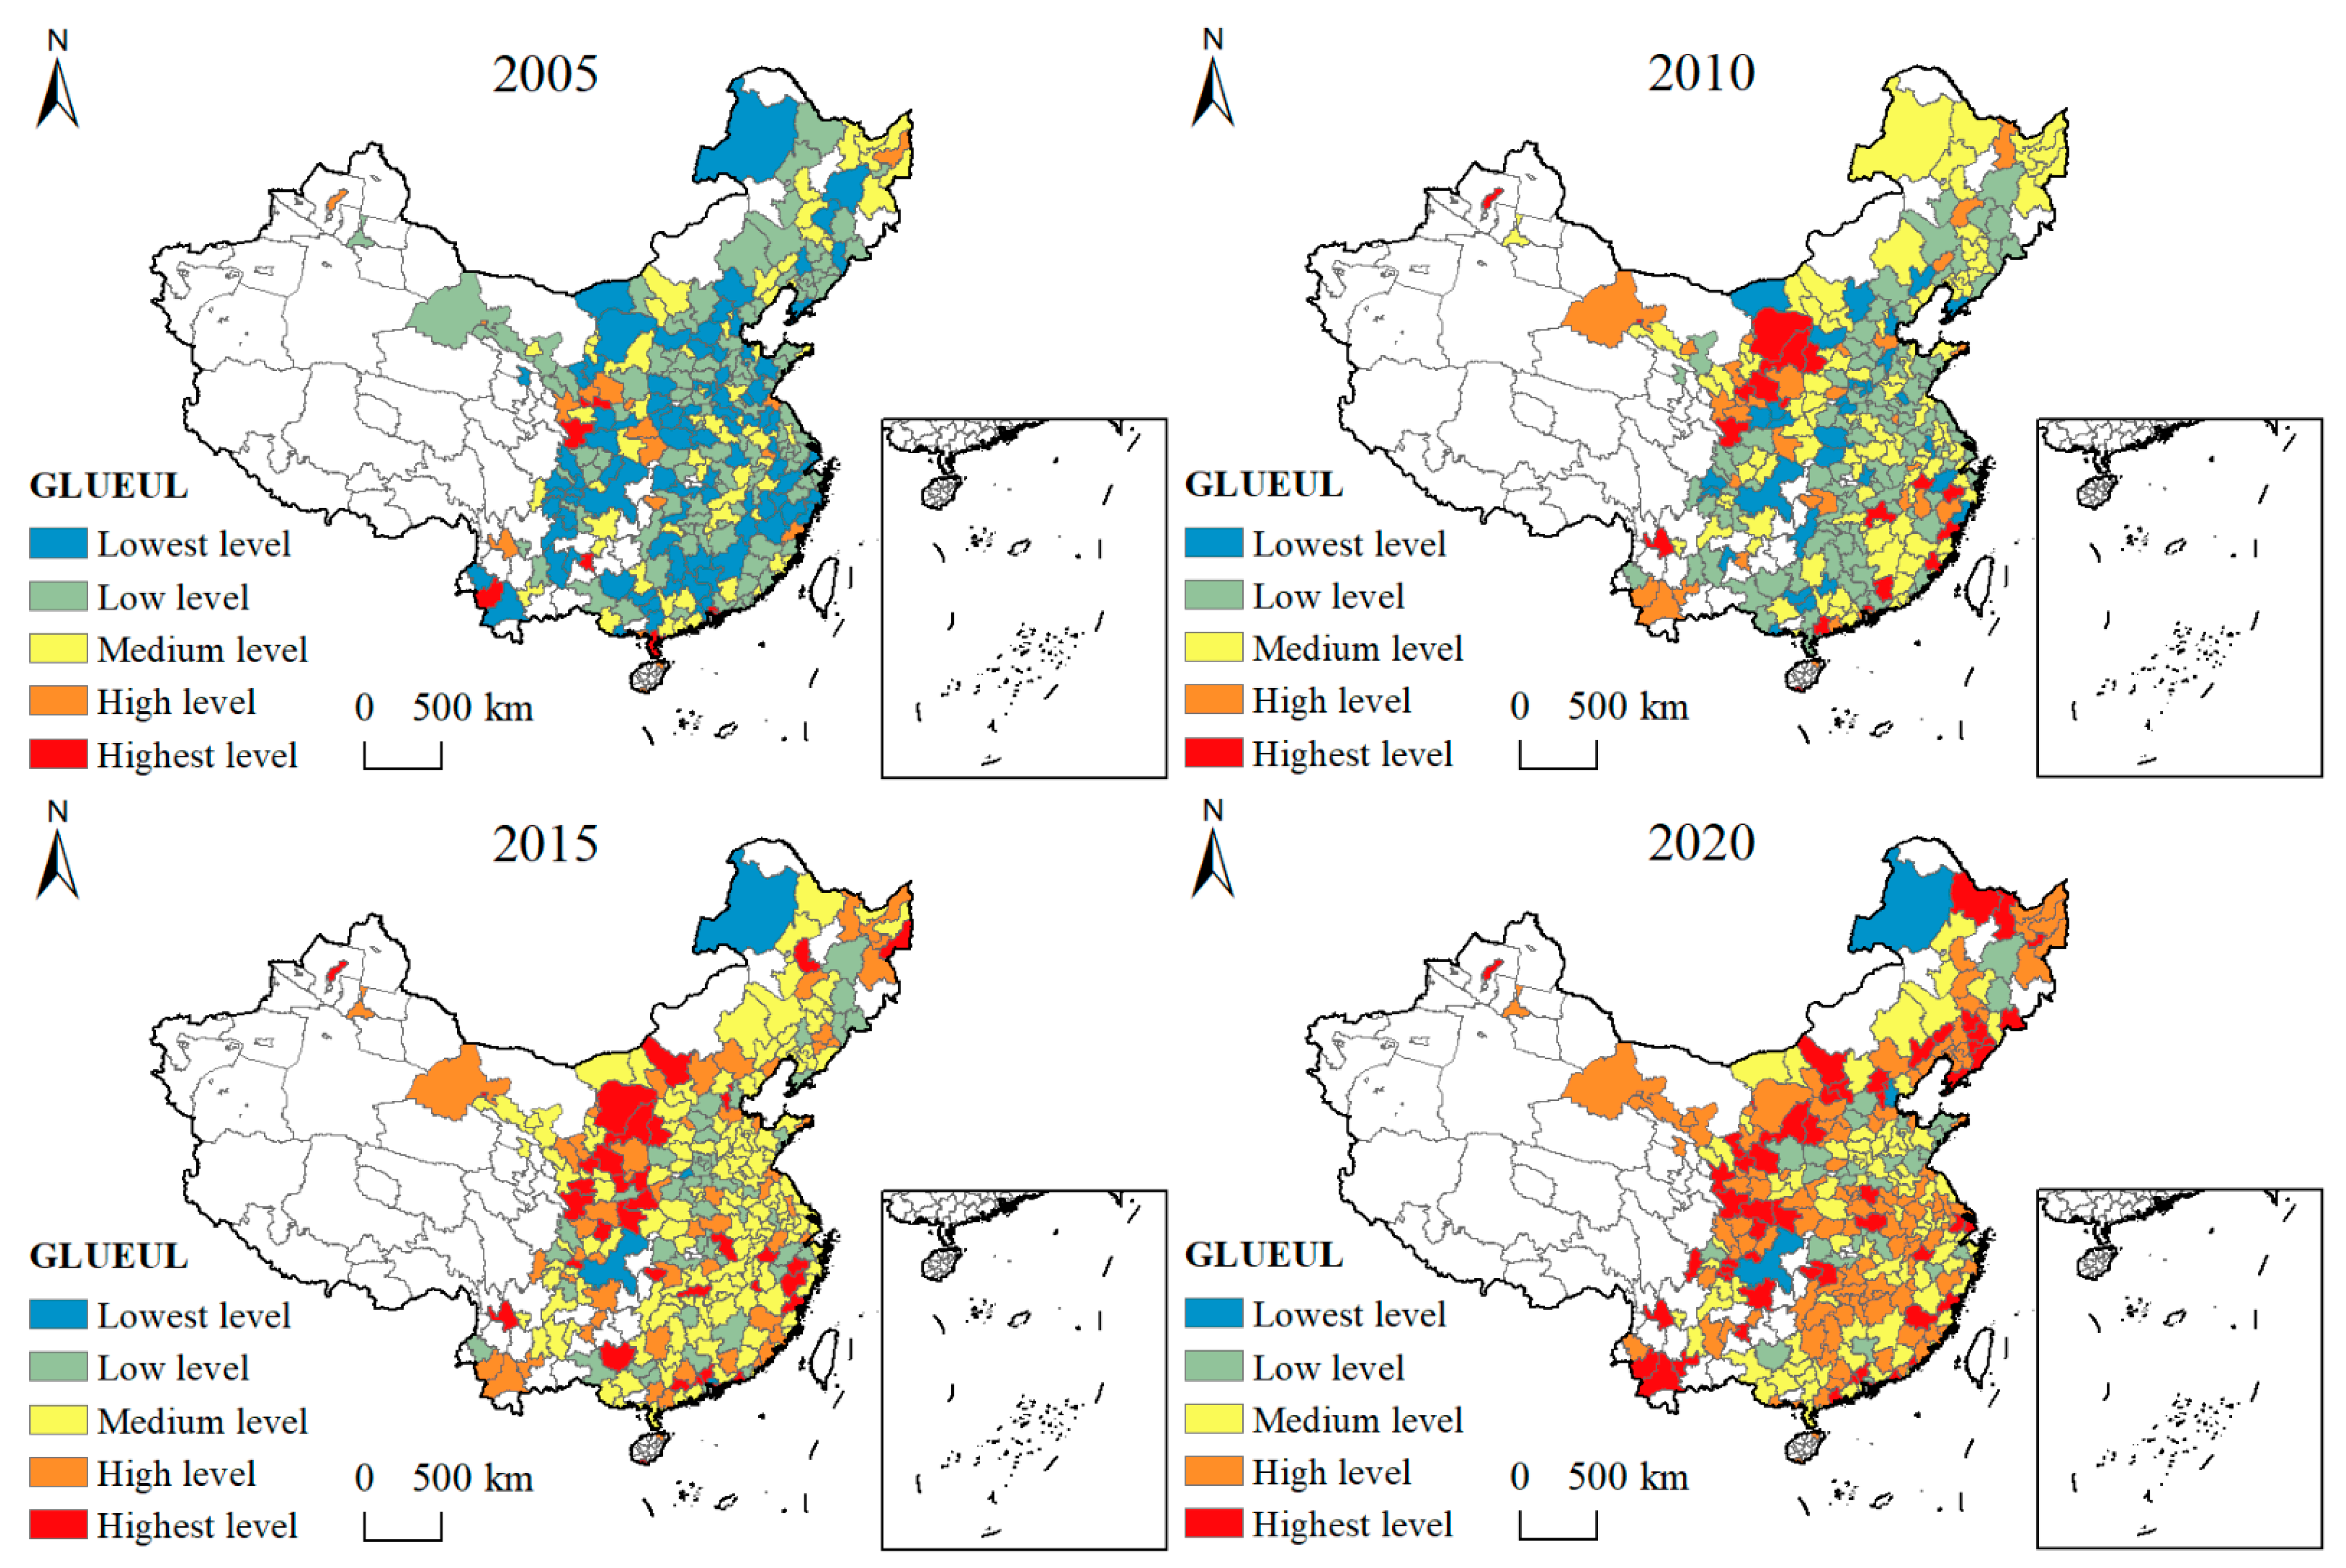
4.2. Analysis of Spatial Evolutionary Characteristics
4.3. Analysis of Spatial-Temporal Transition and Influencing Factors of GLUEUL
4.3.1. Spatial Autocorrelation Features
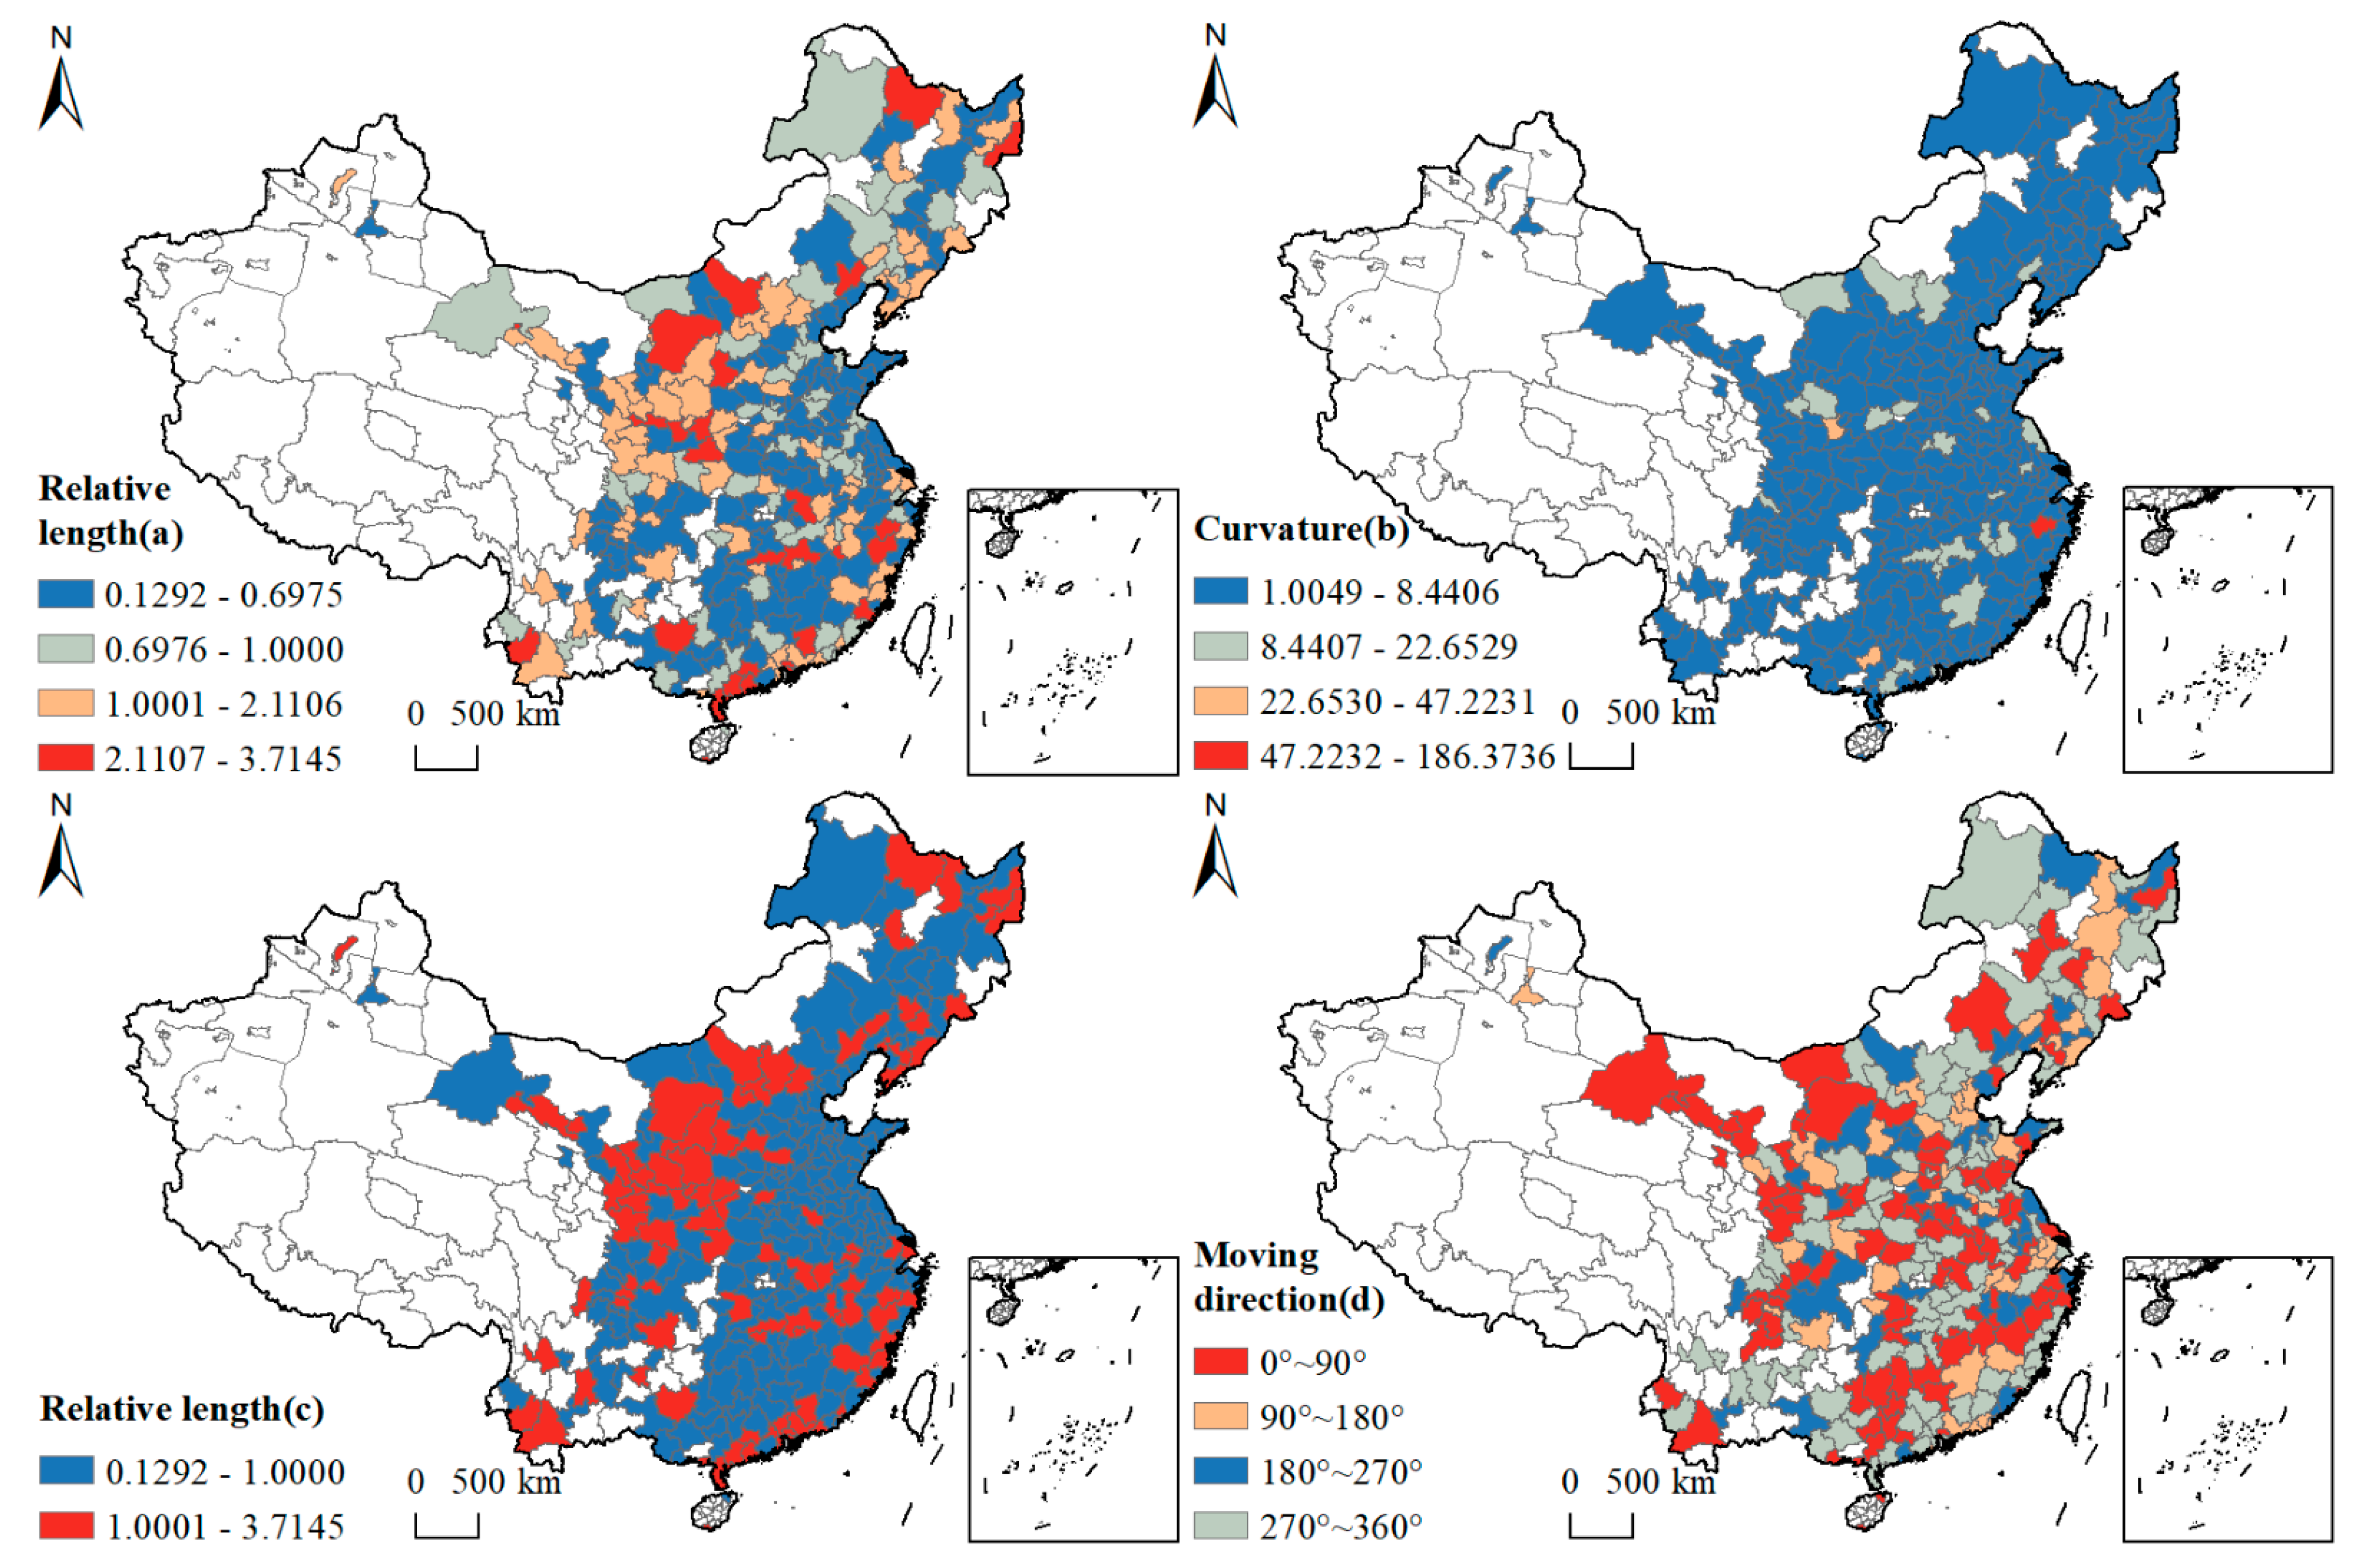
4.3.2. Spatial Characteristics of the LISA Time Path
4.3.3. Spatial Characteristics of the LISA Spatial-Temporal Transition
4.4. Analysis of Factors Influencing GLUEUL
4.4.1. Data Testing
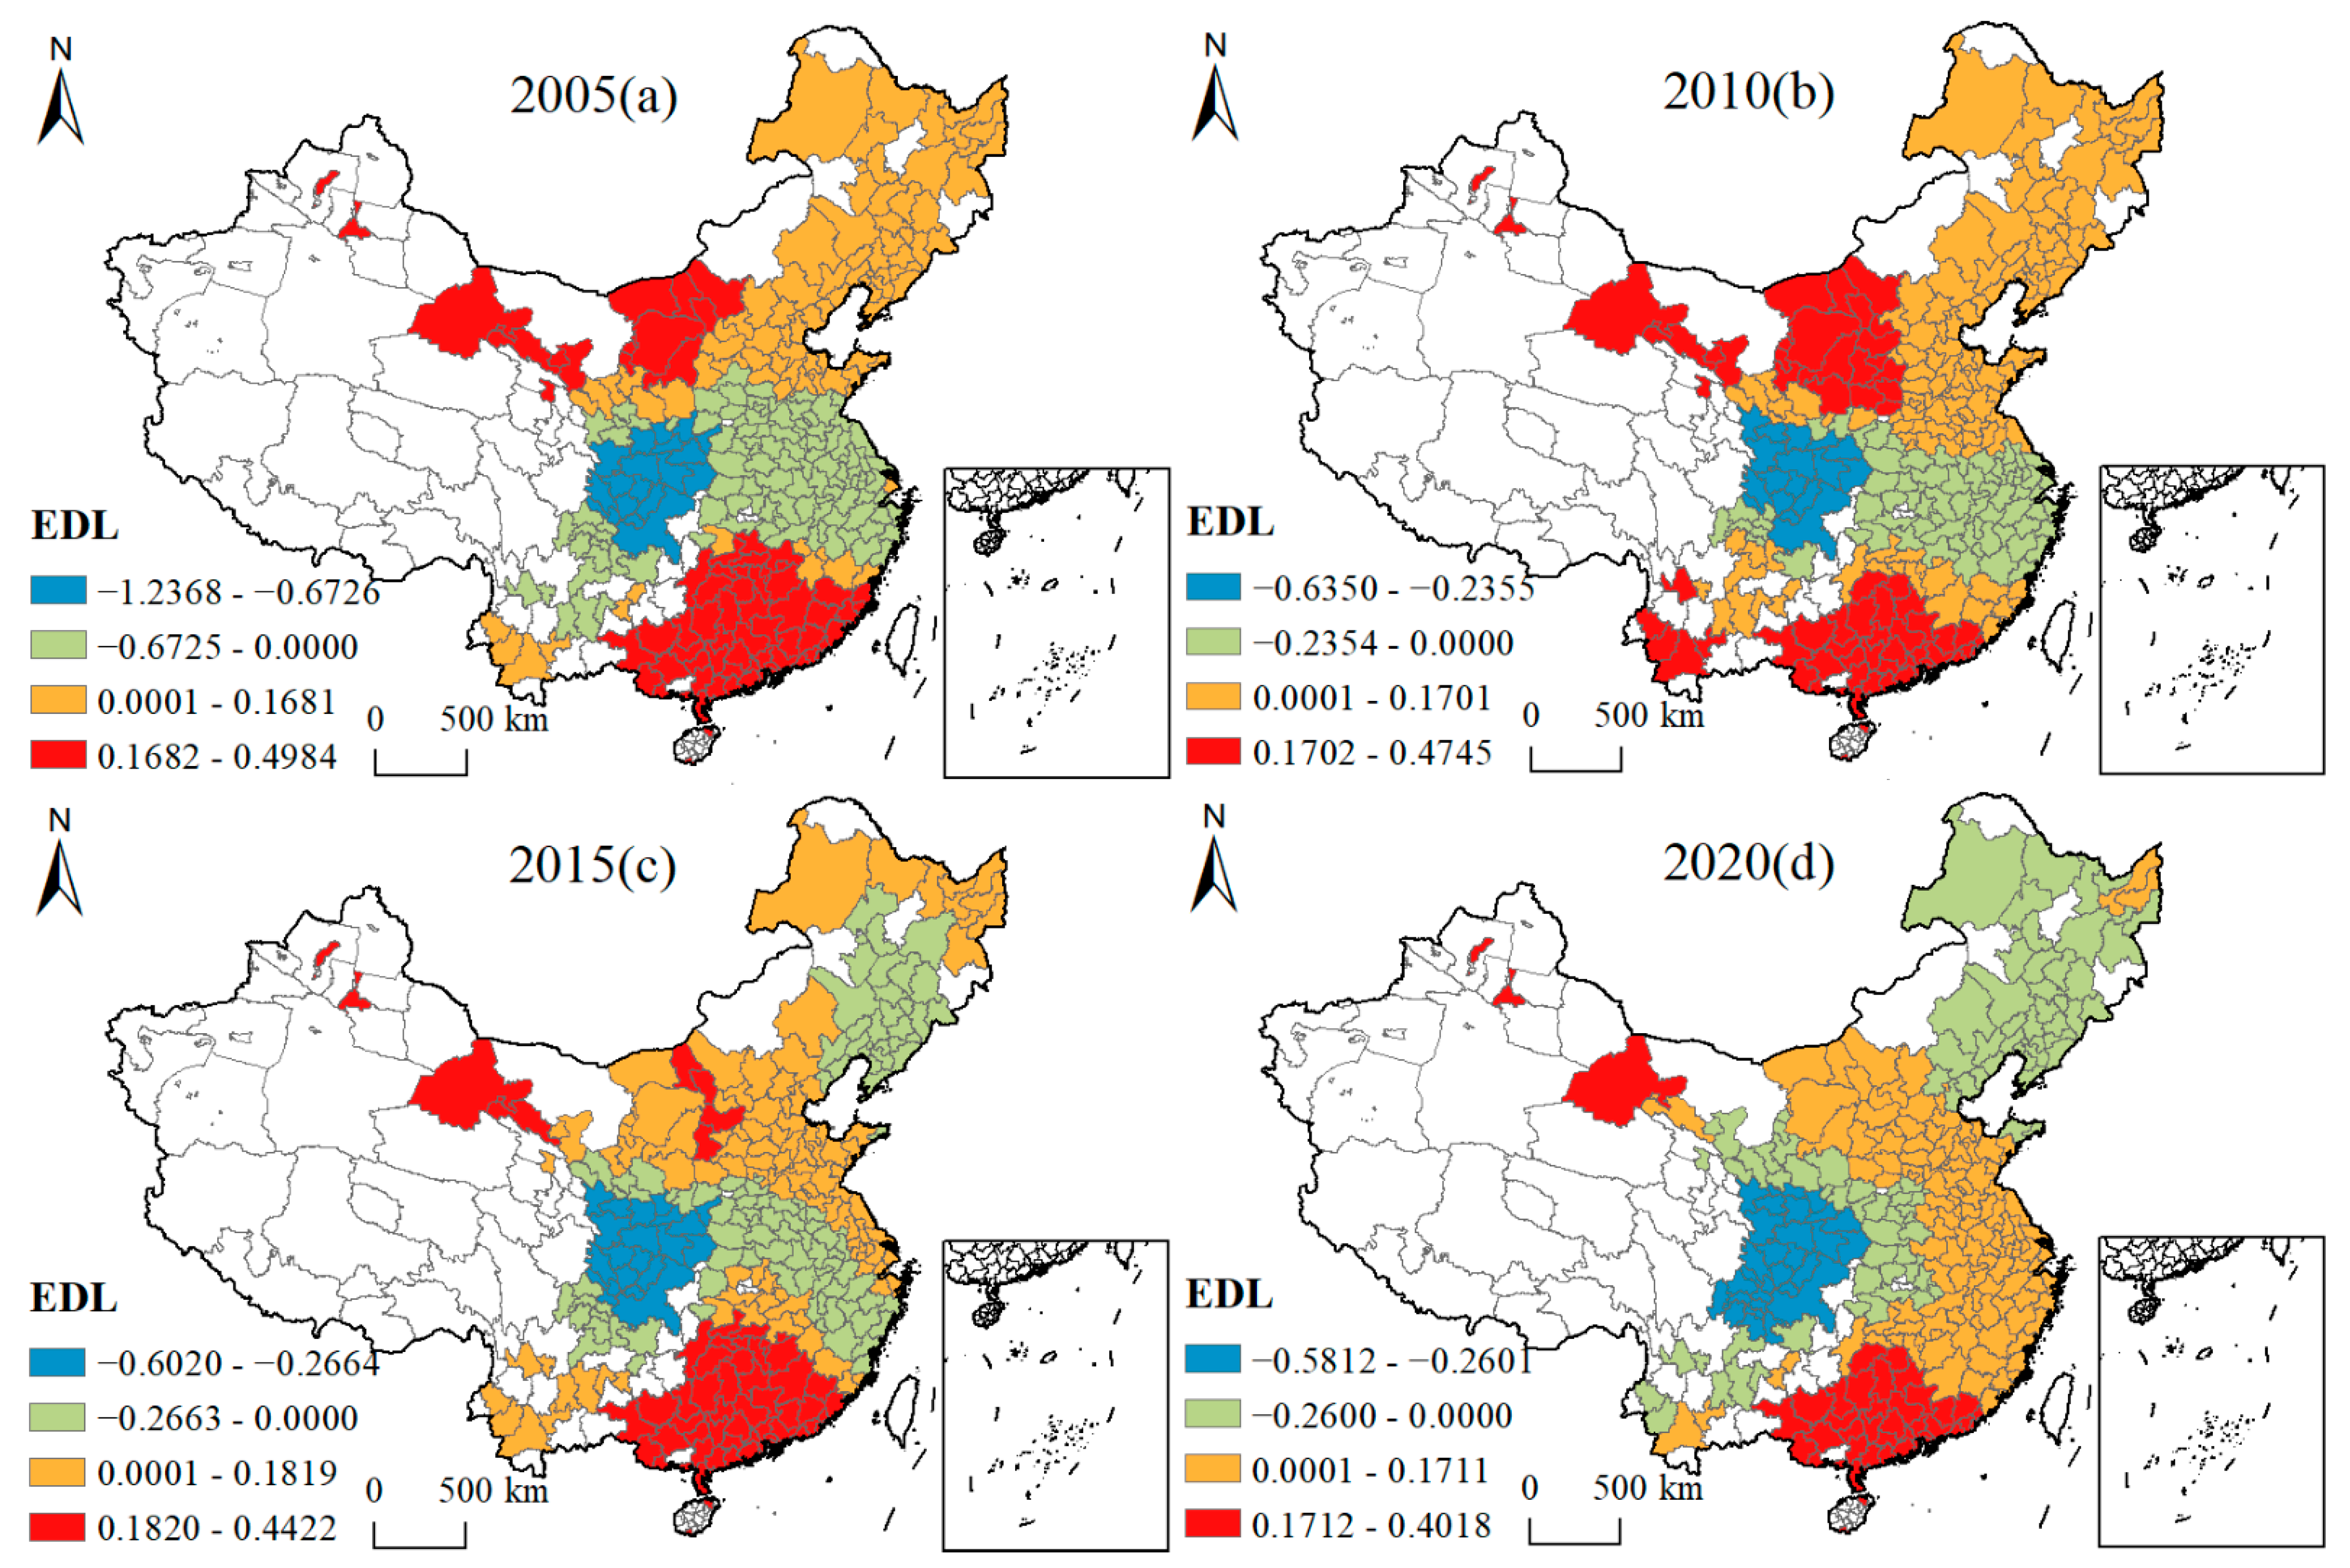
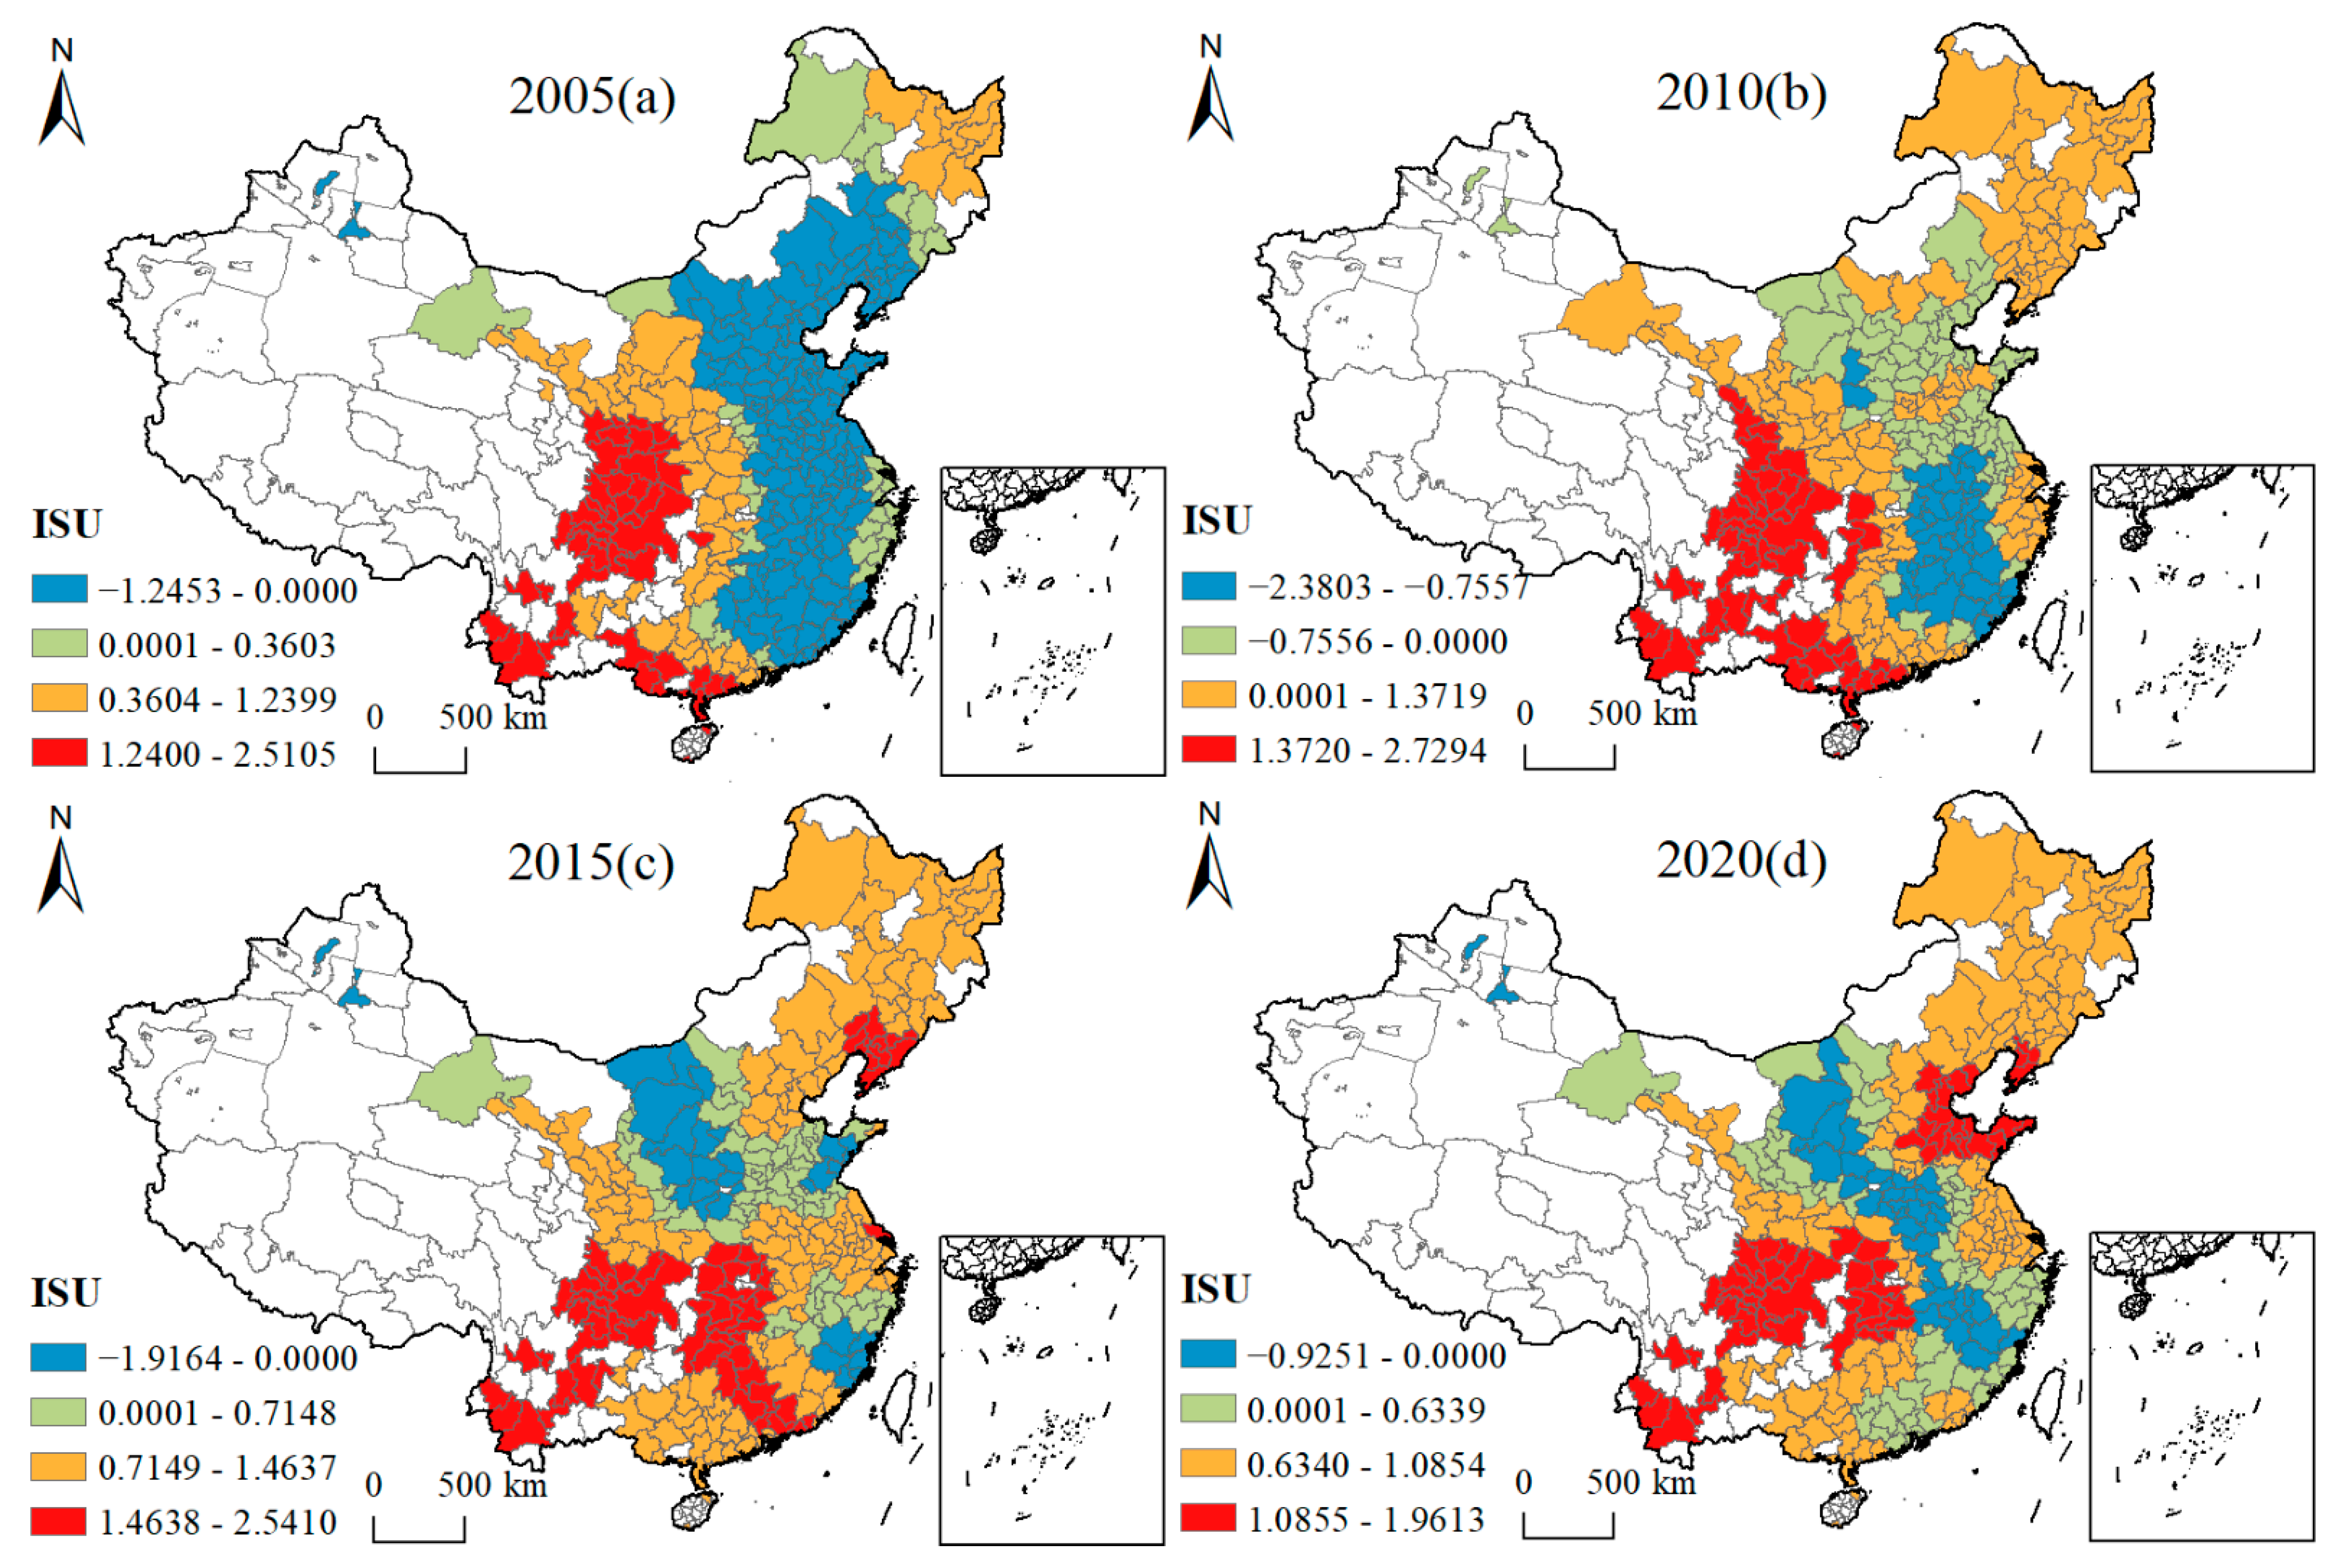
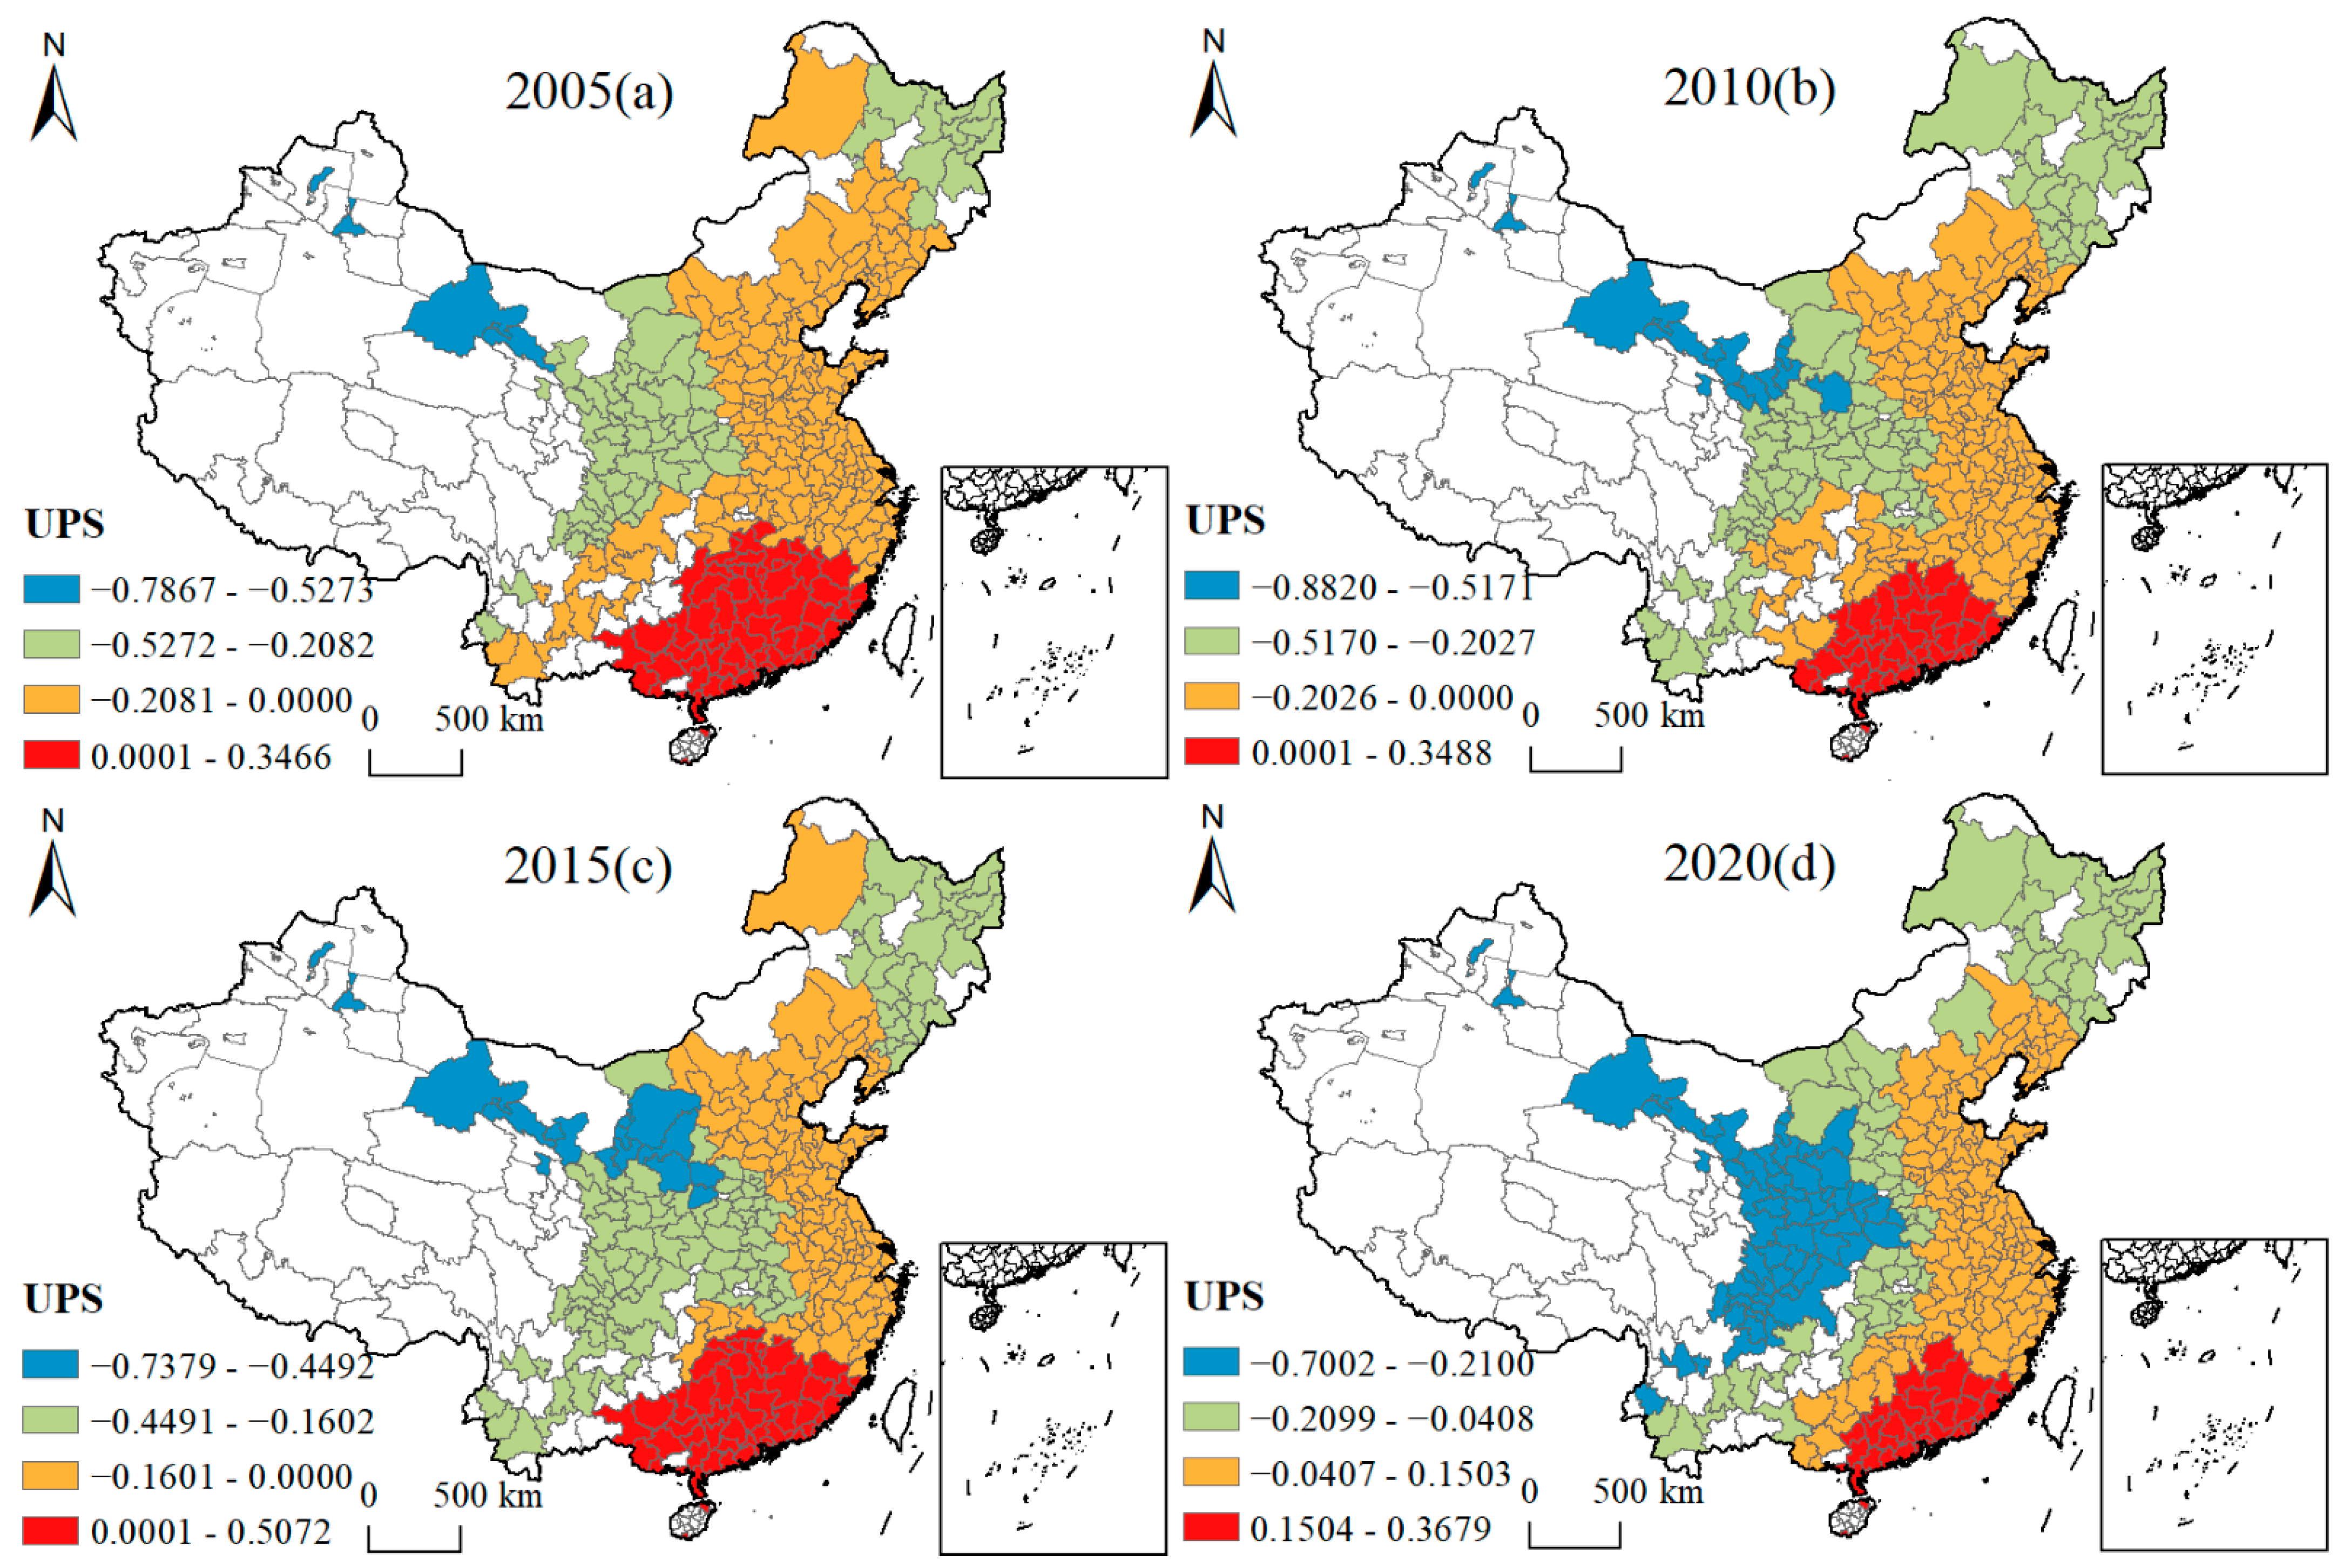
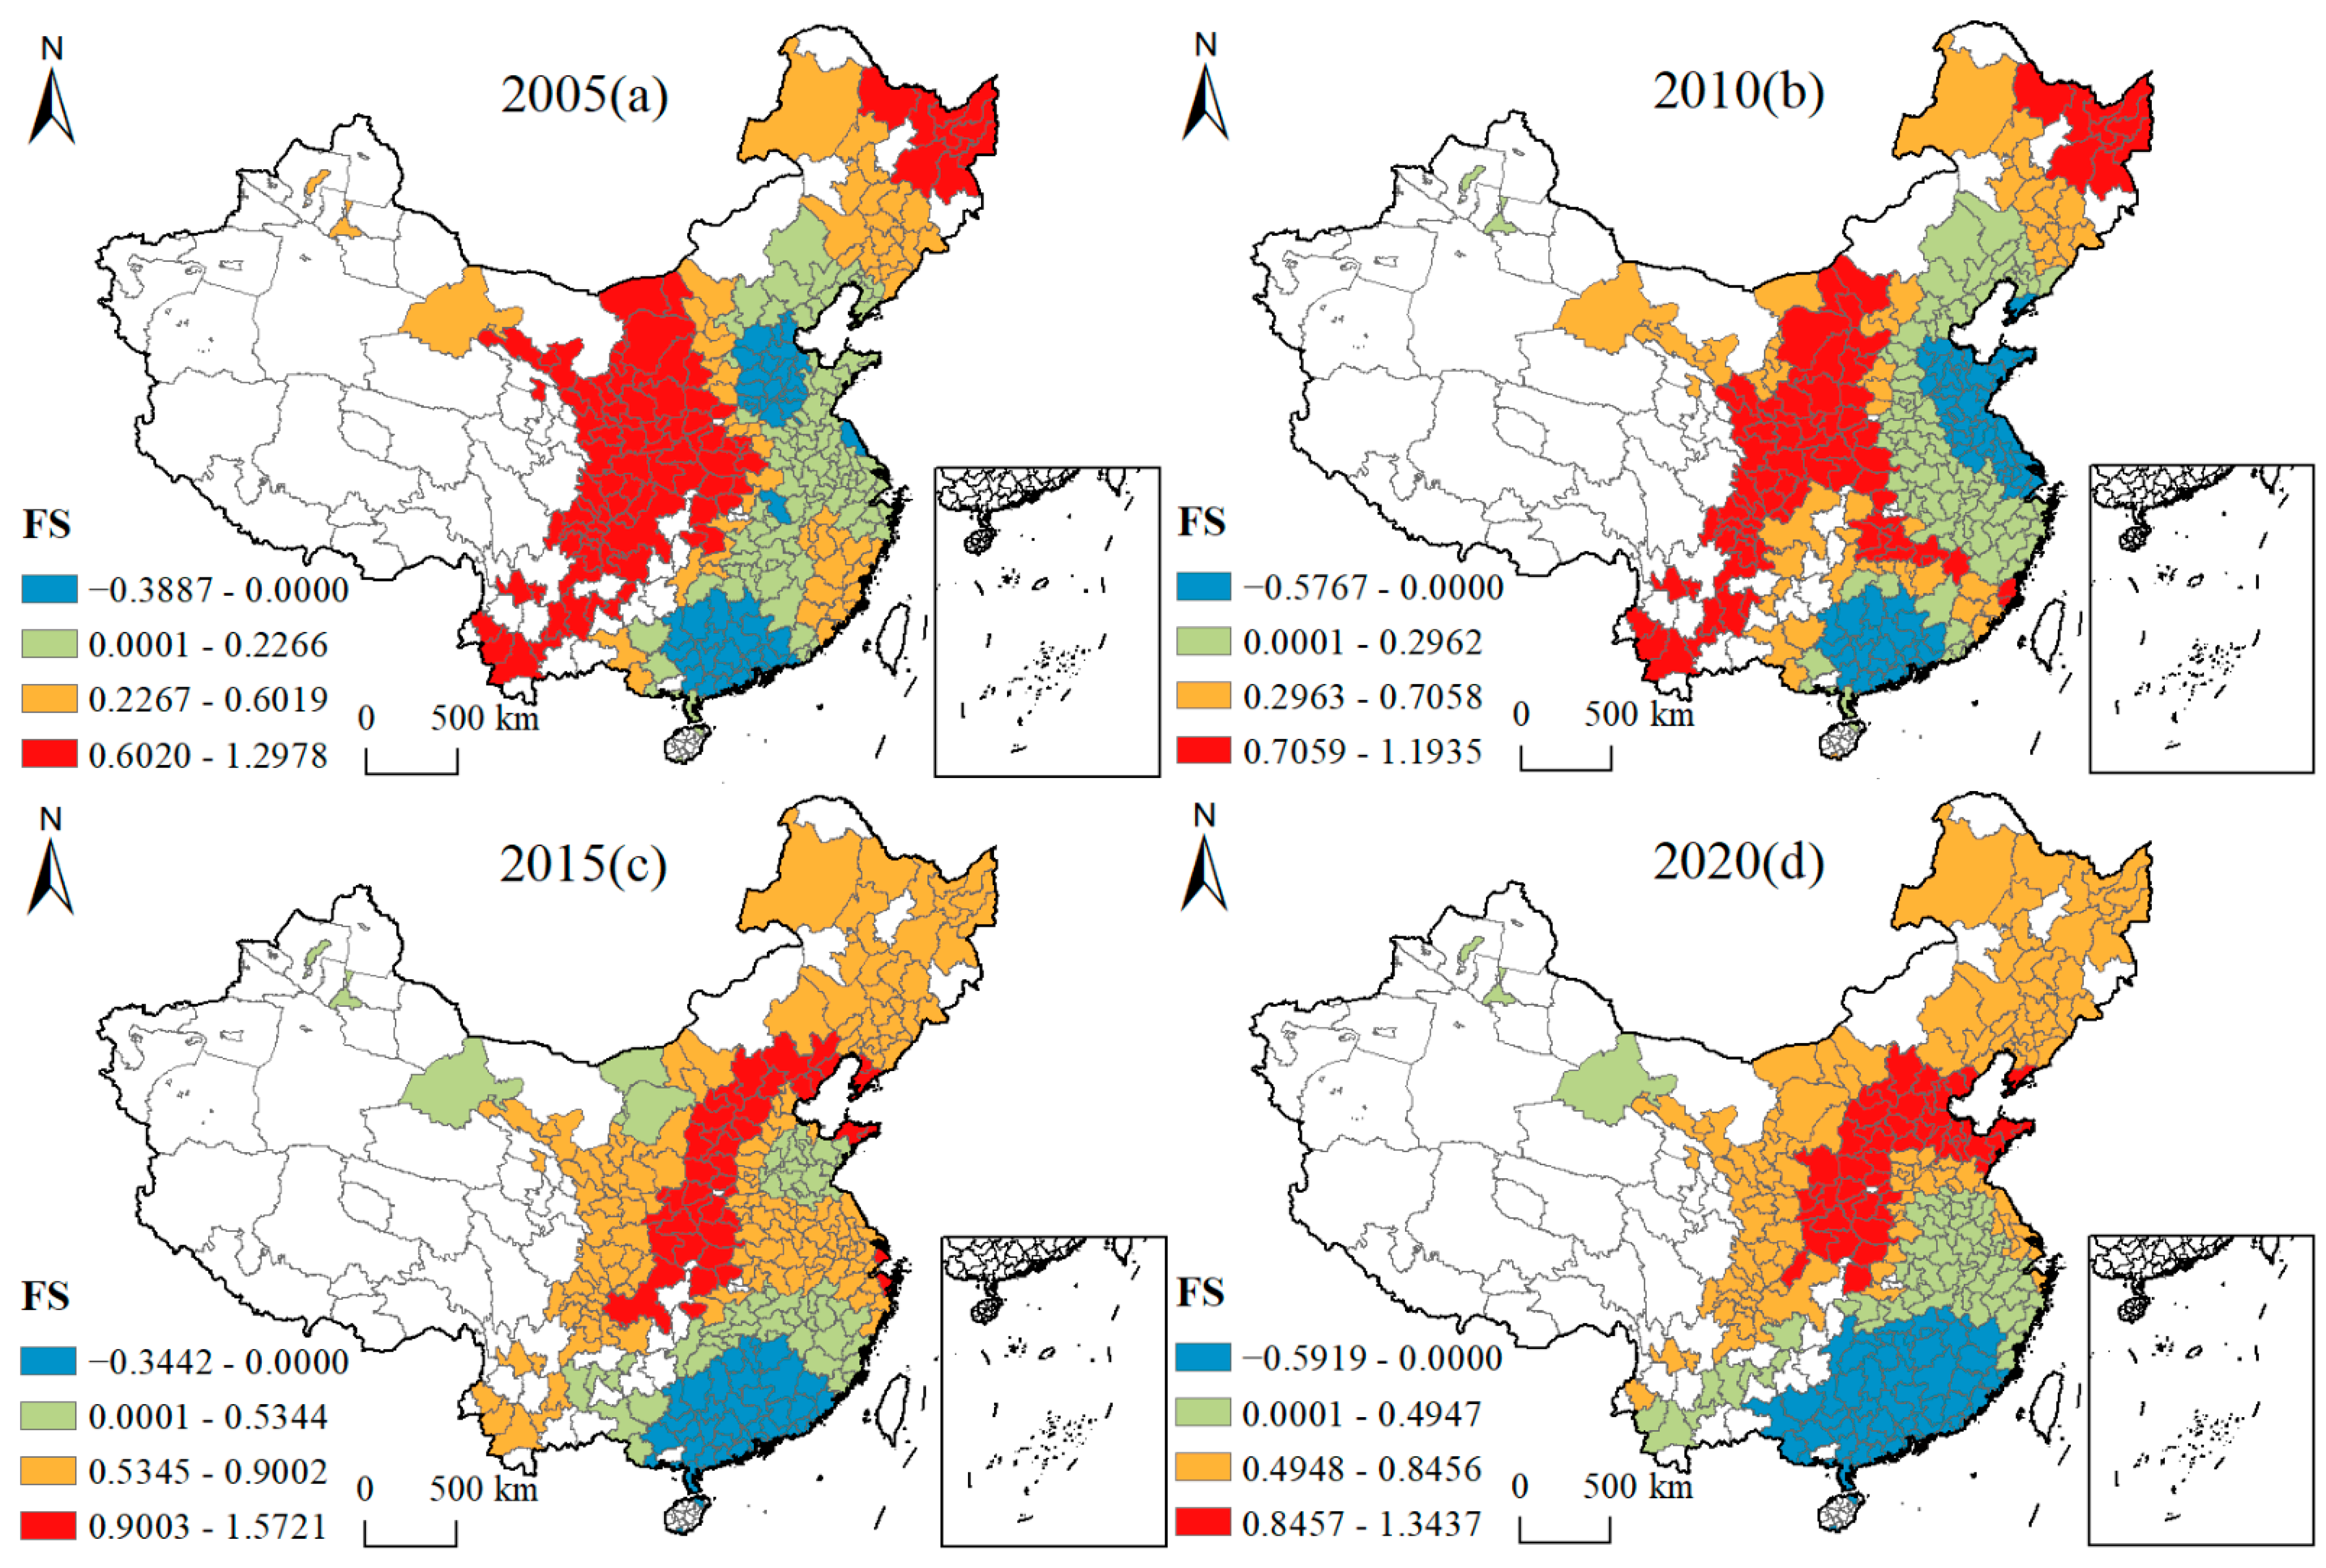
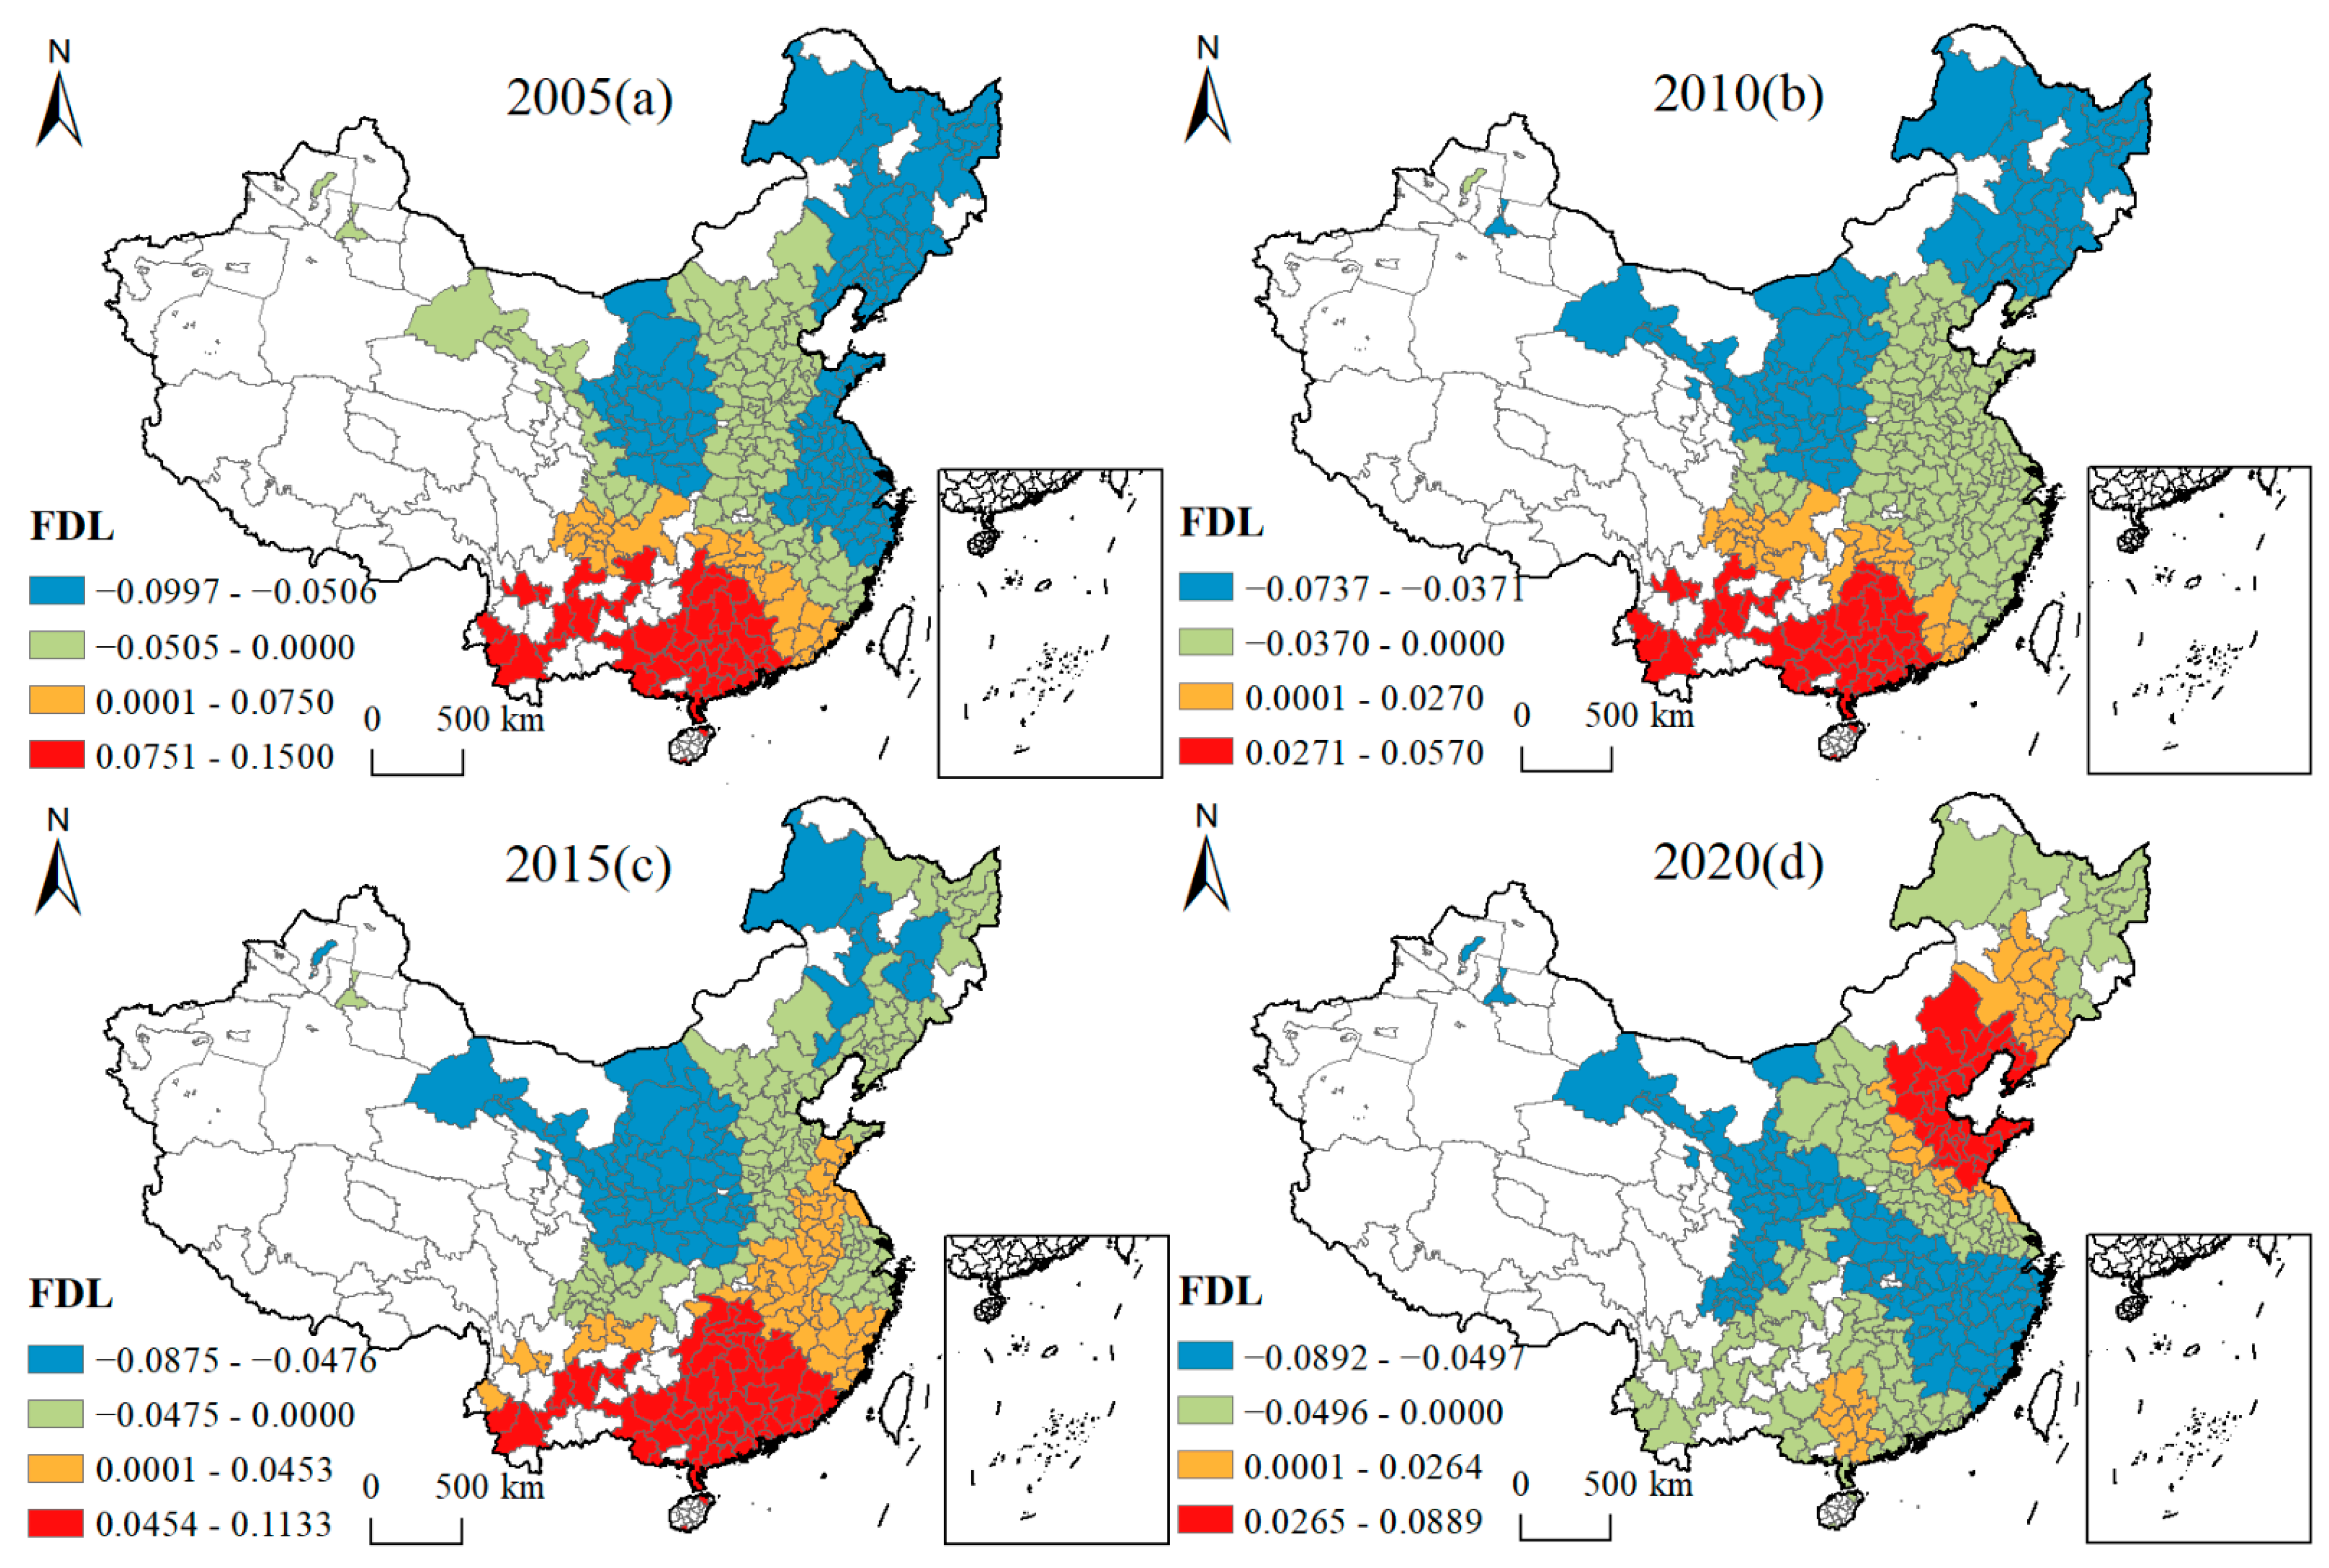
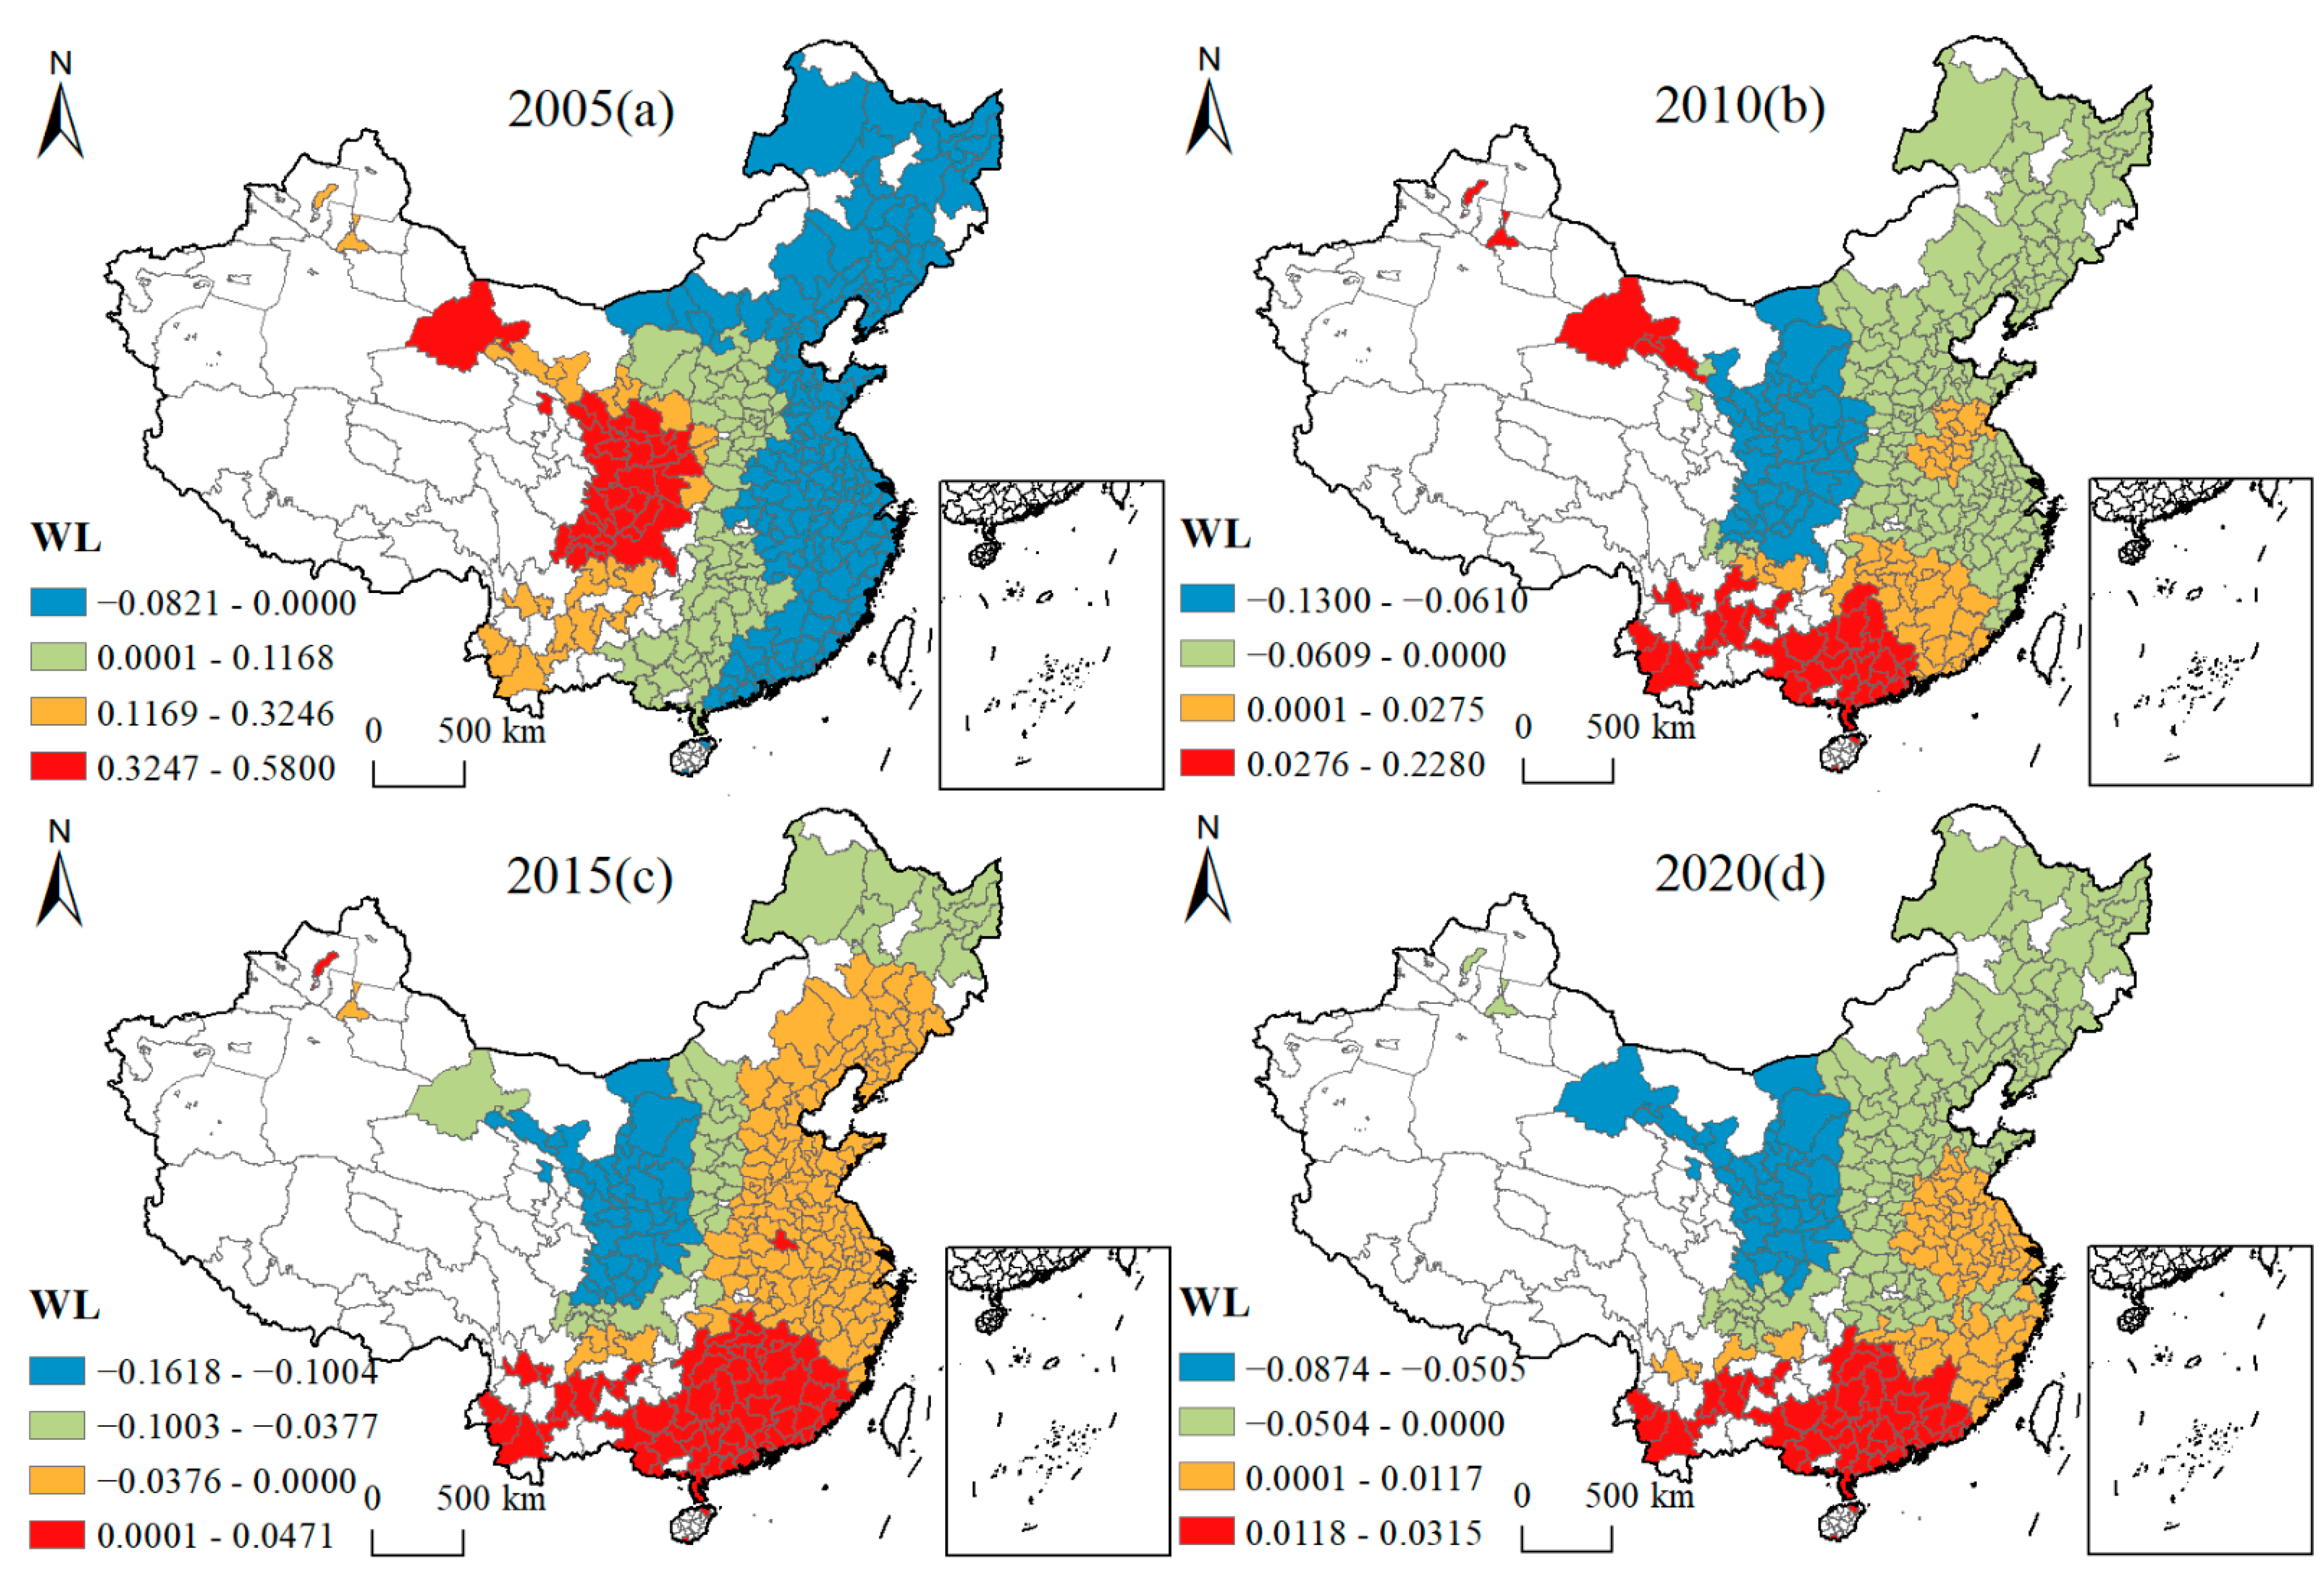
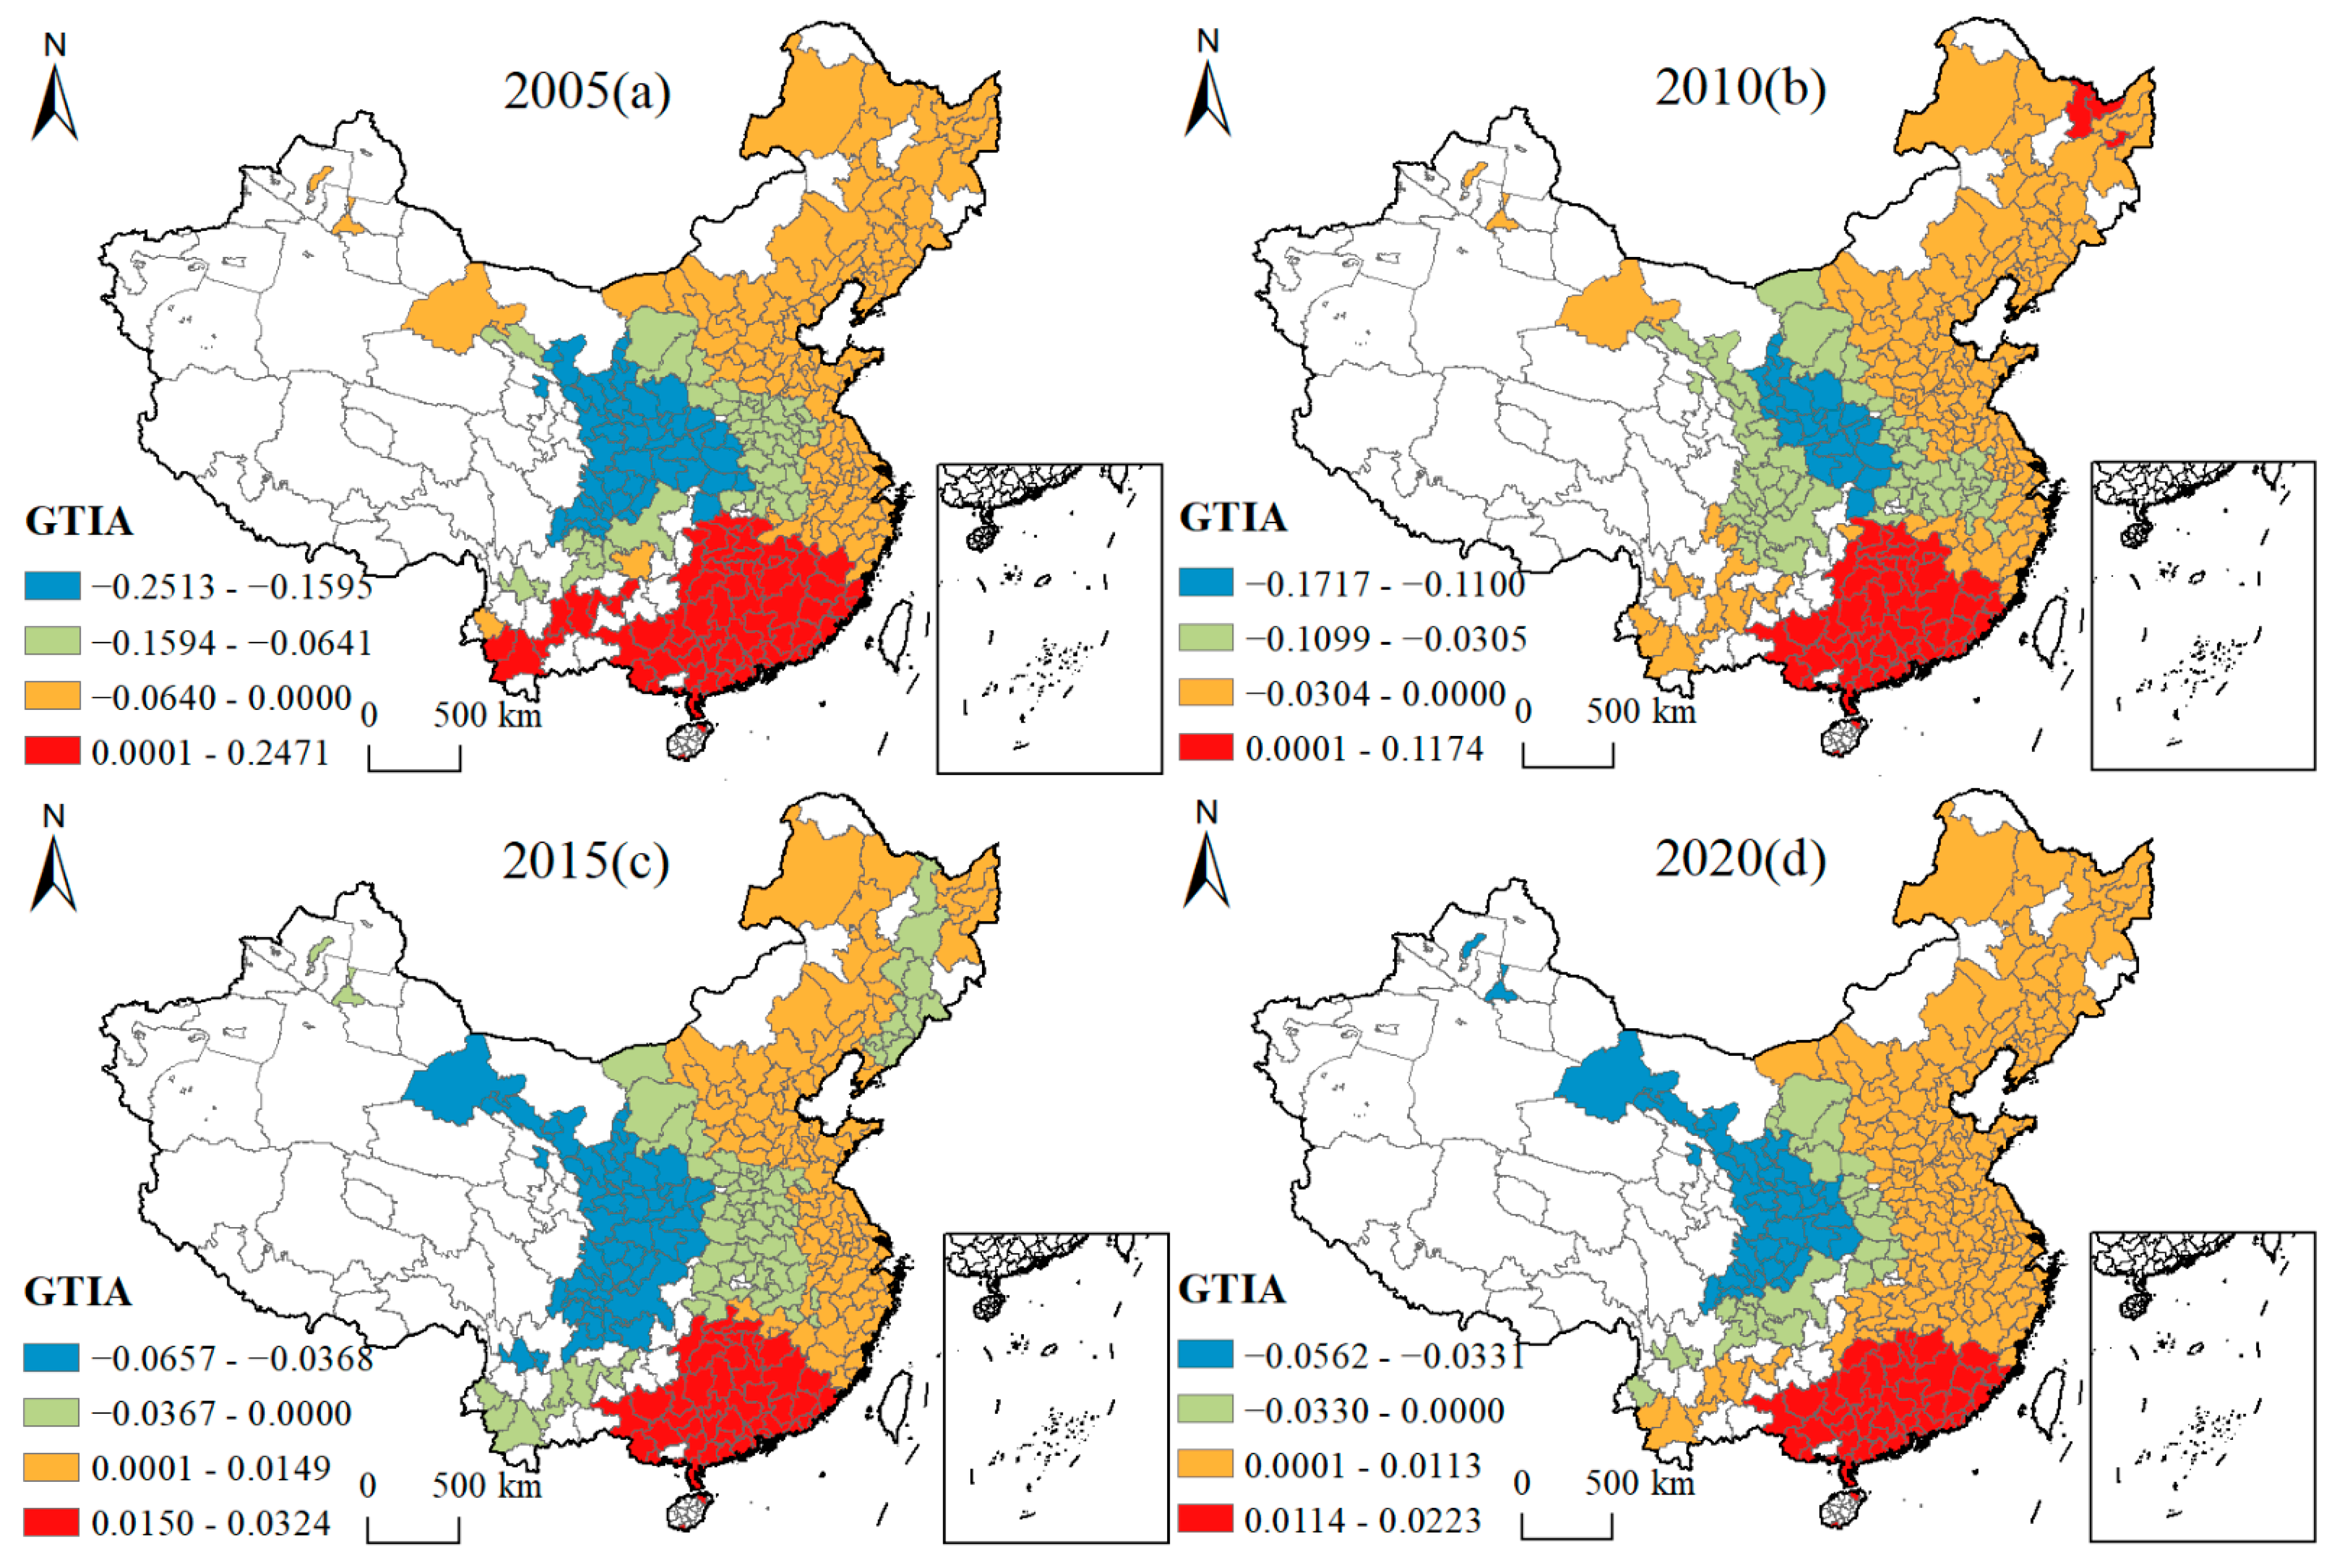
4.4.2. Spatial and Temporal Variation Characteristics of Influencing Factors
5. Conclusions
5.1. Main Conclusions
5.2. Recommendations
Author Contributions
Funding
Institutional Review Board Statement
Informed Consent Statement
Data Availability Statement
Acknowledgments
Conflicts of Interest
References
- Tan, S.K.; Hu, B.X.; Kuang, B.; Zhou, M. Regional differences and dynamic evolution of urban land green use efficiency within the Yangtze River Delta, China. Land Use Policy 2021, 106, 105449. [Google Scholar] [CrossRef]
- Chen, H.; Meng, C.Y.; Cao, Q. Measurement and Influencing Factors of Low Carbon Urban Land Use Efficiency-Based on Non-Radial Directional Distance Function. Land 2022, 11, 1052. [Google Scholar] [CrossRef]
- Ribeiro, H.V.; Rybski, D.; Kropp, J.P. Effects of changing population or density on urban carbon dioxide emissions. Nat. Commun. 2019, 10, 1–9. [Google Scholar] [CrossRef] [PubMed] [Green Version]
- Griffin, P.W.; Hammond, G.P.; Norman, J.B. Industrial energy use and carbon emissions reduction: A UK perspective. Wiley Interdiscip. Rev. Energy Environ. 2016, 5, 684–714. [Google Scholar] [CrossRef] [Green Version]
- Cen, X.; Wu, C.; Xing, X.; Fang, M.; Grarang, Z.M.; Wu, Y. Coupling intensive land use and landscape ecological security for urban sustainability: An integrated socioeconomic data and spatial metrics analysis in Hangzhou city. Sustainability 2015, 7, 1459–1482. [Google Scholar] [CrossRef] [Green Version]
- Dar, J.A.; Asif, M. Does financial development improve environmental quality in Turkey? An application of endogenous structural breaks based cointegration approach. Manag. Environ. Qual. Int. J. 2018, 29, 368–384. [Google Scholar] [CrossRef]
- Umar, T. Frameworks for reducing greenhouse gas (GHG) emissions from municipal solid waste in Oman. Manag. Environ. Qual. Int. J. 2020, 31, 945–960. [Google Scholar] [CrossRef]
- Ou, Y.; Xu, J.; Li, J.; Wei, X.; Li, Y. Land space optimization of urban-agriculture-ecological functions in the Changsha-Zhuzhou-Xiangtan Urban Agglomeration, China. Land Use Policy 2022, 117, 106112. [Google Scholar]
- Li, W.; Elheddad, M.; Doytch, N. The impact of innovation on environmental quality: Evidence for the non-linear relationship of patents and CO2 emissions in China. J. Environ. Manag. 2021, 292, 112781. [Google Scholar] [CrossRef]
- Zhu, E.; Deng, J.; Zhou, M.; Gan, M.; Jiang, R.; Wang, K.; Shahtahmassebi, A. Carbon emissions induced by land-use and land-cover change from 1970 to to 2010 in Zhejiang, China. Sci. Total Environ. 2019, 646, 930–939. [Google Scholar] [CrossRef]
- Dou, Y.; Luo, X.; Dong, L.; Wu, C.; Liang, H.; Ren, J. An empirical study on transit-oriented low-carbon urban land use planning: Exploratory Spatial Data Analysis (ESDA) on Shanghai, China. Habitat Int. 2016, 53, 379–389. [Google Scholar] [CrossRef]
- Wang, Y.; Feng, Y.; Zuo, J.; Rameezdeen, R. From "traditional" to "low carbon" urban land use: Evaluation and obstacle analysis. Sustain. Cities Soc. 2019, 51, 101722. [Google Scholar] [CrossRef]
- Wu, H.; Fang, S.; Zhang, C.; Hu, S.; Nan, D.; Yang, Y. Exploring the impact of urban form on urban land use efficiency under low-carbon emission constraints: A case study in China’s Yellow River Basin. J. Environ. Manag. 2022, 311, 114866. [Google Scholar] [CrossRef] [PubMed]
- Liang, L.; Yong, Y.; Yuan, C. Measurement of urban land green use efficiency and its spatial differentiation characteristics-- an empirical study based on 284 cities above prefecture level. Land Sci. China 2019, 33, 80–87. (In Chinese) [Google Scholar]
- Tang, Y.; Wang, K.; Ji, X.; Xu, H.; Xiao, Y. Assessment and spatial-temporal evolution analysis of urban land use efficiency under green development orientation: Case of the Yangtze River Delta urban agglomerations. Land 2021, 10, 715. [Google Scholar] [CrossRef]
- Zeng, L. The Driving Mechanism of Urban Land Green Use Efficiency in China Based on the EBM Model with Undesirable Outputs and the Spatial Dubin Model. Int. J. Environ. Res. Public Health 2022, 19, 10748. [Google Scholar] [CrossRef]
- Han, X.; Zhang, A.; Cai, Y. Spatial-econometric analysis of urban land use efficiency in China from the perspective of natural resources input and undesirable outputs: A case study of 287 cities in China. Int. J. Environ. Res. Public Health 2020, 17, 7297. [Google Scholar] [CrossRef]
- Masoudi, M.; Tan, P.Y.; Fadaei, M. The effects of land use on spatial pattern of urban green spaces and their cooling ability. Urban Clim. 2021, 35, 100743. [Google Scholar] [CrossRef]
- Becker, D.A.; Browning, M.H.; Kuo, M.; Van Den Eeden, S.K. Is green land cover associated with less health care spending? Promising findings from county-level Medicare spending in the continental United States. Urban For. Urban Green. 2019, 41, 39–47. [Google Scholar] [CrossRef]
- Muhamad Nor, A.N.; Abdul Aziz, H.; Nawawi, S.A.; Muhammad Jamil, R.; Abas, M.A.; Hambali, K.A.; Perotto-Baldivieso, H.L. Evolution of green space under rapid urban expansion in Southeast Asian cities. Sustainability 2021, 13, 12024. [Google Scholar] [CrossRef]
- Lap, T.; Daioglou, V.; Benders, R.; van der Hilst, F.; Faaij, A. The impact of land-use change emissions on the potential of bioenergy as climate change mitigation option for a Brazilian low-carbon energy system. GCB Bioenergy 2022, 14, 110–131. [Google Scholar] [CrossRef]
- Wang, A.; Lin, W.; Liu, B.; Wang, H.; Xu, H. Does smart city construction improve the green utilization efficiency of urban land? Land 2021, 10, 657. [Google Scholar] [CrossRef]
- Xu, N.; Zhao, D.; Zhang, W.; Zhang, H.; Chen, W.; Ji, M.; Liu, M. Innovation-Driven Development and Urban Land Low-Carbon Use Efficiency: A Policy Assessment from China. Assessment from China. Land 2022, 11, 1634. [Google Scholar] [CrossRef]
- Koroso, N.H.; Lengoiboni, M.; Zevenbergen, J.A. Urbanization and urban land use efficiency: Evidence from regional and Addis Ababa satellite cities, Ethiopia. Habitat Int. 2021, 117, 102437. [Google Scholar] [CrossRef]
- Xie, X.; Fang, B.; Xu, H.; He, S.; Li, Y. Study on the coordinated relationship between Urban Land use efficiency and ecosystem health in China. Use Policy 2021, 102, 105235. [Google Scholar] [CrossRef]
- Shan, Y.; Liu, J.; Liu, Z.; Shao, S.; Guan, D. An emissions-socioeconomic inventory of Chinese cities. Sci. Data 2019, 6, 1–10. [Google Scholar] [CrossRef] [Green Version]
- Zhao, M.; Kong, Z.; Escobedo, F.J.; Gao, J. Impacts of urban forests on offsetting carbon emissions from industrial energy use in Hangzhou, China. J. Environ. Manag. 2010, 91, 807–813. [Google Scholar] [CrossRef]
- Huang, H.; Cai, K.; Xing, G. Study on the characteristics and Countermeasures of Urban low-carbon Development in Guangdong Province from the Perspective of carbon balance. Urban Dev. Res. 2015, 11, 12–18. [Google Scholar]
- Glaeser, E.L.; Kahn, M.E. The greenness of cities: Carbon dioxide emissions and urban development. J. Urban Econ. 2010, 67, 404–418. [Google Scholar] [CrossRef] [Green Version]
- Rey, S.J.; Janikas, M.V. STARS: Space-Time Analysis of Regional Systems. Geogr. Anal. 2009, 38, 91–112. [Google Scholar]
- Rey, S.J.; Murray, A.T.; Anselin, L. Visualizing regional income distribution dynamics. Lett. Spat. Resour. Sci. 2011, 4, 81–90. [Google Scholar] [CrossRef]
- Fan, Q.Y.; Yang, S.; Hu, X. Spatial and temporal characteristics and interaction mechanisms of urbanization coordination in the Yangtze River Delta region from a coupling perspective. Geogr. Res. 2020, 39, 289–302. [Google Scholar]
- Huang, R.; Wang, K.; Huang, Z.F.; Lu, Y.Q. Spatial-temporal dynamics and coupling relationships of regional tourism development patterns from a performance perspective - taking the Pan-Yangtze River Delta as an example. Geogr. Res. 2018, 37, 14. [Google Scholar]
- Xia, S.Y.; Zhao, Y.; Wen, Q.; Xu, X.; Cui, P.P.; Tang, W.M. Spatial and temporal dynamic characteristics and influencing factors of impoverishment in karst ecologically fragile areas-an example from Guizhou Province. J. Ecol. 2019, 39, 6869–6879. [Google Scholar]
- Xia, S.Y.; Zhao, Y.; Xu, X.; Wen, Q.; Song, Y.Y.; Cui, P.P. Spatial and temporal dynamics and drivers of agricultural carbon emission rates in China from 1997–2016. J. Ecol. 2019, 39, 12. [Google Scholar]
- Cox, T.F. Spatial Processes: Models and Applications. J. R. Stat. Soc. Ser. A 1984, 147, 515. [Google Scholar] [CrossRef]
- Fang, S.M.; Huang, Y. Spatial and temporal evolution and coupled coordination of tourism efficiency and scale in the Yangtze River Economic Zone. J. Geogr. 2020, 75, 16. [Google Scholar]
- Ye, X.; Rey, C.S. A framework for exploratory space-time analysis of economic data. Ann. Reg. Sci. 2013, 50, 315–339. [Google Scholar] [CrossRef]
- Gao, X.; Zhang, A.; Sun, Z. How regional economic integration influence on urban land use efficiency? A case study of Wuhan metropolitan area, China. Land Use Policy 2020, 90, 104329. [Google Scholar] [CrossRef]
- Chen, W.; Shen, Y.; Wang, Y.; Wu, Q. The effect of industrial relocation on industrial land use efficiency in China: A spatial econometrics approach. J. Clean. Prod. 2018, 205, 525–535. [Google Scholar] [CrossRef]
- Xu, L.; Fan, M.; Yang, L.; Shao, S. Heterogeneous green innovations and carbon emission performance: Evidence at China’s city level. Economics 2021, 99, 105269. [Google Scholar] [CrossRef]
- Liu, J.; Feng, H.; Wang, K. The Low-Carbon City Pilot Policy and Urban Land Use Efficiency: A Policy Assessment from China. Land 2022, 11, 604. [Google Scholar] [CrossRef]
- Li, X.; Cheng, Z. Does high-speed rail improve urban carbon emission efficiency in China? Socio-Econ. Plan. Sci. 2022, 4, 101308. [Google Scholar] [CrossRef]
- Tu, F.; Yu, X.; Ruan, J. Industrial land use efficiency under government intervention: Evidence from Hangzhou, China. Habitat Int. 2014, 43, 1–10. [Google Scholar] [CrossRef]
- Luo, Y.; Lu, Z.; Long, X. Heterogeneous effects of endogenous and foreign innovation on CO2 emissions stochastic convergence across China. Economics 2020, 91, 104893. [Google Scholar] [CrossRef]
- Li, G.; Wei, W. Financial development, openness, innovation, carbon emissions, and economic growth in China. Energy Econ. 2021, 97, 105194. [Google Scholar] [CrossRef]
- Hussain, M.; Wang, W.; Wang, Y. Natural resources, consumer prices and financial development in China: Measures to control carbon emissions and ecological footprints. Resour. Policy 2022, 78, 102880. [Google Scholar] [CrossRef]
- Wen, S.; Jia, Z.; Chen, X. Can low-carbon city pilot policies significantly improve carbon emission efficiency? J. Clean. Prod. 2022, 346, 131131. [Google Scholar] [CrossRef]
- He, S.; Yu, S.; Li, G.; Zhang, J. Exploring the influence of urban form on land-use efficiency from a spatialtemporal heterogeneity perspective: Evidence from 336 Chinese cities. Land Use Policy 2020, 95, 104576. [Google Scholar] [CrossRef]


| Index | Specific Index | Indicator Description | References |
|---|---|---|---|
| Input | Labor input | Total number of urban employments in the year (unit: 10,000 people) | Han et al. [17] Wang et al. [22] Xu et al. [23] |
| Land input | Urban built-up area (unit: km2) | Koroso et al. [24] | |
| Capital input | Total investment in urban fixed assets (unit: 100 million yuan) | Han et al. [17] | |
| Expected output | Economic output | Added value of urban secondary and tertiary industries (unit: 10,000 yuan) | Wang et al. [22] Xu et al. [23] |
| Social output | Average wages of urban employees (unit: yuan) | Xie et al. [25] | |
| Ecological output | Total carbon sink of urban green space (unit: 10,000 tons) | Tan et al. [1] | |
| Unexpected output | Carbon-emission output | Carbon emissions of urban construction land (unit: 10,000 tons) | Shan et al. [26] |
| Environmental-pollution output | Industrial pollution emissions (unit: 10,000 tons) | Han et al. [17] |
| Type | Spatial-Temporal Transition Type | Symbolic Expressions |
|---|---|---|
| Type1 type | Self-transition, neighborhood stabilization | HHt→LHt+1, LHt→HHt+1, HLt→LLt+1, LLt→HLt+1 |
| Type2 type | Self-stabilization, neighborhood transition | HHt→HLt+1, LHt→LLt+1, HLt→HHt+1, LLt→LHt+1 |
| Type3 type | Self and neighbor transition | HHt→LLt+1, LLt→HHt+1, LHt→HLt+1, HLt→LHt+1 |
| Type4 type | Self and neighboring stabilization | HHt→HHt+1, HLt→HLt+1, LLt→LLt+1, LHt→LHt+1 |
| Year | Moran’s I | Z-Value | p-Value |
|---|---|---|---|
| 2005 | 0.0748 | 3.8459 | 0.0001 |
| 2010 | 0.0878 | 4.4491 | 0.0000 |
| 2015 | 0.0951 | 4.7729 | 0.0000 |
| 2020 | 0.1305 | 6.4725 | 0.0000 |
| t/t + 1 | HH | LH | LL | HL | Type | Quantity | Percentage | SF | SC |
|---|---|---|---|---|---|---|---|---|---|
| HH | 0.1442 | 0.0355 | 0.0165 | 0.0496 | Type1 | 172 | 0.2033 | 0.3700 | 0.6111 |
| LH | 0.0414 | 0.0827 | 0.0366 | 0.0083 | Type2 | 141 | 0.1667 | ||
| LL | 0.0189 | 0.0343 | 0.1217 | 0.0733 | Type3 | 46 | 0.0544 | ||
| HL | 0.0461 | 0.0106 | 0.0532 | 0.2270 | Type4 | 487 | 0.5757 |
| Influencing Factors | Description | References |
|---|---|---|
| EDL | GDP per capita (yuan) | Gao et al. [39] |
| ISU | Tertiary sector as a proportion of secondary sector (%) | Chen et al. [40] Xu et al. [41] |
| UPS | Number of people in urban areas of the city (10,000) | Liu et al. [42] Li et al. [43] |
| FS | Local-general-budget expenditure as a proportion of GDP (%) | Tu et al. [44] |
| FIS | Total output value of foreign-invested enterprises as a proportion of GDP (%) | Luo et al. [45] |
| FDL | Year-end loan balance as a percentage of GDP (%) | Li et al. [46] Hussain et al. [47] |
| WL | Average wage of urban workers (yuan) | Wen et al. [48] |
| GTIA | Number of green patent applications (pcs) | He et al. [49] |
| Model Parameters | Sigma | Residual Squares | AICc | R2 | Adjusted R2 | Spatial-Temporal Distance Ratio |
|---|---|---|---|---|---|---|
| Value | 0.1851 | 38.6297 | −602 | 0.7978 | 0.7934 | 0.1 |
Publisher’s Note: MDPI stays neutral with regard to jurisdictional claims in published maps and institutional affiliations. |
© 2022 by the authors. Licensee MDPI, Basel, Switzerland. This article is an open access article distributed under the terms and conditions of the Creative Commons Attribution (CC BY) license (https://creativecommons.org/licenses/by/4.0/).
Share and Cite
Fu, J.; Ding, R.; Zhang, Y.; Zhou, T.; Du, Y.; Zhu, Y.; Du, L.; Peng, L.; Zou, J.; Xiao, W. The Spatial-Temporal Transition and Influencing Factors of Green and Low-Carbon Utilization Efficiency of Urban Land in China under the Goal of Carbon Neutralization. Int. J. Environ. Res. Public Health 2022, 19, 16149. https://doi.org/10.3390/ijerph192316149
Fu J, Ding R, Zhang Y, Zhou T, Du Y, Zhu Y, Du L, Peng L, Zou J, Xiao W. The Spatial-Temporal Transition and Influencing Factors of Green and Low-Carbon Utilization Efficiency of Urban Land in China under the Goal of Carbon Neutralization. International Journal of Environmental Research and Public Health. 2022; 19(23):16149. https://doi.org/10.3390/ijerph192316149
Chicago/Turabian StyleFu, Jun, Rui Ding, Yilin Zhang, Tao Zhou, Yiming Du, Yuqi Zhu, Linyu Du, Lina Peng, Jian Zou, and Wenqian Xiao. 2022. "The Spatial-Temporal Transition and Influencing Factors of Green and Low-Carbon Utilization Efficiency of Urban Land in China under the Goal of Carbon Neutralization" International Journal of Environmental Research and Public Health 19, no. 23: 16149. https://doi.org/10.3390/ijerph192316149