
Noise Disturbance and Well-Being in the North of Spain
 and
and
Abstract
:1. Introduction
2. Materials and Methods
3. Results
4. Discussion
5. Conclusions
Author Contributions
Funding
Institutional Review Board Statement
Informed Consent Statement
Data Availability Statement
Conflicts of Interest
Appendix A

| WHO-5 | Urban | Rural | p Value | |||
|---|---|---|---|---|---|---|
| Average | >50 | Average | >50 | Average | >50 | |
| Men | 62.7 | 72% | 63.8 | 79% | 0.883 | 0.594 |
| Women | 61.1 | 76% | 63.0 | 71% | 0.571 | 0.675 |
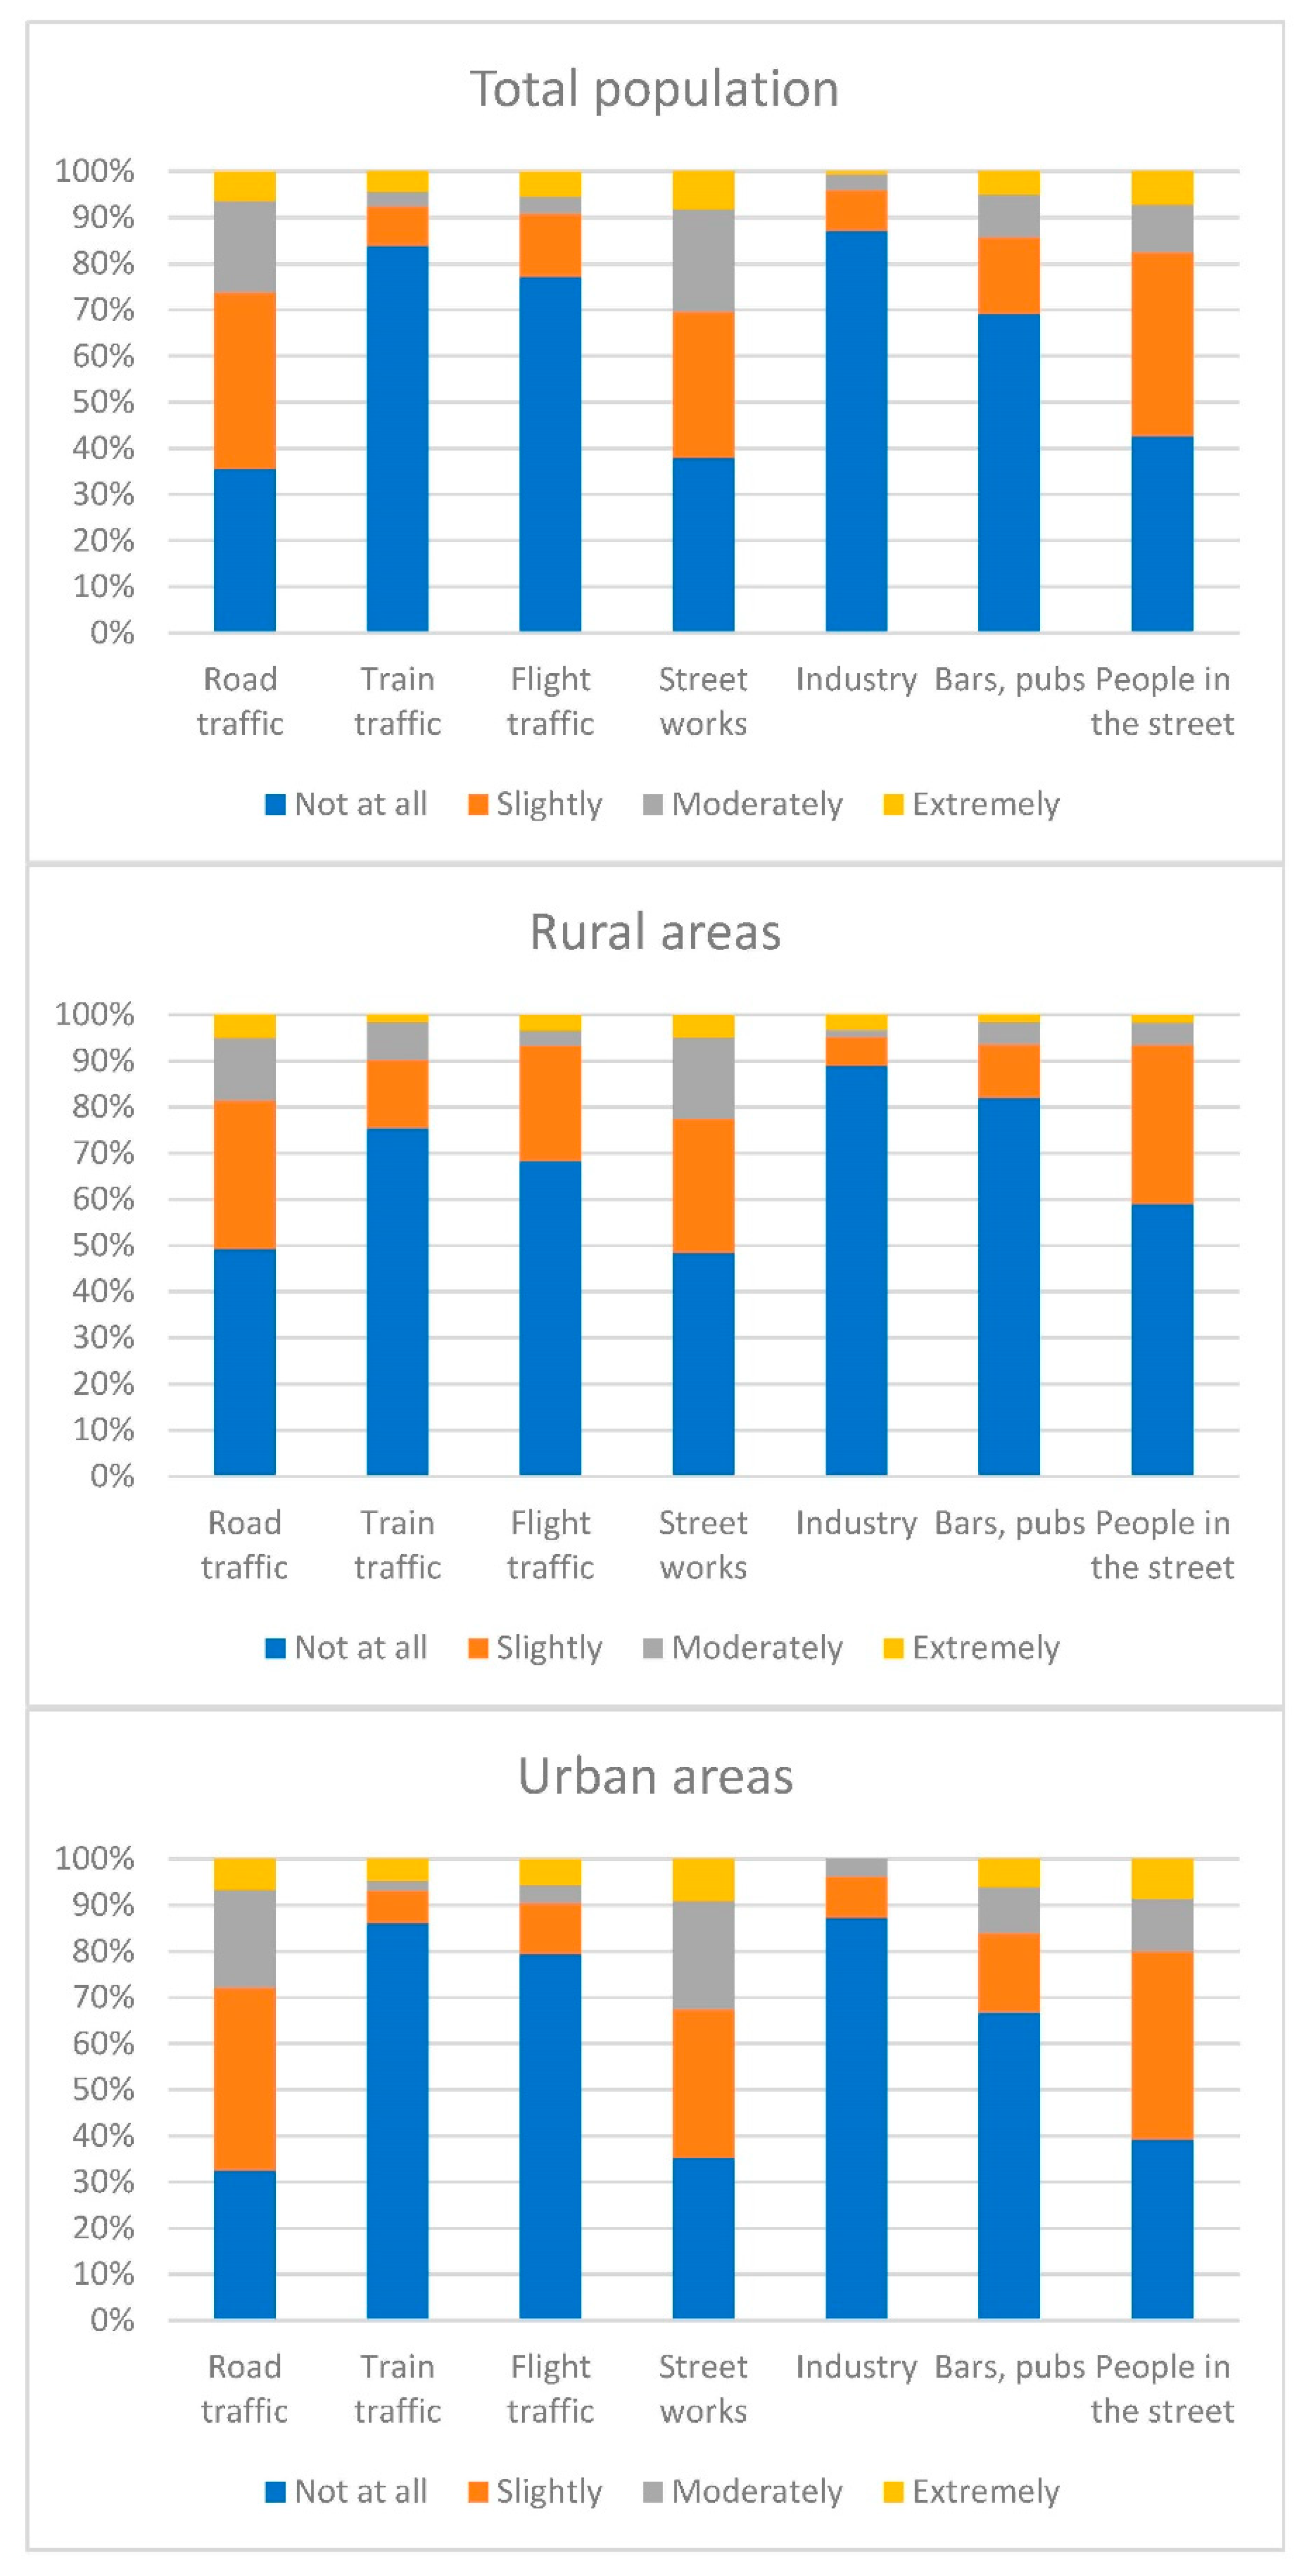
| Not at All | Slightly | Moderately | Extremely | |||||||||
|---|---|---|---|---|---|---|---|---|---|---|---|---|
| Total | Rural | Urban | Total | Rural | Urban | Total | Rural | Urban | Total | Rural | Urban | |
| Road traffic (cars, buses, etc.) | 35.5% | 49.2% | 32.5% | 38.3% | 32.2% | 39.6% | 19.9% | 13.6% | 21.2% | 6.2% | 5.1% | 6.7% |
| Train traffic | 83.9% | 75.4% | 86.1% | 8.5% | 14.8% | 7.0% | 3.2% | 8.2% | 2.2% | 4.4% | 1.6% | 4.8% |
| Flight traffic | 77.2% | 68.3% | 79.4% | 13.6% | 25.0% | 11.0% | 3.8% | 3.3% | 4.0% | 5.3% | 3.3% | 5.5% |
| Street works | 38.0% | 48.4% | 35.2% | 31.6% | 29.0% | 32.2% | 22.3% | 17.7% | 23.5% | 8.1% | 4.8% | 9.1% |
| Industry | 87.2% | 88.9% | 87.3% | 8.8% | 6.3% | 8.9% | 3.4% | 1.6% | 3.9% | 0.6% | 3.2% | 0.0% |
| Bars, pubs | 69.2% | 82.0% | 66.7% | 16.5% | 11.5% | 17.2% | 9.3% | 4.9% | 10.1% | 5.1% | 1.6% | 6.0% |
| People in the street | 42.7% | 59.0% | 39.2% | 39.7% | 34.4% | 40.7% | 10.4% | 4.9% | 11.6% | 7.2% | 1.6% | 8.6% |
References
- Murphy, E.; King, E.A. Environmental Noise Pollution: Noise Mapping, Public Health and Policy, 2nd ed.; Elsevier: Amsterdam, The Netherlands, 2022. [Google Scholar]
- World Health Organization. Environmental Noise Guidelines for the European Region; World Health Organization: Geneva, Switzerland, 2018; Available online: https://www.euro.who.int/data/assets/pdffile/0008/383921/noise-guidelines-eng.pdf (accessed on 2 June 2022).
- World Health Organization. Burden of Disease from Environmental Noise. Quantification of Healthy Life Years Lost in Europe; World Health Organization: Geneva, Switzerland, 2011; Available online: https://www.euro.who.int/__data/assets/pdf_file/0008/136466/e94888.pdf (accessed on 20 July 2022).
- Directive 2002/49/EC of the European Parliament and of the Council of 25 June 2002 Relating to the Assessment and Management of Environmental Noise. Available online: https://eur-lex.europa.eu/legal-content/ES/TXT/PDF/?uri=CELEX:32002L0049&from=EN (accessed on 29 June 2022).
- Environment Commission Department for EU Policy on the Environment. Available online: https://environment.ec.europa.eu/topics/noise/environmental-noise-directive_en (accessed on 2 July 2022).
- Berglund, B.; Lindvall, T.; Schwela, D.H. Guidelines for Community Noise; World Health Organization: Geneva, Switzerland, 1999. [Google Scholar]
- Okokom, E.O.; Yli-Tuomi, T.; Turunen, A.W.; Tiittanen, P.; Juutilainen, J. Traffic noise, noise annoyance and psychotropic medication use. Environ. Int. 2018, 119, 287–294. [Google Scholar] [CrossRef] [PubMed]
- WHO. Large Analysis and Review of European Housing and Health Status (LARES)–Preliminary Overview; World Health Organization, Regional Office for Europe: Copenhagen, Denmark, 2007; Available online: http://www.euro.who.int/__data/assets/pdf_file/0007/107476/lares_result.pdf?ua=1 (accessed on 15 July 2022).
- Maschke, C.; Niemann, H. Health effects of annoyance induced by neighbor noise. Noise Control. Eng. J. 2007, 55, 348–356. [Google Scholar] [CrossRef]
- Perna, M.; Padois, T.; Trudeau, C.; Bild, E.; Laplace, J.; Dupont, T.; Guastavino, C. Comparison of Road Noise Policies across Australia, Europe, and North America. Int. J. Environ. Res. Public Health 2021, 19, 173. [Google Scholar] [CrossRef] [PubMed]
- Law 37/2003 of 17 November 2003 on the Noise in Spain. Available online: https://www.boe.es/buscar/pdf/2003/BOE-A-2003-20976-consolidado.pdf (accessed on 8 June 2022).
- Law 5/2009 of 4 June 2009 on the Noise in Castilla y León. Available online: https://www.boe.es/buscar/act.php?id=BOE-A-2009-11125 (accessed on 12 July 2022).
- Cannon, W.B. Neural organisation of emotional expression. In Feeling and Emotions; Michison, C., Ed.; Clark University Press: Worcester, MA, USA, 1928. [Google Scholar]
- Hecht, K.; Scherf, H.P.; König, O. Emotional Stress by Excessive Demand and Underchallenge; Schibri Verlag: Berlin, Germany, 2001. [Google Scholar]
- Topp, C.W.; Østergaard, S.D.; Søndergaard, S.; Bech, P. The WHO-5 well-being index: A systematic review of the literature Psychother. Psychother. Psychosom. 2015, 84, 167–176. [Google Scholar] [CrossRef] [PubMed]
- Setia, M.S. Methodology series module 3: Cross-sectional studies. Indian J. Dermatol. 2016, 61, 261–264. [Google Scholar] [CrossRef]
- Wang, J.; Norbäck, D. Home environment and noise disturbance in a national sample of multi-family buildings in Sweden-associations with medical symptoms. BMC Public Health 2021, 21, 1989. [Google Scholar] [CrossRef]
- de Wit, M.; Pouwer, F.; Gemke, R.J.; de Waal, H.A.D.-V.; Snoek, F.J. Validation of the WHO-5 Well-Being Index in Adolescents With Type 1 Diabetes. Diabetes Care 2007, 30, 2003–2006. [Google Scholar] [CrossRef] [Green Version]
- Omani-Samani, R.; Maroufizadeh, S.; Almasi-Hashiani, A.; Sepidarkish, M.; Amini, P. The WHO-5 Well-Being Index: A Validation Study in People with Infertility. Iran. J. Public Health 2020, 48, 2058–2064. [Google Scholar] [CrossRef]
- Buregeya, J.M.; Apparicio, P.; Gelb, J. Short-Term Impact of Traffic-Related Particulate Matter and Noise Exposure on Cardiac Function. Int. J. Environ. Res. Public Health 2020, 17, 1220. [Google Scholar] [CrossRef] [Green Version]
- Okokon, E.O.; Turunen, A.W.; Ung-Lanki, S.; Vartiainen, A.-K.; Tiittanen, P.; Lanki, T. Road-Traffic Noise: Annoyance, Risk Perception, and Noise Sensitivity in the Finnish Adult Population. Int. J. Environ. Res. Public Health 2015, 12, 5712–5734. [Google Scholar] [CrossRef]
- Beutel, M.E.; Brähler, E.; Ernst, M.; Klein, E.; Reiner, I.; Wiltink, J.; Michal, M.; Wild, P.S.; Schulz, A.; Münzel, T.; et al. Noise annoyance predicts symptoms of depression, anxiety and sleep disturbance 5 years later. Findings from the Gutenberg Health Study. Eur. J. Public Health 2020, 30, 487–492. [Google Scholar] [CrossRef] [PubMed]
- Michaud, D.S.; Keith, S.E.; McMurchy, D. Annoyance and disturbance of daily activities from road traffic noise in Canada. J. Acoust. Soc. Am. 2008, 123, 784–792. [Google Scholar] [CrossRef] [PubMed]
- Michaud, D.S.; Marro, L.; Denning, A.; Shackleton, S.; Toutant, N.; McNamee, J.P. A comparison of self-reported health status and perceptual responses toward environmental noise in rural, suburban, and urban regions in Canada. J. Acoust. Soc. Am. 2022, 151, 1532–1544. [Google Scholar] [CrossRef] [PubMed]
- European Environment Agency. Number of Europeans Exposed to Harmful Noise Pollution Expected to Increase; European Environment Agency: Copenhagen, Denmark, 2021; Available online: https://www.eea.europa.eu/highlights/number-of-europeans-exposed-to (accessed on 20 August 2022).
- Anderson, S.; Kraus, N. Sensory-Cognitive Interaction in the Neural Encoding of Speech in Noise: A Review. J. Am. Acad. Audiol. 2010, 21, 575–585. [Google Scholar] [CrossRef]
- Meijer, H.; Knipschild, P.; Sallé, H. Road traffic noise annoyance in amsterdam. Int. Arch. Occup. Environ. Health 1985, 56, 285–297. [Google Scholar] [CrossRef]
- Schreckenberg, D.; Griefahn, B.; Meis, M. The associations between noise sensitivity, reported physical and mental health, perceived environmental quality, and noise annoyance. Noise Health 2010, 12, 7–16. [Google Scholar] [CrossRef]
- Attias, J.; Karawani, H.; Shemesh, R.; Nageris, B. Predicting Hearing Thresholds in Occupational Noise-Induced Hearing Loss by Auditory Steady State Responses. Ear Hear. 2014, 35, 330–338. [Google Scholar] [CrossRef]
- Myshchenko, I.; Nazarenko, V.; Kolhanov, A.; Ionda, M.; Malyshevska, O.; Hrechukh, L.; Pohorily, M.; Nykyforuk, O. The content of acoustic signals and biological effects of noise in conditions of high level of work intensity. J. Prev. Med. Hyg. 2021, 62, E763–E769. [Google Scholar] [CrossRef]
- Laszlo, H.E.; McRobie, E.; Stansfeld, S.; Hansell, A. Annoyance and other reaction measures to changes in noise exposure—A review. Sci. Total. Environ. 2012, 435-436, 551–562. [Google Scholar] [CrossRef]
- Sivakumaran, K.; Ritonja, J.; Waseem, H.; AlShenaibar, L.; Morgan, E.; Ahmadi, S.; Denning, A.; Michaud, D.; Morgan, R. Impact of noise exposure on risk of developing stress-related health effects related to the cardiovascular system: A systematic review and meta-analysis. Noise Health 2022, 24, 107–129. [Google Scholar] [CrossRef]
- Dzhambov, A.; Tilov, B.; Markevych, I.; Dimitrova, D. Residential road traffic noise and general mental health in youth: The role of noise annoyance, neighborhood restorative quality, physical activity, and social cohesion as potential mediators. Environ. Int. 2017, 109, 1–9. [Google Scholar] [CrossRef] [PubMed]
- Stansfeld, S.; Clark, C. Health Effects of Noise Exposure in Children. Curr. Environ. Health Rep. 2015, 2, 171–178. [Google Scholar] [CrossRef] [PubMed]
| Please Respond to Each Item by Marking One Box per Row, Regarding How You Felt in the Last Two Weeks. | All of the Time (5) | Most of the Time (4) | More Than Half the Time (3) | Less Than Half the Time (2) | Some of the Time (1) | At No Time (0) | |
|---|---|---|---|---|---|---|---|
| WHO-1 | I have felt cheerful in good spirits. | ⃝ | ⃝ | ⃝ | ⃝ | ⃝ | ⃝ |
| WHO-2 | I have felt calm and relaxed. | ⃝ | ⃝ | ⃝ | ⃝ | ⃝ | ⃝ |
| WHO-3 | I have felt active and vigorous. | ⃝ | ⃝ | ⃝ | ⃝ | ⃝ | ⃝ |
| WHO-4 | I woke up feeling fresh and rested. | ⃝ | ⃝ | ⃝ | ⃝ | ⃝ | ⃝ |
| WHO-5 | My daily life has been filled with things that interest me. | ⃝ | ⃝ | ⃝ | ⃝ | ⃝ | ⃝ |
| Total | Men | Women | ||||
|---|---|---|---|---|---|---|
| Rural | Urban | Rural | Urban | Rural | Urban | |
| 18–44 years | 37 | 140 | 18 | 56 | 19 | 84 |
| 45–64 years | 14 | 56 | 1 | 18 | 13 | 38 |
| 65+ years | 8 | 61 | 5 | 23 | 3 | 38 |
| Never | Yes, Sometimes | Yes, Often | ||||||||||
|---|---|---|---|---|---|---|---|---|---|---|---|---|
| Average | SD | Max. | Min. | Average | SD | Max. | Min. | Average | SD | Max. | Min. | |
| Difficult to hear radio/TV | 64.5 | 18.3 | 100.0 | 12.0 | 57.8 | 19.9 | 100.0 | 20.0 | 47.0 | 21.5 | 80.0 | 28.0 |
| Telephone calls being affected | 64.6 | 18.0 | 100.0 | 12.0 | 52.1 | 20.4 | 100.0 | 20.0 | 42.5 | 16.8 | 72.0 | 28.0 |
| Conversations at home being affected | 64.3 | 18.4 | 100.0 | 12.0 | 51.8 | 19.5 | 84.0 | 20.0 | 42.0 | 14.7 | 64.0 | 28.0 |
| Rest/relaxation being disturbed | 66.5 | 18.2 | 100.0 | 12.0 | 54.5 | 18.0 | 96.0 | 16.0 | 48.7 | 17.6 | 80.0 | 32.0 |
| Difficulties in sleeping | 66.1 | 17.9 | 100.0 | 12.0 | 50.5 | 17.6 | 88.0 | 16.0 | 47.0 | 18.3 | 80.0 | 28.0 |
| Being woken up | 65.6 | 18.1 | 100.0 | 12.0 | 53.7 | 18.9 | 96.0 | 16.0 | 52.0 | 20.0 | 80.0 | 32.0 |
| Variables | OR (95% CI) | p Value | ||
|---|---|---|---|---|
| Total | Age | 0.960 (0.939–0.981) | <0.001 | |
| Noise from sources inside the building | Scraping sound/footsteps/thumping/similar sounds from neighbors | 1.647 (1.142–2.375) | 0.008 | |
| Noise from sources outside the building | Disturbed by train traffic | 2.234 (1.136–4.394) | 0.02 | |
| Disturbed by outside street/plaza noise | 1.846 (1.236–2.758) | 0.003 | ||
| Effect of noise | Difficulties in sleeping | 2.184 (1.137–4.194) | 0.019 | |
| Men | Disturbed by noise from sources outside the building | Street/construction works | 1.870 (1.128–3.099) | 0.015 |
| Bars, pubs | 2.104 (1.183–3.741) | 0.011 | ||
| Women | Age | 0.951 (0.924–0.980) | 0.001 | |
| Disturbed by noise from sources inside the building | Impact noises: footsteps/knocks/others | 1.987 (1.234–3.199) | 0.005 | |
| Disturbed by noise from sources outside the building | Train traffic | 3.343 (1.209–9.245) | 0.02 | |
Publisher’s Note: MDPI stays neutral with regard to jurisdictional claims in published maps and institutional affiliations. |
© 2022 by the authors. Licensee MDPI, Basel, Switzerland. This article is an open access article distributed under the terms and conditions of the Creative Commons Attribution (CC BY) license (https://creativecommons.org/licenses/by/4.0/).
Share and Cite
Santurtún, M.; García Tárrago, M.J.; Fdez-Arroyabe, P.; Zarrabeitia, M.T. Noise Disturbance and Well-Being in the North of Spain. Int. J. Environ. Res. Public Health 2022, 19, 16457. https://doi.org/10.3390/ijerph192416457
Santurtún M, García Tárrago MJ, Fdez-Arroyabe P, Zarrabeitia MT. Noise Disturbance and Well-Being in the North of Spain. International Journal of Environmental Research and Public Health. 2022; 19(24):16457. https://doi.org/10.3390/ijerph192416457
Chicago/Turabian StyleSanturtún, Maite, María José García Tárrago, Pablo Fdez-Arroyabe, and María T. Zarrabeitia. 2022. "Noise Disturbance and Well-Being in the North of Spain" International Journal of Environmental Research and Public Health 19, no. 24: 16457. https://doi.org/10.3390/ijerph192416457