Abstract
Agricultural sustainability is the foundation and a guarantee of sustainable human reproduction. The scientific assessment of China’s agricultural sustainability is a prerequisite for properly resolving the conflict between short-term economic interests and long-term ecological security. This paper uses the emergy analysis method to estimate agricultural sustainability in China and further calculates the agricultural environmental cost and green GDP. The results show that China’s agricultural emergy yield rate (EYR) is generally greater than 1. This means that more emergy is obtained in relation to renewable and non-renewable inputs from human activity, which also indicates that China’s agricultural agroecosystem is characteristic of a profound transition from a self-supporting tradition to a modern industry based on external economic resource consumption. In contrast, China’s agricultural growth is mainly driven by the input of a large amount of non-renewable resources, which makes the environmental loading rate (ELR) increase year by year, resulting in the deterioration of China’s agricultural emergy sustainability index (ESI). China’s agricultural green GDP accounts for about 94.4% of traditional GDP, which means that the average agricultural environmental cost is about 5.6%, mainly from land loss, accounting for 48.23% of the environmental cost.
1. Introduction
Since the reform and opening up, the Chinese government has made the increase in grain output the main goal of agricultural economic development. Grain production has increased from 305 million tons in 1978 to 618 million tons in 2017, solving the problem of food and clothing for about one-fifth of the world’s population. However, China’s agriculture unilaterally pursues production growth, and has not paid attention to the problem of nonpoint source pollution caused by the low-efficiency and large-scale use of chemical agricultural materials. According to data, the utilization rate of chemical fertilizers and pesticides in China is less than 1/3, the recycling rate of plastic film is less than 2/3, the effective treatment rate of livestock and poultry manure is less than 50%, and the burning of straw and the eutrophication of water bodies are serious [1,2]. It is estimated that China’s annual economic loss due to water pollution is about 150 billion yuan [3,4]. Moreover, in order to feed the continuously growing population in the future, China’s agricultural ecological environment will face greater bearing pressure. Therefore, a scientific assessment of China’s agricultural sustainability is not only a prerequisite for properly resolving the conflict between short-term economic interests and long-term ecological security, but also helps provide a reference for the Chinese government to formulate agricultural sustainable development policies.
At present, some scholars mainly use Data Envelopment Analysis (DEA), life cycle analysis, and emergy analysis to evaluate the ability of agricultural sustainable development. Han et al. [5] and Han et al. [6] used the pollutants total phosphorus (TP), total nitrogen (TN), and chemical oxygen demand (COD) produced during agricultural production as unintended outputs and found that environmental pollution had a large efficiency loss on agricultural development and failed to meet the requirements of “good and fast” development of the national economy. Xu et al. [7] and He et al. [8] used agricultural carbon emissions as an unexpected output to measure agricultural carbon emissions performance. Although the inclusion of unintended outputs within the DEA framework allows accounting for green growth performance in agriculture, it is still relatively arbitrary with regard to issues such as pollutant selection and quantification [9]. Moreover, it also does not satisfy the law of conservation of matter [10,11,12,13], thus making it highly susceptible to biased results. In terms of sustainability evaluation, the Life Cycle Sustainability Assessment (LCSA), a comprehensive evaluation method including Life Cycle Assessment (LCA), Life Cycle Cost (LCC), and Social Life Cycle Assessment (SLCA), has been widely used in agricultural sustainability studies. Examples include studies involving composite landscape indicators on Swiss farms [14], sustainability assessment of Italian olive groves [15], and SLCA of Swiss farms [16]. However, LCA lacks consideration of ecosystem goods and services, thus neglecting the contribution of natural resources to agricultural activities.
In order to comprehensively evaluate the ecological economic system, Odum [17] established the theory of emergy analysis and introduced this method into the field of ecological environment accounting. The emergy analysis method starts from the perspective of regional biosphere energy movement, expresses all energy consumed by a certain resource or product in the process of formation or production by emergy, and establishes a systematic sustainable performance value evaluation system on this basis. Compared with other environmental accounting methods, the advantages of the emergy analysis method lie in the following three points. Firstly, it enables the transformation of all the different categories of energy, resources, products, and even labor and services, which are incomparable and difficult to account for, into a uniform scale of “solar emergy emjoules (sej)” [17,18]. It facilitates the integrated assessment of short-term economic benefits and long-term sustainable development performance. Secondly, the emergy theory is based on the laws of material and energy flow in the biosphere and is more convincing in reflecting the true value of the agroecological environment. Thirdly, emergy analysis is not only an important method of environmental accounting, it also provides a detailed portrayal of the material flows and energy transfers in the agricultural production process, making it an important tool for system analysis and evaluation. Due to the many advantages of emergy analysis, more and more studies are beginning to use this method to assess the sustainability level of agricultural production [19,20], environmental damage from agricultural non-point source pollution [21], and the sustainability of cultivated land in China [22].
This paper contributes to the literature in two major ways. Firstly, this paper uses emergy analysis to evaluate the ecological and environmental cost of agricultural nonpoint source pollution. Excessive use of chemical fertilizers not only cannot be effectively absorbed by crops, but also drains into water bodies and causes non-point source pollution. Agricultural non-point source pollution, also known as diffused pollution, mainly refers to soil fertilizer loss during agricultural production, livestock breeding discharge, solid waste discharge, aquaculture discharge, etc. In addition, for a long time, China’s agricultural straw has been disposed of by stacking and burning, which may also induce agricultural nonpoint source pollution. However, existing studies have not included pollutants in the emergy analysis when evaluating agricultural sustainability, which may overestimate the agricultural green development performance. To fill this gap, this paper refers to Zou et al. [2], Han et al. [6], and Qu et al. [23] using the unit survey method to calculate the pollutant emissions in the agricultural production process, and then uses the emergy analysis method to calculate the environmental cost of agricultural nonpoint source pollution.
Secondly, this paper calculates agricultural green GDP. Existing research mainly uses the emergy method to assess economic sustainability [21,22,24,25], and has not yet fully utilized the advantages of the emergy analysis method, namely, it can compare all different types of energy, resources, products, and even labor and services, which are incomparable and difficult to account for, into a uniform scale of “solar emergy emjoules (sej)”. In this way, the emergy can be further linked with the traditional GDP, and the agricultural green GDP can be calculated. In recent years, a small number of scholars have also assessed green GDP using emergy analysis [9,26], but not for agriculture and without accounting for the environmental cost. Therefore, this paper further adopts the emergy analysis method to evaluate the agricultural green GDP on the basis of accounting for the environmental cost.
2. Materials and Methods
2.1. Emergy Analysis
Emergy transformity is used to convert various ecological flows in the natural, economic, and social subsystems into a unified emergy dimension, and then the macroeconomic value is measured by the converted emergy currency value (that is, the market currency value corresponding to the emergy). According to the emergy analysis steps, cities in China are taken as the research areas. (There are four levels of administrative divisions in China: province (autonomous region, municipality directly under the central government), prefecture-level city (city), country, and township (town-village)). Due to sample size, we focus our analysis on the prefecture-level cities that have a relatively large number of observations for each city.
Firstly, the spatiotemporal boundary of the agroecosystem is identified and graphical language is used to depict the input–output system. As shown in Figure 1, the larger matrix box represents the boundary and extent of the entire ecosystem. The left side of the diagram represents natural renewable inputs, including sunlight, wind, rain, and Earth rotation; the upper part is human economic and social inputs, including machines, fertilizers, pesticides, diesel fuel, agricultural film, and labor; the right side is agricultural outputs, including intended and unintended outputs (pollution); and finally, the soil erosion within the box is the system’s own output.
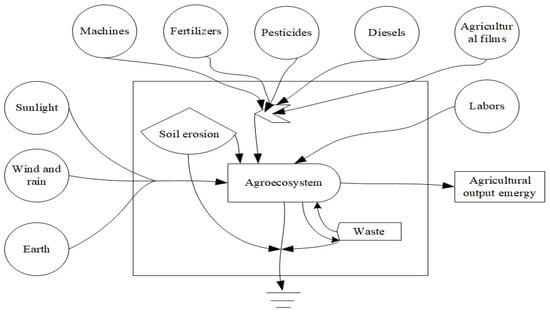
Figure 1.
Emergy system diagram of the agricultural system.
Secondly, the underlying variables are categorized. According to the characteristics of the agroecological economic system, it can be divided into six categories: Renewable natural resources, non-renewable natural resources, renewable resource products, externally imported non-renewable resources, externally imported renewable resources, and waste streams (Table 1). Since sunlight, wind, and rain are directly or indirectly derived from solar energy, in order to prevent double counting, according to the suggestion of Odum [17], this paper only uses the project with the largest emergy value as the renewable resource emergy input.

Table 1.
Agroeconomic ecosystem indicator.
Thirdly, a system emergy analysis table is prepared that includes raw data, transformity, and energy consumption of each element. Transformity is not only a “transformity factor” that converts an initial substance, service, or energy into an emergy, but also reflects the quality or level of different energies to a certain extent. The higher the transformity, the higher the quality or level of energy contained in the substance or service. The formula for calculating the solar emergy of various ecological flows is:
where represents the total solar emergy of the system, is the material or energy flow of the i-th input or output, and is the transformity (as shown in Table 2).
Table 2.
Emergy transformity of China’s agroecosystem.
2.2. Variables
2.2.1. Agricultural Sustainability
At present, there are many indicators for evaluating agricultural sustainability and no uniform criteria have been developed. The main reason is that most studies have different conceptions of sustainable agricultural development. Some scholars point out that sustainable agriculture describes crop management approaches that address the interdependent goals of increasing or at least maintaining yields while protecting the environment, conserving natural resources, and mitigating climate change. Hoang et al. [11] argue that sustainable agriculture should provide sufficient nutritious food for all while reducing environmental risks and enabling agricultural producers to earn substantial incomes. Some scholars also define agricultural sustainability as an increase in food production that neither hinders resource recycling nor leads to ecological degradation. Xie et al. [22] place more emphasis on the compatibility between agricultural production efficiency and ecological protection.
It is clear from the definition that the sustainability of an agricultural system is a complex and integrated concept that cannot be measured by a single indicator. Comprehensive analysis of multiple emergy indicators can better reveal the quality of sustainable intensification of agroecological economic systems. In view of this, we refer to Baráth and Fertő [32] and Yuan et al. [33] for a comprehensive measure of the intensity of agricultural sustainability in China using three comprehensive indicators: (1) emergy yield rate (EYR), the greater the value, the greater the contribution of external resources to create available resources; (2) environmental loading rate (ELR), a larger ELR indicates that agricultural production uses more non-renewable resources relative to renewable resources; and (3) emergy sustainability index (ESI), the higher the value, the greater the sustainable development capability. The variables are defined in Table 3.
Table 3.
Agricultural sustainability variable.
2.2.2. Agricultural Green GDP
This paper refers to the methods of He et al. [9], Wei et al. [26], and uses emergy analysis to estimate China’s agricultural green GDP.
where is the monetary value of the unit emergy.
Thus, the agricultural green GDP can be obtained:
where green GDP represents the total agricultural production value after deducting the cost of environmental damage.
It should be noted that only when the input becomes pollution due to loss will it cause damage to the environment, and at the same time, this also avoids the repeated deduction of non-renewable resources such as chemical fertilizers. Therefore, this paper does not directly deduct the purchased non-renewable emergy input according to the practice of He et al. [9] and Wei et al. [26]: .
2.3. Data Source
The data for this paper were obtained from the China Urban Statistical Yearbook, the China County Statistical Yearbook, the China Statistical Yearbook, the China Rural Statistical Yearbook and various local statistical yearbooks. This paper uses 306 cities in China from 1996–2017 as the sample. Some of the indicators are described as follows: (1) To eliminate inter-year variation in objects, all variables involving monetary values have been converted to real output value with the base year of 1978. (2) In the energy calculation, the baseline value of emergy is 9.44 × 1024 sej/a; the average annual rainfall is the observed average value of meteorological observation stations in each region; and all relevant data were obtained from the China Meteorological Science Data Sharing Service. The pollutants include chemical oxygen demand (COD), total phosphorus (TP), and total nitrogen (TN) loss, and this paper refers to Zou et al. [2], Han et al. [6], and Qu et al. [23] for the inventory analysis method. (3) The emergy transformity can be seen in Table 2.
3. Results and Discussion
3.1. Evaluating Agricultural Sustainability Evaluation
3.1.1. Emergy Ecological Footprint
It can be seen from Table 4 that from 1996 to 2017, China’s total agricultural input and total output emergy showed an increasing trend. The input emergy increased from 3.49 × 10²³ sej in 1996 to 4.10 × 10²³ sej in 2017, an increase of 17.48%. The total output emergy increased from 5.47 × 10²³ sej to 7.43 × 10²³ sej, an increase of 35.83%.
Table 4.
Results of accounting for agroeconomic ecosystem emergy in China, 1996–2017. (Unit: sej).
In 1996, renewable resources accounted for 57.82% of the total input emergy, of which 85.73% came from renewable natural resources. In 2017, the proportion of renewable resources in emergy decreased to 49.93%, but the proportion of renewable natural resources in emergy rose to 91.35%, mainly because the input of purchased renewable energy decreased year by year. In contrast to the renewable resource emergy income, the proportion of non-renewable resources emergy input has increased year by year, accounting for 41.95% of the total input emergy in 1996, and reached a peak of 53.02% in 2011. Although the share declined thereafter, it remained high at 50.12% in 2017, indicating that China relies mainly on non-renewable resources to drive its agricultural economic growth. In the non-renewable resource emergy input, the purchased non-renewable emergy input (machinery, fertilizers, pesticides, diesel fuel, and agricultural film) accounted for more than 80%.
From 1996 to 2017, the emergy of agricultural products increased from 5.22 × 10²³ sej to 7.13 × 10²³ sej, an increase of 36.59%. Its proportion in total output emergy () first dropped from 95.42% in 1996 to 94.66% in 2003, and then rose to 95.89% in 2017. Relatively speaking, the pollutant emergy output increased from 2.5 × 10²² sej to 3.06 × 10²² sej, an increase of 22.4%, which was lower than the growth rate of the emergy of agricultural products. Its proportion in total output emergy () first increased from 4.58% in 1996 to 5.38% in 2003, and then decreased year by year to 4.11% in 2017.
3.1.2. Emergy Yield Rate (EYR)
The Emergy Yield Rate (EYR) represents the contribution of purchased external resources to the agroecosystem, with higher values indicating greater contributions. The minimum EYR value is 1, which means that the system cannot utilize local resources and can only convert the resources of the previous process [34]. In Table 5, the overall EYR of China’s agriculture is 3.2199, which is far greater than 1. This means that the purchased external resources have a positive contribution to China’s agroecological economic system. At the same time, the EYR of this paper is larger than the 1.19–2.35 estimated by Wang et al. [34], 2.08–2.18 estimated by Jiang et al. [28], and 2.16–2.975 estimated by Xie et al. [22]. This may be due to the fact that this paper uses cropping industry data at the level of 306 cities in China, rather than the single region (province, city, and county) or single agricultural product data that the existing research focuses on. In addition, the EYR of the central region is 3.6725, which is higher than that of the western (3.5191) and eastern (2.6118) regions, which means that the output of the agricultural production system in the central region is more efficient and competitive. This is because most of the central provinces are the main grain-producing areas in China (Heilongjiang, Jiangxi, Hunan, Anhui, Inner Mongolia, Hubei, Henan, and Jilin) and undertake the task of ensuring food security. As a result, the central region will increase grain production by investing in modern elements such as machinery, fertilizers, and pesticides.
Table 5.
Regional comparison results on agricultural sustainability in China, 1996–2017.
The trend in EYR (Figure 2) shows a general trend of decreasing (1996–2003) and then increasing (2003–2017). During 1996–2003, China’s labor outflow accelerated and fertilizer continued to grow, which led to a decline in EYR. In 2003–2017, China’s agricultural trade shifted from surplus to deficit, and food security gradually gained government concern, such as the full abolition of agricultural taxes and encouragement of agricultural investment in 2006. In addition, since 2015, the Chinese government has issued a series of policies related to green development, hoping to reverse the unsustainable situation of agricultural development. It is worth noting that, relative to the central and western regions, the EYR in the eastern region is significantly lower, indicating that the agricultural sustainability in eastern China to convert external resources into usable resources is lower than that of other regions, and even lower than the national level. This is mainly because the main development in the eastern region is industry and commerce, and the proportion of agriculture is relatively small.
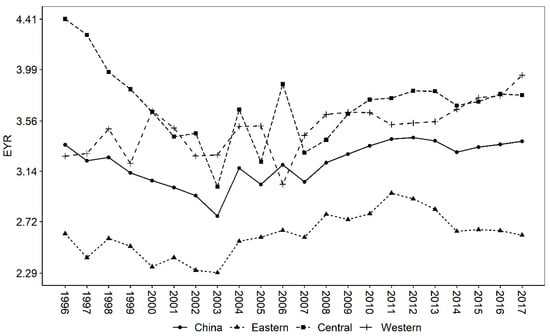
Figure 2.
Trends in China’s agricultural EYR, 1996–2017.
3.1.3. Environmental Load Rate (ELR)
The environmental load rate (ELR) is primarily used to measure the pressure on the ecosystem caused by agricultural production. The concept of environmental load suggests that once a resource is used for this environmental service, it cannot be used for other processes [34,35,36]. A larger ELR indicates that agricultural production uses more non-renewable resources relative to renewable resources [18,34,36]. It can be seen from Table 5 that the ELR is relatively small at 0.9035, indicating a greater use of renewable resources in Chinese agriculture. However, in terms of regional comparisons, the ELR is higher in the eastern region (1.0520) than in the central (0.8734) and western (0.7483) regions. This indicates that agriculture in the eastern has greater use of resources and environmental pressures.
The trend in ELR (Figure 3) shows an upward trend, indicating that China’s agricultural growth has been driven mainly by the input of large amounts of non-renewable resources, which has led to an increase in environmental loading pressure year by year. According to relevant studies, during the period 1978–2016, the total amount of fertilizer use in China increased by nearly 6 times [37], accounting for more than 1/3 of global fertilizer use. In addition, agriculture is also the largest water user in China, accounting for 62.6% and 63.1% of the total national water withdrawal in 2001 and 2015, respectively. However, the water use coefficient of irrigated agriculture is only 0.3–0.4, which is much lower than 0.7–0.8 in developed countries [38]. In terms of regional comparisons, the agricultural environmental loading pressure is highest in the eastern region, followed by the central region, and is lowest in the western region. This paper suggests that the possible reasons for this are as follows. On the one hand, most of the western region is utilized for livestock industry due to geological, climatic, and historical factors, while this paper mainly examines the plantation industry and does not include livestock inputs, which may underestimate the inputs of non-renewable resources in the western region, resulting in a low ELR. On the other hand, the relatively low level of economic development in western China does not allow it to afford more modern agricultural inputs such as machinery, fertilizers, and pesticides, which would also make the ELR lower in the western region.
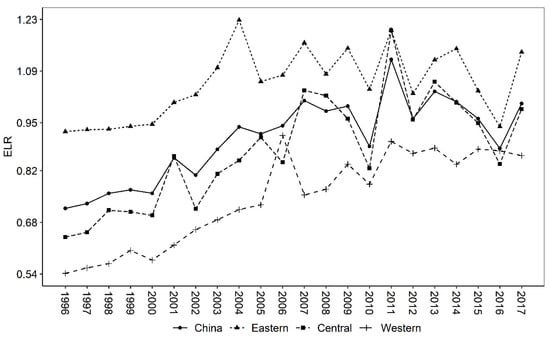
Figure 3.
Trends in China’s agricultural ELR, 1996–2017.
3.1.4. Emergy Sustainability Index (ESI)
The emergy sustainability index (ESI) is mainly used to evaluate the sustainable development capability of the system from the perspective of emergy. The higher the value, the greater the sustainable development capability (Wang et al., 2014). It can be seen from Table 5 that China’s ESI is 3.5637, indicating that China’s overall agricultural sustainable development capability is strong. From the perspective of regional comparison, the ESI in the western region is the largest (4.7027), followed by the central region (4.204), and the smallest is the eastern region at only 2.4868, which is lower than the national level.
The trend in ESI (Figure 4) shows a downward trend, from 4.68 in 1996 to 3.38 in 2017, indicating that China’s agricultural sustainability is decreasing year by year. In terms of regional comparisons, the ESI in the eastern region is the lowest, mainly due to insufficient EYR and high ELR. The central and western regions, on the other hand, have comparable ESI, but for different reasons. The central region is mainly due to a higher EYR than the western region, while the western region is mainly due to a lower ELR than the central region.
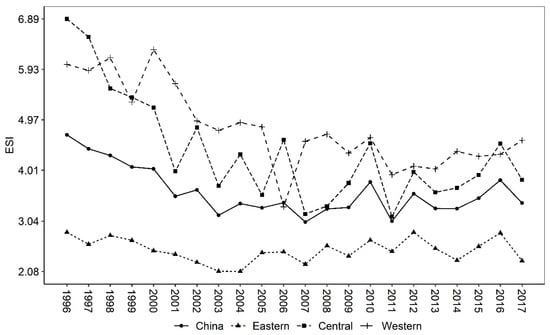
Figure 4.
Trends in China’s agricultural ESI, 1996–2017.
3.1.5. EYR, ELR, and ESI
As can be seen from Table 6, the top five provinces with the highest EYR rankings are Heilongjiang (9.109), Xinjiang (9.109), Jiangxi (5.5919), Tibet (5.011), and Hebei (4.7778). The top five provinces with the smallest ELR are Guizhou (0.3317), Jiangxi (0.4268), Hunan (0.4285), and Guangxi (0.4486). The top five provinces with the largest ESI were Heilongjiang (14.1143), Jiangxi (13.1026), Hunan (10.6817), Guizhou (8.3695), and Sichuan (7.0272). Among them, Heilongjiang is mainly due to the highest EYR ranking, while Guizhou is mainly due to the highest ELR ranking. Finally, this paper finds that Hainan has the smallest EYR at 0.8374, indicating that Hainan’s external resource utilization capacity is insufficient. Shanxi has the largest ELR at 3.6669, indicating that Shanxi’s agricultural environment is under greater pressure. Ningxia has the smallest ESI at 0.3556, indicating that Ningxia has the weakest capacity for sustainable agricultural development.
Table 6.
The provincial comparison results of China’s agricultural sustainability.
3.2. Accounting of Agricultural Environmental Cost and Green GDP
3.2.1. Environmental Cost
Using the aforementioned method, this paper calculated the environmental cost of agricultural production in 306 cities in China from 1996–2017. The results are shown in Table 7. From 1996 to 2017, the average environmental cost of China’s agriculture was about 31.5 billion yuan, accounting for 5.59% of the GDP of traditional agriculture. This shows that ignoring the adverse effects of agricultural production on the ecological environment will overestimate the performance of extensional growth and mislead the formulation of China’s agricultural sustainable development policies. In terms of the composition of environmental loss, the cost of land loss is the largest, as high as 15.21 billion yuan, accounting for 48.23% of the total environmental cost. The TN loss cost is as high as 14.809 billion yuan, accounting for 46.96%. Finally, TP and COD leakage costs are relatively small, at 1.258 billion yuan and 26 billion yuan, respectively. In terms of time trends, the total environmental erosion cost showed an upward and then downward trend. The period of 1996–2014 was the upward phase, from 26.7974 billion yuan to 44.8182 billion yuan; after 2015 was the downward phase, and the total environmental erosion cost was 40.9686 billion yuan by 2017. The possible reason for this is that from 2015 onwards, the Chinese government issued a series of policies on sustainable agricultural development.
Table 7.
China’s agricultural environmental cost, 1996–2017.
3.2.2. Agricultural Green GDP
The trends in traditional agricultural GDP and green agricultural GDP (Figure 5) show an upward trend from 1996 to 2017. The traditional agricultural GDP rose from 480.685 billion yuan in 1996 to 756.28 billion yuan in 2017, an increase of 57.33%. In addition, green agriculture grew faster, from 453.888 billion yuan in 1996 to 715.311 billion yuan in 2017, an increase of 57.6%. This shows that green GDP grows faster than traditional GDP, and the gap between them tends to narrow.
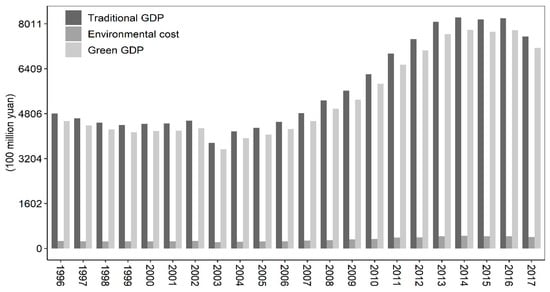
Figure 5.
Traditional GDP, environmental cost, and green GDP, 1996–2017.
From the rate of green GDP to traditional GDP (Figure 6), China’s agricultural growth can be roughly divided into two stages. During the period from 1996 to 2003, the rate of green agricultural GDP/traditional agricultural GDP dropped rapidly, from 0.9443 to 0.9393, indicating that the cost of environmental erosion of agricultural resources in China has increased year by year. After 2003, the rate showed a fluctuating upward trend, rising from 0.9393 to 0.9458, indicating that the cost of environmental loss of agricultural resources in China has been decreasing year by year.
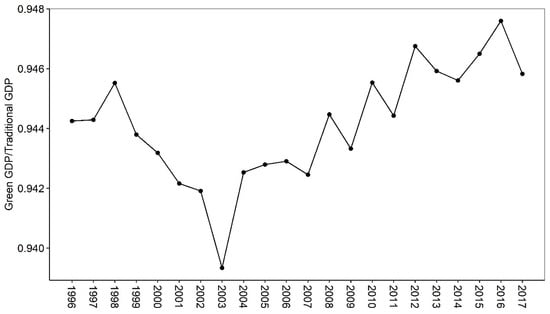
Figure 6.
Trends in the rate of China’s agricultural green GDP to traditional GDP, 1996–2017.
As shown in Table 8, from 1996 to 2017, the five provinces with the highest agricultural green GDP/traditional GDP were Tibet (0.982), Sichuan (0.97), Ningxia (0.965), Guangdong (0.962), and Anhui (0.96). Among them, three provinces are in the western, and one is in the eastern and central regions. In addition, this paper finds that Hebei has the lowest rate of only 0.858, followed by Shandong at 0.893. This shows that, compared with the central and western regions, the ecological and environmental costs of agricultural production in the eastern region are heavier. It seems that the lower the production intensity, the better the environmental rating. This is consistent with the law of diminishing input efficiency. Additionally, Tibet and Ningxia are located in western China, and most of these areas are utilized for livestock due to geological, climatic, and historical factors, while this paper mainly examines the planting industry and does not include pollution from pastoralism, thus possibly overestimating green GDP.
Table 8.
Rate of agricultural green GDP to traditional GDP for 27 provinces in China.
4. Conclusions
This paper uses the emergy analysis method to estimate the agricultural sustainability and green GDP of 306 cities in China from 1996 to 2017. The main conclusions can be summarized as follows.
Firstly, China mainly relies on non-renewable resources to drive agricultural economic growth. Although the proportion of pollution energy output has declined, the total amount is still on the rise. Specifically, the proportion of renewable emergy decreased year by year, while the proportion of non-renewable resource emergy input increased year by year. In the non-renewable resource emergy input, the purchased non-renewable emergy input (machinery, fertilizers, pesticides, diesel oil, and agricultural film) is much higher than the land loss emergy. From the comparison of emergy output, the growth rate of emergy value of agricultural products is slightly higher than that of pollution emergy value. The proportion of pollution emergy to total output emergy experienced two stages of first rising (1996–2003) and then decreasing (2003–2017). Secondly, China’s agricultural sustainable development capacity is generally good, but it shows a trend of deteriorating year by year. Specifically, China’s agricultural emergy yield rate (EYR) is generally greater than 1, and decreases in sequence along the central, western, and eastern regions. In terms of changes in EYR, it shows a trend of decreasing (1996–2003) and then increasing (2003–2017). In contrast, because China mainly drives agricultural growth by investing a large amount of non-renewable resources, the environmental load rate (ELR) is increasing year by year, which in turn leads to a yearly decline in China’s agricultural sustainability index (ESI). Thirdly, the gap between China’s agricultural green GDP and traditional GDP shows a U-shaped trend that first widens and then narrows. During the period from 1996 to 2003, the gap between green GDP and traditional GDP increased year by year; from 2003 to 2017, the gap between the two was narrowed year by year. Overall, during 1996–2017, the environmental cost of agriculture in China was about 5.6%, which is very close to the 6% estimated by Tang et al. [3].
Based on the above conclusions, the policy implications of this paper are as follows. Firstly, transforming the crude development of agriculture and increasing green technology innovation and promotion are priorities in agricultural sustainable policy development. The conclusion shows that China mainly relies on non-renewable resources to drive agricultural economic growth, and the inefficient use of non-renewable resources will cause serious agricultural nonpoint source pollution. Therefore, it is necessary to reduce the cost of agricultural resources through advanced technology and factor substitution, such as the promotion of soil testing formula technology, biological pesticide production technology, degradable or reusable film production technology, and shallow burial drip irrigation technology. Secondly, the vigorous development of circular agriculture and promotion of the comprehensive utilization of agricultural waste should be pursued. Agricultural waste is one of the main sources of agricultural nonpoint source pollution. Therefore, research on how to recycle agricultural waste is an inevitable requirement for the sustainable development of China’s agriculture. It is generally believed that planting industry waste and animal manure and residues discharged from aquaculture are major agricultural nonpoint source polluters. Therefore, a combination of planting and aquaculture can be used to balance planting and breeding, turning waste into treasure to realize resource reuse, improve resource utilization efficiency, and reduce pollution emissions. Thirdly, construction of an agricultural green economic indicator accounting system and the consolidation of the “green GDP” assessment mechanism should be priority developments. The cost of China’s agricultural environment is about 5.6% of agricultural GDP, indicating that the traditional accounting system will overestimate China’s agricultural economic development performance. The current “promotion tournament” assessment mechanism for cadres focuses too much on traditional economic development indicators, ignoring the negative impact of sloppy development on the ecological environment. Therefore, the existing local performance appraisal system should be reformed to include environmental weighting in the appraisal system, consolidate leadership responsibilities, and guide local governments to shift from a focus on economic development to a focus on both economic growth and environmental quality improvement, which will truly engage local governments in regional governance.
This paper may have some limitations. Firstly, this paper only focuses on the planting industry, and has not taken livestock breeding into account. Animal husbandry not only generates more greenhouse gases, but it also has a negative impact on the ecological environment if animal waste is not properly treated, which is not conducive to the improvement of agricultural green GDP. Secondly, the Chinese government promises to strive to achieve peak CO2 emissions by 2030 and carbon neutrality by 2060. Although industry is the source of greenhouse gases, rapid development of agriculture also plays an important role, and the carbon emissions caused each year should not be underestimated. In the future, we can consider the relationship between resource misallocation and agricultural carbon emissions.
Author Contributions
J.H. and X.Z. conceived and designed the research question. J.H. constructed the models and analyzed the optimal solutions. J.L. and X.Z. wrote the paper. J.H. reviewed and edited the manuscript. All authors have read and agreed to the published version of the manuscript.
Funding
This research received no external funding.
Institutional Review Board Statement
Not applicable.
Informed Consent Statement
Not applicable.
Data Availability Statement
The data that support the findings of this study are available from the corresponding author upon reasonable request.
Acknowledgments
The authors are grateful to the anonymous reviewers who provided valuable comments and suggestions to significantly improve the quality of the paper.
Conflicts of Interest
The authors declare no conflict of interest. There is no professional or other personal interest of any nature or kind in any product, service, and/or company that could be construed as influencing the position presented in, or the review of, the manuscript.
References
- Ministry of Agriculture of The People’s Republic of China. The National Agricultural Sustainable Development Plan (2015–2030) (Beijing); Ministry of Agriculture of The People’s Republic of China: Beijing, China, 2015.
- Zou, L.; Liu, Y.; Wang, Y.; Hu, X. Assessment and analysis of agricultural non-point source pollution loads in China: 1978–2017. J. Environ. Manag. 2020, 263, 110400. [Google Scholar] [CrossRef] [PubMed]
- Tang, K.; Gong, C.; Wang, D. Reduction potential, shadow prices, and pollution costs of agricultural pollutants in China. Sci. Total Environ. 2016, 541, 42–50. [Google Scholar] [CrossRef] [PubMed]
- The World Bank State Enviromental Protecction Administration Cost of Pollution in China: Economic Estimates of Physical Damages; The World Bank: Washington, DC, USA, 2007; p. 86.
- Han, H.; Zhong, Z.; Wen, C.; Sun, H. Agricultural environmental total factor productivity in China under technological heterogeneity: Characteristics and determinants. Environ. Sci. Pollut. Res. 2018, 25, 32096–32111. [Google Scholar] [CrossRef] [PubMed]
- Han, H.; Ding, T.; Nie, L.; Hao, Z. Agricultural eco-efficiency loss under technology heterogeneity given regional differences in China. J. Clean. Prod. 2020, 250, 119511. [Google Scholar] [CrossRef]
- Xu, B.; Chen, W.; Zhang, G.; Wang, J.; Ping, W.; Luo, L.; Chen, J. How to achieve green growth in China’s agricultural sector. J. Clean. Prod. 2020, 271, 122770. [Google Scholar] [CrossRef]
- He, Q.; Han, J.; Guan, D.; Mi, Z.; Zhao, H.; Zhang, Q. The comprehensive environmental efficiency of socioeconomic sectors in China: An analysis based on a non-separable bad output SBM. J. Clean. Prod. 2018, 176, 1091–1110. [Google Scholar] [CrossRef]
- He, J.; Wan, Y.; Feng, L.; Ai, J.; Wang, Y. An integrated data envelopment analysis and emergy-based ecological footprint methodology in evaluating sustainable development, a case study of Jiangsu Province, China. Ecol. Indic. 2016, 70, 23–34. [Google Scholar] [CrossRef]
- Hoang, V.; Alauddin, M. Input-Orientated Data Envelopment Analysis Framework for Measuring and Decomposing Economic, Environmental and Ecological Efficiency: An Application to OECD Agriculture. Environ. Resour. Econ. 2012, 51, 431–452. [Google Scholar] [CrossRef]
- Hoang, V. Measuring and decomposing changes in agricultural productivity, nitrogen use efficiency and cumulative exergy efficiency: Application to OECD agriculture. Ecol. Model. 2011, 222, 164–175. [Google Scholar] [CrossRef]
- Hoang, V.; Alauddin, M. Analysis of agricultural sustainability: A review of exergy methodologies and their application in OECD countries. Int. J. Energy Res. 2011, 35, 459–476. [Google Scholar] [CrossRef]
- Hoang, V.; Rao, D.S.P. Measuring and decomposing sustainable efficiency in agricultural production: A cumulative exergy balance approach. Ecol. Econ. 2010, 69, 1765–1776. [Google Scholar] [CrossRef]
- Schüpbach, B.; Roesch, A.; Herzog, F.; Szerencsits, E.; Walter, T. Development and application of indicators for visual landscape quality to include in life cycle sustainability assessment of Swiss agricultural farms. Ecol. Indic. 2020, 110, 105788. [Google Scholar] [CrossRef]
- De Luca, A.I.; Falcone, G.; Stillitano, T.; Iofrida, N.; Strano, A.; Gulisano, G. Evaluation of sustainable innovations in olive growing systems: A Life Cycle Sustainability Assessment case study in southern Italy. J. Clean. Prod. 2018, 171, 1187–1202. [Google Scholar] [CrossRef]
- Roesch, A.; Nyfeler-Brunner, A.; Gaillard, G. Sustainability assessment of farms using SALCAsustain methodology. Sustain. Prod. Consum. 2021, 27, 1392–1405. [Google Scholar] [CrossRef]
- Odum, H.T. Environmental Accounting: Emergy and Environmental Decision Making; Wiley: Hoboken, NJ, USA, 1996; Volume 43. [Google Scholar]
- Brown, M.T.; Ulgiati, S. Emergy Analysis and Environmental Accounting. In Encyclopedia of Energy; Cleveland, C.J., Ed.; Elsevier: New York, NY, USA, 2004; pp. 329–354. [Google Scholar]
- Liu, Z.; Wang, Y.; Geng, Y.; Li, R.; Dong, H.; Xue, B.; Yang, T.; Wang, S. Toward sustainable crop production in China: An emergy-based evaluation. J. Clean. Prod. 2019, 206, 11–26. [Google Scholar] [CrossRef]
- Zhuang, M.; Liu, Y.; Yang, Y.; Zhang, Q.; Ying, H.; Yin, Y.; Cui, Z. The sustainability of staple crops in China can be substantially improved through localized strategies. Renew. Sustain. Energy Rev. 2022, 154, 111893. [Google Scholar] [CrossRef]
- Liu, Z.; Wang, S.; Xue, B.; Li, R.; Geng, Y.; Yang, T.; Li, Y.; Dong, H.; Luo, Z.; Tao, W.; et al. Emergy-based indicators of the environmental impacts and driving forces of non-point source pollution from crop production in China. Ecol. Indic. 2021, 121, 107023. [Google Scholar] [CrossRef]
- Xie, H.; Huang, Y.; Choi, Y.; Shi, J. Evaluating the sustainable intensification of cultivated land use based on emergy analysis. Technol. Forecast. Soc. 2020, 120449. [Google Scholar] [CrossRef]
- Qu, Y.; Zhang, Q.; Zhan, L.; Jiang, G.; Si, H. Understanding the nonpoint source pollution loads’ spatiotemporal dynamic response to intensive land use in rural China. J. Environ. Manag. 2022, 315, 115066. [Google Scholar] [CrossRef]
- Wang, Q.; Ma, Z.; Ma, Q.; Liu, M.; Yuan, X.; Mu, R.; Zuo, J.; Zhang, J.; Wang, S. Comprehensive evaluation and optimization of agricultural system: An emergy approach. Ecol. Indic. 2019, 107, 105650. [Google Scholar] [CrossRef]
- Su, Y.; He, S.; Wang, K.; Shahtahmassebi, A.R.; Zhang, L.; Zhang, J.; Zhang, M.; Gan, M. Quantifying the sustainability of three types of agricultural production in China: An emergy analysis with the integration of environmental pollution. J. Clean. Prod. 2020, 252, 119650. [Google Scholar] [CrossRef]
- Wei, Y.; Li, Y.; Liu, X.; Wu, M. Sustainable development and green gross domestic product assessments in megacities based on the emergy analysis method—A case study of Wuhan. Sustain. Dev. 2020, 28, 294–307. [Google Scholar] [CrossRef]
- Zhang, Q.; Yue, D.; Fang, M.; Yu, Q.; Huang, Y.; Su, K.; Ma, H.; Wang, Y. Study on sustainability of land resources in Dengkou County based on emergy analysis. J. Clean. Prod. 2018, 171, 580–591. [Google Scholar] [CrossRef]
- Jiang, M.M.; Chen, B.; Zhou, J.B.; Tao, F.R.; Li, Z.; Yang, Z.F.; Chen, G.Q. Emergy account for biomass resource exploitation by agriculture in China. Energy Policy 2007, 35, 4704–4719. [Google Scholar] [CrossRef]
- Wang, X.; Shen, J.; Zhang, W. Emergy evaluation of agricultural sustainability of Northwest China before and after the grain-for-green policy. Energy Policy 2014, 67, 508–516. [Google Scholar] [CrossRef]
- Sun, J.; Yuan, X.; Liu, G.; Tian, K. Emergy and eco-exergy evaluation of wetland restoration based on the construction of a wetland landscape in the northwest Yunnan Plateau, China. J. Environ. Manag. 2019, 252, 109499. [Google Scholar] [CrossRef]
- Zhao, Y.; Yang, M.; Ni, H. An emergy-GIS method of selecting areas for sponge-like urban reconstruction. J. Hydrol. 2018, 564, 640–650. [Google Scholar] [CrossRef]
- Baráth, L.; Fertő, I. Productivity and Convergence in European Agriculture. J. Agric. Econ. 2017, 68, 228–248. [Google Scholar] [CrossRef]
- Yuan, L.; Zhang, S.; Wang, S.; Qian, Z.; Gong, B. World agricultural convergence. J. Prod. Anal. 2021, 55, 135–153. [Google Scholar] [CrossRef]
- Wang, X.; Chen, Y.; Sui, P.; Gao, W.; Qin, F.; Zhang, J.; Wu, X. Emergy analysis of grain production systems on large-scale farms in the North China Plain based on LCA. Agric. Syst. 2014, 128, 66–78. [Google Scholar] [CrossRef]
- David, L.H.; Pinho, S.M.; Keesman, K.J.; Garcia, F. Assessing the sustainability of tilapia farming in biofloc-based culture using emergy synthesis. Ecol. Indic. 2021, 131, 108186. [Google Scholar] [CrossRef]
- Cavalett, O.; Queiroz, J.F.D.; Ortega, E. Emergy assessment of integrated production systems of grains, pig and fish in small farms in the South Brazil. Ecol. Model 2006, 193, 205–224. [Google Scholar] [CrossRef]
- Wang, X.; Shao, S.; Li, L. Agricultural inputs, urbanization, and urban-rural income disparity: Evidence from China. China Econ. Rev. 2019, 55, 67–84. [Google Scholar] [CrossRef]
- Zhang, B.; Jin, P.; Qiao, H.; Hayat, T.; Alsaedi, A.; Ahmad, B. Exergy analysis of Chinese agriculture. Ecol. Indic. 2019, 105, 279–291. [Google Scholar] [CrossRef]


Publisher’s Note: MDPI stays neutral with regard to jurisdictional claims in published maps and institutional affiliations. |
© 2022 by the authors. Licensee MDPI, Basel, Switzerland. This article is an open access article distributed under the terms and conditions of the Creative Commons Attribution (CC BY) license (https://creativecommons.org/licenses/by/4.0/).