Article

Emission Characteristics of NOx and SO2 during the Combustion of Antibiotic Mycelial Residue

1
School of Ecology and Environment, Beijing Technology and Business University, Beijing 100048, China
2
School of Chemical Engineering, University of Chinese Academy of Sciences, Beijing 100049, China
3
Institute of Process Engineering, Chinese Academy of Sciences, Beijing 100190, China
4
Department of Chemistry and Molecular Biology, University of Gothenburg, 41296 Gothenburg, Sweden
5
Department of Chemical Engineering, Mid Sweden University, 85170 Sundsvall, Sweden
*
Authors to whom correspondence should be addressed.
Int. J. Environ. Res. Public Health 2022, 19(3), 1581; https://doi.org/10.3390/ijerph19031581
Submission received: 30 December 2021 / Revised: 26 January 2022 / Accepted: 27 January 2022 / Published: 29 January 2022

Abstract

:
The antibiotic mycelial residue (AMR) generated from cephalosporin C production is a hazardous organic waste, which is usually disposed of by landfilling that causes potential secondary environmental pollution. AMR combustion can be an effective method to treat AMR. In order to develop clean combustion technologies for safe disposal and energy recovery from various AMRs, the emission characteristics of NOx and SO2 from AMR combustion were studied experimentally in this work. It was found that the fuel-N is constituted by 85% protein nitrogen and 15% inorganic nitrogen, and the fuel-S by 78% inorganic sulfur and 22% organic sulfur. Nitrogen oxide emissions mainly occur at the volatile combustion stage when the temperature rises to 400 °C, while the primary sulfur oxide emission appears at the char combustion stage above 400 °C. Increasing the combustion temperature and airflow cause higher NOx emissions. High moisture content in AMR can significantly reduce the NOx emission by lowering the combustion temperature and generating more reducing gases such as CO. For the SO2 emission, the combustion temperature (700 to 900 °C), airflow and AMR water content do not seem to exhibit obvious effects. The presence of CaO significantly inhibits SO2 emission, especially for the SO2 produced during the AMR char combustion because of the good control effect on the direct emission of inorganic SO2. Employing air/fuel staging technologies in combination with in-situ desulfurization by calcium oxide/salts added in the combustor with operation temperatures lower than 900 °C should be a potential technology for the clean disposal of AMRs.

1. Introduction

Antibiotic mycelial residues (AMRs) are the wastes generated from fermentative processes in antibiotics production [1]. Around one million tons of AMRs are generated each year in China—the major antibiotic producer in the world [2]. AMRs mainly consist of mycelia, surplus fermentative substrates, flocculant agents, intermediate metabolites, and residual antibiotics. They were frequently used as animal feed and plant fertilizer due to their high nutrition content [3]. However, AMRs have been listed in the National Catalog of Hazardous Wastes in China since 2008 [4], and various AMRs are forbidden as animal feed and plant fertilizer because residual antibiotics can easily accumulate in animals’ bodies, leading to the emergence of drug resistance [3,5,6].
So far, most AMRs are disposed of by landfilling, which causes potential secondary environmental pollution [7]. Other feasible and mature methods to treat AMRs have not been found; thus, antibiotic production is facing a big challenge. For the safe disposal of AMRs, many technologies are under research and development, including anaerobic digestion [8], hydrothermal treatment [3], microwave treatment [1], pyrolysis [2,9,10], gasification [11,12], combustion [13], and so on. Anaerobic digestion of AMRs is difficult since the residual antibiotics can suppress the microbiological process and even facilitate the development of bacterial antibiotic resistance [14,15]. Hydrothermal treatment (in combination with anaerobic digestion) and microwave treatment can effectively degrade hazardous antibiotics and lower the water content in AMRs [1,3]; however, they can not completely remove the organic materials in AMRs and bring out new challenges for disposing of the remaining solids with other environmental risks. In pyrolysis, solid materials remain to be treated further. In gasification, unmanageable viscous tar is generated. Generally speaking, the above-mentioned technologies are not mature, and the related reaction mechanisms and optimal reaction conditions are not clear [2,11,13].
For the disposal of solid waste from the pharmaceutical industry, combustion is the simplest and most commonly used method around the world. By combustion, solid wastes are safely disposed of, and the energy of the organic materials can be recovered simultaneously [16]. At present, a few antibiotic factories in China have started to employ combustion technology for AMR disposal [13]. AMRs have high N and S contents, which give rise to pollutant emissions from combustion. Many research works in the literature have investigated the N- and S-related emissions. Ma et al. [17,18] found that the combination of hydrothermal pretreatment and air-stage combustion can significantly reduce NO emissions. Zhang et al. [16] simulated the combustion of water-rich AMRs by adding steam to a fluidized bed and showed a clear decrease in NO emission by water vapor addition. On the other hand, SO2 emissions would be kept at a high concentration and might not be affected by steam. Ge et al. [19] also found that water in AMRs can decrease NOx emissions during combustion in a fluidized bed. Jiang et al. [4] observed that the addition of AMRs into municipal waste did not lead to apparent increases in pollutant emissions. Wang et al. [20] investigated ash properties of the co-combustion of AMR with biomass. Gao et al. [21] simulated the co-combustion of AMR and biogas in a grate furnace. So far, many issues related to N and S emission characteristics remain unclear: distributions of N and S species in AMR, correlations between NOx/SO2 emissions with N/S species, detailed effects of combustion parameters, effectiveness of CaO desulfurization during combustion in a fixed bed, as well as effects of moisture in raw AMRs on the NOx and SO2 emissions in comparison to the external steam addition. Thus, further works need to be done to improve combustion technologies for safe disposal and energy recovery from AMRs.
In this study, the N and S species in AMRs were characterized by X-ray photoelectron spectroscopy (XPS), and nitrogen and sulfur oxide emission characteristics during the AMR combustion were investigated by a TGA-MS setup and a fixed bed reactor with respect to the correlations between N/S species and NOx/SO2 emissions. Moreover, the effects of temperature, excess air, CaO addition, and water content of the fuels on the NOx and SO2 emissions were studied in the fixed bed reactor. The mechanism of NOx/SO2 emissions during AMR combustion is clarified, and the effects of NOx/SO2 control methods are evaluated in this work, which provides valuable reference data for the industrial application of AMR combustion.

2. Materials and Methods

2.1. Feedstock

The AMR used in this work was supplied from a cephalosporin C production factory in Hebei Province, China. The moisture content in the raw AMR was about 70 wt.%. The ARM sample was firstly dried at 105 °C for 24 h, then pulverized to small particles, and finally sieved by a 0.2 mm diameter sieve. The results of the ultimate and proximate analyses of the dried AMR are shown in Table 1.
To characterize the composition of the AMR ash, the AMR was burned in an oven at 815 °C for 40 min (consistent with the method of the Chinese national standard of proximate analysis). The remaining ash was measured by an X-ray Fluorescence Spectrometer (XRF), and the results are shown in Table 2.

2.2. TGA-MS and XPS Instruments

A Thermalgravimetric Analyzer (TGA, LABSYS Evo, Setaram, Lyon, France) was connected to a Mass Spectrometer (MS, Tilon GRP Technology Limited, London, UK) [22] in order to simultaneously measure the mass loss and emitted gases (NO, NO2, and SO2) during pyrolysis or combustion of the AMR with increasing temperature. For each test, 10 ± 0.1 mg of the AMR sample was put into an alumina crucible and was subject to a hot gas flow at 100 mL/min with 100% Ar for pyrolysis or with 79% Ar and 21% O2 for combustion. The sample was heated from room temperature to 800 °C at a heating rate of 20 °C/min; the flue gases were detected and relatively quantified by MS.
With respect to the nitrogen and sulfur elements existing in the AMR, an XPS analyzer (ESCALAB250Xi, Thermo Fisher Scientific, Waltham, MA, USA) was used to characterize the related functional groups [18]. For XPS analysis, a sample was, in succession, dried in a vacuum dryer, degassed at 10−7 Pa for 3 h, and neutralized by Ar-ion sputtering. The sample was excited by Monochromatic Al K Alpha (350 W, hv = 1486.8 eV) X-ray. All spectra were obtained at 20 eV of pass energy in the fixed transmission mode. The resolution and analysis areas were 0.05 eV and 0.8 mm2, respectively. The analysis was automatically performed at 3–5 different positions on the surface to obtain high-quality N 1s and S 2p spectra.

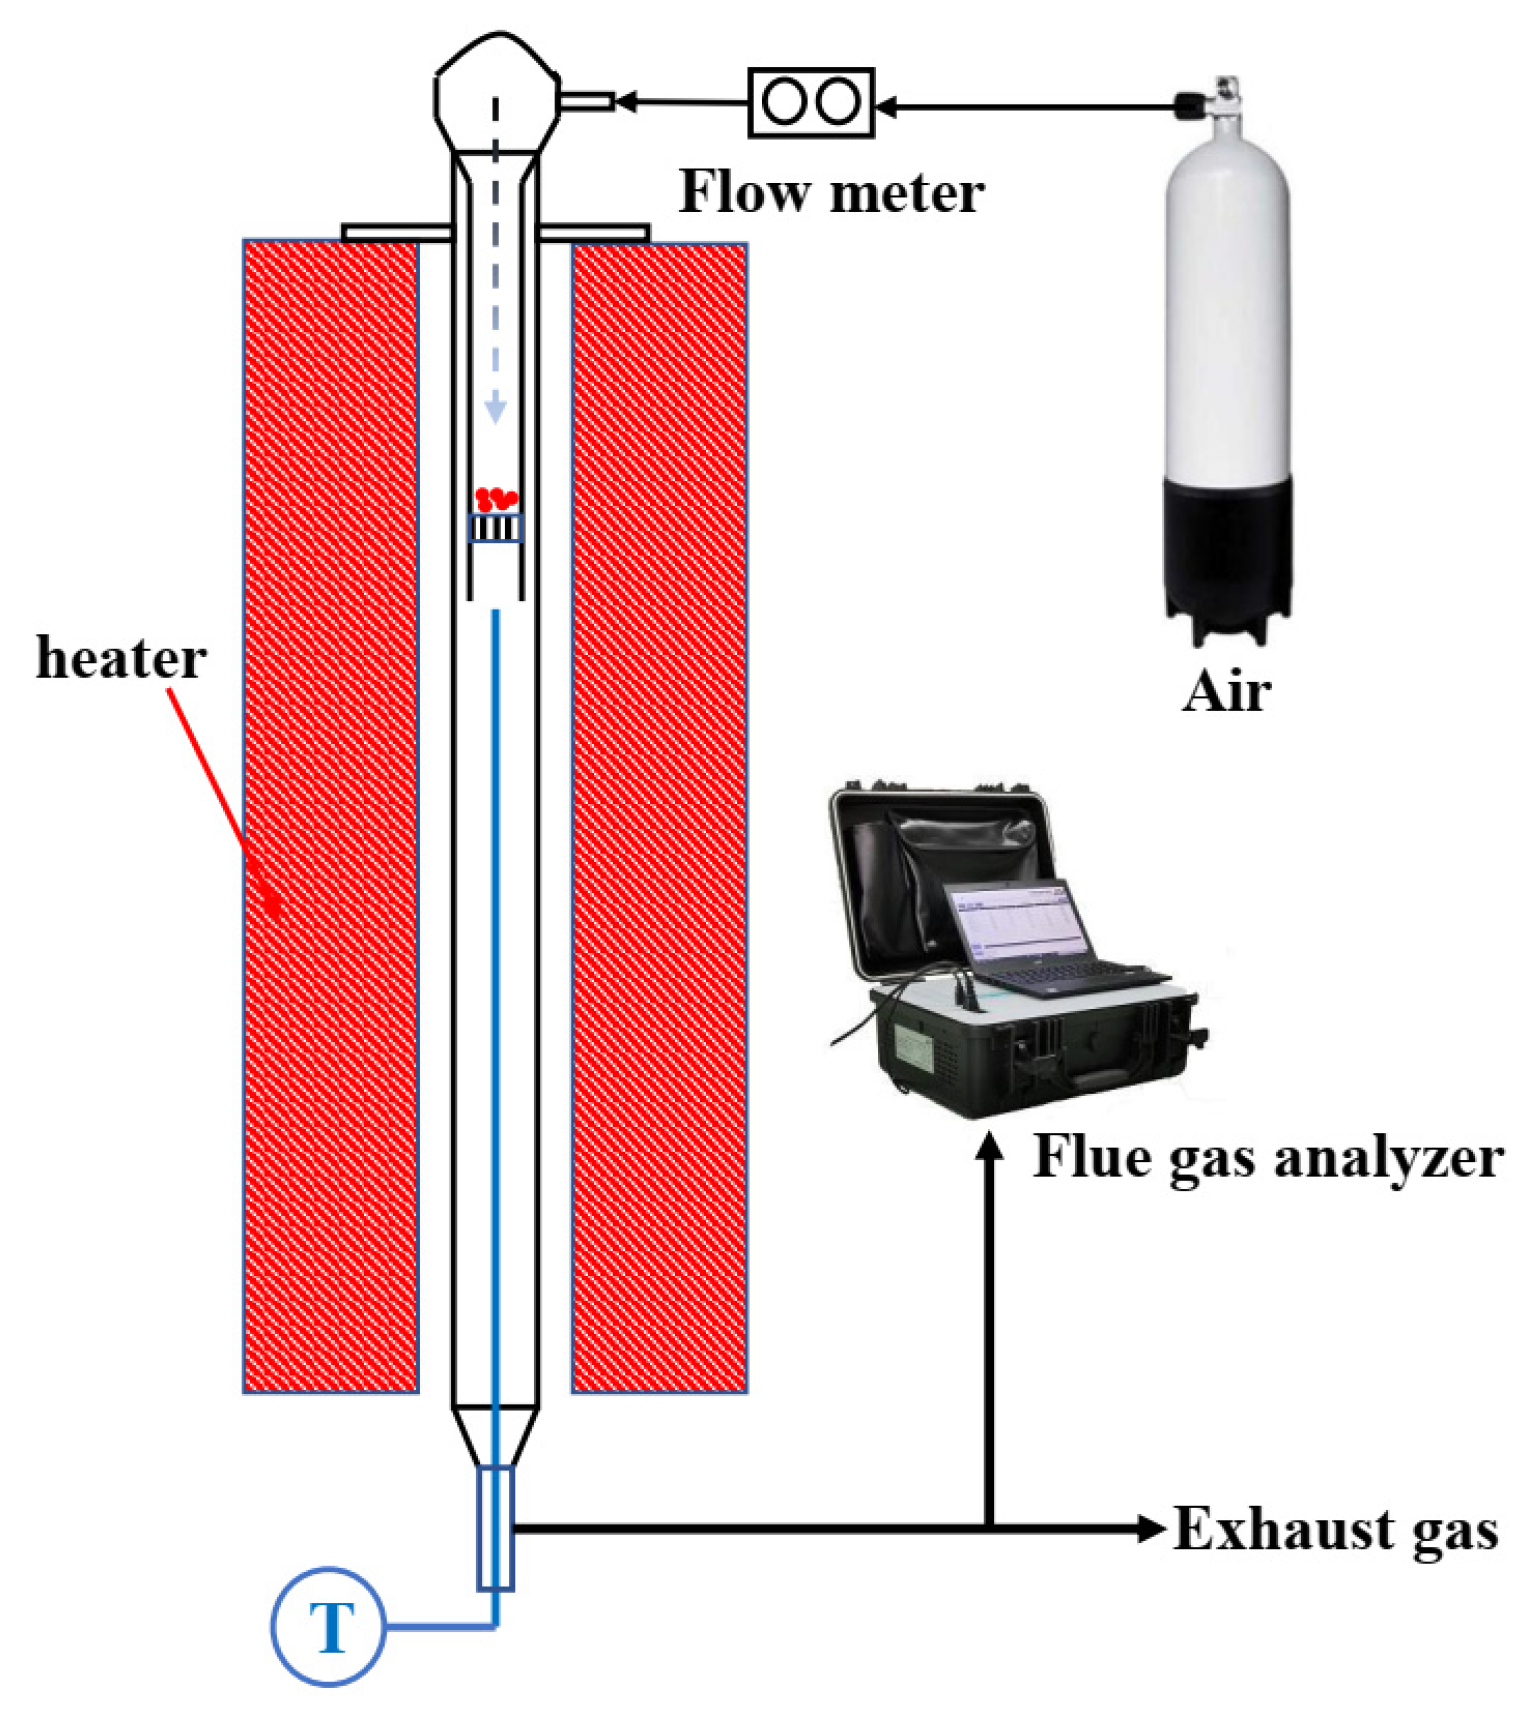
2.3. Fixed Bed Combustor

The combustion tests were conducted in a fixed bed, which can be heated by an external electric heater, as shown in Figure 1. It consists of a fixed bed, a gas supply system, and a flue gas analyzer. The fixed bed consists of two parts, an inner reactor, and an outer reactor. The outer reactor is a quartz tube with a length of 70 cm, which provides enough long residence time for volatiles to be burned out. A thermocouple is inserted into the outer reactor from the bottom to measure the combustion temperature. The gas outlet is located at the bottom. The inner reactor is a shorter quartz tube with a length of around 25 cm; it has a sintered quartz porous plate at the bottom and a lid with a gas inlet on the top. The gas supply system consists of an air cylinder and a mass flow controller. A flue gas analyzer (Model 3080, Beijing SDL Technology, Beijing, China) equipped with a NOx converter (convert NO2 to NO) is connected to the outlet of the outer reactor to monitor the online concentration of O2, CO2, NOx, and SO2 [16,17,18,19].
For the combustion tests in the fixed bed, 0.25 g AMR was blended with 5 g silica sand to maintain a certain bed height to enhance gas-solid interaction and prevent possible ash agglomeration at the plate during combustion [17]. The well-mixed sample was filled into the inner reactor and evenly tiled on the sintered quartz porous plate. Afterward, the top lid of the inner reactor was closed, and the gas flow was adjusted to the desired values of 1.0, 1.5, 2.0, or 3.0 L/min. Meanwhile, the outer reactor was heated up to the combustion temperature of 700 °C, 800 °C, or 900 °C, and the flue gas analyzer was ready to monitor the gas compositions. Finally, the inner reactor was rapidly inserted into the preheated outer reactor to initiate the AMR combustion. The combustion was completed until no CO/CO2 was released from the sample. Each experimental condition was repeated at least three times to ensure reliability. For CaO additive tests, 0.25 g AMR was blended evenly with 0.025–0.050 g CaO (that was, the Ca/S ratio of 2–4) and then mixed with 5 g silica sand. For the water additive tests, a desired amount of water was sprayed evenly by a small injector on the bed surface before the inner reactor was inserted into the outer reactor to make the water content in the sample reach a certain level of 9.1, 18.2, or 27.3%, respectively.

2.4. Gas Emission Calculation

For NOx, SO2, and CO, the gas emission rates were calculated by the following equation:
E R i = C i 10 6   ×   F 60 × 22.4   ×   1000 M i
where i denotes NOx, SO2, or CO, ERi (mg/s) represents the gas emission rates, Ci (ppm) denotes the instantaneous concentration of each gas given by the flue gas analyzer, F is the total gas flow of 1.0, 1.5, 2.0, or 3.0 L/min, and Mi denotes the molar mass of the corresponding gas (NOx uses the molar mass of NO).
The O2 consumption rate, reflecting the intensity of combustion, was calculated according to Equation (2):
C R = 21     C O 100   ×   F   60   ×   22.4   ×   1000 M O
where CR (mg/s) represents the O2 consumption rates, CO (%) denotes the instantaneous concentration of O2, F is the total flow of gas, and MO indicates the molar mass of O2.
The total emission, EAi (mg), of NOx, SO2, or CO was calculated by Equation (3):
E A i   = 0 T E R i ( t )   d t
where T and t represent the combustion duration and the instantaneous time, respectively.
The conversion ratio, Xi, of N, or S, and the yield of CO, XC were calculated by the following equation:
X i = E A i   ×   c i Mass   ×   f i
where ci (%) is the mass content of N in NO (S in SO2, C in CO). Mass denotes the mass of the added sample, 250 mg, fi (%) is the elemental content (N, S, and C, as shown in Table 1) in the AMR sample.
The ratio of carbon not converted to CO, BC, which represents the burnout ratio of the fuel, was calculated by Equation (5):
B C = 1     X C

3. Results and Discussion

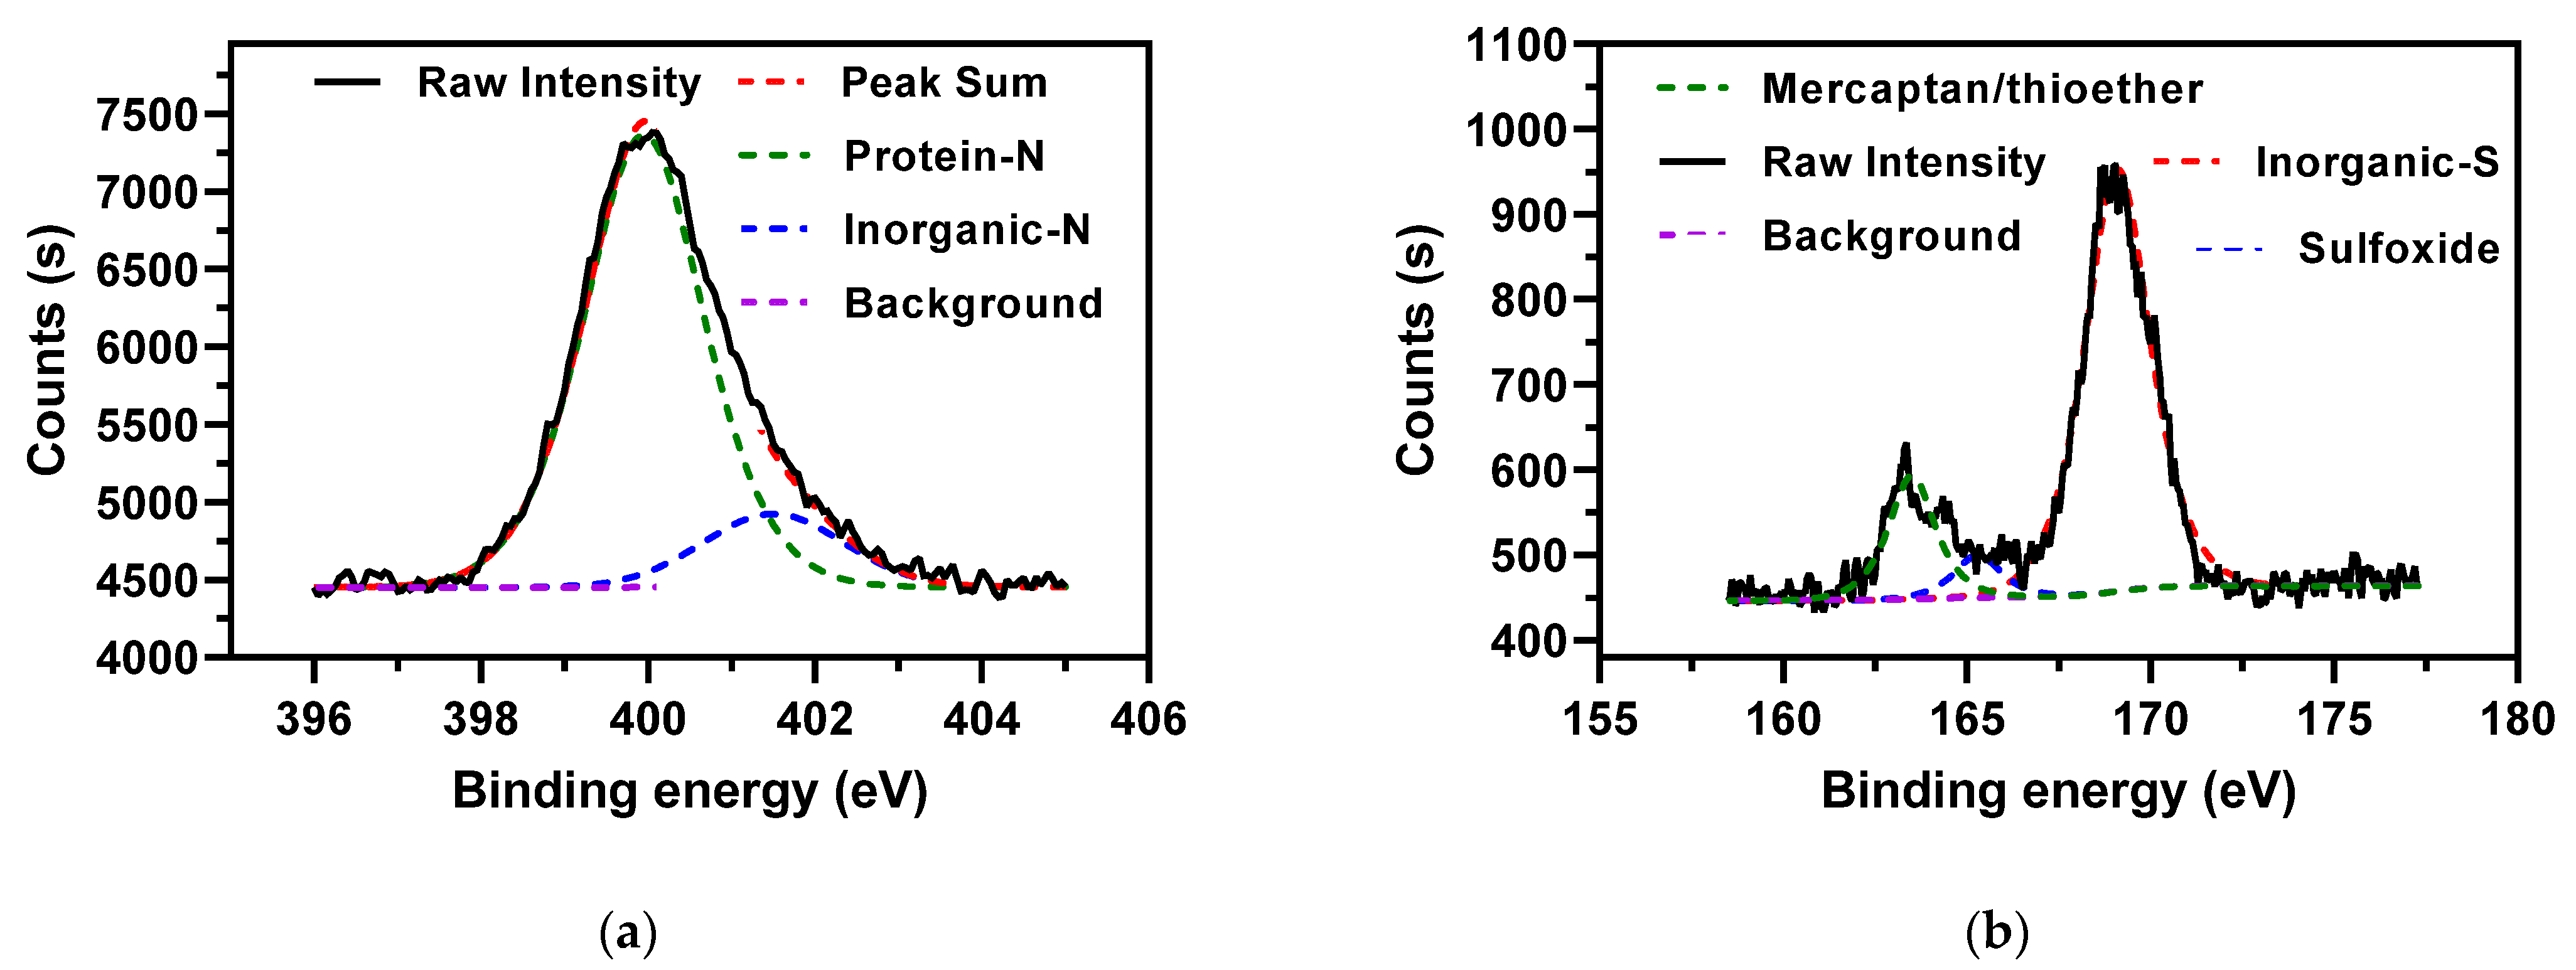
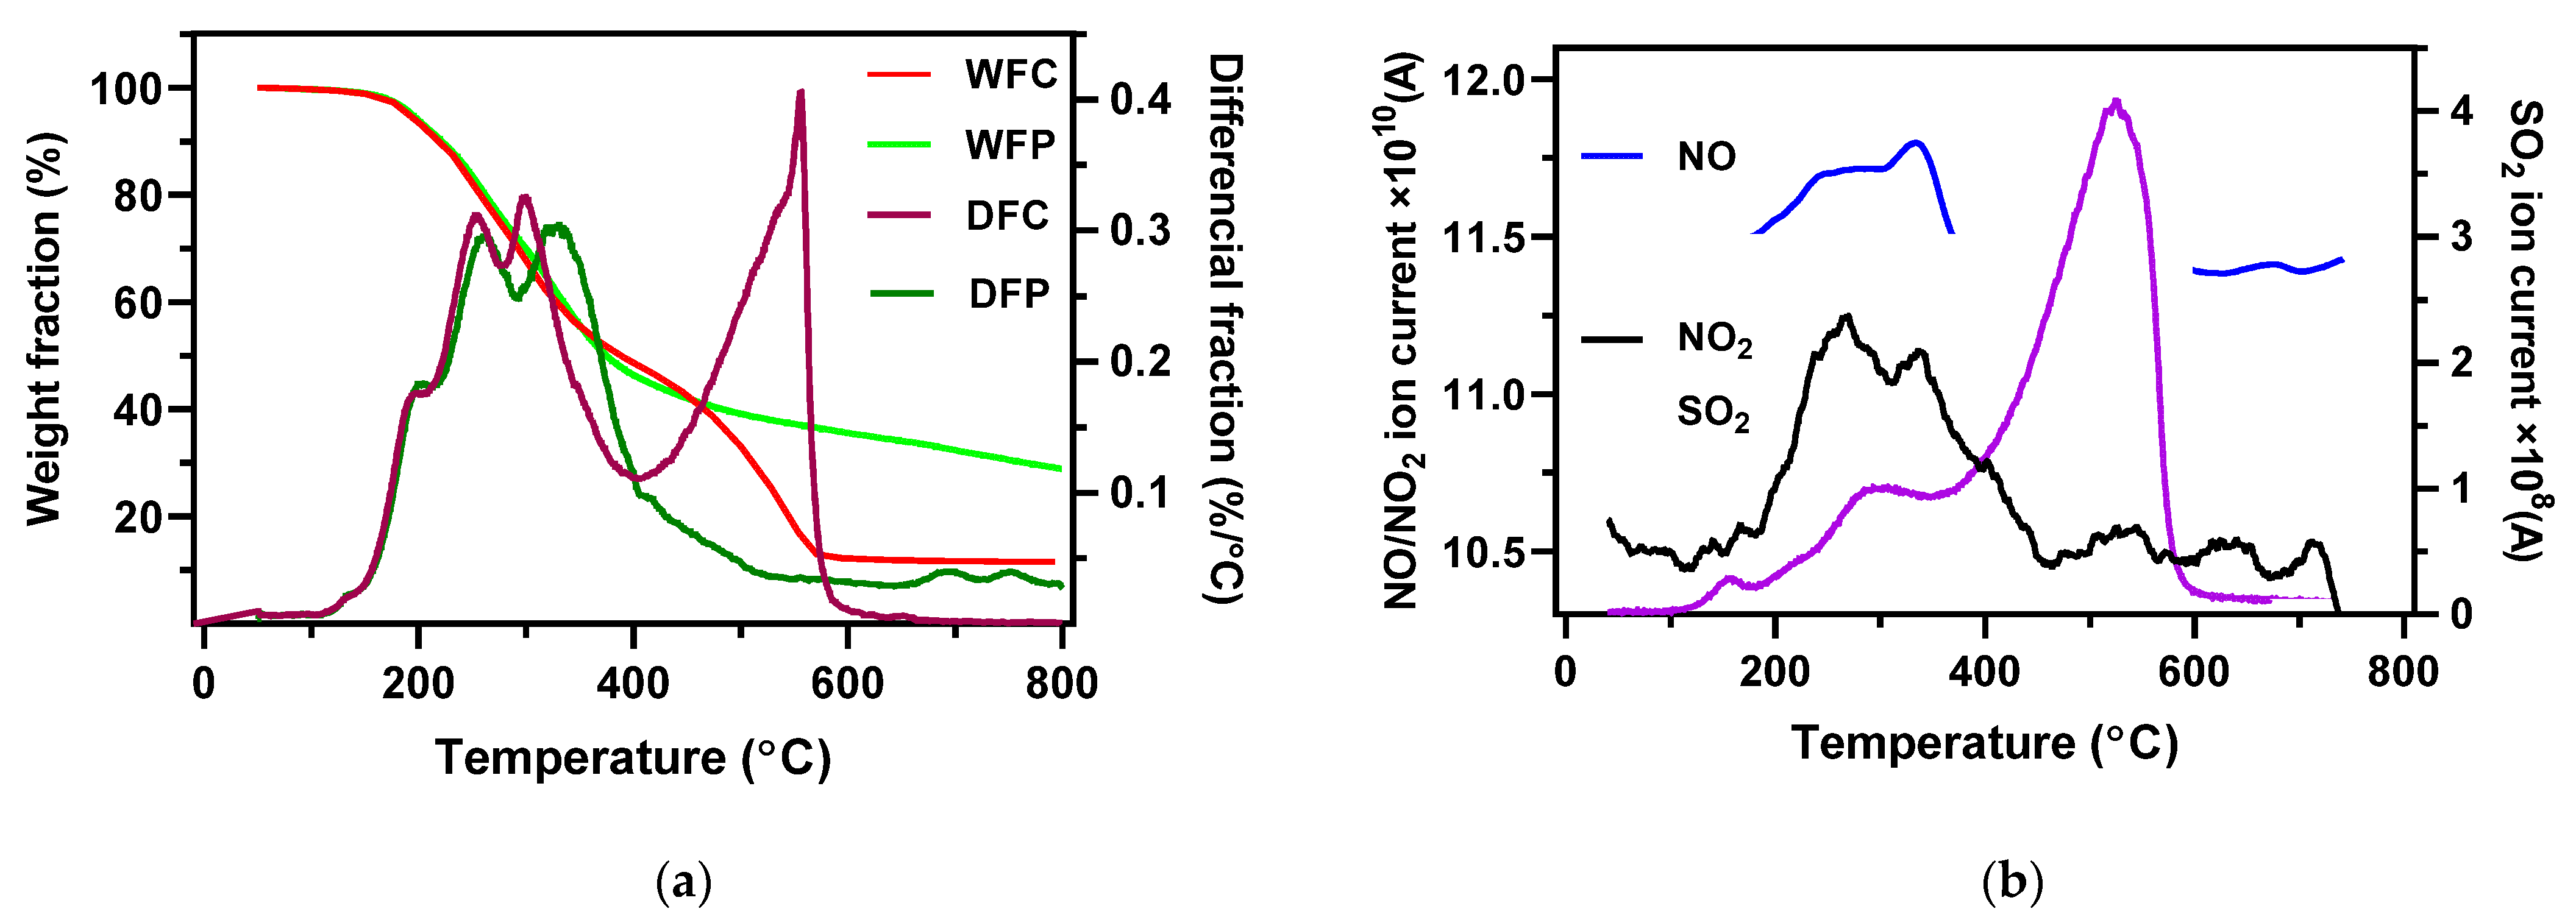
3.1. XPS and TGA-MS Analysis of AMR

The N distributions over their species in the AMR feedstock are shown in Figure 2a and Table 3. The N-containing species in the AMR were dominated by protein nitrogen (399.9 eV) [23,24,25]. Such a high protein nitrogen content was attributed to a large proportion of abandoned fermentative substrates coming from high-protein plants, such as wheat and corn, in antibiotic production [13]. The minor N-containing species were characterized by inorganic nitrogen (401.5 eV) [23,24,25], mostly appearing in the form of NH4+-N [24].
For the S-containing species, the dominant species is inorganic sulfur (169.1 eV, 77.4%) [26], as shown in Figure 2b and Table 3. The other minor S-containing species include mercaptan/thioether (163.5 eV) and sulfoxide (165.3 eV) [26], which account for 16.8% and 5.8% of total sulfur, respectively. The two minor S-containing species were expected to be organic sulfur. However, herbaceous biomass usually has similar contents of organic and inorganic sulfur [27]. The high inorganic sulfur content surely originates from the addition of S-containing salts in the production of antibiotics.
The mass loss of the AMR was registered by TGA against temperature increase, as shown in Figure 3a. The weight loss curves for the pyrolysis and combustion were similar below 400 °C, but highly different above 400 °C. Under the low temperature, AMR started to release volatile matter and was characterized by a typical biomass devolatilization stage for both pyrolysis and combustion [28]. In the case of combustion, char combustion and the decompositions of some inorganic materials in the AMR took place after the devolatilization stage and lost weight further with the second peak seen in the DFC curve.
The NO/NO2 emission trends against temperature present peak emission intensity between 200 and 400 °C, and leveled off above 400 °C, as shown in Figure 3b. These emission trends overlapped with the devolatilization stage, implying that the N-containing species were mainly contained in the volatiles of the AMR. The N-containing species of the AMR, i.e., protein nitrogen and inorganic nitrogen, given in Table 3, were easy to decompose at 200–400 °C [29,30]. Extremely low NO/NO2 emissions at the combustion temperatures above 400 °C suggested that the N-containing groups were not involved in the char formation (mainly by polymerization and cyclization reaction).
Different from NO/NO2 emissions, the SO2 emission trend shows two peaks. The first peak was small at about 300 °C and should be caused by the devolatilization of the AMR; thus, it can be attributed to organic sulfur [27,31]. The main SO2 emission occurred at the char combustion stage, which should be closely linked to the high content of the inorganic sulfur in the AMR [27,31].

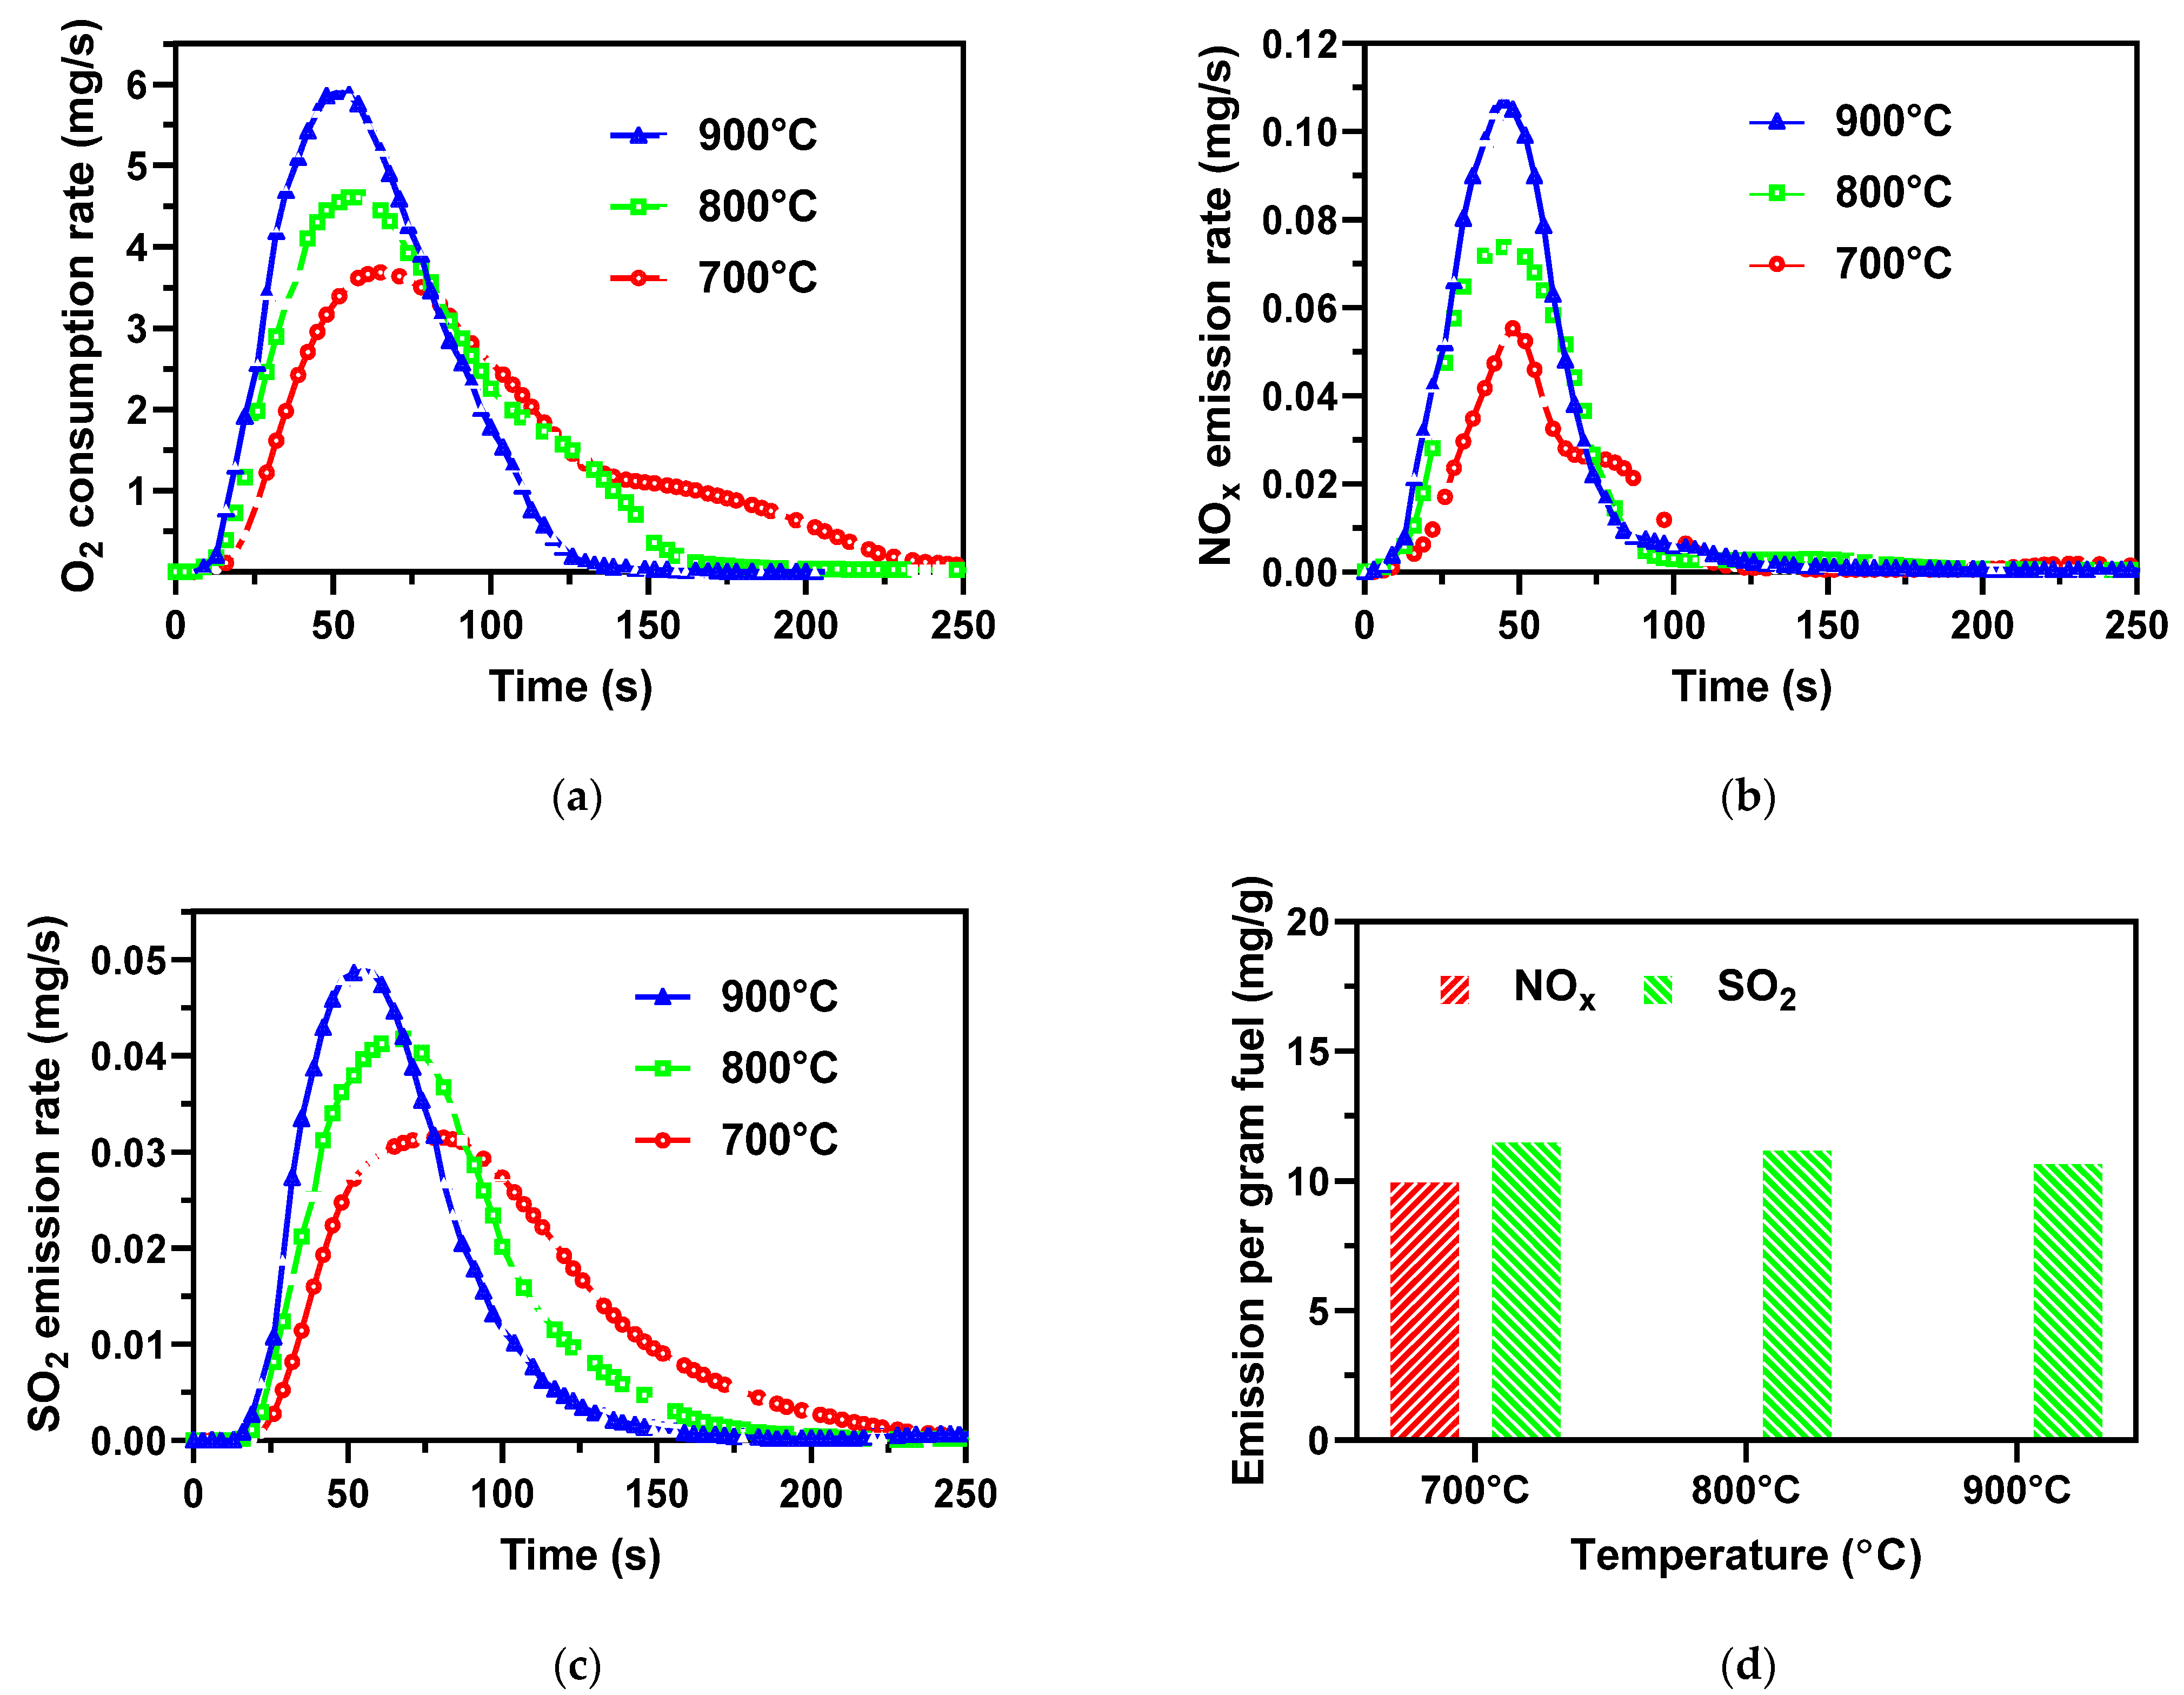
3.2. Effect of Combustion Temperature

Figure 4a shows the consumption of O2 against the combustion time, which can monitor the combustion process well. The real-time O2 consumption curve displays a unimodal distribution since combustions of both volatile and char take place continuously without staging as weight loss and simultaneously reach maximum combustion rate. The O2 consumption peak was higher at a higher combustion temperature and shifted to the left for a shorter combustion time, as seen in Figure 4a and Table 4. High temperatures also improve the burnout ratio of the AMR fuel, as given in Table 5.
As shown in Figure 4b,d, the NOx emission curve also presents a unimodal distribution, and the peak and total amount of the NOx emissions increased with increasing combustion temperature from 700 to 900 °C. High temperature was in favor of the fuel-N conversion to NOx [31]. Comparing the O2 consumption curve, the time of the NOx emission peak, tmax, was short and did not have an obvious shift with increasing combustion temperature as shown in Table 4 and Figure 4a,b, which reasonably responds to the AMR fuel devolatilization stage, while O2 was consumed throughout the whole process, including both the volatile combustion and the char combustion. A similar result was observed by Zhao et al. from the algae biomass combustion experiment [31]. As shown in Figure 4d and Table 5, the conversion ratio of fuel-N to NOx, XN, increases from 6.9% to 11.9% as the temperature increases from 700 to 900 °C.
For the SO2 emission, Figure 4c shows similar curves to the O2 consumption curves in Figure 4a, suggesting a close relationship between the O2 consumption and the SO2 emission, much differently from NOx emission. The oxidation of inorganic and organic sulfur overlapped in the rapid heating of the AMR samples in the fixed bed.
Slightly different from the O2 consumption, the SO2 emissions started later than the O2 consumption, and tmax of the SO2 emissions was longer than the O2 consumption, as also given in Table 4. Most of the sulfur (78%) in the AMR inorganic matter was decomposed and released significantly during char combustion at relatively high temperatures.
The higher combustion temperature causes faster and earlier SO2 emission and results in a shorter tmax. On the other hand, the low temperature caused a slow heating rate and slow char combustion. Nevertheless, the total SO2 emission and the conversion ratio of fuel-S to SO2 (XS) were unchanged in spite of their different combustion temperatures, as presented in Figure 4d and Table 5. The releasable sulfur was sufficiently released at 600 °C, as indicated in the TGA-MS curve in Figure 3b. Due to the high content of calcium in the AMR ash seen in Table 2, sulfur should be tightly bonded with calcium to make it hard to be released at the typical combustion temperatures of 700–900 °C [32].

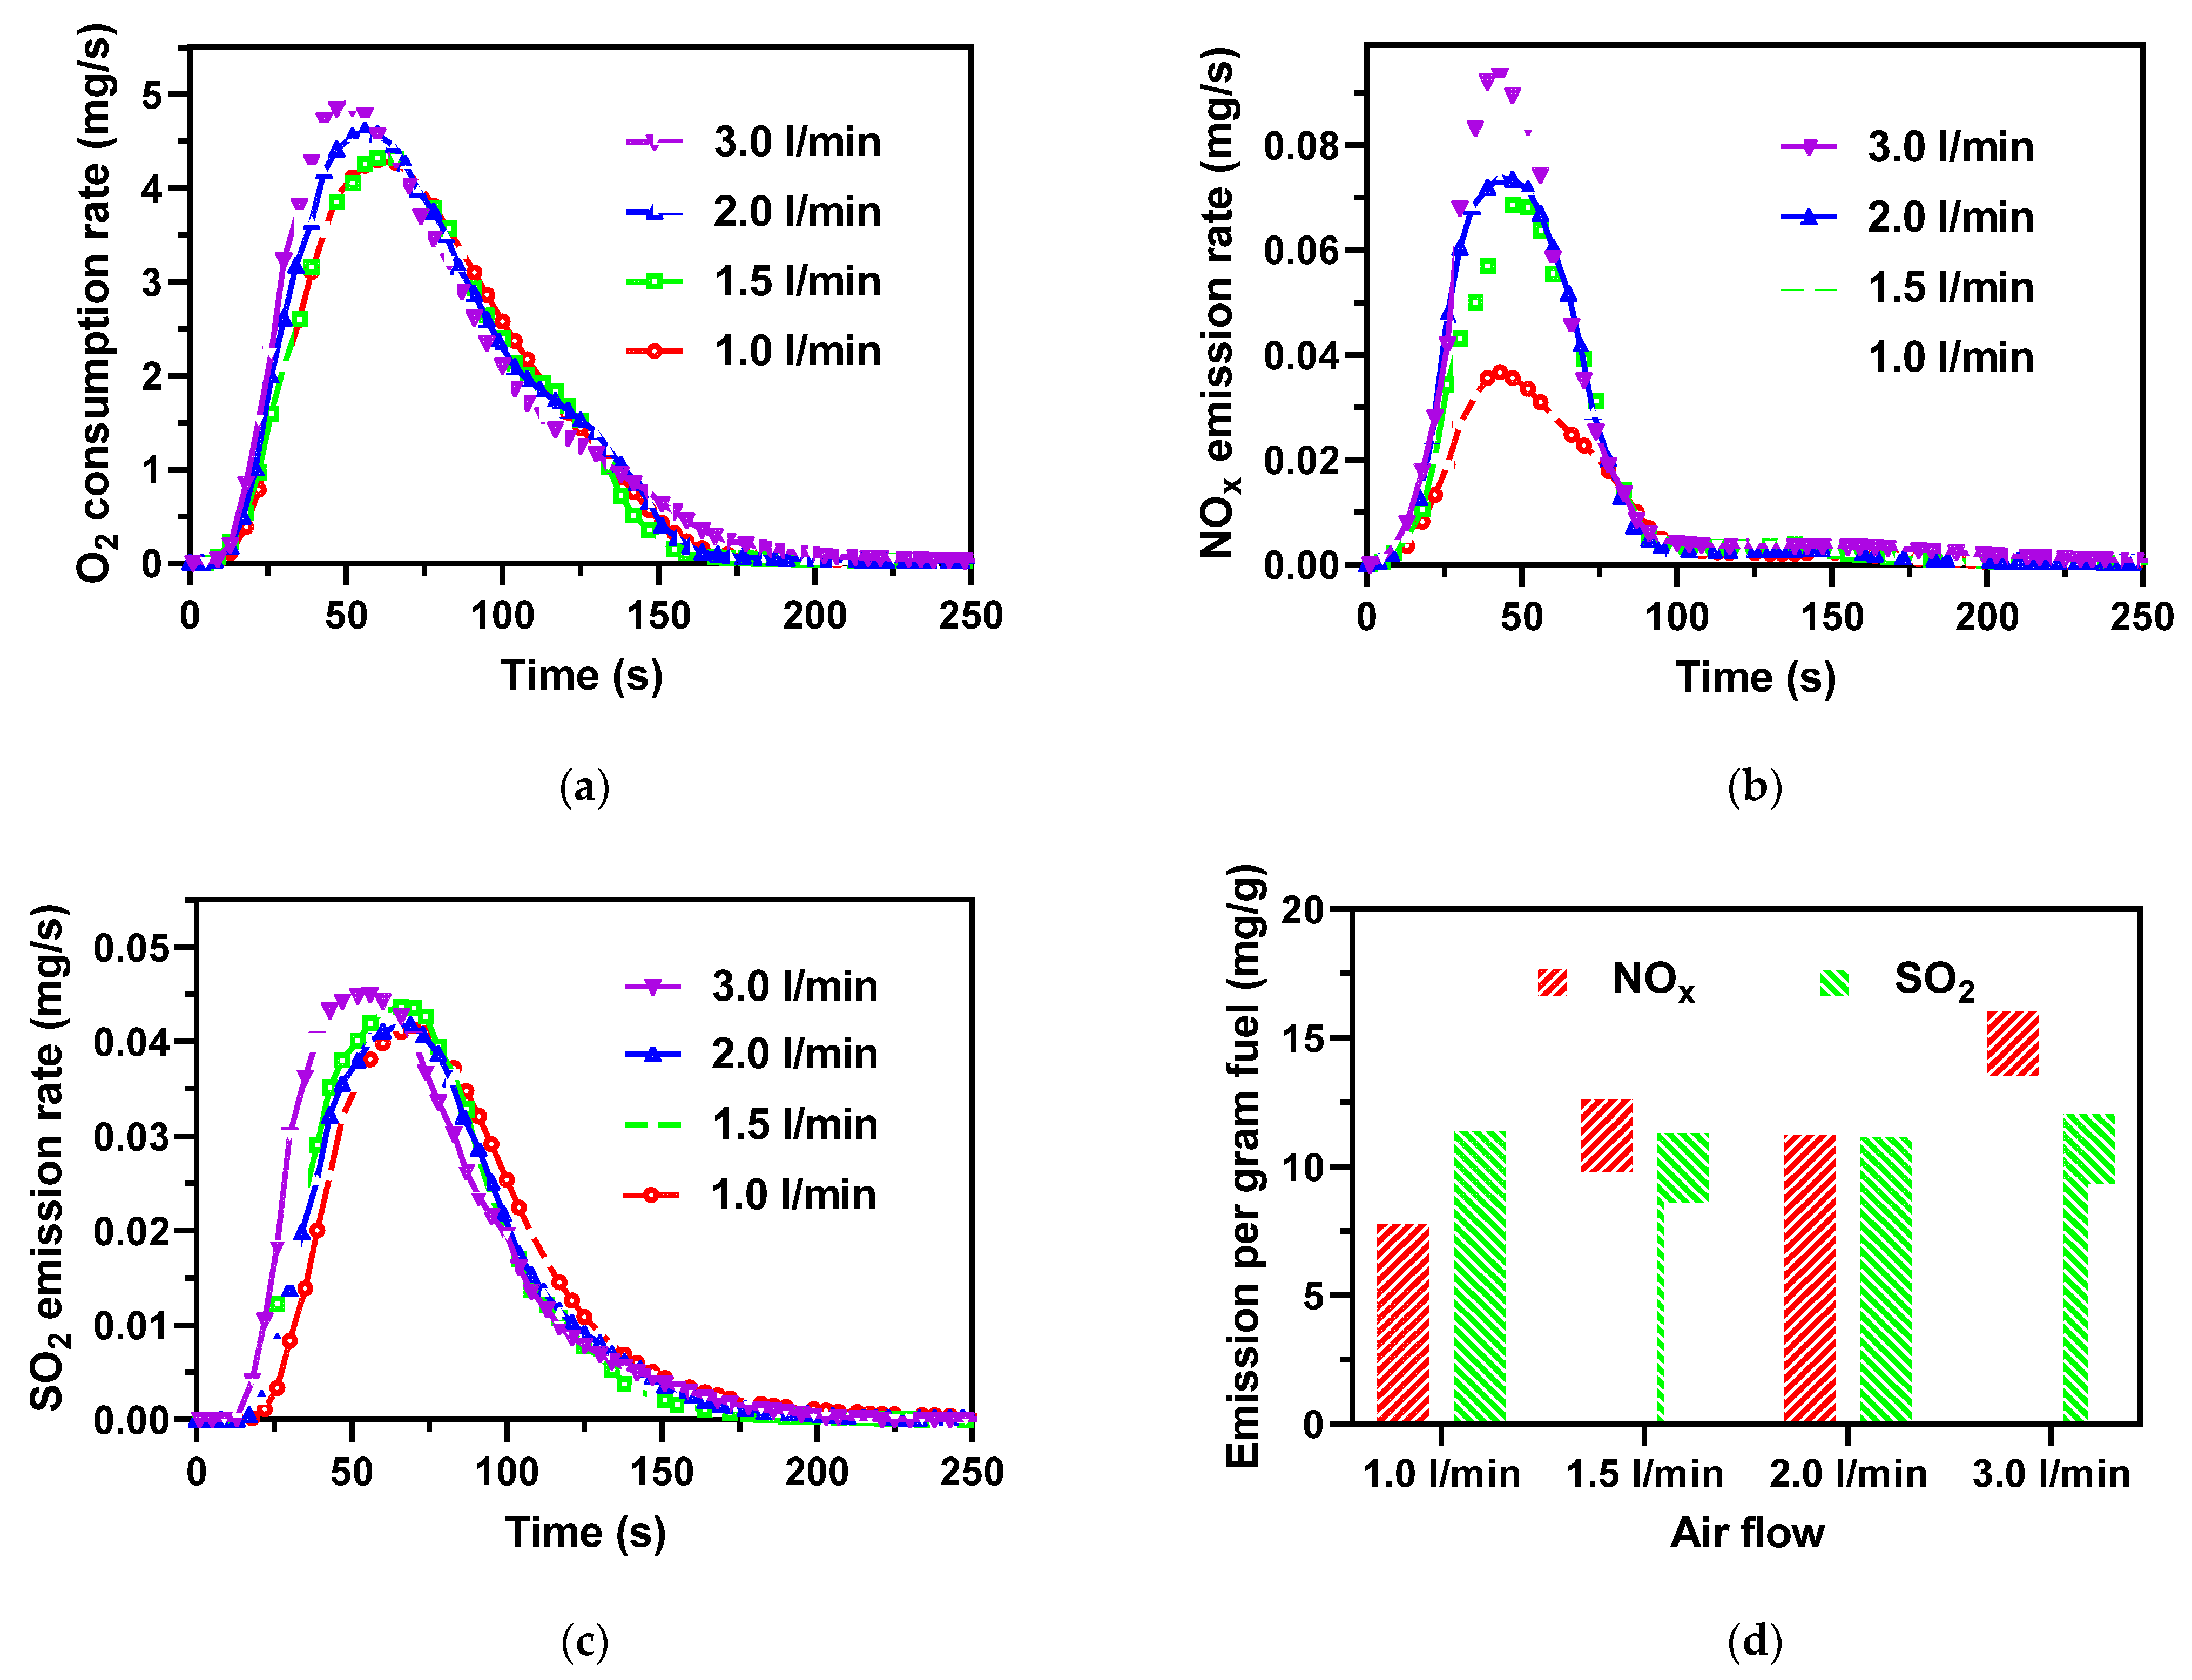
3.3. Effect of Excess Air

The effect of airflow on the AMR combustion process is presented in Figure 5 with respect to O2 consumption, NOx, and SO2 emissions. The O2 consumption was not sensitive to airflow, but the peak shifted slightly to the left since higher excess air promotes volatile and char combustion. It should be mentioned that CO appeared at the airflow of 3 L/min due to the short residence time of the flue gas in the reactor, as given in Table 5.
For the NOx emissions shown in Figure 5b, the peak appeared earlier than the O2 consumption in response to the AMR fuel devolatilization stage. The high airflow enhanced the oxidation of fuel-N to NOx and, at the same time, inhibited the reduction of NOx to N2. As a result, XN increases from 5.4% at 1 L/min to 11.2% at 3 L/min, as shown in Figure 5d and Table 5. A lower air flow created an environment of O2 shortage, which could significantly reduce the formation of NOx. This suggests an effective method to control the NOx emission from the AMR combustion via air staging combustion.
The SO2 emission had similar trends to the O2 consumption, as seen in Figure 5c. With increasing airflow, the SO2 emission peak slightly shifted to an earlier time, which might be related to the enhancement of the char combustion by excess air as the SO2 was mainly released during the char combustion. The SO2 emission peak lagged behind the O2 consumption peak, suggesting that the char combustion and ash decomposition dominated the SO2 emission. However, the airflow hardly changed the SO2 total emission, as shown in Figure 5d, and XN was steadily kept at 23.8–25.1%, as listed in Table 5.

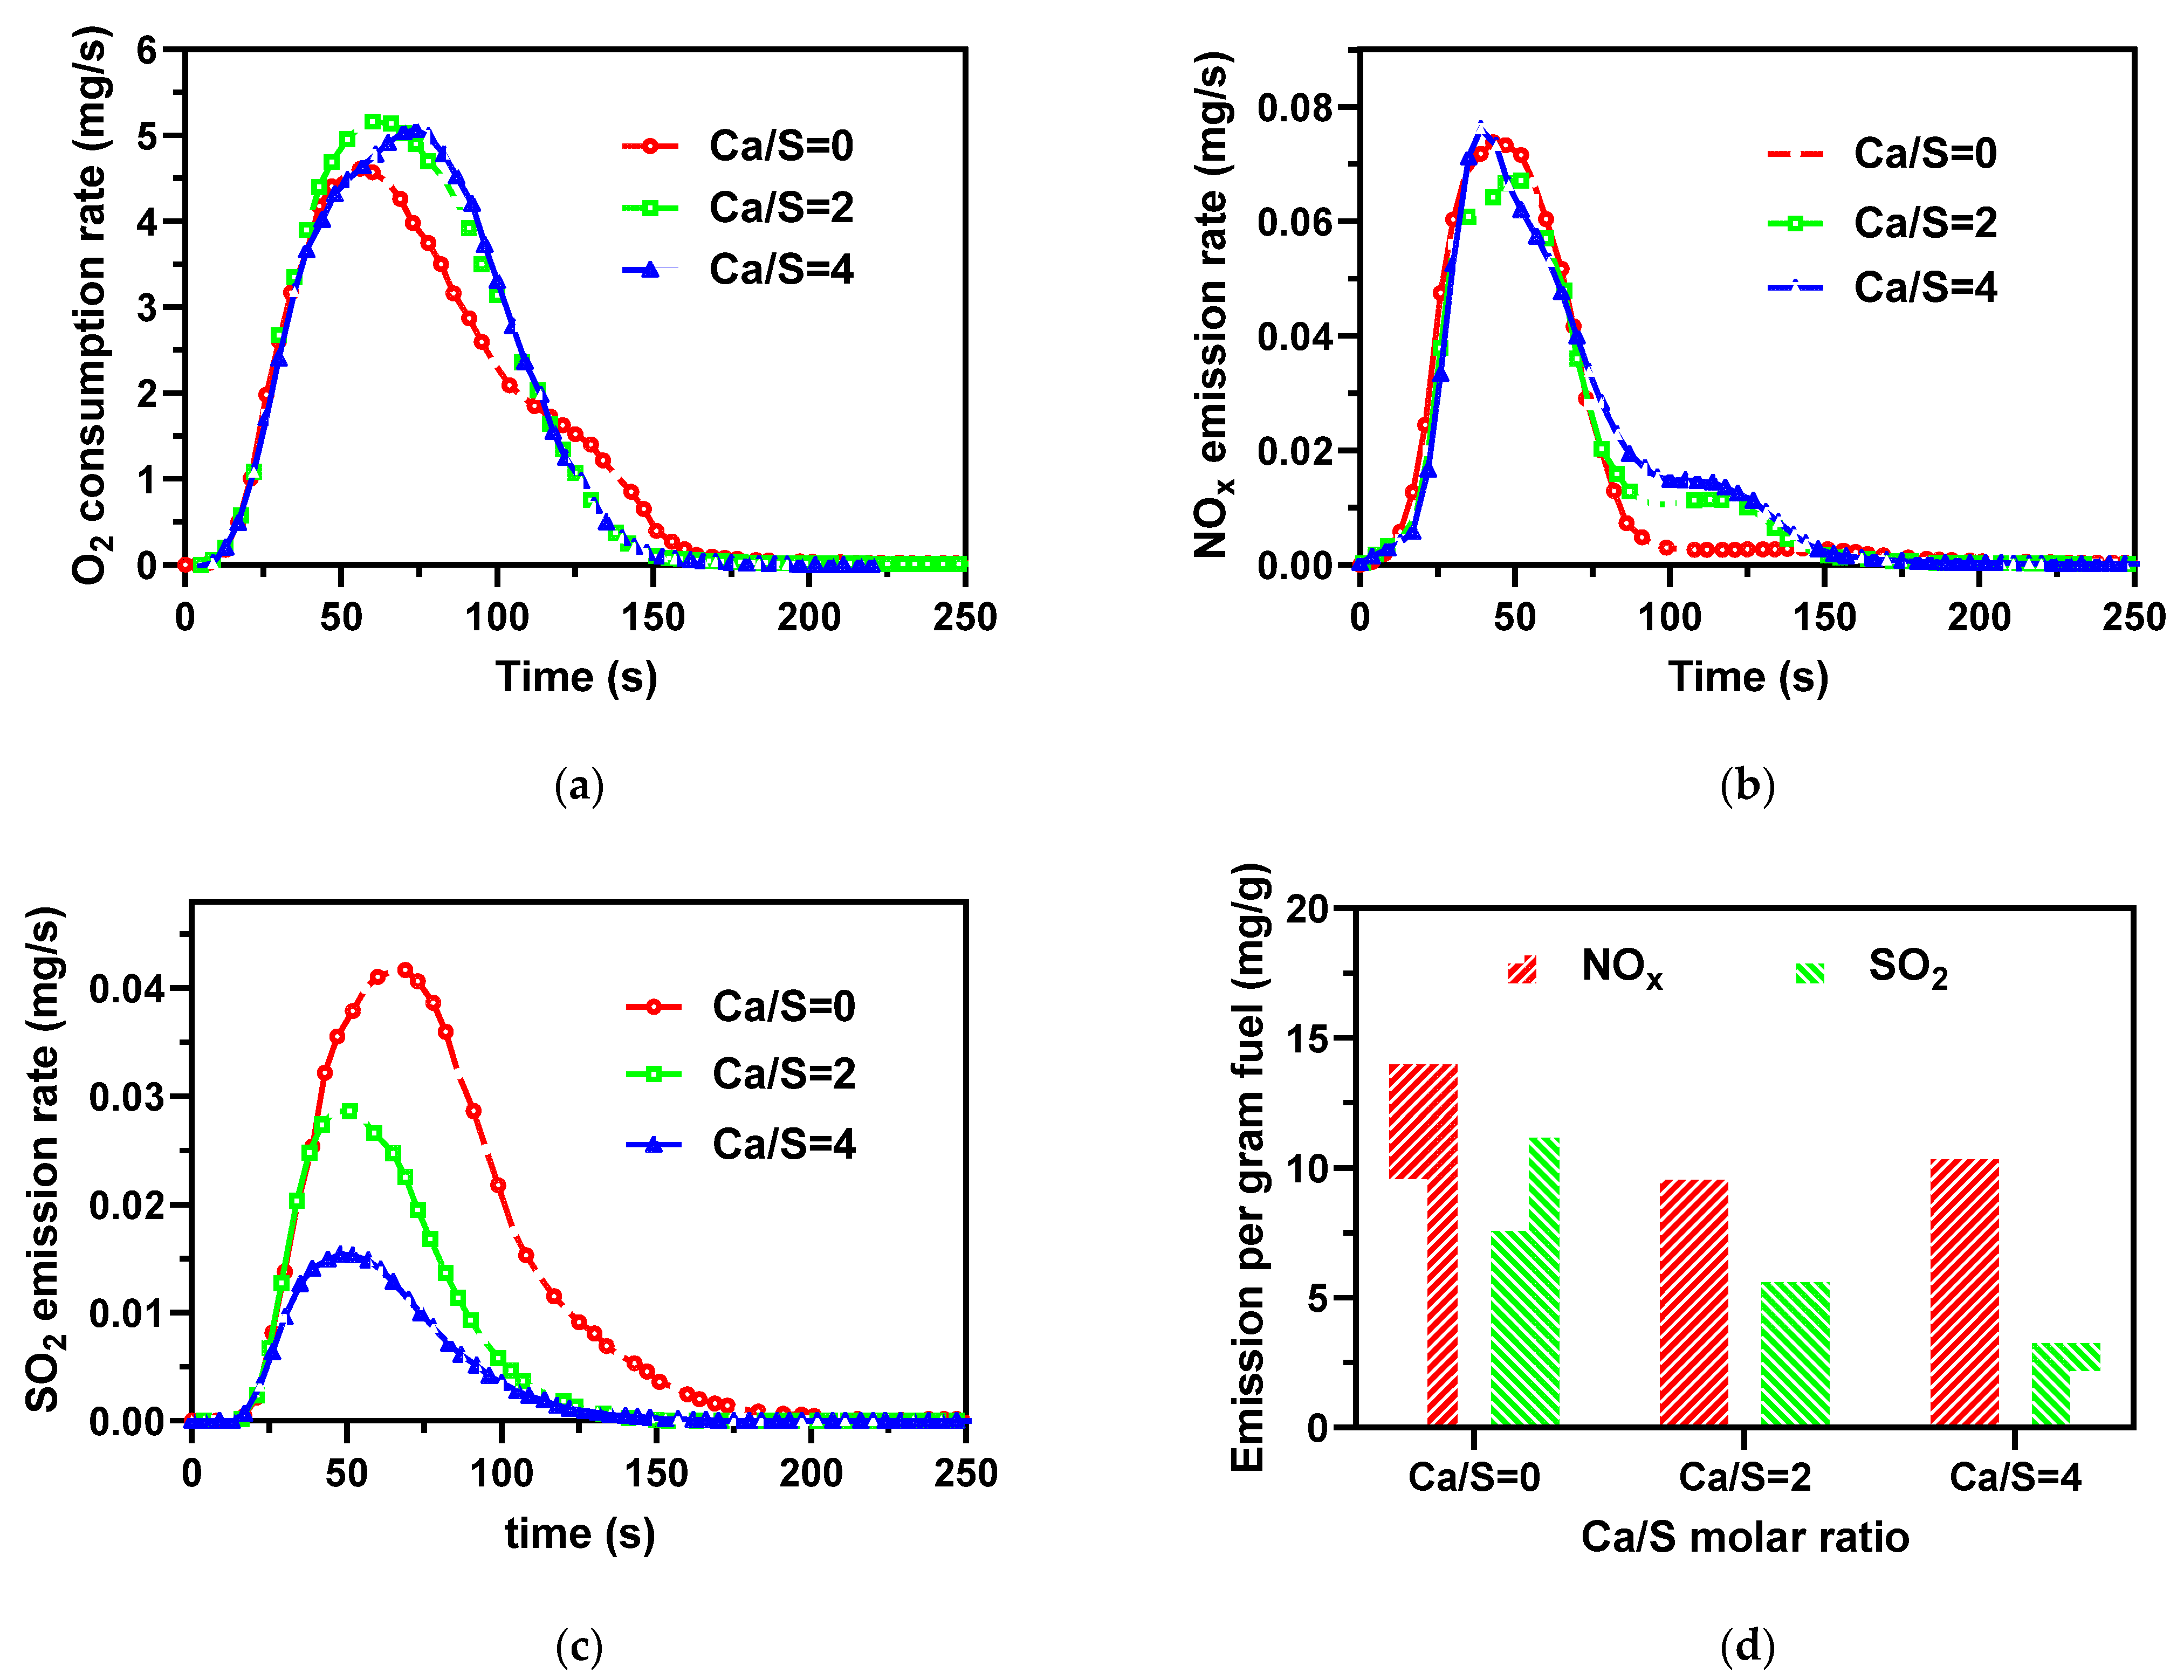
3.4. Desulfurization and Catalytic Effect of CaO

Most biomass fuels have a sulfur content below 0.2%, with only a few exceptions as high as 0.5–0.7% [33,34]. The S content of the AMR was extremely high, up to 2.9%, as seen in Table 1. Besides, the AMR seems to have a higher Xs (23.5% ± 1.5%) compared to other biomasses (5–20%) under similar combustion conditions [35]. Therefore, the addition of sorbent for desulphurization, like CaO into the AMR, is indispensable to lower the SO2 emission for AMR combustion.
For the O2 consumption shown in Figure 6a, the curves nearly overlapped in the earlier combustion stage of 40 s. More CaO addition resulted in a greater O2 consumption in the later combustion stage of 50 to 110 s. CaO addition in the AMR also shortened the combustion time. The addition of CaO showed a positive effect on AMR combustion, especially on char combustion. This result agrees well with Yuan et al. [28], who concluded that calcium-based catalysis greatly affects char combustion but has minor effects on devolatilization.
NOx emission and tmax were similar for the different Ca/S molar ratios, as presented in Table 4 and Figure 6b,d. Comparing SO2 emissions in Figure 6c, the NOx started to be released at the earlier time of combustion and continued at a low level of NOx emission during the combustion time of 100 to 150 s, which increased with the Ca/S molar ratio, as seen in Figure 6b. This may be due to the calcium-based compounds that increased the amount of char N during devolatilization [35,36]. Furthermore, the total amount of NOx emission and the XN did not change visibly, as shown in Figure 6d and Table 5.
CaO plays a significant role in sulfur retention, as shown in Figure 6c,d. The SO2 emission started at the same time but finished earlier at a higher Ca/S molar ratio. Moreover, a higher Ca/S molar ratio resulted in an earlier tmax, as shown in Table 4. For the molar ratio of Ca/S = 2 and 4, the tmax of SO2 emissions were even shorter than the tmax of O2 consumption and approximately similar to the tmax of NOx emission (40–50 s). In other words, the organic-S in the volatiles gradually dominated the SO2 emission with the increase of Ca/S. CaO additives can effectively control the SO2 emissions from inorganic-S. On the other hand, organic-S is released with the volatiles of the sample rather than directly released in SO2 form. Thus, sulfur at the devolatilization stage is hard to capture because of the poor gas-solid interaction in a fixed bed. The addition of CaO is apt to convert the inorganic sulfur into thermally stable CaSO4 and CaS [27,32,35]. Consequently, XS decreased from 23.3 to 6.8% as the Ca/S molar ratio increased from 0 to 4, as listed in Table 5. In comparison, the desulfurization of the fixed bed was significantly worse than a fluidized bed [19] because the latter has a better gas-solid contact.

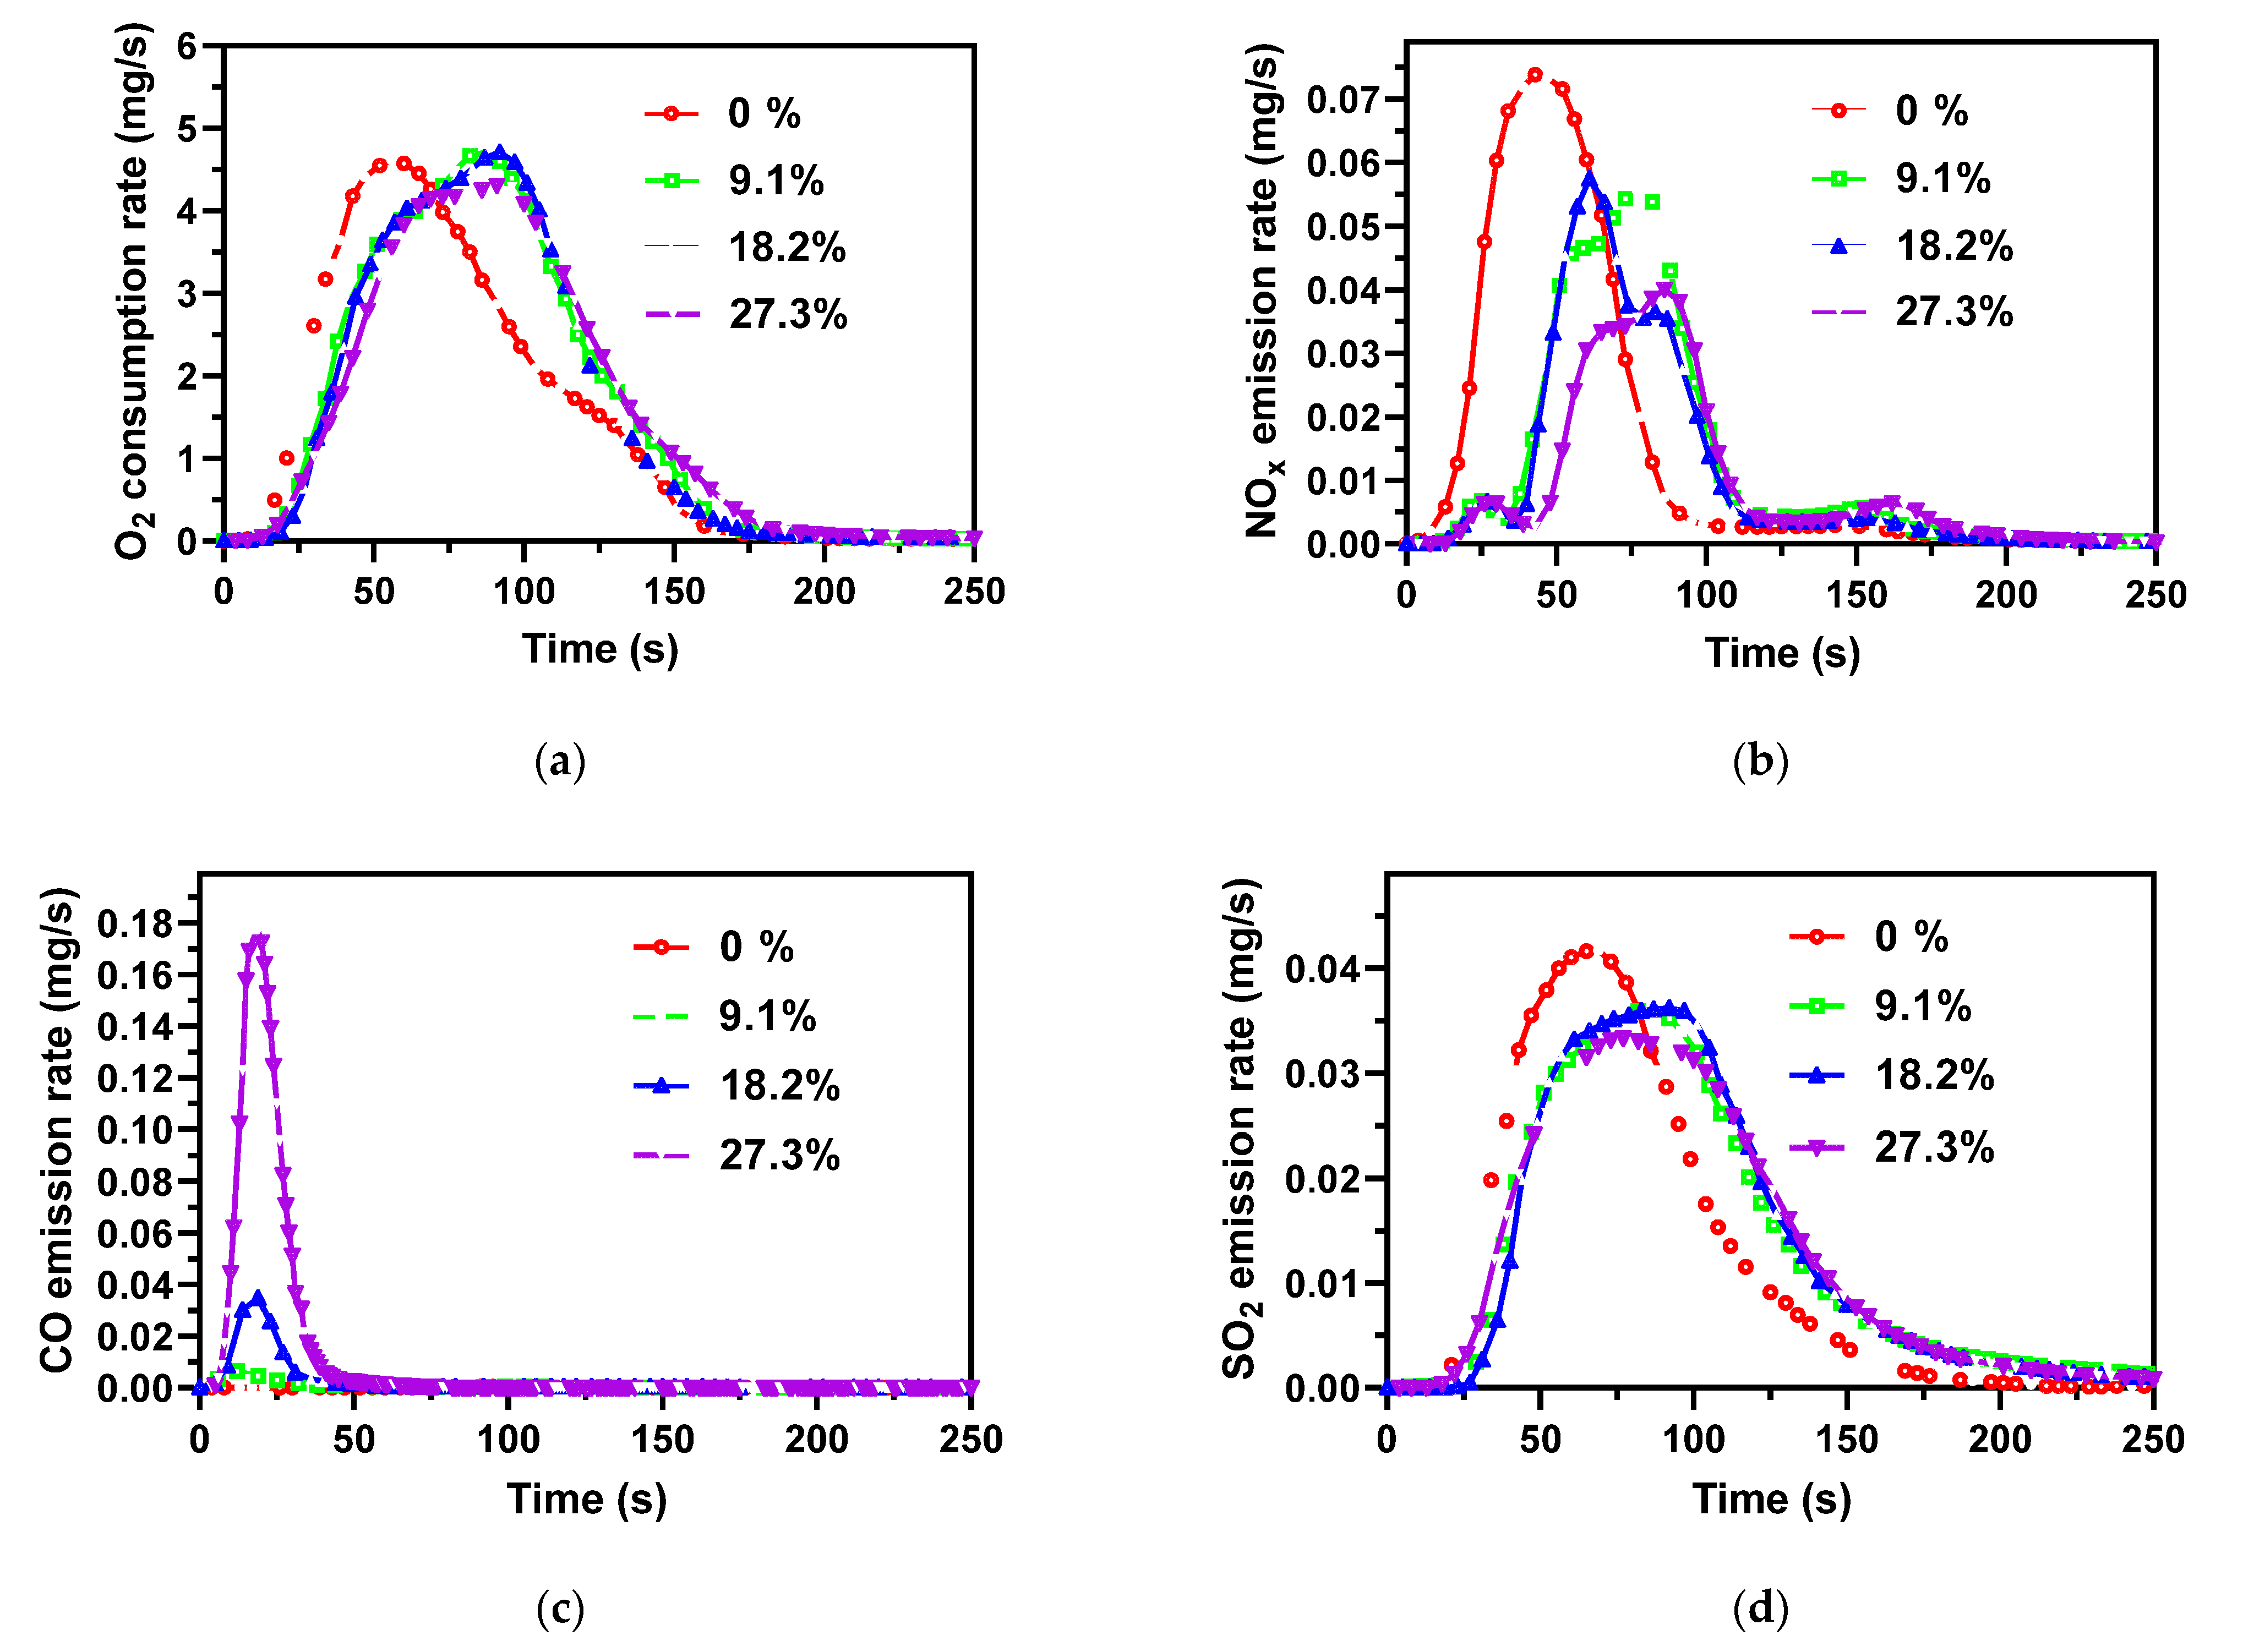
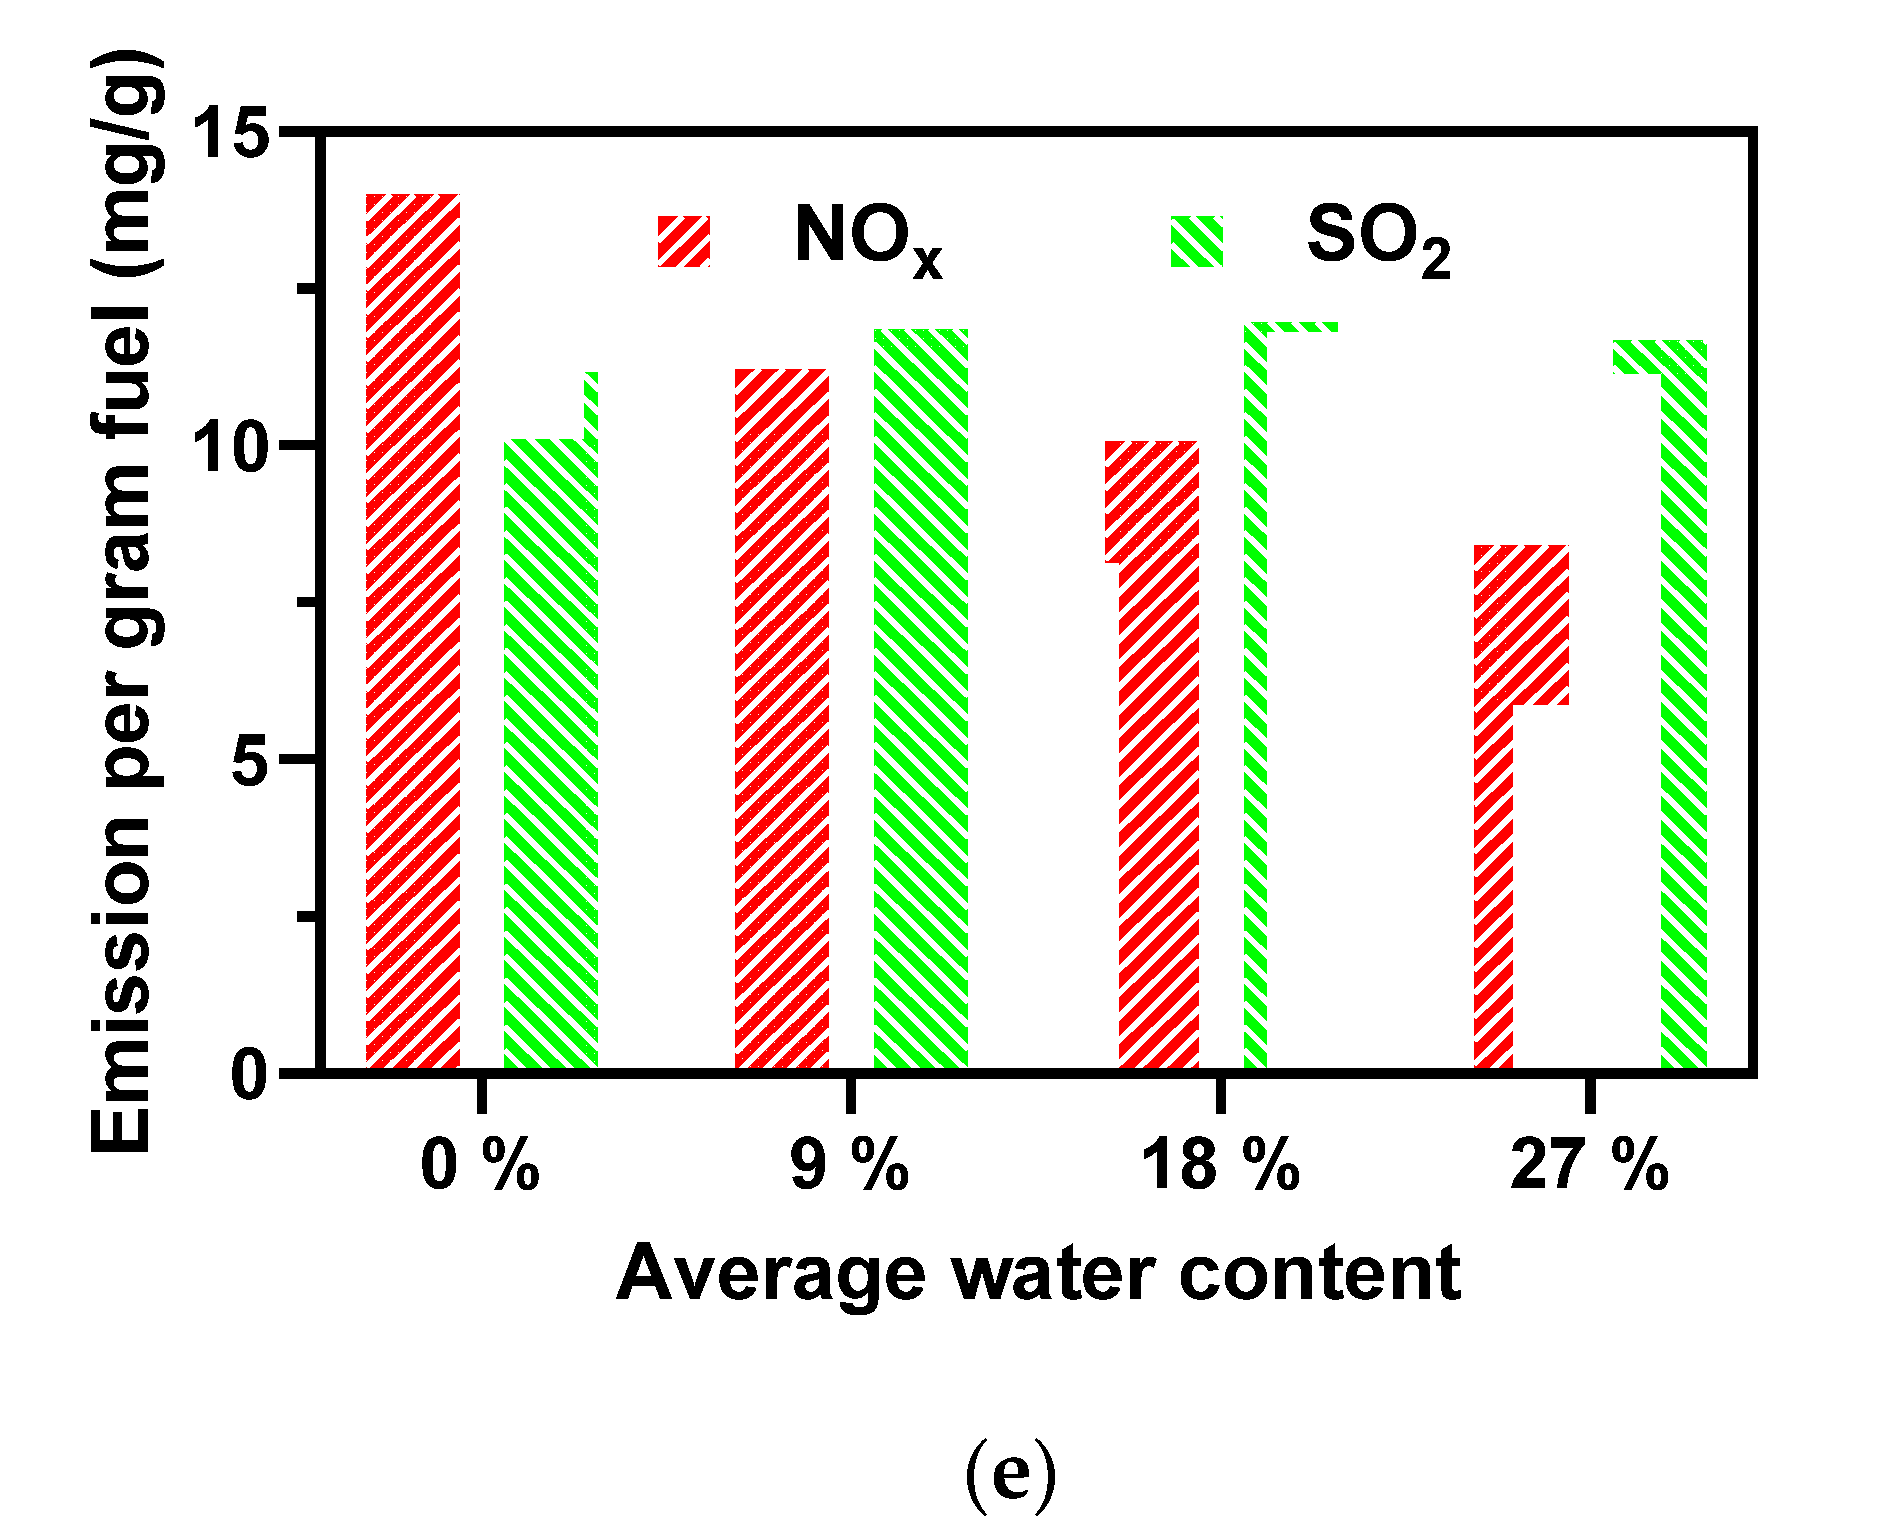
3.5. Effect of Water Content

As shown in Figure 7a, the water addition significantly slowed down the AMR combustion. Generally speaking, the combustion of water-rich biomass undergoes drying, devolatilization, volatile and char combustion with the rising temperature of the fuel [37]. Because the drying process consumes a lot of heat to evaporate the water, the temperature of the fuel with a higher water content rises slowly, and the combustion duration has to be prolonged. The water-containing AMR samples release some CO in the earlier combustion stage of 50 s, and more CO is released as the water content increases. The CO was released earlier than the O2 consumption, following the earlier stage of devolatilization. Two aspects were involved in the CO release: (1) water vaporization makes a lower reactor temperature, thus hindering the burnout of samples, and (2) the formed water vapor increases the gas flow in the reactor and causes a shorter volatile resident time, leading to incomplete combustion. As a result, the burnout ratio decreased from 99.8% to 97.9% when the water content increased from 9.1% to 27.3%, as listed in Table 5.
The NOx emission exhibited a bimodal distribution for the water-containing samples, as seen in Figure 7b, differing from the unimodal distribution for the dry samples. For the water-containing AMR, the first peak was smaller and occurred at 0–50 s, nearly synchronizing with CO release. The second NOx emission peak was much higher and should be related to the volatile decomposition stage of the AMR combustion. The second NOx emission peak contained two sub-peaks, which should be associated with the unstable combustion process for the water-containing samples, as shown by the O2 consumption curves. The occurrence of the first weak peak at 0–50 s might be explained by the devolatilization of the N-containing species, which is kept at a low level by the high concentration of CO and thus the reduction effect of CO on NOx (2NO + 2CO = N2 +2CO2) [16,37]. Thus, NOx reaches a small peak (at 25 s), then decreases due to the reducing atmosphere, and then increases again at 40–45 s because the reducing matters are consumed by O2. In conclusion, higher water content reduces the conversion of the fuel-N to NOx, as shown in Figure 7e and Table 5.
As Figure 7d illustrates, the SO2 emission from combustion of the water-containing fuel sample had a similar unimodal distribution to that from the combustion of the dry AMR sample, but with a time delay due to evaporation of water in advance. The increase in water content did not seem to reduce the total amount of SO2 emissions from the AMR combustion in the present case of the fixed bed, as shown in Figure 7e and Table 5. Zhang et al. [16] reported that steam could promote the capture of SO2 by the AMR ash in a continuous feeding fluidized bed. In the case of a fixed bed, the water was evaporated to form steam and escaped from the sample, and the chance of steam reacting with sulfur-containing species during the char combustion process was very small. In addition, compared to a continuous feeding fluidized bed, a fixed bed did not have much ash to capture SO2.

4. Conclusions

The emission characteristics of NOx and SO2 from AMR combustion were investigated based on an experimental study conducted in a fixed bed. Analysis of the AMR showed that the fuel-N was constituted by 85% protein nitrogen and 15% inorganic nitrogen and the fuel-S by 78% inorganic sulfur and 22% organic sulfur. The volatile combustion resulted in most NOx when the temperature rose to 400 °C, while the primary sulfur oxide emission occurred at the char combustion stage above 400 °C. Increasing the combustion temperature and airflow caused higher NOx emissions. The addition of CaO changed the distribution of NOx emission by converting part of the volatile nitrogen into char nitrogen. High moisture content in AMR significantly reduced the NOx emission by lowering the combustion temperature and generating more reducing gases such as CO. For the SO2 emission, the combustion temperature (700 to 900 °C), airflow, and AMR water content did not seem to exhibit obvious effects. The presence of CaO significantly inhibited SO2 emission, especially for the SO2 produced during the AMR char combustion. In addition, low combustion temperatures, high water contents in the fuel, as well as low airflows were unfavorable for the burnout of the AMR. Therefore, the direct combustion of AMR with in-situ NOx control must be balanced with fuel burnout. Employing air/fuel staging technologies in combination with in situ desulfurization by calcium oxide/salts, in addition to operating temperatures lower than 900 °C, could be a potential technology for the clean disposal of AMRs. In addition, a number of aspects will require further attention and dedicated experimental work. In particular, systematic studies of air/fuel staging technologies and continuous feed tests need to be carried out.

Author Contributions

Conceptualization, Y.G.; methodology, Y.G.; software, Y.G.; validation, Y.G., G.Z. and L.C.; formal analysis, Y.G.; investigation, Y.G.; resources, Y.G., G.Z., L.C. and J.Z.; data curation, Y.G.; writing—original draft preparation, Y.G.; writing—review and editing, G.Z., W.Z. and L.C.; visualization, Y.G.; supervision, G.Z. and L.C.; project administration, G.Z. and L.C.; funding acquisition, G.Z. All authors have read and agreed to the published version of the manuscript.

Funding

This project was supported by the National Key Research and Development Program of China (Grant No. 2019YFC1906805).

Institutional Review Board Statement

Not applicable.

Informed Consent Statement

Not applicable.

Data Availability Statement

Not applicable.

Conflicts of Interest

The authors declare no conflict of interest.

References

  1. Cai, C.; Liu, H.; Wang, B. Performance of microwave treatment for disintegration of cephalosporin mycelial dreg (CMD) and degradation of residual cephalosporin antibiotics. J. Hazard. Mater. 2017, 331, 265–272. [Google Scholar] [CrossRef] [PubMed]
  2. Chen, Y.; Du, L.; Li, S.; Song, W.; Jensen, P.A.; Lin, W. Pyrolysis of antibiotic mycelial dreg and characterization of obtained gas, liquid and biochar. J. Hazard. Mater. 2021, 402, 123826. [Google Scholar] [CrossRef] [PubMed]
  3. Li, C.; Zhang, G.; Zhang, Z.; Ma, D.; Wang, L.; Xu, G. Hydrothermal pretreatment for biogas production from anaerobic digestion of antibiotic mycelial residue. Chem. Eng. J. 2015, 279, 530–537. [Google Scholar] [CrossRef]
  4. Jiang, X.; Feng, Y.; Lv, G.; Du, Y.; Qin, D.; Li, X.; Chi, Y.; Yan, J.; Liu, X. Bioferment residue: TG-FTIR study and cocombustion in a MSW incineration plant. Environ. Sci. Technol. 2012, 46, 13539–13544. [Google Scholar] [CrossRef]
  5. Hvistendahl, M. China takes aim at rampant antibiotic resistance. Science 2012, 336, 795. [Google Scholar] [CrossRef]
  6. Naquin, A.; Shrestha, A.; Sherpa, M.; Nathaniel, R.; Boopathy, R. Presence of antibiotic resistance genes in a sewage treatment plant in Thibodaux, Louisiana, USA. Bioresour. Technol. 2015, 188, 79–83. [Google Scholar] [CrossRef]
  7. Zhong, W.; Li, Z.; Yang, J.; Liu, C.; Tian, B.; Wang, Y.; Chen, P. Effect of thermal-alkaline pretreatment on the anaerobic digestion of streptomycin bacterial residues for methane production. Bioresour. Technol. 2014, 151, 436–440. [Google Scholar] [CrossRef]
  8. Zhang, G.; Li, C.; Ma, D.; Zhang, Z.; Xu, G. Anaerobic digestion of antibiotic residue in combination with hydrothermal pretreatment for biogas. Bioresour. Technol. 2015, 192, 257–265. [Google Scholar] [CrossRef]
  9. Wang, Q.; Zhang, Z.; Xu, G.; Li, G. Pyrolysis behaviors of antibiotic fermentation residue and wastewater sludge from penicillin production: Kinetics, gaseous products distribution, and nitrogen transformation. J. Anal. Appl. Pyrolysis 2021, 158, 105208. [Google Scholar] [CrossRef]
  10. Li, C.; Xie, S.; You, F.; Zhu, X.; Li, J.; Xu, X.; Yu, G.; Wang, Y.; Angelidaki, I. Heavy metal stabilization and improved biochar generation via pyrolysis of hydrothermally treated sewage sludge with antibiotic mycelial residue. Waste Manag. 2021, 119, 152–161. [Google Scholar] [CrossRef]
  11. Guo, J.; Zheng, L.; Li, Z.; Zhou, X.; Zhang, W.; Cheng, S.; Zhang, L. Thermal decomposition of antibiotic mycelial fermentation residues in Ar, air, and CO2–N2 atmospheres by TG-FTIR method. J. Therm. Anal. Calorim. 2019, 137, 2053–2060. [Google Scholar] [CrossRef]
  12. Chen, Y.; Lin, W.; Wu, H.; Jensen, P.A.; Song, W.; Du, L.; Li, S. Steam gasification of char derived from penicillin mycelial dreg and lignocellulosic biomass: Influence of P, K and Ca on char reactivity. Energy 2021, 228, 120605. [Google Scholar] [CrossRef]
  13. Chen, G.; Liu, H.; LI, J.; Yan, B.; Dong, L. Treatment of antibiotic mycelial fermentation residue: The critical review. Environ. Chem. 2021, 40, 459–473. (In Chinese) [Google Scholar] [CrossRef]
  14. Lapara, T.M.; Burch, T.R.; McNamara, P.J.; Tan, D.T.; Yan, M.; Eichmiller, J.J. Tertiary-treated municipal wastewater is a significant point source of antibiotic resistance genes into Duluth-Superior Harbor. Environ. Sci. Technol. 2011, 45, 9543–9549. [Google Scholar] [CrossRef] [PubMed] [Green Version]
  15. McEachran, A.D.; Blackwell, B.R.; Hanson, J.D.; Wooten, K.J.; Mayer, G.D.; Cox, S.B.; Smith, P.N. Antibiotics, bacteria, and antibiotic resistance genes: Aerial transport from cattle feed yards via particulate matter. Environ. Health Perspect. 2015, 123, 337–343. [Google Scholar] [CrossRef] [Green Version]
  16. Zhang, G.; Liu, H.; Ge, Y.; Gao, S. Gaseous emission and ash characteristics from combustion of high ash content antibiotic mycelial residue in fluidized bed and the impact of additional water vapor. Fuel 2017, 202, 66–77. [Google Scholar] [CrossRef]
  17. Ma, D.; Zhang, G.; Areeprasert, C.; Li, C.; Shen, Y.; Yoshikawa, K.; Xu, G. Characterization of NO emission in combustion of hydrothermally treated antibiotic mycelial residue. Chem. Eng. J. 2016, 284, 708–715. [Google Scholar] [CrossRef] [Green Version]
  18. Ma, D.; Zhang, G.; Areeprasert, C.; Lina, G.; Yoshikawa, K. NO emission characteristics of hydrothermally pretreated antibiotic mycelial dreg combustionin a drop tube reactor. Energy Procedia 2014, 61, 743–746. [Google Scholar] [CrossRef] [Green Version]
  19. Ge, Y.; Zhang, G.; Cui, L.; Gao, S. Characteristics of NOx and SO2 emission from combustion of antibiotic mycelial residue with high water content in fluidized bed reactor. CIESC J. 2017, 68, 3250–3257. (In Chinese) [Google Scholar] [CrossRef]
  20. Wang, C.; Zhou, L.; Fan, G.; Yuan, M.; Zhao, L.; Tang, G.; Liu, C.; Che, D. Experimental study on ash morphology, fusibility, and mineral transformation during co-combustion of antibiotic filter residue and biomass. Energy 2021, 217, 119345. [Google Scholar] [CrossRef]
  21. Gao, X.; Wang, C.; Liu, C.; Fan, G.; Mao, Q.; Che, D. Numerical simulation study on co-combustion characteristics of biogas and antibiotic filter residue in a grate furnace. In Proceedings of the International Conference on Applied Energy 2020, Bangkok, Thailand, 1–10 December 2020; pp. 1–4. [Google Scholar]
  22. Özsin, G.; Pütün, A.E. Co-pyrolytic behaviors of biomass and polystyrene: Kinetics, thermodynamics and evolved gas analysis. Korean J. Chem. Eng. 2018, 35, 428–437. [Google Scholar] [CrossRef]
  23. Xu, S.; Chen, J.; Peng, H.; Leng, S.; Li, H.; Qu, W.; Hu, Y.; Li, H.; Jiang, S.; Zhou, W.; et al. Effect of biomass type and pyrolysis temperature on nitrogen in biochar, and the comparison with hydrochar. Fuel 2021, 291, 120128. [Google Scholar] [CrossRef]
  24. Liu, L.; Tan, Z.; Ye, Z. Transformation and transport mechanism of nitrogenous compounds in a biochar “preparation-returning to the field” process studied by employing an isotope tracer method. ACS Sustain. Chem. Eng. 2018, 6, 1780–1791. [Google Scholar] [CrossRef]
  25. Nan, H.; Xiao, Z.; Zhao, L.; Yang, F.; Xu, H.; Xu, X.; Qiu, H. Nitrogen transformation during pyrolysis of various N-containing biowastes with participation of mineral calcium. ACS Sustain. Chem. Eng. 2020, 8, 12197–12207. [Google Scholar] [CrossRef]
  26. Chang, H.; Wang, C.; Zeng, F.; Li, J.; Li, W.; Xie, K. XPS comparative analysis of coal macerals with different reducibility. J. Fuel Chem. Technol. 2006, 34, 389–394. (In Chinese) [Google Scholar]
  27. Knudsen, J.N.; Jensen, P.A.; Lin, W.; Frandsen, F.J.; Dam-Johansen, K. Sulfur transformations during thermal conversion of herbaceous biomass. Energy Fuels 2004, 18, 810–819. [Google Scholar] [CrossRef]
  28. Yuan, R.; Yu, S.; Shen, Y. Pyrolysis and combustion kinetics of lignocellulosic biomass pellets with calcium-rich wastes from agro-forestry residues. Waste Manag. 2019, 87, 86–96. [Google Scholar] [CrossRef]
  29. Roque-Diaz, P.; University, C.; Villas, L.; Cuba, C.V.; Lavrenko, V.A.; Khristich, V.A. Studies on thermal decomposition and combustion mechanism of bagasse under non-isothermal conditions. Thermochim. Acta 1985, 93, 349–352. [Google Scholar] [CrossRef]
  30. Strydom, C.A. The thermal decomposition of (NH4)4V2O11 in a nitrogen atmosphere and the kinetics of the first decomposition step. J. Therm. Anal. 1993, 40, 1069–1075. [Google Scholar] [CrossRef]
  31. Zhao, B.; Su, Y.; Liu, D.; Zhang, H.; Liu, W.; Cui, G. SO2/NOx emissions and ash formation from algae biomass combustion: Process characteristics and mechanisms. Energy 2016, 113, 821–830. [Google Scholar] [CrossRef]
  32. Ingo, G.M.; Riccucci, C.; Bultrini, G.; Chiozzini, G. Correlation between the surface acid-base nature of solid metal oxides and temperature of CaSO4 decomposition. J. Therm. Anal. Calorim. 2001, 66, 27–35. [Google Scholar] [CrossRef]
  33. Demirbas, A. Combustion characteristics of different biomass fuels. Prog. Energy Combust. Sci. 2004, 30, 219–230. [Google Scholar] [CrossRef]
  34. Clarke, S.; Preto, F. Biomass Burn Characteristics. Available online: https://www.researchgate.net/profile/Fernando-Preto/publication/265498636_Biomass_Burn_Characteristics/links/5592bb9808aed7453d463ce8/Biomass-Burn-Characteristics.pdf (accessed on 29 December 2021).
  35. Qi, J.; Han, K.; Wang, Q.; Gao, J. Carbonization of biomass: Effect of additives on alkali metals residue, SO2 and NO emission of chars during combustion. Energy 2017, 130, 560–569. [Google Scholar] [CrossRef] [Green Version]
  36. Gu, Y.; Liu, X.; Zhao, B.; Liu, W.; Xu, M. The effect of Ca on distribution of nitrogen species during coal pyrolysis in N2, CO2 and Ar atmospheres. Asia-Pac. J. Chem. Eng. 2013, 8, 567–577. [Google Scholar] [CrossRef]
  37. Werther, J.; Saenger, M.; Hartge, E.U.; Ogada, T.; Siagi, Z. Combustion of agricultural residues. Prog. Energy Combust. Sci. 2000, 26, 1–27. [Google Scholar] [CrossRef]
Figure 1. Schematic diagram of the fixed bed combustor.
Ijerph 19 01581 g001
Figure 2. XPS Spectra for (a) N 1s and (b) S 2p in the AMR.
Ijerph 19 01581 g002
Figure 3. (a) Weight fraction and differential weight fraction as a function of temperature during pyrolysis and combustion of the AMR (WFC—weight fraction during combustion, WFP—weight fraction during pyrolysis, DFC–differential weight fraction during combustion, and DFP—differential weight fraction during pyrolysis). (b) The emission intensity of NO, NO2, and SO2 during AMR combustion in Ar/O2 atmosphere.
Ijerph 19 01581 g003
Figure 4. (a) O2 consumption, (b) NOx emission, (c) SO2 emission as a function of time during combustion of the AMR, and (d) NOx and SO2 emissions per gram AMR at different combustion temperatures.
Ijerph 19 01581 g004
Figure 5. (a) O2 consumption, (b) NOx emission, (c) SO2 emission as a function of time during combustion of the AMR, and (d) NOx and SO2 emissions per gram AMR at different airflows.
Ijerph 19 01581 g005
Figure 6. (a) O2 consumption, (b) NOx emission, (c) SO2 emission as a function of time during combustion of the AMR, and (d) NOx and SO2 emissions per gram AMR at different molar Ca/S ratios.
Ijerph 19 01581 g006
Figure 7. (a) O2 consumption, (b) NOx emission, (c) CO emission, (d) SO2 emission as a function of time during combustion of AMR, and (e) NOx and SO2 emissions per gram AMR at different water contents.
Ijerph 19 01581 g007aIjerph 19 01581 g007b
Table 1. Fuel properties of the dried AMR material.
Proximate Analysis (wt.%, as Received)
Moisture2.8
Volatile matter85.0
Ash10.2
Fixed carbon2.0
Ultimate analysis (wt.%, dry ash-free)
C57.7
H9.1
N7.9
O22.3
S2.9
High Heating Value (MJ/kg)23.58
Table 2. Composition of the AMR ash.
SpeciesSO3CaOP2O5K2OSiO2MgONa2OAl2O3Fe2O3SrOTotal
Content (wt.%)40.8335.0214.623.742.271.120.900.650.400.00299.74
Table 3. N and S distributions over different N and S species in the AMR sample.
ElementsElement SpeciesContent (%)
NProtein nitrogen84.6
Inorganic nitrogen15.4
SMercaptan/thioether16.8
Sulfoxide5.8
Inorganic sulfur77.4
Table 4. The time of curve peak, tmax, under various combustion conditions for O2 consumption, NOx emission, and SO2 emission.
Gas CurveO2 ConsumptionNOx EmissionSO2 Emission
tmax (s) (700 °C, 2.0 L/min, Ca/S = 0, dry) 654981
tmax (s) (800 °C, 2.0 L/min, Ca/S = 0, dry)564468
tmax (s) (900 °C, 2.0 L/min, Ca/S = 0, dry)524658
tmax (s) (800 °C, 1.0 L/min, Ca/S = 0, dry)614371
tmax (s) (800 °C, 1.5 L/min, Ca/S = 0, dry)614868
tmax (s) (800 °C, 3.0 L/min, Ca/S = 0, dry)514252
tmax (s) (800 °C, 2.0 L/min, Ca/S = 2, dry) 615046
tmax (s) (800 °C, 2.0 L/min, Ca/S = 4, dry)734048
Table 5. Conversion ratio of fuel-N (fuel-S) to NOx (SO2) and C burnout ratio under different experimental conditions.
Combustion ConditionFuel-N to NOx, XNFuel-N to SO2, XSBurn out Ratio, XN
700 °C, 2.0 L/min, Ca/S = 0, dry 6.923.998.8
800 °C, 2.0 L/min, Ca/S = 0, dry9.723.3100
900 °C, 2.0 L/min, Ca/S = 0, dry11.922.2100
800 °C, 1.0 L/min, Ca/S = 0, dry 5.423.8100
800 °C, 1.5 L/min, Ca/S = 0, dry 8.823.6100
800 °C, 3.0 L/min, Ca/S = 0, dry11.225.199.9
800 °C, 2.0 L/min, Ca/S = 2, dry9.711.7100
800 °C, 2.0 L/min, Ca/S = 4, dry10.46.8100
800 °C, 2.0 L/min, Ca/S = 0, 9.1% 7.824.199.8
800 °C, 2.0 L/min, Ca/S = 0, 18.2%7.024.999.5
800 °C, 2.0 L/min, Ca/S = 0, 27.3%5.924.399.5
Publisher’s Note: MDPI stays neutral with regard to jurisdictional claims in published maps and institutional affiliations.

