Figure 1.
Flow diagram of the recruitment process.
Figure 1.
Flow diagram of the recruitment process.
Figure 2.
Kaplan–Meier survival curves for patients diagnosed with delirium at admittance (prevalent cohort) versus patients without delirium diagnosis. Data were censored after 1 month in plot (A), 6 months in plot (B), 1 year in plot (C), and 2 years in plot (D). Note: In the plots, delirium = 1 for patients with no delirium diagnosis (blue curve in the plots). Time was expressed in days. The p-value shown in the plots corresponds to the log-rank test comparison of no delirium versus delirium survival probability curves.
Figure 3.
Kaplan–Meier survival curves for patients diagnosed with delirium at admittance or during the stay (incident cohort) versus patients without delirium diagnosis. Data were censored after 1 month in plot (A), 6 months in plot (B), 1 year in plot (C), and 2 years in plot (D). Note: In the plots, ConfusionalSyndrome = 1 for patients with no delirium diagnosis (blue curve in the plots). Time was expressed in days. The p-value shown in the plots corresponds to the log-rank test comparison of no delirium versus delirium survival probability curves.
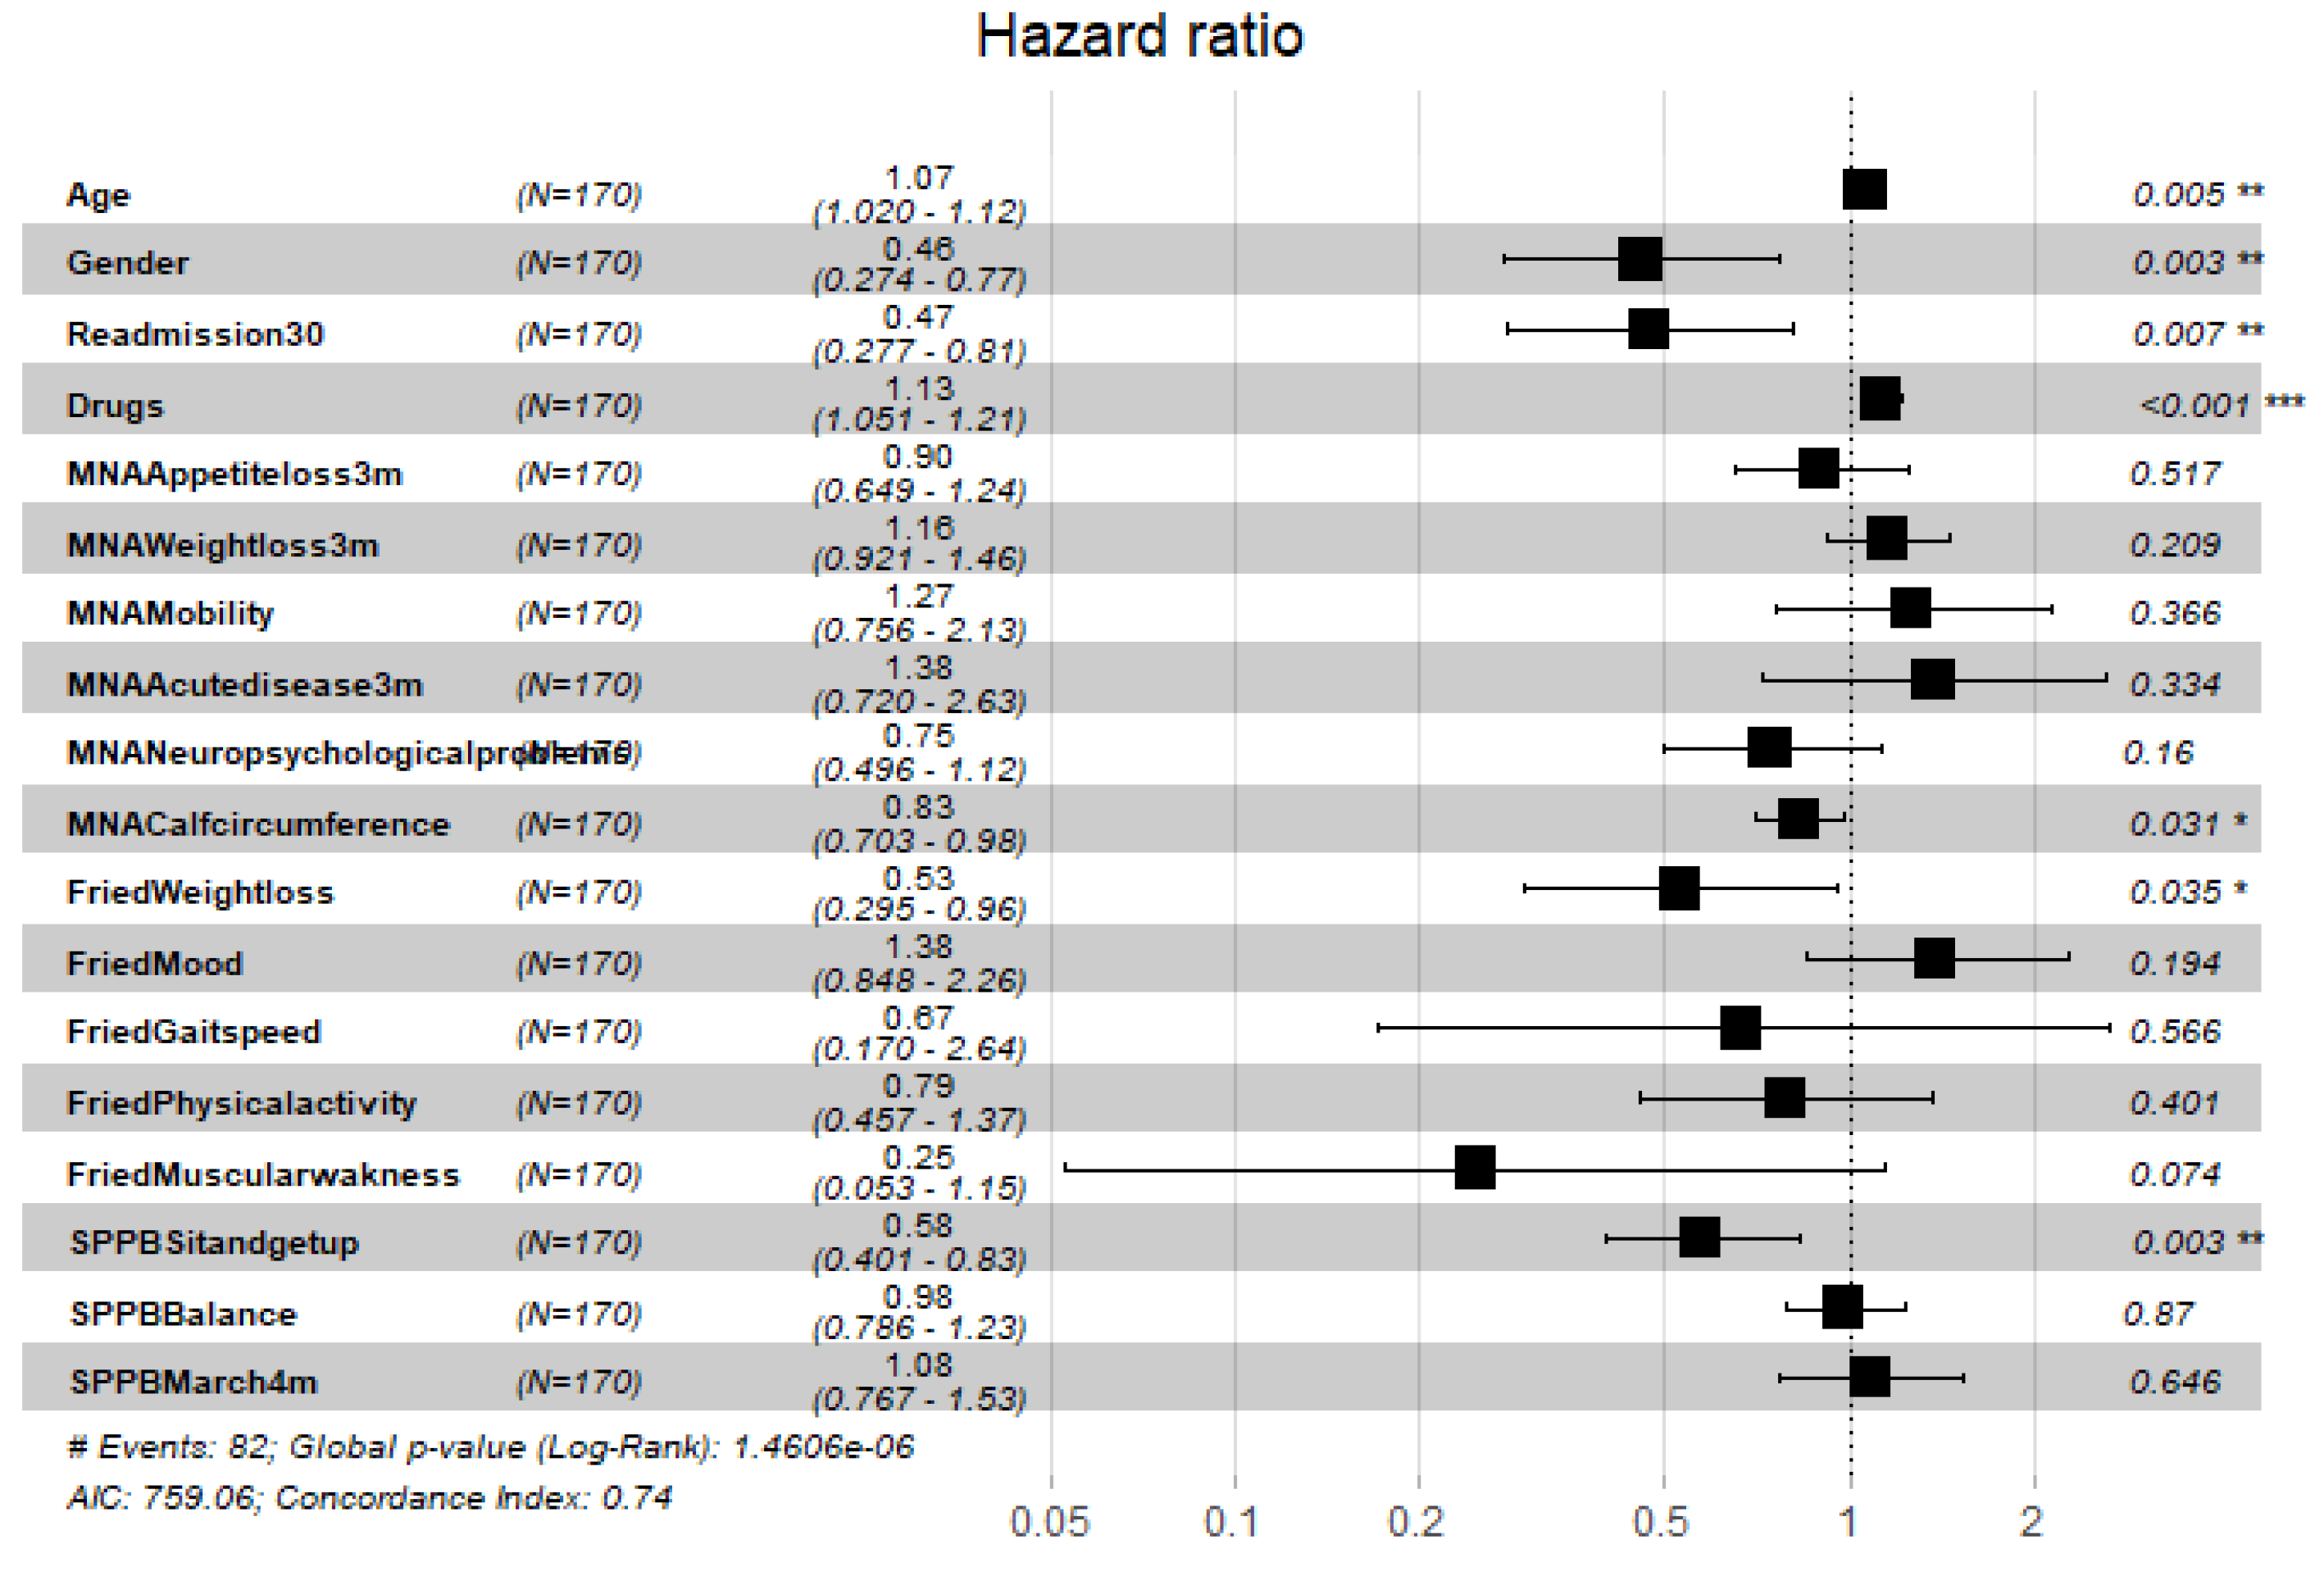
Figure 4.
Hazard ratios of demographic variables and frailty scores for the prevalent cohort, data censored at 2 years. Note: left to right columns are the variable name, population size, HR (95% confidence interval), graphical representation of HR (95%CI), and-p-value . AIC—Akaike Information Criterion; signif. codes: 0 ‘***’ 0.001 ‘**’ 0.01 ‘*’ 0.05 ‘.’ 0.1 ‘ ’ 1; concordance is the probability of agreement between two random observations; global score log-rank test was significant at 0.05.
Figure 5.
Hazard ratios of demographic variables and frailty scores for the incident cohort, data censored at 2 years. Note: left to right columns are the variable name, population size, HR (95% confidence interval), graphical representation of HR (95%CI), and p-value . AIC—Akaike Information Criterion; signif. codes: 0 ‘***’ 0.001 ‘**’ 0.01 ‘*’ 0.05 ‘.’ 0.1 ‘ ’ 1; concordance is the probability of agreement between two random observations; global score log-rank test was significant at 0.05.
Figure 6.
Hazard ratios of comorbidities for the prevalent cohort, data censored at 2 years. Note: left to right columns are the variable name, population size, HR (95% confidence interval), graphical representation of HR (95%CI), and p-value . AIC—Akaike Information Criterion; signif. codes: 0 ‘***’ 0.001‘**’ 0.01 ‘*’ 0.05 ‘.’ 0.1 ‘ ’ 1; concordance is the probability of agreement between two random observations; global score log-rank test was significant at 0.05.
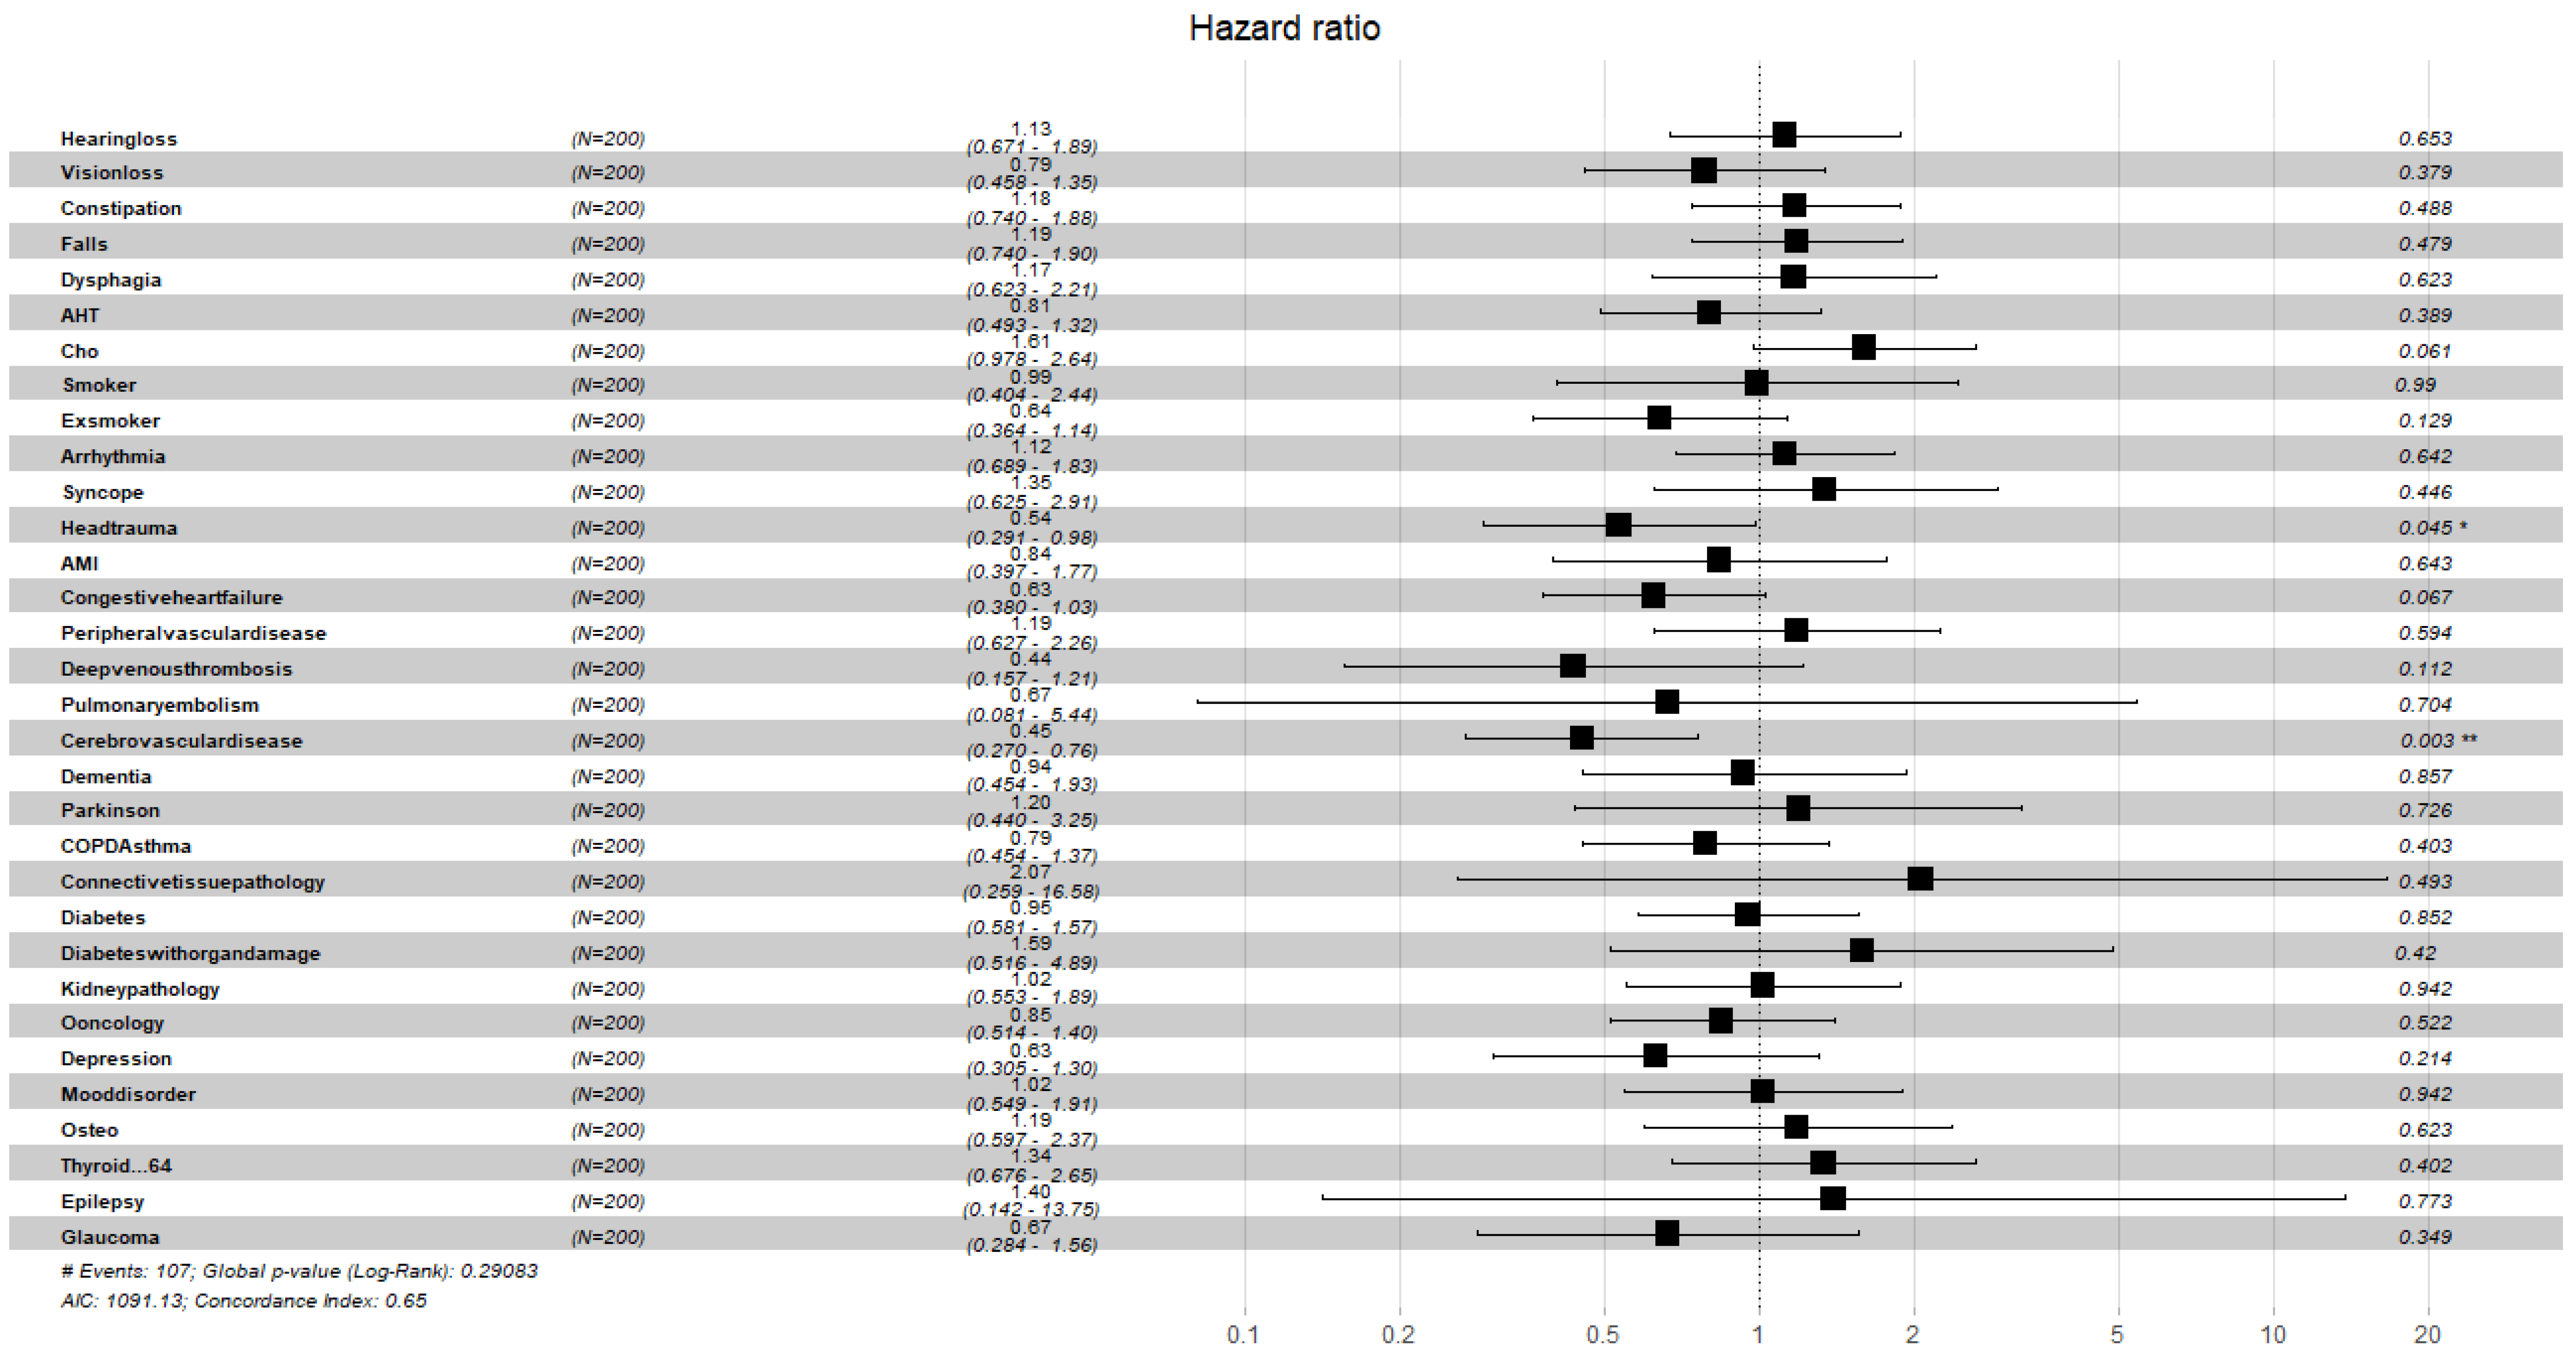
Figure 7.
Hazard ratios of comorbidities for the incident cohort, data censored at 2 years. Note: left to right columns are the variable name, population size, HR (95% confidence interval), graphical representation of HR (95%CI), and p-value . AIC—Akaike Information Criterion; signif. codes: 0 ‘***’ 0.001 ‘**’ 0.01 ‘*’ 0.05 ‘.’ 0.1 ‘ ’ 1; concordance is the probability of agreement between two random observations; global score log-rank test was significant at 0.05.
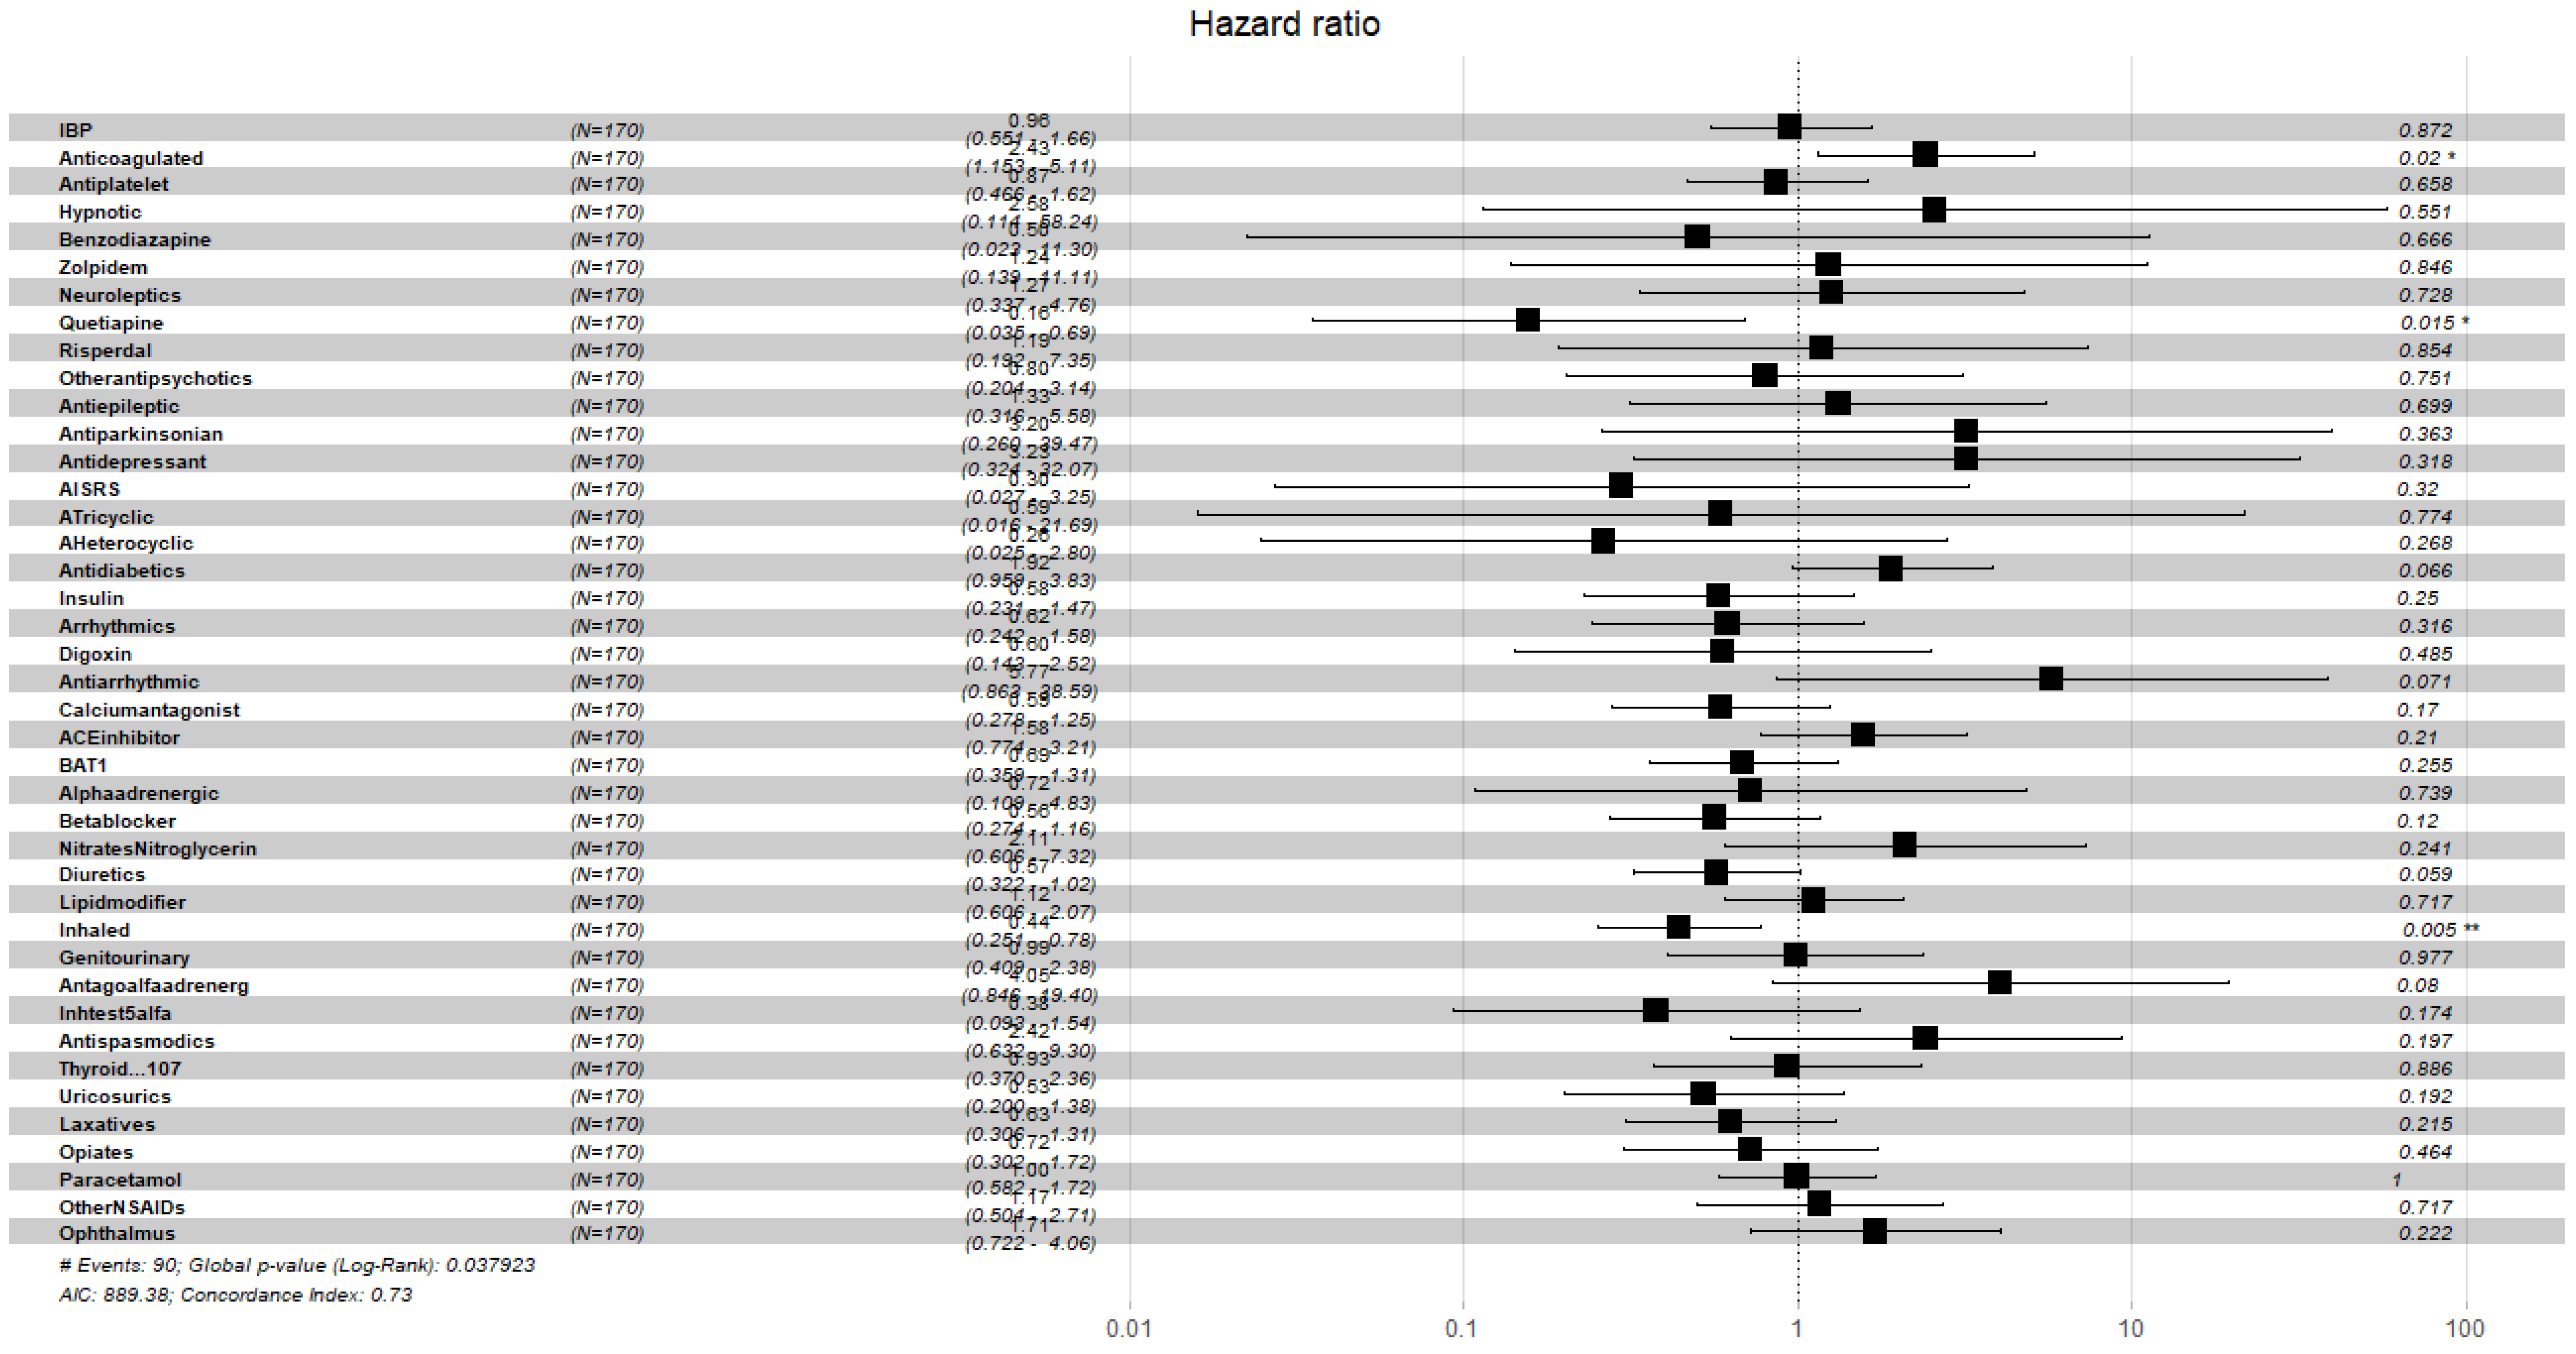
Figure 8.
Hazard ratios of pharmacological variables for the prevalent cohort, data censored at 2 years. Note: left to right columns are the variable name, population size, HR (95% confidence interval), graphical representation of HR (95%CI), and p-value . AIC—Akaike Information Criterion; signif. codes: 0 ‘***’ 0.001 ‘**’ 0.01 ‘*’ 0.05 ‘.’ 0.1 ‘ ’ 1; concordance is the probability of agreement between two random observations; global score log-rank test was significant at 0.05.
Figure 9.
Hazard ratios of pharmacological variables for the incident cohort, data censored at 2 years. Note: left to right columns are the variable name, population size, HR (95% confidence interval), graphical representation of HR (95%CI), and p-value . AIC—Akaike Information Criterion; signif. codes: 0 ‘***’ 0.001 ‘**’ 0.01 ‘*’ 0.05 ‘.’ 0.1 ‘ ’ 1; concordance is the probability of agreement between two random observations; global score log-rank test was significant at 0.05.
Table 1.
Demographics information of the cohorts.
Table 1.
Demographics information of the cohorts.
| Variable | Categories | N Total | % | ND (N = 541) | P (N = 170) | I (N = 200) |
|---|
| | | | | % | % | | % | |
| Gender | Male | 382 | 51.55 | 53.97 | 43.53 | 0.017 | 45.00 | 0.030 |
| Female | 359 | 48.45 | 46.03 | 56.47 | 55.00 |
| Weight (kg) | Mean (SD) | 67.43 (13.60) | 68.02 (13.00) | 67.43 (13.61) | <0.001 | 67.43 (13.60) | <0.001 |
| Age (years) | Mean (SD) | 84.37 (6.76) | 83.43 (6.67) | 84.37 (6.76) | <0.001 | 84.37 (6.76) | <0.001 |
| MS | Married | 265 | 35.60 | 36.41 | 30.58 | 0.109 | 33.00 | 0.543 |
| Single | 65 | 8.90 | 9.06 | 8.24 | 0.778 | 8.00 | 0.652 |
| Divorced | 13 | 1.80 | 1.48 | 2.35 | 0.499 | 2.50 | 0.348 |
| Widowed | 265 | 35.70 | 31.98 | 47.65 | <0.001 | 47.00 | <0.001 |
| NA | 133 | 18.00 | 21.07 | 11.18 | 0.009 | 9.50 | <0.001 |
| HD | Yes | 501 | 67.61 | 62.47 | 79.41 | 0.002 | 81.50 | <0.001 |
| No | 241 | 32.39 | 37.53 | 20.59 | 18.50 |
| NWS | Yes | 419 | 56.54 | 52.12 | 66.47 | 0.443 | 68.00 | 0.189 |
| No | 322 | 43.46 | 47.88 | 33.53 | 32.00 |
| Living at | Own home | 530 | 71.52 | 70.42 | 69.41 | <0.001 | 70.50 | <0.001 |
| Alone | 195 | 26.31 | 25.69 | 25.88 | 0.454 | 24.00 | 0.120 |
| Other’s home | 62 | 8.36 | 6.28 | 11.18 | 0.248 | 13.00 | 0.018 |
| Retirement house | 64 | 8.63 | 6.09 | 16.47 | <0.001 | 14.50 | 0.003 |
| Polypharmacy | Oligopharma <5 | 178 | 24.02 | 25.32 | 22.35 | 0.562 | 20.50 | 0.173 |
| Moderate (5–9) | 358 | 48.31 | 49.72 | 44.71 | 0.267 | 45.00 | 0.254 |
| Severe (>9) | 205 | 27.67 | 24.96 | 32.94 | 0.072 | 34.50 | 0.010 |
| Prevalent delirium | 170 | 22.94 | | | | | |
| Incident delirium | 200 | 26.99 | | | | | |
Table 2.
Reasons for admission.
Table 2.
Reasons for admission.
| Reason for Admission | N | % |
|---|
| Heart failure | 216 | 29.14 |
| Infection | 323 | 43.58 |
| Anemia | 79 | 10.66 |
| CAL | 101 | 13.63 |
| DM | 48 | 6.47 |
| Delirium | 170 | 22.94 |
| Fall | 119 | 16.05 |
| Neurological | 67 | 9.04 |
| Oncology | 35 | 4.72 |
| OC | 63 | 8.50 |
| Kidney failure | 96 | 12.95 |
Table 3.
Distribution of the frailty and cognitive test scores.
Table 3.
Distribution of the frailty and cognitive test scores.
| Test | Score | N | % |
|---|
| SPPB | Minimum (10–12) | 95 | 12.91 |
| Light (7–9) | 169 | 22.97 |
| Moderate (4–6) | 232 | 31.52 |
| Severe (0–3) | 240 | 32.60 |
| FFI | Robust (0) | 17 | 2.32 |
| Pre-frail (1–3) | 213 | 29.14 |
| Frail (>3) | 501 | 68.54 |
| BIS | Independent | 237 | 35.06 |
| Mild (>60) | 362 | 53.55 |
| Moderate (40–55) | 57 | 8.43 |
| Severe (20–35) | 13 | 1.92 |
| Total Dependence (<20) | 7 | 1.04 |
| MNA-SF | Normal (12–14) | 261 | 35.56 |
| At Risk (8–11) | 348 | 47.41 |
| Poor nutrition (0–7) | 125 | 17.03 |
| PBSTD | Normal (0–2) | 465 | 63.27 |
| Light (3–4) | 128 | 17.41 |
| Moderate (5–7) | 108 | 14.70 |
| Severe (8–10) | 34 | 4.62 |
Table 4.
Log-rank test results of comparison of survival probability curves of delirium cohorts versus no delirium cohort at chosen censoring dates.
Table 4.
Log-rank test results of comparison of survival probability curves of delirium cohorts versus no delirium cohort at chosen censoring dates.
| Cohort | 1 month | 6 month | 1 year | 2 years |
|---|
| prevalent | *** | *** | *** | *** |
| incident | *** | *** | *** | *** |
Table 5.
Summary of variables with significant hazard risk found by Cox’s regression carried out over families of variables for the prevalent cohort, data censored after 1 month, 6 months, 1 year, and 2 years.
Table 5.
Summary of variables with significant hazard risk found by Cox’s regression carried out over families of variables for the prevalent cohort, data censored after 1 month, 6 months, 1 year, and 2 years.
| | 1 month | 6 months | 1 year | 2 years |
|---|
| Variable | HR (95%CI) | HR (95%CI) | HR (95%CI) | HR (95%CI) |
| Age | 1.05 (1.00,1.09) | 1.04 (1.00,1.09) | 1.05 (1.00,1.10) | 1.05 (1.00,1.10) |
| Gender | 0.63 (0.38,1.02) | 0.52 (0.31,0.86) | 0.48 (0.28,0.80) | 0.48 (0.28,0.80) |
| R30 | 0.65 (0.38,1.11) | 0.53 (0.31,0.90) | 0.53 (0.30,0.89) | 0.52 (0.30,0.89) |
| ND | 1.08 (1.01,1.15) | 1.10 (1.03,1.18) | 1.13 (1.05,1.21) | 1.13 (1.05,1.21) |
| MNA-SF-CC | 0.90 (0.76,1.06) | 0.85 (0.72,1.00) | 0.83 (0.70,0.98) | 0.83 (0.70,0.98) |
| FFI-WL | 0.55 (0.30,0.99) | 0.59 (0.32,1.05) | 0.50 (0.27,0.90) | 0.53 (0.29,0.94) |
| SPPB-SUG | 0.72 (0.504,01.02) | 0.68 (0.47,0.98) | 0.65 (0.45,0.94) | 0.64 (0.44,0.92) |
| Falls | 1.65 (0.98,2.74) | 1.53 (0.91,2.56) | 1.46 (0.87,2.46) | 1.40 (0.83,2.35) |
| Cholesterol | 1.55 (0.91,2.61) | 1.61 (0.95,2.72) | 1.63 (0.96,2.76) | 1.52 (0.89,2.57) |
| Head Trauma | 0.51 (0.262,1.00) | 0.54 (0.28,1.07) | 0.53 (0.26,1.06) | 0.54 (0.27,1.06) |
| CD | 0.49 (0.27,0.87) | 0.47 (0.26,0.84) | 0.48 (0.26,0.87) | 0.52 (0.28,0.96) |
| Anticoagulated | 1.74 (0.85,3.54) | 2.11 (1.01,4.38) | 2.37 (1.12,4.98) | 2.43 (1.15,5.11) |
| Quetiapine | 0.23 (0.05,0.93) | 0.16 (0.03,0.67) | 0.15 (0.03,0.66) | 0.16 (0.03,0.69) |
| Diuretics | 0.61 (0.34,1.08) | 0.58 (0.32,1.03) | 0.60 (0.33,1.06) | 0.57 (0.32,1.02) |
| IB | 0.51 (0.29,0.87) | 0.43 (0.24,0.75) | 0.43 (0.24,0.75) | 0.44 (0.25,0.78) |
Table 6.
Summary of variables with significant hazard risk found by Cox’s regression carried out over families of variables for the incident cohort, data censored after 1 month, 6 months, 1 year, and 2 years.
Table 6.
Summary of variables with significant hazard risk found by Cox’s regression carried out over families of variables for the incident cohort, data censored after 1 month, 6 months, 1 year, and 2 years.
| | 1 month | 6 months | 1 year | 2 years |
|---|
| Variable | HR (95%CI) | HR (95%CI) | HR (95%CI) | HR (95%CI) |
| Age | 1.05 (1.00,1.1) | 1.05 (1.01,1.10) | 1.06 (1.01,1.11) | 1.07 (1.02,1.11) |
| Gender | 0.65 (0.42,1.0) | 0.48 (0.30,0.75) | 0.43 (0.26,0.69) | 0.43 (0.26,0.69) |
| R30 | 0.62 (0.39,1.0) | 0.51 (0.32,0.83) | 0.51 (0.31,0.81) | 0.50 (0.30,0.80) |
| ND | 1.07 (1.00,1.14) | 1.08 (1.02,1.15) | 1.10 (1.03,1.17) | 1.10 (1.03,1.18) |
| FFI | 1.72 (0.92,3.2) | 1.82 (0.98,3.41) | 1.83 (0.98,3.41) | 1.81 (0.97,3.36) |
| FFI-WL | 0.50 (0.30,0.83) | 0.51 (0.31,0.84) | 0.42 (0.25,0.70) | 0.45 (0.26,0.74) |
| SPPB-SGU | 0.74 (0.55,1.01) | 0.71 (0.52,0.97) | 0.68 (0.50,0.93) | 0.67 (0.49,0.92) |
| Cholesterol | 1.62 (0.99,2.64) | 1.68 (1.03,2.76) | 1.70 (1.03,2.80) | 1.61 (0.97,2.64) |
| Head Trauma | 0.54 (0.29,0.99) | 0.56 (0.30,1.03) | 0.56 (0.30,1.04) | 0.54 (0.29,0.98) |
| CD | 0.47 (0.29,0.77) | 0.44 (0.26,0.72) | 0.44 (0.26,0.73) | 0.45 (0.27,0.76) |
| Diuretics | 0.58 (0.35,0.97) | 0.59 (0.34,0.98) | 0.59 (0.35,0.99) | 0.57 (0.34,0.96) |
| -Adrenergic Antagonist | 2.68 (0.74,9.65) | 3.69 (0.98,13.78) | 3.92 (1.07,14.37) | 4.17 (1.09,15.87) |
| Testosterone inhibitors | 0.36 (0.11,1.18) | 0.31 (0.09,1.04) | 0.28 (0.08,0.94) | 0.28 (0.08,0.94) |


 ,
, 


