
Predicting Interest in Orthodontic Aligners: A Google Trends Data Analysis

 , , and
Abstract
:1. Introduction
2. Materials and Methods
3. Results
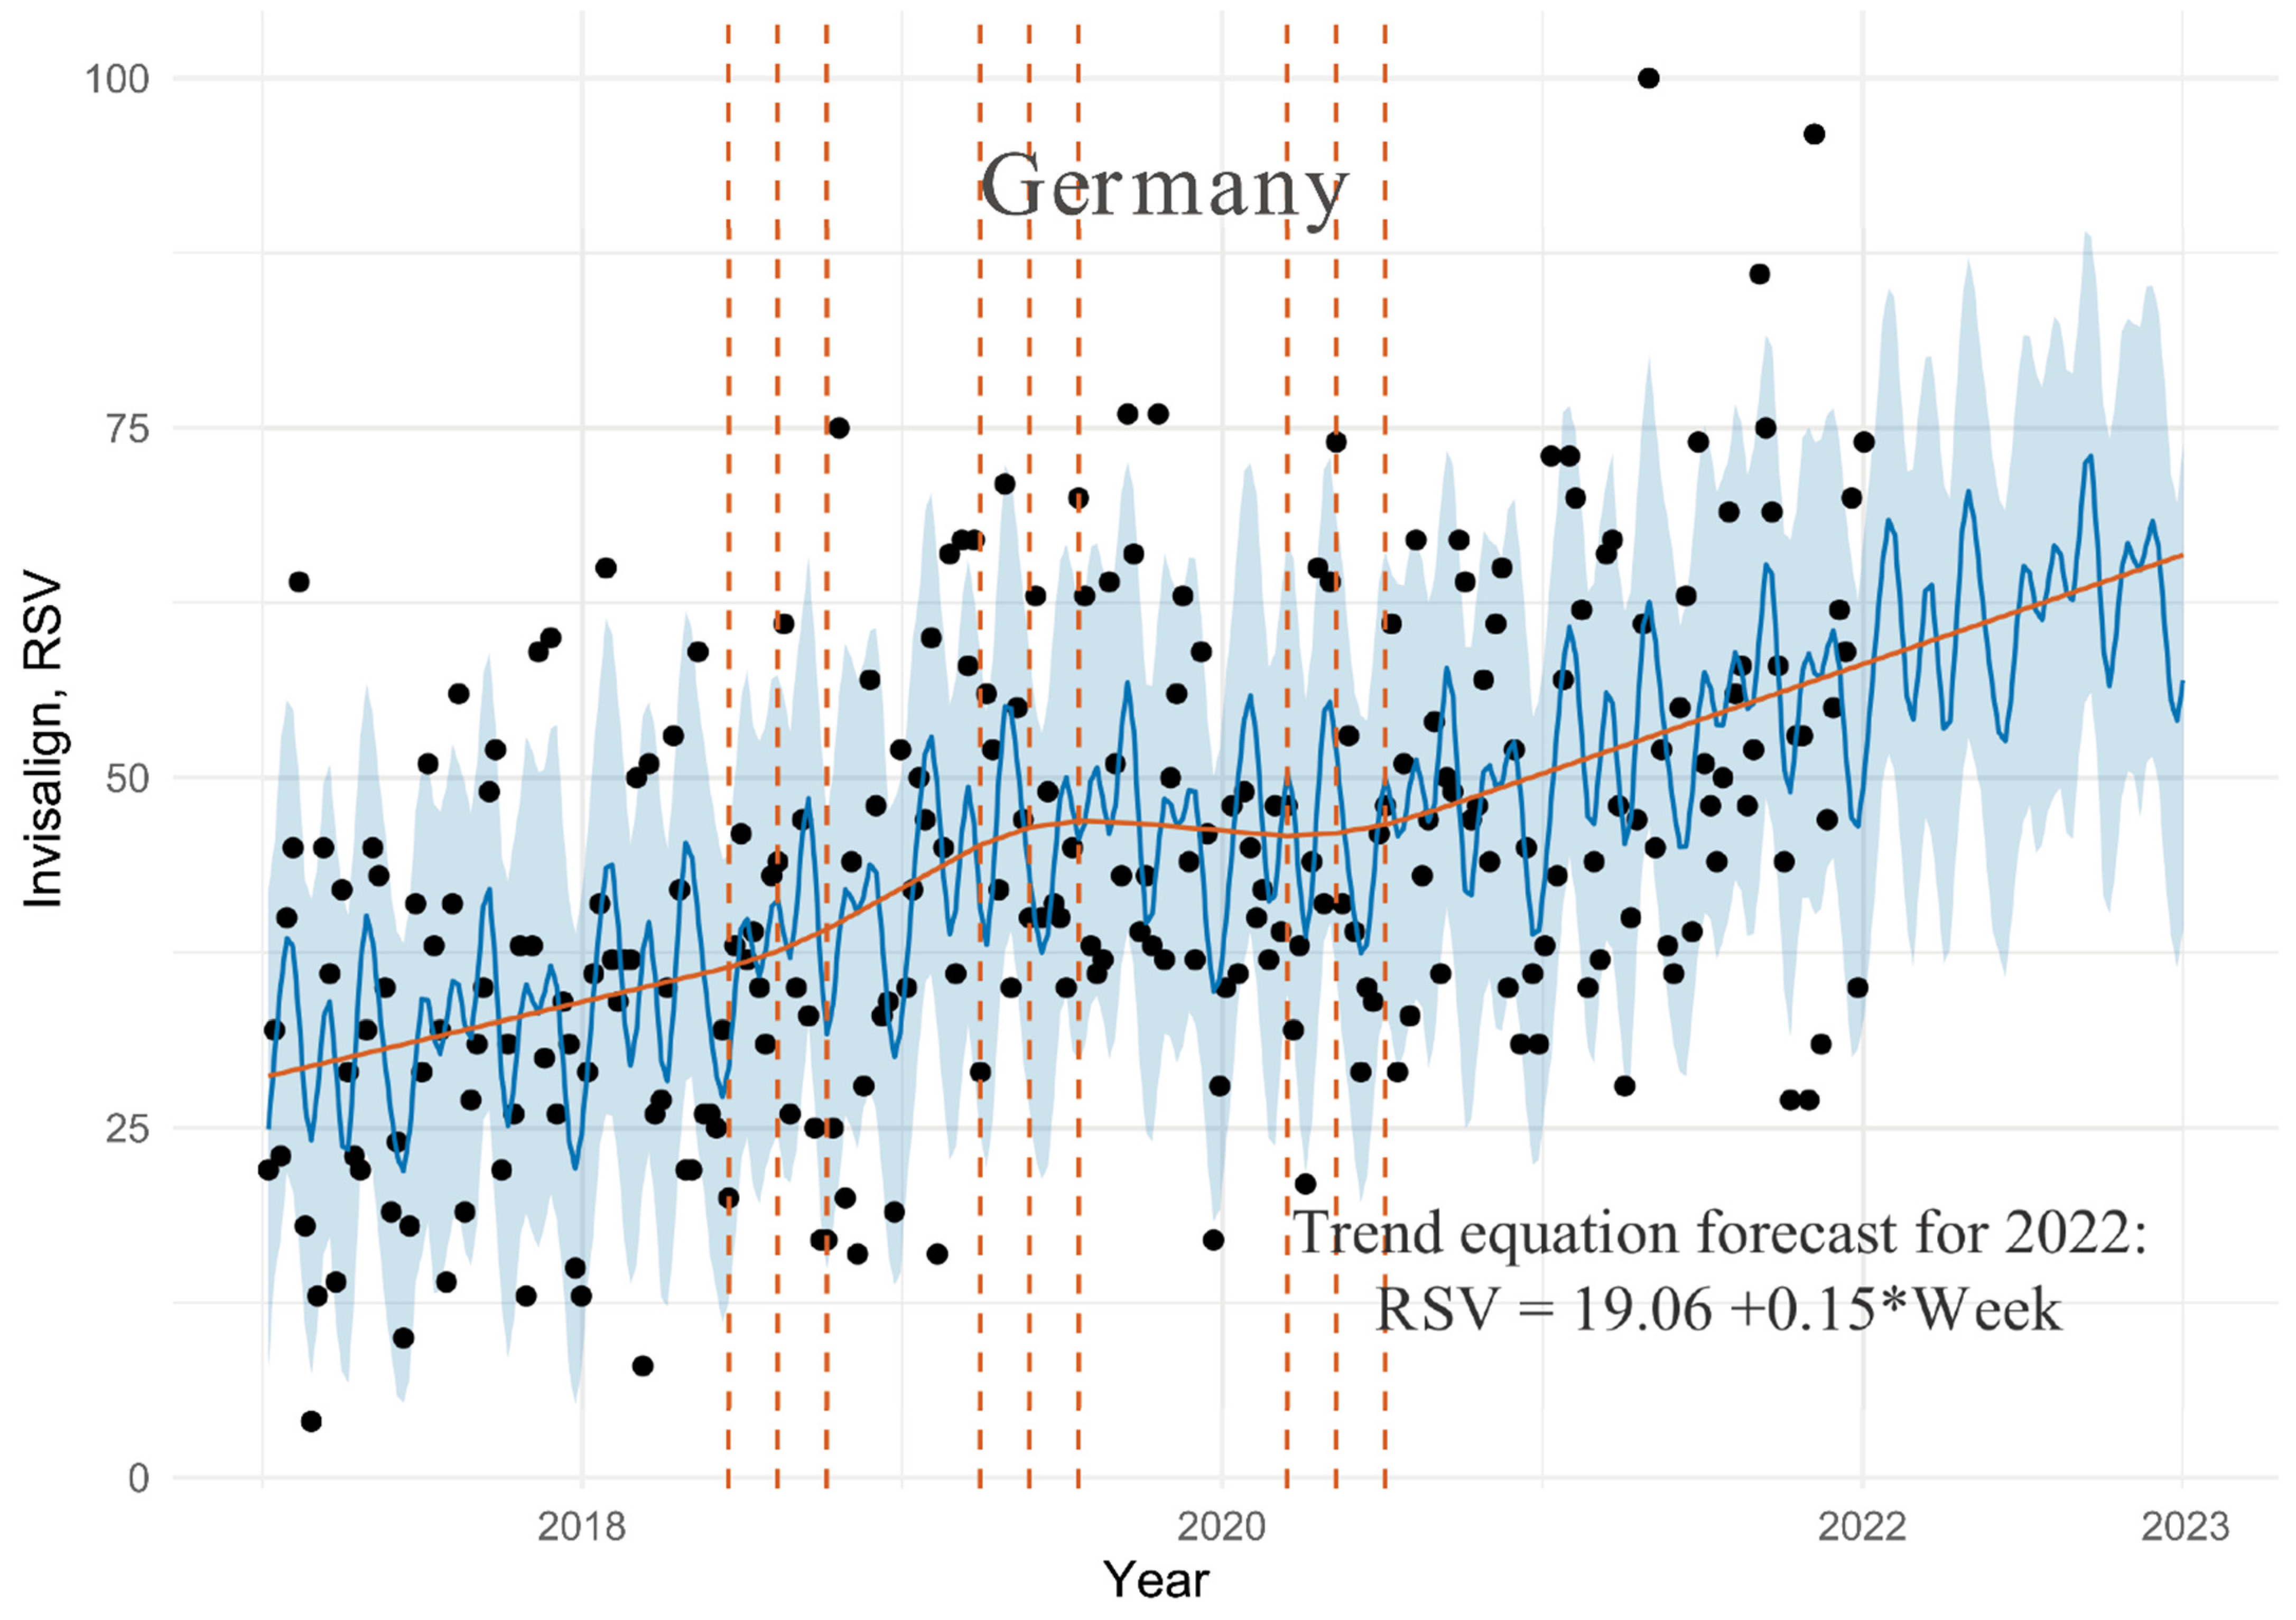
3.1. Germany Dataset
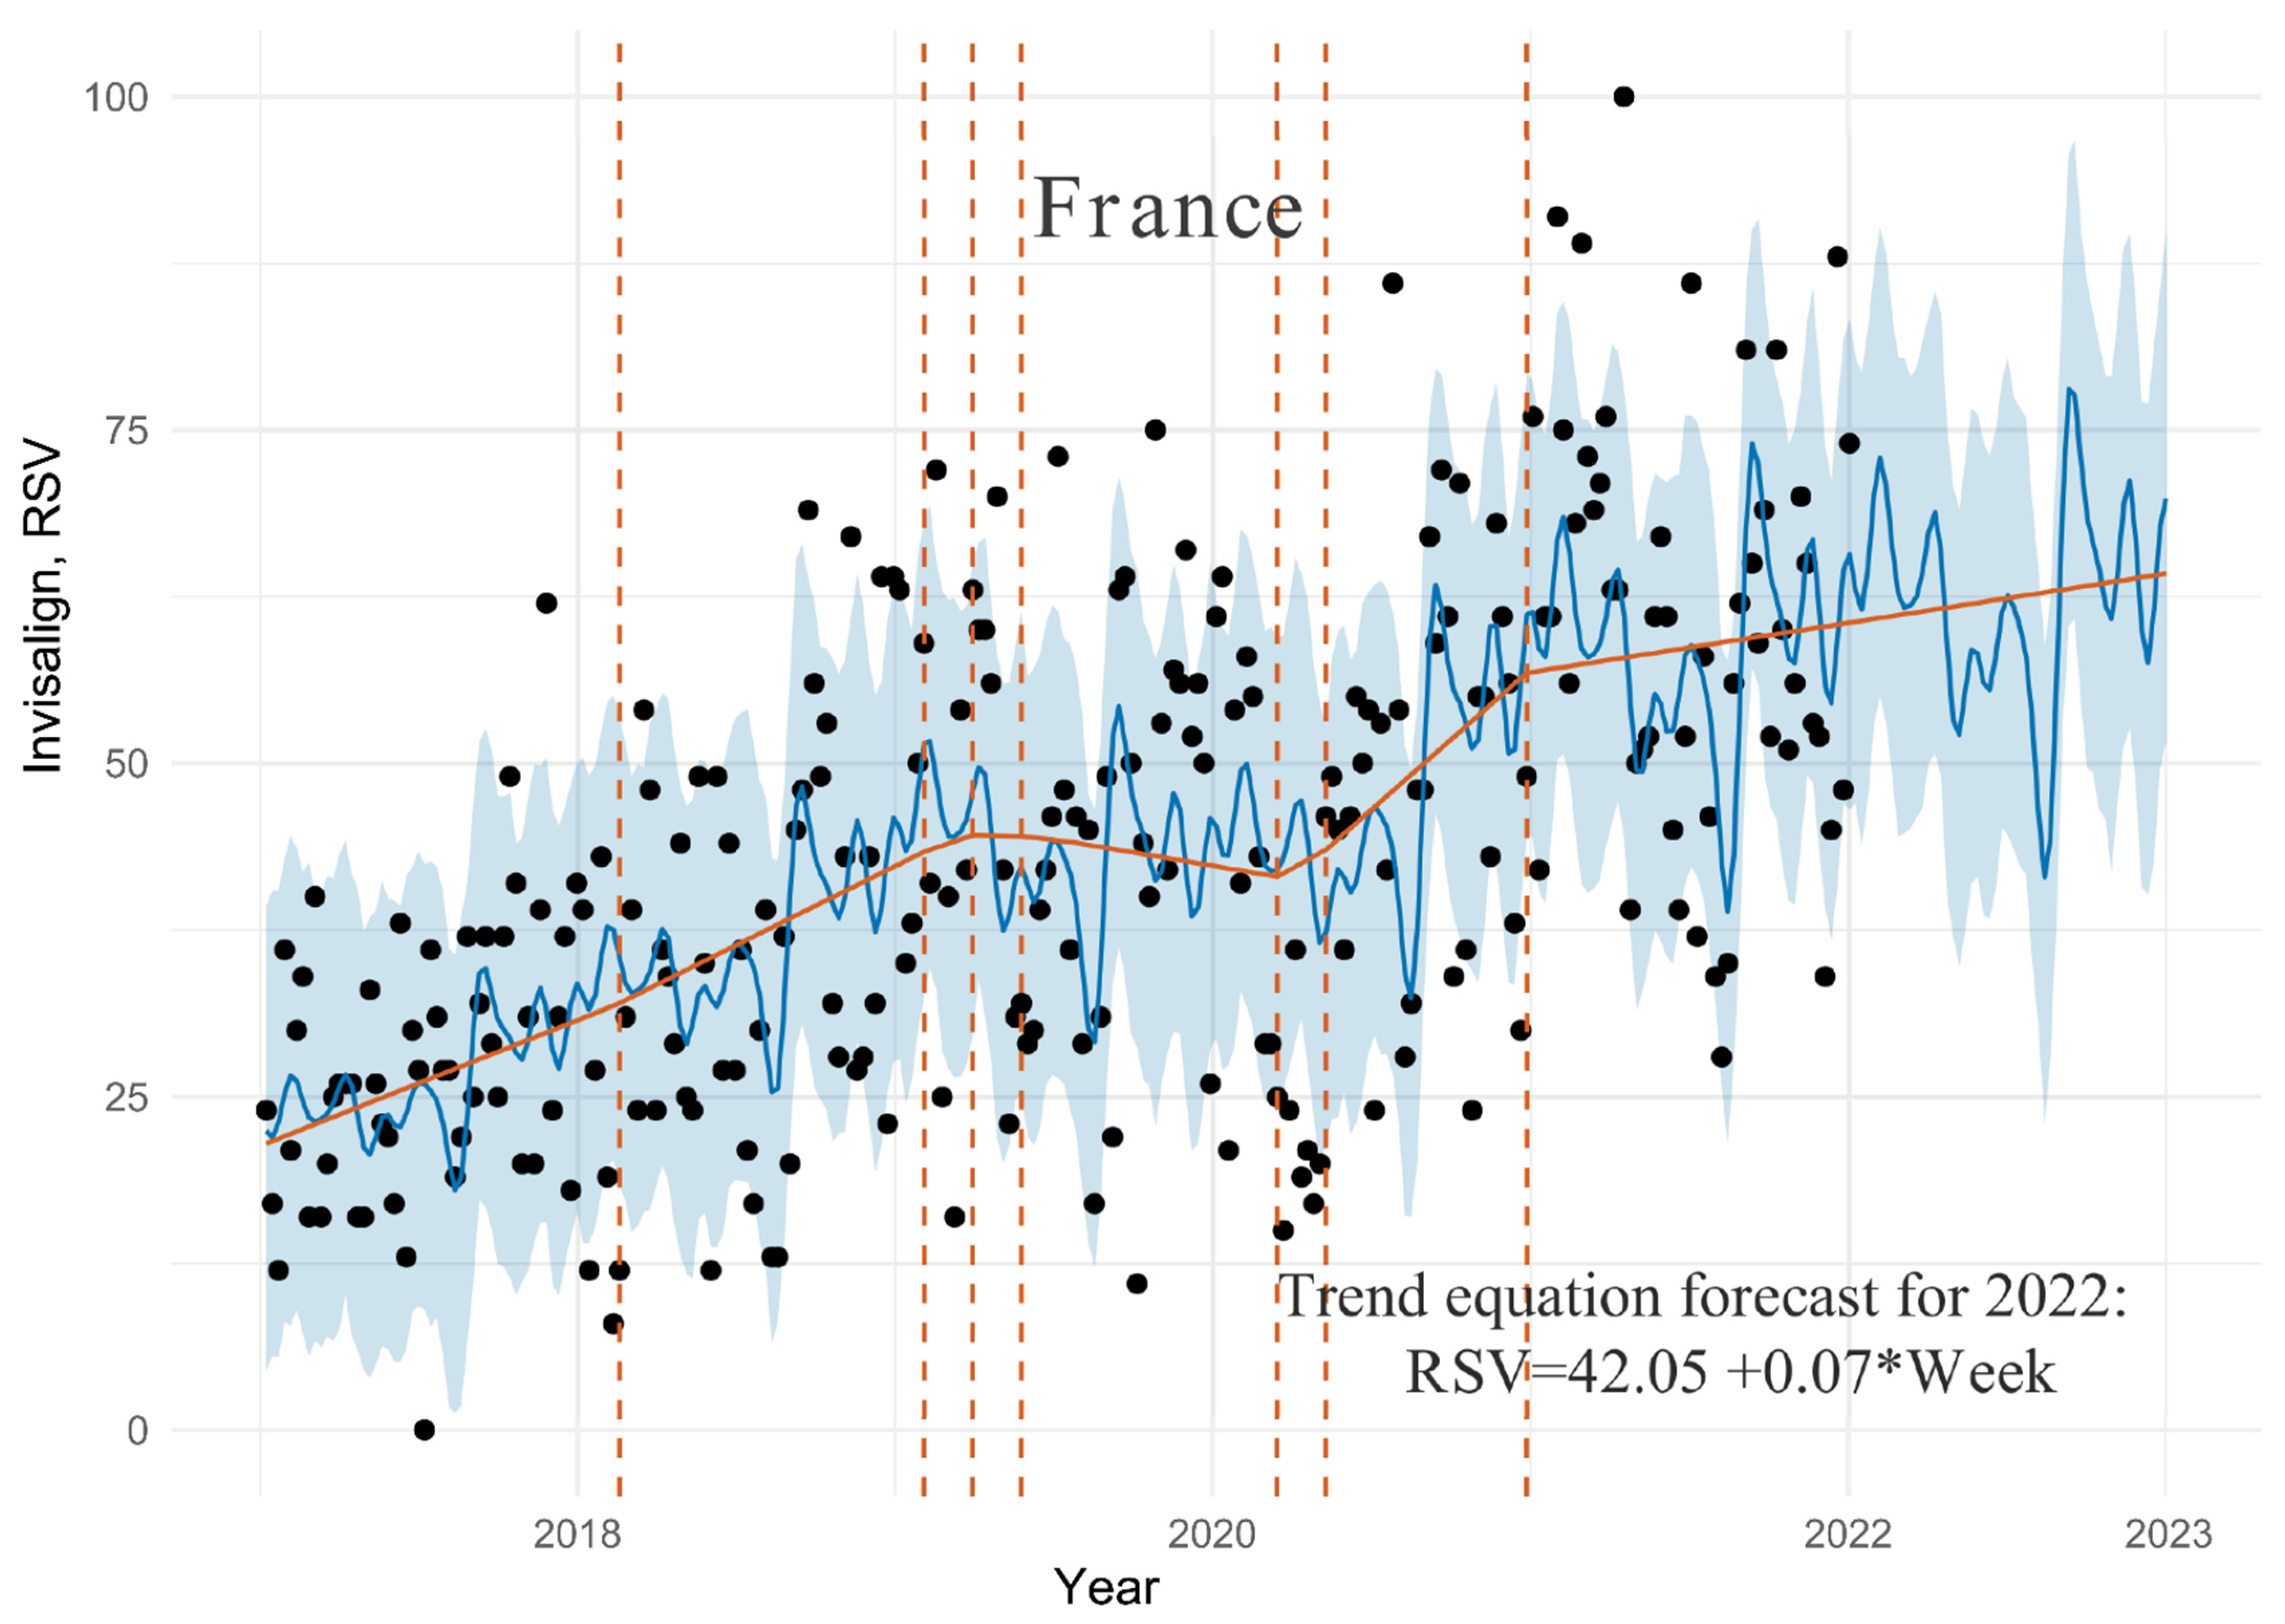
3.2. France Dataset
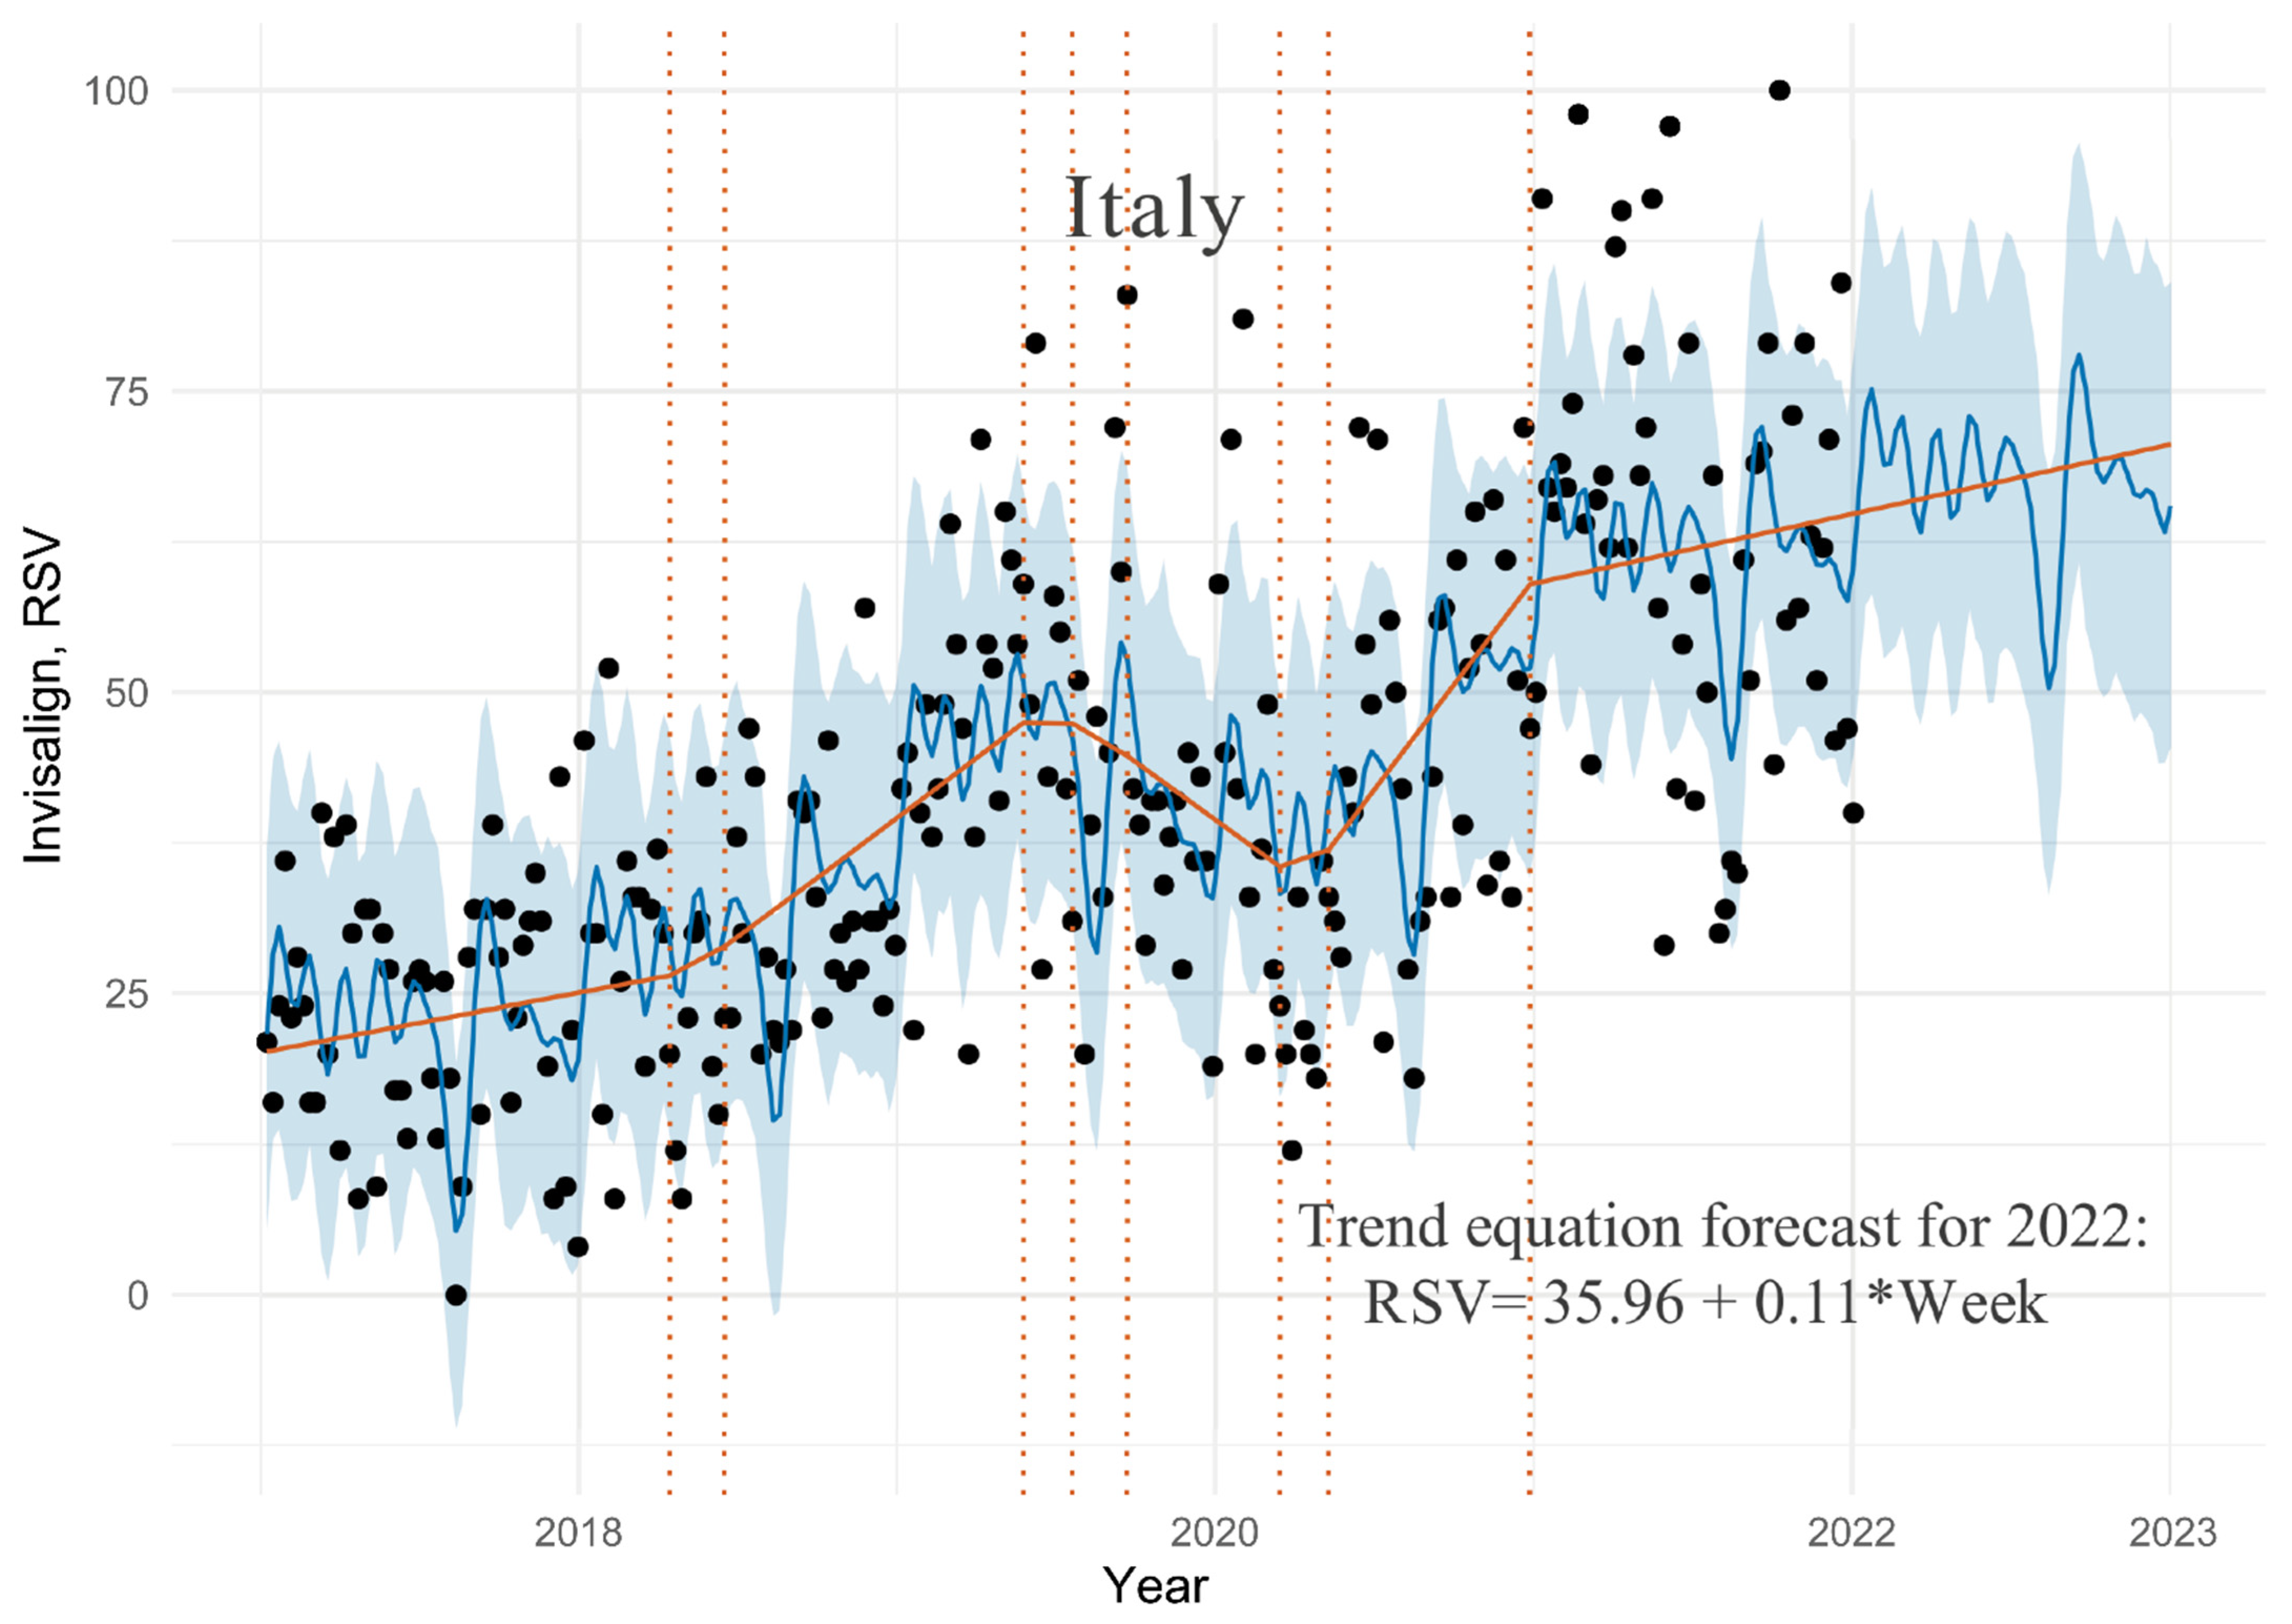
3.3. Italy Dataset
4. Discussion
5. Conclusions
Author Contributions
Funding
Institutional Review Board Statement
Informed Consent Statement
Data Availability Statement
Conflicts of Interest
References
- Monill-González, A.; Rovira-Calatayud, L.; d’Oliveira, N.G.; Ustrell-Torrent, J.M. Artificial Intelligence in Orthodontics: Where Are We Now? A Scoping Review. Orthod. Craniofacial Res. 2021, 24, 6–15. [Google Scholar] [CrossRef]
- Blatz, M.B.; Chiche, G.; Bahat, O.; Roblee, R.; Coachman, C.; Heymann, H.O. Evolution of Aesthetic Dentistry. J. Dent. Res. 2019, 98, 1294–1304. [Google Scholar] [CrossRef] [PubMed]
- Galan-Lopez, L.; Barcia-Gonzalez, J.; Plasencia, E. A Systematic Review of the Accuracy and Efficiency of Dental Movements with Invisalign®. Korean J. Orthod. 2019, 49, 140. [Google Scholar] [CrossRef] [PubMed]
- Proffit, W.R. Contemporary Orthodontics, 6th ed.; Elsevier: Philadelphia, IL, USA, 2018. [Google Scholar]
- Invisalign Treatment|Invisalign Clear Aligners. Available online: https://www.invisalign.com/ (accessed on 1 January 2022).
- Sycinska-Dziarnowska, M.; Bielawska-Victorini, H.; Budzyńska, A.; Woźniak, K. The Implications of the COVID-19 Pandemic on the Interest in Orthodontic Treatment and Perspectives for the Future. Real-Time Surveillance Using Google Trends. Int. J. Environ. Res. Public Health 2021, 18, 5647. [Google Scholar] [CrossRef] [PubMed]
- Sycinska-Dziarnowska, M.; Maglitto, M.; Woźniak, K.; Spagnuolo, G. Oral Health and Teledentistry Interest during the COVID-19 Pandemic. J. Clin. Med. 2021, 10, 3532. [Google Scholar] [CrossRef] [PubMed]
- Noll, D.; Mahon, B.; Shroff, B.; Carrico, C.; Lindauer, S.J. Twitter Analysis of the Orthodontic Patient Experience with Braces vs Invisalign. Angle Orthod. 2017, 87, 377–383. [Google Scholar] [CrossRef] [Green Version]
- Adobes-Martin, M.; Montoya-Morcillo, M.; Zhou-Wu, A.; Garcovich, D. Invisalign Treatment from the Patient Perspective: A Twitter Content Analyses. J. Clin. Exp. Dent. 2021, 13, e376–e382. [Google Scholar] [CrossRef]
- Andreassen, H.K.; Bujnowska-Fedak, M.M.; Chronaki, C.E.; Dumitru, R.C.; Pudule, I.; Santana, S.; Voss, H.; Wynn, R. European Citizens’ Use of E-Health Services: A Study of Seven Countries. BMC Public Health 2007, 7, 53. [Google Scholar] [CrossRef] [Green Version]
- Google Trends. Available online: https://trends.google.com/trends (accessed on 3 January 2022).
- Clear Aligners—Wikipedia. Available online: https://en.wikipedia.org/wiki/Clear_aligners (accessed on 4 January 2022).
- Ustdal, G.; Guney, A.U. YouTube as a Source of Information about Orthodontic Clear Aligners. Angle Orthod. 2020, 90, 419–424. [Google Scholar] [CrossRef] [Green Version]
- List of Countries by GDP (Nominal). Available online: https://en.wikipedia.org/wiki/List_of_countries_by_GDP_(nominal) (accessed on 1 January 2022).
- R Core Team. R: A Language and Environment for Statistical Computing; R Foundation for Statistical Computing: Vienna, Austria, 2021; Available online: https://www.R-project.org (accessed on 3 January 2022).
- Taylor, S.; Letham, B. Prophet: Automatic Forecasting Procedure. 2021. Available online: https://CRAN.R-project.org/package=prophet (accessed on 4 January 2022).
- Hayashi, H. FAQ on Time Series Forecasting with Prophet. Available online: https://exploratory.io/note/hideaki/FAQ-on-Time-Series-Forecasting-with-Prophet-GuL5xAD0Uw (accessed on 2 January 2022).
- Taylor, S.J.; Letham, B. Forecasting at Scale. PeerJ 2017, 5, e3190. Available online: https://peerj.com/preprints/3190v2 (accessed on 2 January 2022). [CrossRef]
- Harvey, A.C.; Peters, S. Estimation Procedures for Structural Time Series Models. J. Forecast. 1990, 9, 89–108. [Google Scholar] [CrossRef]
- Harvey, A.C.; Shephard, N. Structural time series models. In Handbook of Statistics; North Holland: Amsterdam, The Netherlands, 1993; Volume 11, pp. 261–302. [Google Scholar]
- Carpenter, B.; Gelman, A.; Hoffman, M.D.; Lee, D.; Goodrich, B.; Betancourt, M.; Brubaker, M.; Guo, J.; Li, P.; Riddell, A. Stan: A Probabilistic Programming Language. J. Stat. Soft. 2017, 76, 1–32. [Google Scholar] [CrossRef] [Green Version]
- Stan. Stan Developers and Their Assignees. Available online: https://github.com/stan-dev/stan (accessed on 5 January 2022).
- Fletcher, R. Practical Methods of Optimization, 2rd ed.; A Wiley-Interscience Publication; Wiley: Chichester, UK, 2008. [Google Scholar]
- Box, G.E.P.; Pierce, D.A. Distribution of Residual Autocorrelations in Autoregressive-Integrated Moving Average Time Series Models. J. Am. Stat. Assoc. 1970, 65, 1509–1526. [Google Scholar] [CrossRef]
- Ljung, G.M.; Box, G.E.P. On a Measure of Lack of Fit in Time Series Models. Biometrika 1978, 65, 297–303. [Google Scholar] [CrossRef]
- Marya, A. Utilizing Aligners to Solve the COVID-19-Affected Orthodontic Practice Conundrum! J. Adv. Oral Res. 2020, 11, 117–119. [Google Scholar] [CrossRef]
- Cotrin, P.; Peloso, R.M.; Pini, N.I.P.; Oliveira, R.C.; de Oliveira, R.C.G.; Valarelli, F.P.; Freitas, K.M.S. Urgencies and Emergencies in Orthodontics during the Coronavirus Disease 2019 Pandemic: Brazilian Orthodontists’ Experience. Am. J. Orthod. Dentofac. Orthop. 2020, 158, 661–667. [Google Scholar] [CrossRef]
- Gu, J.; Tang, J.S.; Skulski, B.; Fields, H.W.; Beck, F.M.; Firestone, A.R.; Kim, D.-G.; Deguchi, T. Evaluation of Invisalign Treatment Effectiveness and Efficiency Compared with Conventional Fixed Appliances Using the Peer Assessment Rating Index. Am. J. Orthod. Dentofac. Orthop. 2017, 151, 259–266. [Google Scholar] [CrossRef]
- Ke, Y.; Zhu, Y.; Zhu, M. A Comparison of Treatment Effectiveness between Clear Aligner and Fixed Appliance Therapies. BMC Oral Health 2019, 19, 24. [Google Scholar] [CrossRef]
- Fenton, G.D.; Cazaly, M.H.M.; Rolland, S.L.; Vernazza, C.R. Eliciting Preferences for Adult Orthodontic Treatment: A Discrete Choice Experiment. JDR Clin. Transl. Res. 2021, 238008442110126. [Google Scholar] [CrossRef]
- Farronato, G.; Re, D.; Augusti, G.; Butti, A.; Augusti, D. Biomimetic Orthodontic Treatments: Preferences of Adult Patients and Analysis of the Willingness-To-Pay Index. Dent. Cadmos 2016, 84, 408–417. [Google Scholar] [CrossRef]
- Thurzo, A.; Kurilová, V.; Varga, I. Artificial Intelligence in Orthodontic Smart Application for Treatment Coaching and Its Impact on Clinical Performance of Patients Monitored with AI-TeleHealth System. Healthcare 2021, 9, 1695. [Google Scholar] [CrossRef] [PubMed]
- Shalish, M.; Cooper-Kazaz, R.; Ivgi, I.; Canetti, L.; Tsur, B.; Bachar, E.; Chaushu, S. Adult Patients’ Adjustability to Orthodontic Appliances. Part I: A Comparison between Labial, Lingual, and Invisalign. Eur. J. Orthod. 2012, 34, 724–730. [Google Scholar] [CrossRef] [PubMed] [Green Version]
- Sharma, R.; Drummond, R.; Wiltshire, W.; Schroth, R.; Lekic, M.; Bertone, M.; Tate, R. Quality of Life in an Adolescent Orthodontic Population: Invisalign versus fixed appliances. Angle Orthod. 2021, 91, 718–724. [Google Scholar] [CrossRef] [PubMed]
- Pacheco-Pereira, C.; Brandelli, J.; Flores-Mir, C. Patient Satisfaction and Quality of Life Changes after Invisalign Treatment. Am. J. Orthod. Dentofac. Orthop. 2018, 153, 834–841. [Google Scholar] [CrossRef]
- Zamora-Martínez, N.; Paredes-Gallardo, V.; García-Sanz, V.; Gandía-Franco, J.L.; Tarazona-Álvarez, B. Comparative Study of Oral Health-Related Quality of Life (OHRQL) between Different Types of Orthodontic Treatment. Medicina 2021, 57, 683. [Google Scholar] [CrossRef]
- Papageorgiou, S.N.; Koletsi, D.; Iliadi, A.; Peltomaki, T.; Eliades, T. Treatment Outcome with Orthodontic Aligners and Fixed Appliances: A Systematic Review with Meta-Analyses. Eur. J. Orthod. 2020, 42, 331–343. [Google Scholar] [CrossRef]
- Papageorgiou, S.N.; Koletsi, D.; Iliadi, A.; Peltomäki, T.; Eliades, T. Comment on: Treatment Outcome with Orthodontic Aligners and Fixed Appliances: A Systematic Review with Meta-Analyses. Eur. J. Orthod. 2020, 42, 344–346. [Google Scholar] [CrossRef]
- Koletsi, D.; Iliadi, A.; Eliades, T. Predictability of Rotational Tooth Movement with Orthodontic Aligners Comparing Software-Based and Achieved Data: A Systematic Review and Meta-Analysis of Observational Studies. J. Orthod. 2021, 48, 277–287. [Google Scholar] [CrossRef]
- Jauhar, P.; Mossey, P.A.; Popat, H.; Seehra, J.; Fleming, P.S. A Survey of Undergraduate Orthodontic Teaching and Factors Affecting Pursuit of Postgraduate Training. Br. Dent. J. 2016, 221, 487–492. [Google Scholar] [CrossRef] [Green Version]
- Olson, J.C.; Shroff, B.; Carrico, C.; Boyle, J.; Lindauer, S.J. Comparison of Patient Factors Influencing the Selection of an Orthodontist, General Dentist, or Direct-to-Consumer Aligners. Am. J. Orthod. Dentofac. Orthop. 2020, 157, 526–532. [Google Scholar] [CrossRef]
- Top 10 Search Engines in The World (2022 Update). Available online: https://www.reliablesoft.net/top-10-search-engines-in-the-world/ (accessed on 12 January 2022).
- Compare Trends Search Terms—Trends Help. Available online: https://support.google.com/trends/answer/4359550?hl=en (accessed on 12 January 2022).
Publisher’s Note: MDPI stays neutral with regard to jurisdictional claims in published maps and institutional affiliations. |
© 2022 by the authors. Licensee MDPI, Basel, Switzerland. This article is an open access article distributed under the terms and conditions of the Creative Commons Attribution (CC BY) license (https://creativecommons.org/licenses/by/4.0/).
Share and Cite
Sycińska-Dziarnowska, M.; Szyszka-Sommerfeld, L.; Woźniak, K.; Lindauer, S.J.; Spagnuolo, G. Predicting Interest in Orthodontic Aligners: A Google Trends Data Analysis. Int. J. Environ. Res. Public Health 2022, 19, 3105. https://doi.org/10.3390/ijerph19053105
Sycińska-Dziarnowska M, Szyszka-Sommerfeld L, Woźniak K, Lindauer SJ, Spagnuolo G. Predicting Interest in Orthodontic Aligners: A Google Trends Data Analysis. International Journal of Environmental Research and Public Health. 2022; 19(5):3105. https://doi.org/10.3390/ijerph19053105
Chicago/Turabian StyleSycińska-Dziarnowska, Magdalena, Liliana Szyszka-Sommerfeld, Krzysztof Woźniak, Steven J. Lindauer, and Gianrico Spagnuolo. 2022. "Predicting Interest in Orthodontic Aligners: A Google Trends Data Analysis" International Journal of Environmental Research and Public Health 19, no. 5: 3105. https://doi.org/10.3390/ijerph19053105
APA StyleSycińska-Dziarnowska, M., Szyszka-Sommerfeld, L., Woźniak, K., Lindauer, S. J., & Spagnuolo, G. (2022). Predicting Interest in Orthodontic Aligners: A Google Trends Data Analysis. International Journal of Environmental Research and Public Health, 19(5), 3105. https://doi.org/10.3390/ijerph19053105