
The Impact of Multidimensional Health Levels on Rural Poverty: Evidence from Rural China

Abstract
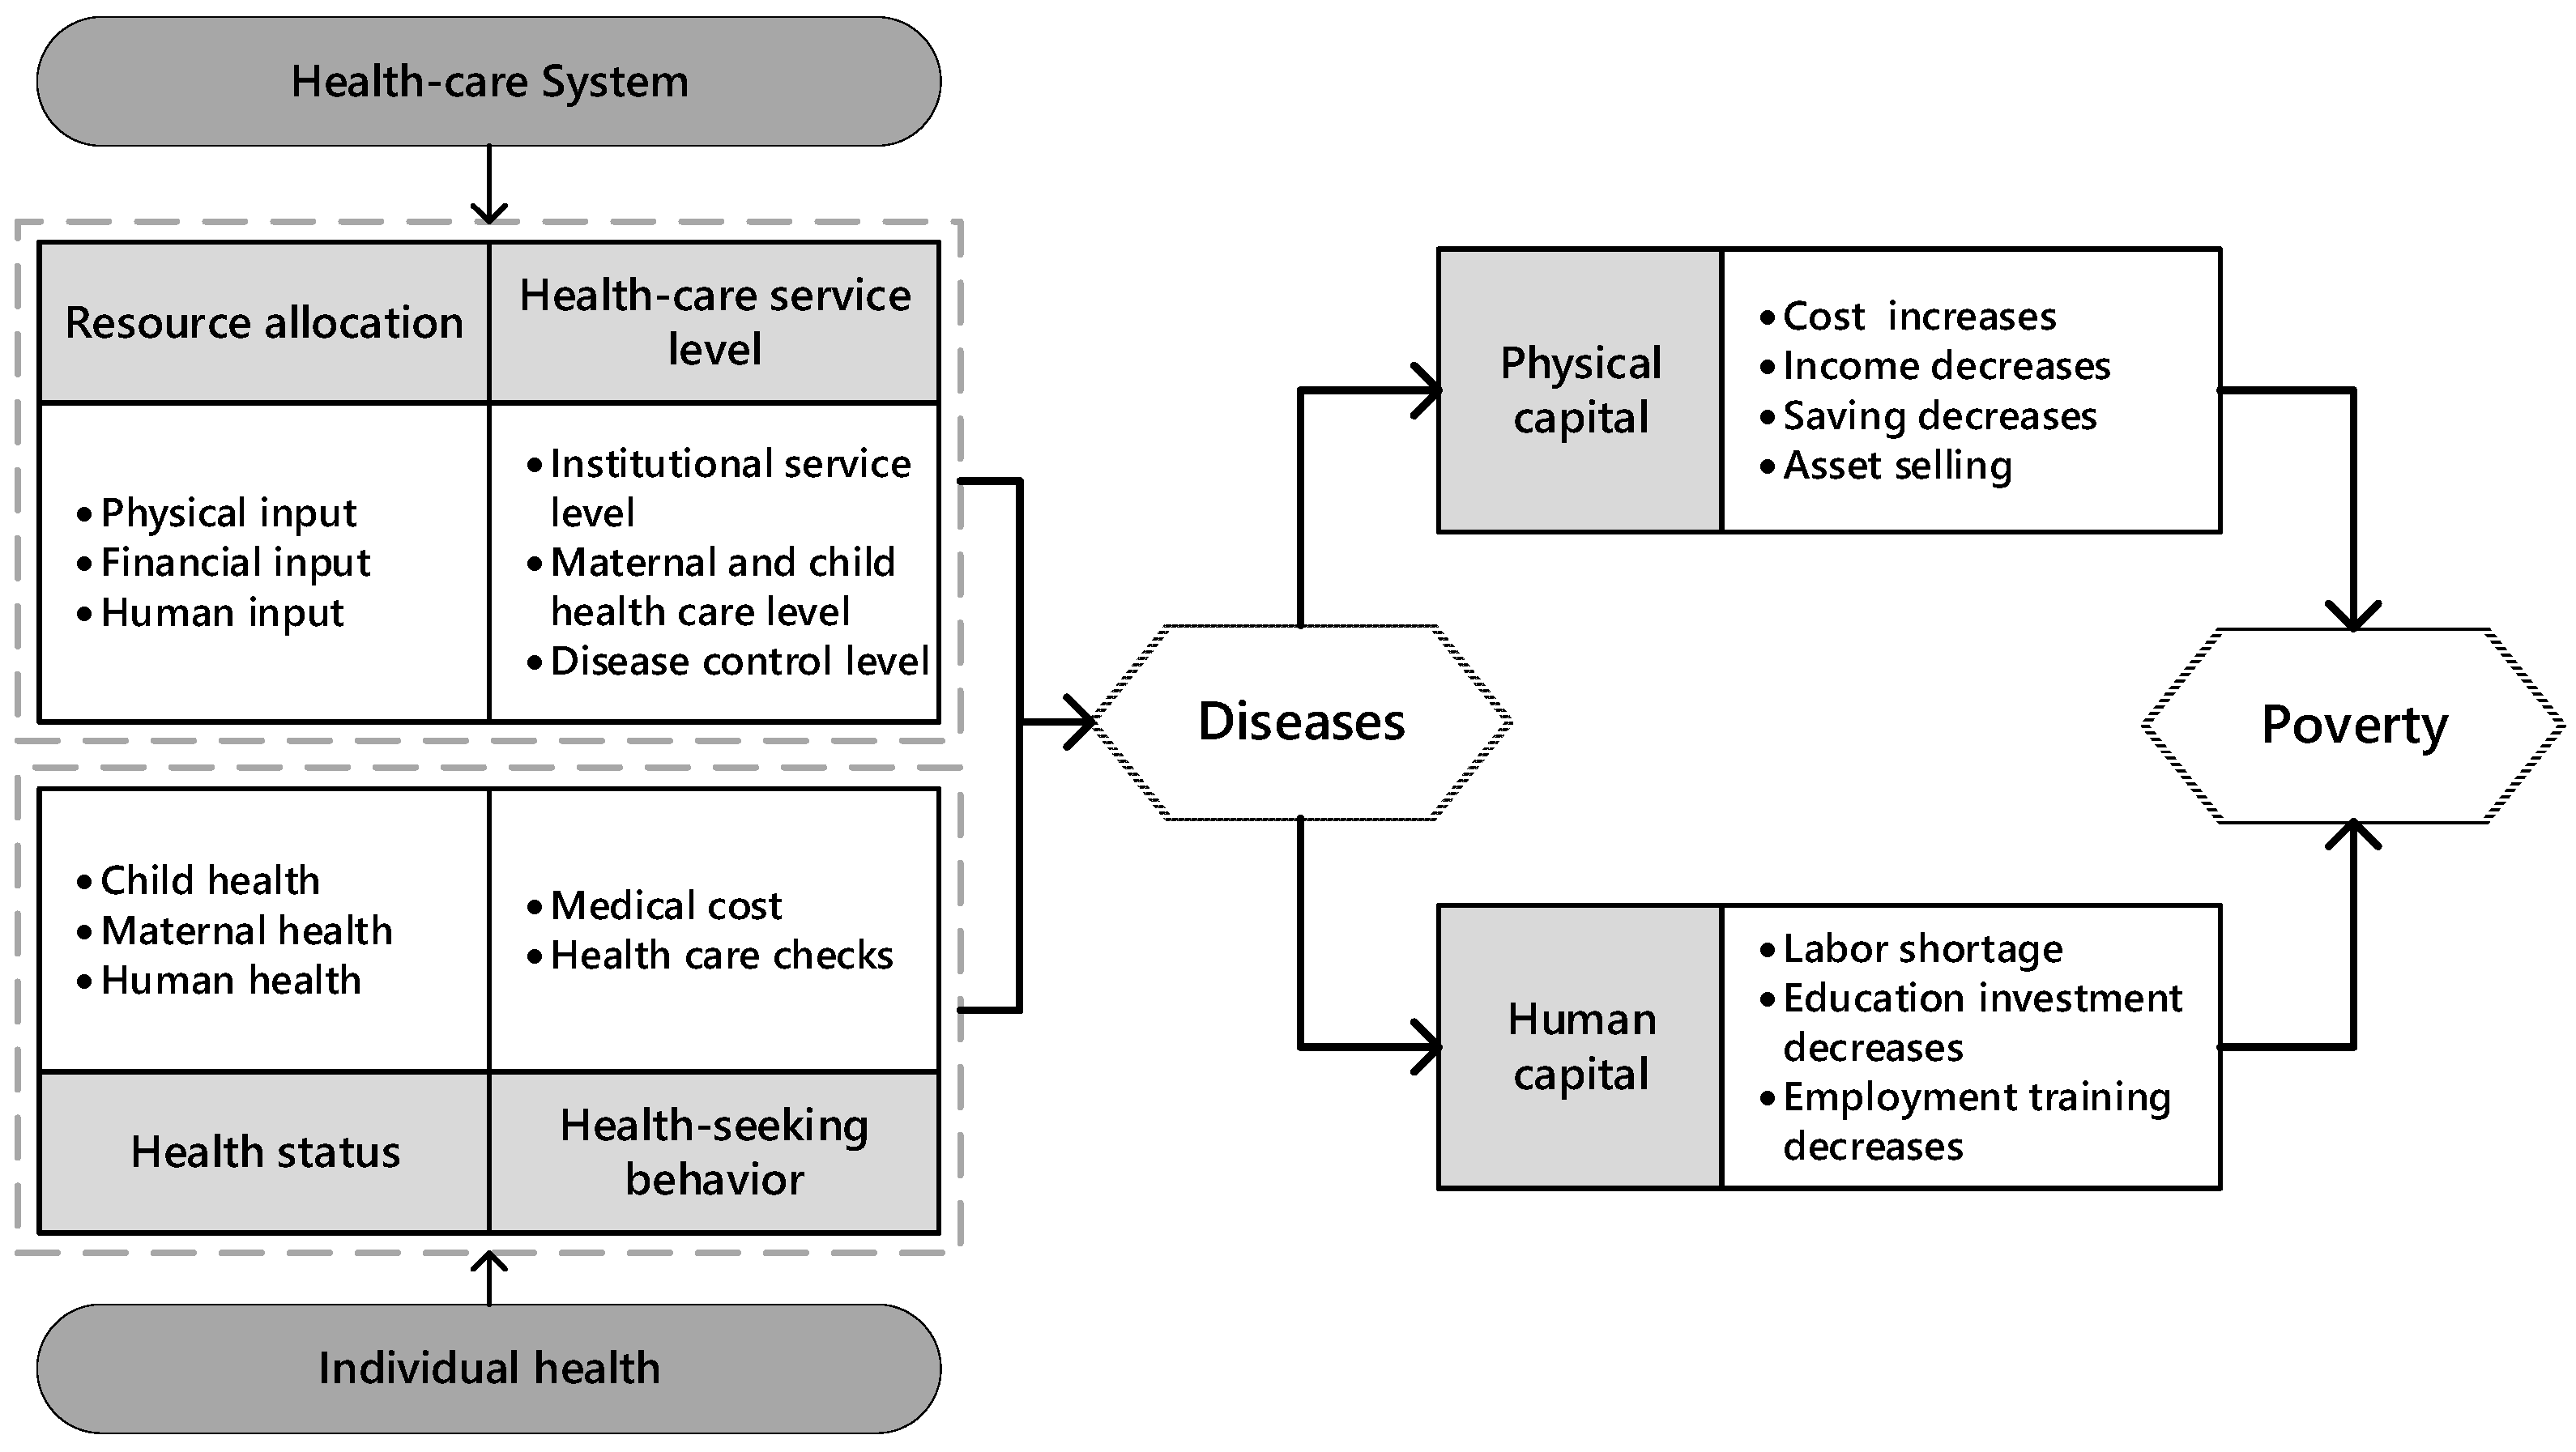
:1. Introduction
2. Materials and Methods
2.1. Variable Selection and Description
2.2. Study Area and Data Resource
2.3. Methods
2.3.1. Processing Data
- Calculation of distance of medical institutions
- 2.
- Standardization of data
- 3.
- Measurements of multidimensional health level
2.3.2. Construction of Statistical Models
3. Results
3.1. Spatial Econometric Model Testing
3.2. Spatial Econometric Regression Results
- The direct effect of health system input (X1) is significantly negative at the 10% level, suggesting that every 1% increase in health system input will directly result in a 0.0414% increase in the local area’s poverty. The direct effects differed from the estimated coefficient of −0.0295 due to the generation of feedback effects. As a result of these feedback effects, the impacts on other locations come back to the areas from which the impacts originated. Additionally, the indirect effect is significantly negative: a 1% increase in health system input in a given area will lead to a 0.171% decrease in poverty in nearby areas. The total effect is also significantly positive at the 1% level. These results indicate that health system input will positively affect rural poverty alleviation in this province and the neighboring provinces.
- At the 1% level, the direct effect of the service capacity of medical resources (X2) is positive, which means that a 1% increase in health system services capacity (X2) in a given area will lead to a 0.105% increase in poverty. This shows that the increased capacity of health-care resources does not relieve rural poverty, but rather has a negative effect. The explanation of this interesting finding may be rooted in the inequality in health system services.
- The direct effect of the individual health status (X3) was negative at the 10% level, suggesting the measurement of health in the province could decrease rural poverty by 0.0579%, but there was no spillover effect on neighboring provinces. This can be explained by the fact that the residents’ improved health status represents the effective improvement of the individual health level, which can lessen the frequency of illness and prolong the working hours of rural residents, thus effectively reducing expenditures on health services, increasing income, and contributing to the improvement of rural poverty.
- At the 5% level, the direct effect of individual health-seeking behavior (X4) was negative, which manifests that every 1% increase in the index of health-seeking behavior of residents in this province will reduce rural poverty by 0.0151%. This can be interpreted as an increase in health-seeking behavior of residents that represents an enhancement in the attention they put on health, which may manifest itself in the form of health check-ups and the adoption of healthy lifestyle habits. This may allow them to effectively prevent disease and reduce the likelihood of illness, which in turn reduces the depreciation of physical and human capital and ultimately alleviates poverty. Similarly, individual health-seeking behavior had no spillover effect on surrounding provinces.
4. Discussion
4.1. Reflections on Theoretical Framework and Policy
4.2. Research Contributions and Limitations
5. Conclusions
Author Contributions
Funding
Institutional Review Board Statement
Informed Consent Statement
Data Availability Statement
Conflicts of Interest
References
- World Bank. Poverty and Shared Prosperity 2020: Reversals of Fortune. 2020. Available online: https://www.worldbank.org/en/publication/poverty-and-shared-prosperity (accessed on 30 September 2021).
- Zhou, Y.; Guo, Y.; Liu, Y. Health, income and poverty: Evidence from China’s rural household survey. Int. J. Equity Health 2020, 19, 36. [Google Scholar] [CrossRef] [PubMed] [Green Version]
- Chinese Government. Medical Services Vital in Poverty Alleviation. 2016. Available online: http://english.www.gov.cn/policies/policy_watch/2016/06/09/content_281475368122621.htm (accessed on 30 September 2021).
- Sachs, J.; Malaney, P. The economic and social burden of malaria. Nature 2002, 415, 680–685. [Google Scholar] [CrossRef] [PubMed]
- Alter, M.J.; Kruszon-Moran, D.; Nainan, O.V.; McQuillan, G.M.; Gao, F.; Moyer, L.A.; Kaslow, R.A.; Margolis, H.S. The prevalence of hepatitis C virus infection in the United States, 1988 through 1994. N. Engl. J. Med. 1999, 341, 556–562. [Google Scholar] [CrossRef] [PubMed] [Green Version]
- Liu, Y.; Rao, K.; Hsiao, W.C. Medical expenditure and rural impoverishment in China. J. Health Popul. Nutr. 2003, 21, 216–222. [Google Scholar] [PubMed]
- Marmot, M. Status syndrome: How your social standing directly affects your health. BMJ 2004, 329, 408. [Google Scholar]
- Bor, J.; Tanser, F.; Newell, M.-L.; Bärnighausen, T. In A Study Of A Population Cohort In South Africa, HIV Patients On Antiretrovirals Had Nearly Full Recovery Of Employment. Health Aff. 2012, 31, 1459–1469. [Google Scholar] [CrossRef] [Green Version]
- Towne, S.D., Jr.; Liu, X.; Li, R.; Smith, M.; Maddock, J.; Tan, A.; Hayek, S.; Zelber-Sagi, S.; Jiang, X.; Ruan, H.; et al. Social and Structural Determinants of Health Inequities: Socioeconomic, Transportation-Related, and Provincial-Level Indicators of Cost-Related Forgone Hospital Care in China. Int. J. Environ. Res. Public Health 2021, 18, 6113. [Google Scholar] [CrossRef]
- Yuan, Q.; Wu, Y.; Li, F.; Yang, M.; Chen, D.; Zou, K. Economic status and catastrophic health expenditures in China in the last decade of health reform: A systematic review and meta-analysis. BMC Health Serv. Res. 2021, 21, 600. [Google Scholar] [CrossRef]
- Wang, H.; Zhang, L.; Hsiao, W. Ill health and its potential influence on household consumptions in rural China. Health Policy 2006, 78, 167–177. [Google Scholar] [CrossRef]
- Case, A.; Fertig, A.; Paxson, C. The lasting impact of childhood health and circumstance. J. Health Econ. 2005, 24, 365–389. [Google Scholar] [CrossRef] [Green Version]
- Johnson, S.B.; Riis, J.L.; Noble, K.G. State of the Art Review: Poverty and the Developing Brain. Pediatrics 2016, 137, e20153075. [Google Scholar] [CrossRef] [PubMed] [Green Version]
- Miguel, E.; Kremer, M. Worms: Identifying impacts on education and health in the presence of treatment externalities. Econometrica 2004, 72, 159–217. [Google Scholar] [CrossRef]
- Bleakley, H. Disease and development: Evidence from hookworm eradication in the American South. Q. J. Econ. 2007, 122, 73–117. [Google Scholar] [CrossRef] [PubMed] [Green Version]
- Smith, J.P. The impact of childhood health on adult labor market outcomes. Rev. Econ. Stat. 2009, 91, 478–489. [Google Scholar] [CrossRef] [Green Version]
- Grantham-McGregor, S.; Cheung, Y.B.; Cueto, S.; Glewwe, P.; Richter, L.; Strupp, B.; International Child Development Steering Group. Developmental potential in the first 5 years for children in developing countries. Lancet 2007, 369, 60–70. [Google Scholar] [CrossRef] [Green Version]
- Zhang, Z.; Ma, C.; Wang, A. A longitudinal study of multidimensional poverty in rural China from 2010 to 2018. Econ. Lett. 2021, 204, 109912. [Google Scholar] [CrossRef]
- World Health Organization. Constitution of the World Health Organization. 1948. Available online: https://www.who.int/governance/eb/who_constitution_en.pdf (accessed on 30 September 2021).
- Haushofer, J.; Fehr, E. On the psychology of poverty. Science 2014, 344, 862–867. [Google Scholar] [CrossRef]
- Cockrell, H. Poor Economics. A Radical Rethinking of the Way to Fight Global Poverty. J. Philos. Econ. 2011, 5, 165. [Google Scholar]
- Jia, H. Self-enforcement Effect of the“Health-Related Poverty Trap” and the Endogenous Motive Force for Poverty Alleviation: An Empirical Analysis Based on the China Family Panel Survey. Comp. Econ. Soc. Syst. 2020, 4, 11. (In Chinese) [Google Scholar]
- Peterson, L.E.; Litaker, D.G. County-level poverty is equally associated with unmet health care needs in rural and urban settings. J. Rural Health 2010, 26, 373–382. [Google Scholar] [CrossRef]
- Atun, R.; de Andrade, L.O.M.; Almeida, G.; Cotlear, D.; Dmytraczenko, T.; Frenz, P.; Garcia, P.; Gómez-Dantés, O.; Knaul, F.M.; Muntaner, C.; et al. Health-system reform and universal health coverage in Latin America. Lancet 2015, 385, 1230–1247. [Google Scholar] [CrossRef]
- Anand, S.; Barnighausen, T. Human resources and health outcomes: Cross-country econometric study. Lancet 2004, 364, 1603–1609. [Google Scholar] [CrossRef]
- Hafner, T.; Shiffman, J. The emergence of global attention to health systems strengthening. Health Policy Plan. 2013, 28, 41–50. [Google Scholar] [CrossRef] [PubMed]
- Liu, W.; Liu, Y.; Twum, P.; Li, S. National equity of health resource allocation in China: Data from 2009 to 2013. Int. J. Equity Health 2016, 15, 68. [Google Scholar] [CrossRef] [PubMed] [Green Version]
- Saito, E.; Gilmour, S.; Yoneoka, D.; Gautam, G.S.; Rahman, M.; Shrestha, P.K.; Shibuya, K. Inequality and inequity in healthcare utilization in urban Nepal: A cross-sectional observational study. Health Policy Plan. 2016, 31, 817–824. [Google Scholar] [CrossRef] [Green Version]
- Zhang, T.; Xu, Y.; Ren, J.; Sun, L.; Liu, C. Inequality in the distribution of health resources and health services in China: Hospitals versus primary care institutions. Int. J. Equity Health 2017, 16, 42. [Google Scholar] [CrossRef] [Green Version]
- Chen, Y.; Wang, J.; Zhu, J.; Sherman, H.D.; Chou, S.-Y. How the Great Recession affects performance: A case of Pennsylvania hospitals using DEA. Ann. Oper. Res. 2017, 278, 77–99. [Google Scholar] [CrossRef]
- Ding, J.; Hu, X.; Zhang, X.; Shang, L.; Yu, M.; Chen, H. Equity and efficiency of medical service systems at the provincial level of China’s mainland: A comparative study from 2009 to 2014. BMC Public Health 2018, 18, 214. [Google Scholar] [CrossRef]
- Li, Z.; Zhang, W.; Kong, A.; Ding, Z.; Wei, H.; Guo, Y. Configuration Analysis of Influencing Factors of Technical Efficiency Based on DEA and fsQCA: Evidence from China’s Medical and Health Institutions. Risk Manag. Healthc. Policy 2021, 14, 49–65. [Google Scholar] [CrossRef] [PubMed]
- Fang, P.; Dong, S.; Xiao, J.; Liu, C.; Feng, X.; Wang, Y. Regional inequality in health and its determinants: Evidence from China. Health Policy 2010, 94, 14–25. [Google Scholar] [CrossRef] [PubMed]
- Song, X.; Wei, Y.; Deng, W.; Zhang, S.; Zhou, P.; Liu, Y.; Wan, J. Spatio-Temporal Distribution, Spillover Effects and Influences of China’s Two Levels of Public Healthcare Resources. Int. J. Environ. Res. Public Health 2019, 16, 582. [Google Scholar] [CrossRef] [Green Version]
- Liu, Y.; Rao, K.; Wu, J.; Gakidou, E. China’s health system performance. Lancet 2008, 372, 1914–1923. [Google Scholar] [CrossRef]
- Zou, Q.; He, X.; Li, Z.; Xu, W.; Zhang, L. The effects of poverty reduction policy on health services utilization among the rural poor: A quasi-experimental study in central and western rural China. Int. J. Equity Health 2019, 18, 186. [Google Scholar] [CrossRef] [PubMed]
- Hall, M.J.; Owings, M. Rural and urban hospitals’ role in providing inpatient care, 2010. NCHS Data Brief 2014, 147, 1–8. [Google Scholar]
- Wang, W.; Zhang, Y.; Lin, B.; Mei, Y.; Ping, Z.; Zhang, Z. The Urban-Rural Disparity in the Status and Risk Factors of Health Literacy: A Cross-Sectional Survey in Central China. Int. J. Environ. Res. Public Health 2020, 17, 3848. [Google Scholar] [CrossRef] [PubMed]
- Engel, E. Die Produktions- und Consumtionsverhältnisse des Königreichs Sachsen. Repr. Bull. Inst. Int. Stat. 1857, 9, 1–54. [Google Scholar]
- Orshansky, M. Counting the poor: Another look at the poverty profile. 1965. Soc. Secur. Bull. 1965, 51, 25–51. [Google Scholar]
- Dong, F.; Wang, Y.; Zhang, X. Can Environmental Quality Improvement and Emission Reduction Targets Be Realized Simultaneously? Evidence from China and A Geographically and Temporally Weighted Regression Model. Int. J. Environ. Res. Public Health 2018, 15, 2343. [Google Scholar] [CrossRef] [Green Version]
- Tobler, W.R. A Computer Movie Simulating Urban Growth in the Detroit Region. Econ. Geogr. 1970, 46, 234–240. [Google Scholar] [CrossRef]
- Anselin, L. Lagrange Multiplier Test Diagnostics for Spatial Dependence and Spatial Heterogeneity. Geogr. Anal. 1988, 20, 1–17. [Google Scholar] [CrossRef]
- Elhorst, J.P. Spatial Econometrics; Springer: Heidelberg, Germany, 2014. [Google Scholar]
- LeSage, J.; Pace, R.K. Introduction to Spatial Econometrics; Imprint: Chapman Hall/CRC; Routledge: London, UK, 2009. [Google Scholar]
- Chen, J.; Wang, Y.; Wen, J.; Fang, F.; Song, M. The influences of aging population and economic growth on Chinese rural poverty. J. Rural. Stud. 2016, 47, 665–676. [Google Scholar] [CrossRef]
- Eryong, X.; Xiuping, Z. Education and anti-poverty: Policy theory and strategy of poverty alleviation through education in China. Educ. Philos. Theory 2018, 50, 1101–1112. [Google Scholar] [CrossRef]
- Li, J.; Shi, L.; Liang, H.; Ding, G.; Xu, L. Urban-rural disparities in health care utilization among Chinese adults from 1993 to 2011. BMC Health Serv. Res. 2018, 18, 102. [Google Scholar] [CrossRef] [Green Version]
- Zhai, S.; Yuan, S.; Dong, Q. The impact of health insurance on poverty among rural older adults: An evidence from nine counties of western China. Int. J. Equity Health 2021, 20, 47. [Google Scholar] [CrossRef]
- Peters, D.H.; Garg, A.; Bloom, G.; Walker, D.; Brieger, W.; Rahman, M.H. Poverty and access to health care in developing countries. Ann. N. Y. Acad. Sci. 2008, 1136, 161–171. [Google Scholar] [CrossRef]
- Tang, S.; Yao, L.; Ye, C.; Li, Z.; Yuan, J.; Tang, K.; Qian, D. Can health service equity alleviate the health expenditure poverty of Chinese patients? Evidence from the CFPS and China health statistics yearbook. BMC Health Serv. Res. 2021, 21, 718. [Google Scholar] [CrossRef]
- Wu, Y.; Wang, L.; Cai, Z.; Bao, L.; Ai, P.; Ai, Z. Prevalence and Risk Factors of Low Health Literacy: A Community-Based Study in Shanghai, China. Int. J. Environ. Res. Public Health 2017, 14, 628. [Google Scholar] [CrossRef]
- Gibney, S.; Bruton, L.; Ryan, C.; Doyle, G.; Rowlands, G. Increasing Health Literacy May Reduce Health Inequalities: Evidence from a National Population Survey in Ireland. Int. J. Environ. Res. Public Health 2020, 17, 5891. [Google Scholar] [CrossRef] [PubMed]
- Baum, F.; Fisher, M. Why behavioural health promotion endures despite its failure to reduce health inequities. Sociol. Health Illn. 2014, 36, 213–225. [Google Scholar] [CrossRef] [PubMed]
- Cosby, A.G.; McDoom-Echebiri, M.M.; James, W.; Khandekar, H.; Brown, W.; Hanna, H.L. Growth and Persistence of Place-Based Mortality in the United States: The Rural Mortality Penalty. Am. J. Public Health 2019, 109, 155–162. [Google Scholar] [CrossRef] [PubMed]
- Fritzell, J.; Kangas, O.; Hertzman, J.B.; Blomgren, J.; Hiilamo, H. Cross-temporal and cross-national poverty and mortality rates among developed countries. J. Environ. Public Health 2013, 2013, 915490. [Google Scholar] [CrossRef] [PubMed]
- Douthit, N.; Kiv, S.; Dwolatzky, T.; Biswas, S. Exposing some important barriers to health care access in the rural USA. Public Health 2015, 129, 611–620. [Google Scholar] [CrossRef] [PubMed]
- Li, X.; Lu, J.; Hu, S.; Cheng, K.K.; De Maeseneer, J.; Meng, Q.; Mossialos, E.; Xu, D.R.; Yip, W.; Zhang, H.; et al. The primary health-care system in China. Lancet 2017, 390, 2584–2594. [Google Scholar] [CrossRef]
- Qian, D.; Pong, R.W.; Yin, A.; Nagarajan, K.V.; Meng, Q. Determinants of health care demand in poor, rural China: The case of Gansu Province. Health Policy Plan. 2009, 24, 324–334. [Google Scholar] [CrossRef] [Green Version]
- Ta, Y.; Zhu, Y.; Fu, H. Trends in access to health services, financial protection and satisfaction between 2010 and 2016: Has China achieved the goals of its health system reform? Soc. Sci. Med. 2020, 245, 112715. [Google Scholar] [CrossRef] [PubMed]
- Zhou, Z.; Zhao, Y.; Shen, C.; Lai, S.; Nawaz, R.; Gao, J. Evaluating the effect of hierarchical medical system on health seeking behavior: A difference-in-differences analysis in China. Soc. Sci. Med. 2021, 268, 113372. [Google Scholar] [CrossRef] [PubMed]
- Lei, X.; Lin, W. The New Cooperative Medical Scheme in rural China: Does more coverage mean more service and better health? Health Econ. 2009, 18 (Suppl. S2), S25–S46. [Google Scholar] [CrossRef] [PubMed]
- Sagli, G.; Zhang, J.; Ingstad, B.; Fjeld, H.E. Poverty and disabled households in the People’s Republic of China: Experiences with a new rural health insurance scheme. Disabil. Soc. 2013, 28, 218–231. [Google Scholar] [CrossRef]
- Ma, J.; Xu, J.; Zhang, Z.; Wang, J. New cooperative medical scheme decreased financial burden but expanded the gap of income-related inequity: Evidence from three provinces in rural China. Int. J. Equity Health 2016, 15, 72. [Google Scholar] [CrossRef] [Green Version]
- Yip, W.; Hsiao, W.C. Non-evidence-based policy: How effective is China’s new cooperative medical scheme in reducing medical impoverishment? Soc. Sci. Med. 2009, 68, 201–209. [Google Scholar] [CrossRef]
- National Bureau of Statistics of PRC. National Data. Available online: https://data.stats.gov.cn/easyquery.htm?cn=C01 (accessed on 16 March 2022).

| Target Level Indicators | Primary Indicators | Secondary Indicators | Indicator Properties | Weight |
|---|---|---|---|---|
| Health system input (X1) | Manpower input | No. of health technicians per 1000 population | + | 0.1 |
| No. of professionals per 1000 population | + | 0.09 | ||
| No. of registered nurses per 1000 population | + | 0.13 | ||
| Physical input | Accessibility distance of medical institutions (km) | - | 0.24 | |
| Fixed assets per bed (10 thousand yuan) | + | 0.09 | ||
| No. of beds in medical and health institutions per 1000 population | + | 0.2 | ||
| Number of tertiary hospitals per million population (piece/million people) | + | 0.1 | ||
| Financial input | Total health expenditure per capita (yuan) | + | 0.02 | |
| Percentage of medical aid expenditure (‰) | + | 0.04 | ||
| Health system service capacity (X2) | Physician service capacity | Daily inpatient bed days by physicians (days) | + | 0.05 |
| No. of consultations per day by physicians | + | 0.05 | ||
| Hospital service capacity | Average days of hospitalization (days) | - | 0.11 | |
| Hospital bed utilization rate (%) | - | 0.11 | ||
| No. of visits to medical institutions per capita | + | 0.11 | ||
| Maternal and child health-care level | Rate of postnatal visits (%) | + | 0.09 | |
| Neonatal visitation rate (%) | + | 0.08 | ||
| Disease prevention and control level | Incidence rate of class A and B 1 legally reported infectious diseases (1/100,000) | + | 0.19 | |
| Mortality rate of Class A and B legally reported infectious diseases (1/100,000) | + | 0.22 | ||
| Individual health status (X3) | Health level of women | Maternal mortality rate (1/100,000) | - | 0.42 |
| Health level of infants and children | Proportion of children under 5 years old with moderate to severe malnutrition (%) | - | 0.18 | |
| Infant mortality rate (‰) | - | 0.2 | ||
| Health level of residents | Mortality rate (‰) | - | 0.2 | |
| Individual health-seeking behavior (X4) | Level of attention | No. of people having health check-ups in medical and health institutions | + | 0.2 |
| Willingness to pay | Percentage of rural residents’ health-care expenditure (%) | + | 0.8 |
| Variable | Unit | Symbol | Measurement | Interpretation |
|---|---|---|---|---|
| Urbanization rate | % | Urb | Urb = Urban resident population/Total resident population | An indicator that measures the structure of urban and rural. |
| Proportion of non-agricultural industries | % | Noagr | Noagr = 1 − (Value added by the primary sector/GDP) | The changes in the proportional relationships among industries. |
| Proportion of transfer income | % | Transfer | Transfer = Transfer income of rural residents/Disposable income of rural residents | An indicator that measures the impact of policies on residents’ income. |
| Degree of openness | % | Open | Open = Total exports and imports of goods/GDP | Advanced foreign technology and foreign trade boost economic development. |
| Average years of school attainment per person | Year | Logyedu | An indicator that measures educational level. | |
| Population density | Persons/sq. m | Logpid | Logpid = Resident population/Total area | Population density affects the cost of access to resources and employment for residents. |
| Variable | Obs. | Mean | Std. Dev. | Min | Max |
|---|---|---|---|---|---|
| Pov | 186 | 0.348 | 0.062 | 0.253 | 0.536 |
| Urb | 186 | 0.562 | 0.131 | 0.237 | 0.896 |
| Noagr | 186 | 0.901 | 0.050 | 0.76 | 0.996 |
| Transfer | 186 | 0.155 | 0.065 | 0.053 | 0.292 |
| Open | 186 | 0.249 | 0.271 | 0.014 | 1.254 |
| Logyedu | 186 | 2.425 | 0.101 | 2.07 | 2.683 |
| Logpid | 186 | 5.316 | 1.491 | 0.941 | 8.256 |
| Year | Moran’s I | Z Value | p Value |
|---|---|---|---|
| 2012 | 0.465 | 4.613 | 0.000 |
| 2013 | 0.321 | 3.346 | 0.000 |
| 2014 | 0.325 | 3.503 | 0.000 |
| 2015 | 0.312 | 3.363 | 0.000 |
| 2016 | 0.266 | 2.955 | 0.002 |
| 2017 | 0.295 | 3.171 | 0.001 |
| Determinants | Statistics | Determinants | Statistics |
|---|---|---|---|
| LM test spatial lag | 18.037 *** | LR test spatial lag | 55.39 *** |
| Robust LM test spatial lag | 1.021 | LR test spatial error | 80.64 *** |
| LM test spatial error | 32.726 *** | Hausman test | 113.83 *** |
| Robust LM test spatial error | 15.710 *** |
| Variable 1 | Main | Wx | Variable | Main | Wx |
|---|---|---|---|---|---|
| X1 | −0.0295 | −0.0911 ** 2 | Noagr | 0.399 *** | 0.156 |
| (0.0219) | (0.0366) | (0.147) | (0.318) | ||
| X2 | 0.100 *** | 0.00743 | Transfer | 0.108 *** | −0.236 *** |
| (0.0345) | (0.0644) | (0.0415) | (0.0568) | ||
| X3 | −0.0570 * | −0.00749 | Open | −0.0270 | −0.129 *** |
| (0.0310) | (0.0565) | (0.0303) | (0.0433) | ||
| X4 | −0.0152 ** | 0.00606 | Logyedu | −0.212 *** | −0.372 *** |
| (0.00592) | (0.0123) | (0.0667) | (0.126) | ||
| Urb | 0.0234 | 0.521 * | Logpid | 0.259 ** | −1.086 *** |
| (0.136) | (0.289) | (0.139) | (0.281) | ||
| 0.419 *** | |||||
| (0.0787) | |||||
| Log-likelihood | 558.1 | ||||
| Observations | 186 |
| Variable | Direct Effect | Indirect Effect | Total Effect |
|---|---|---|---|
| X1 | −0.0414 * | −0.171 *** | −0.212 *** |
| (0.0218) | (0.0570) | (0.0610) | |
| X2 | 0.105 *** | 0.0849 | 0.190 |
| (0.0346) | (0.112) | (0.125) | |
| X3 | −0.0579 * | −0.0548 | −0.113 |
| (0.0298) | (0.0872) | (0.0953) | |
| X4 | −0.0151 ** | −3.99 × 10⁻⁵ | −0.0151 |
| (0.00622) | (0.0205) | (0.0234) | |
| Urb | 0.0847 | 0.847 * | 0.931 * |
| (0.138) | (0.470) | (0.527) | |
| Noagr | 0.446 *** | 0.552 | 0.998 |
| (0.165) | (0.567) | (0.675) | |
| Transfer | 0.0857 ** | −0.298 *** | −0.212 *** |
| (0.0400) | (0.0687) | (0.0674) | |
| Open | −0.0449 | −0.231 *** | −0.276 *** |
| (0.0314) | (0.0798) | (0.0952) | |
| Logyedu | −0.259 *** | −0.742 *** | −1.000 *** |
| (0.0681) | (0.194) | (0.232) | |
| Logpid | 0.144 | −1.578 *** | −1.433 *** |
| (0.135) | (0.476) | (0.499) |
Publisher’s Note: MDPI stays neutral with regard to jurisdictional claims in published maps and institutional affiliations. |
© 2022 by the authors. Licensee MDPI, Basel, Switzerland. This article is an open access article distributed under the terms and conditions of the Creative Commons Attribution (CC BY) license (https://creativecommons.org/licenses/by/4.0/).
Share and Cite
Chen, X.; Zhou, T.; Wang, D. The Impact of Multidimensional Health Levels on Rural Poverty: Evidence from Rural China. Int. J. Environ. Res. Public Health 2022, 19, 4065. https://doi.org/10.3390/ijerph19074065
Chen X, Zhou T, Wang D. The Impact of Multidimensional Health Levels on Rural Poverty: Evidence from Rural China. International Journal of Environmental Research and Public Health. 2022; 19(7):4065. https://doi.org/10.3390/ijerph19074065
Chicago/Turabian StyleChen, Xueyan, Tao Zhou, and Di Wang. 2022. "The Impact of Multidimensional Health Levels on Rural Poverty: Evidence from Rural China" International Journal of Environmental Research and Public Health 19, no. 7: 4065. https://doi.org/10.3390/ijerph19074065