
Mediterranean Style Dietary Pattern with High Intensity Interval Training in Men with Prostate Cancer Treated with Androgen Deprivation Therapy: A Pilot Randomised Control Trial

 , ,
, , 
Abstract
:1. Introduction
2. Materials and Methods
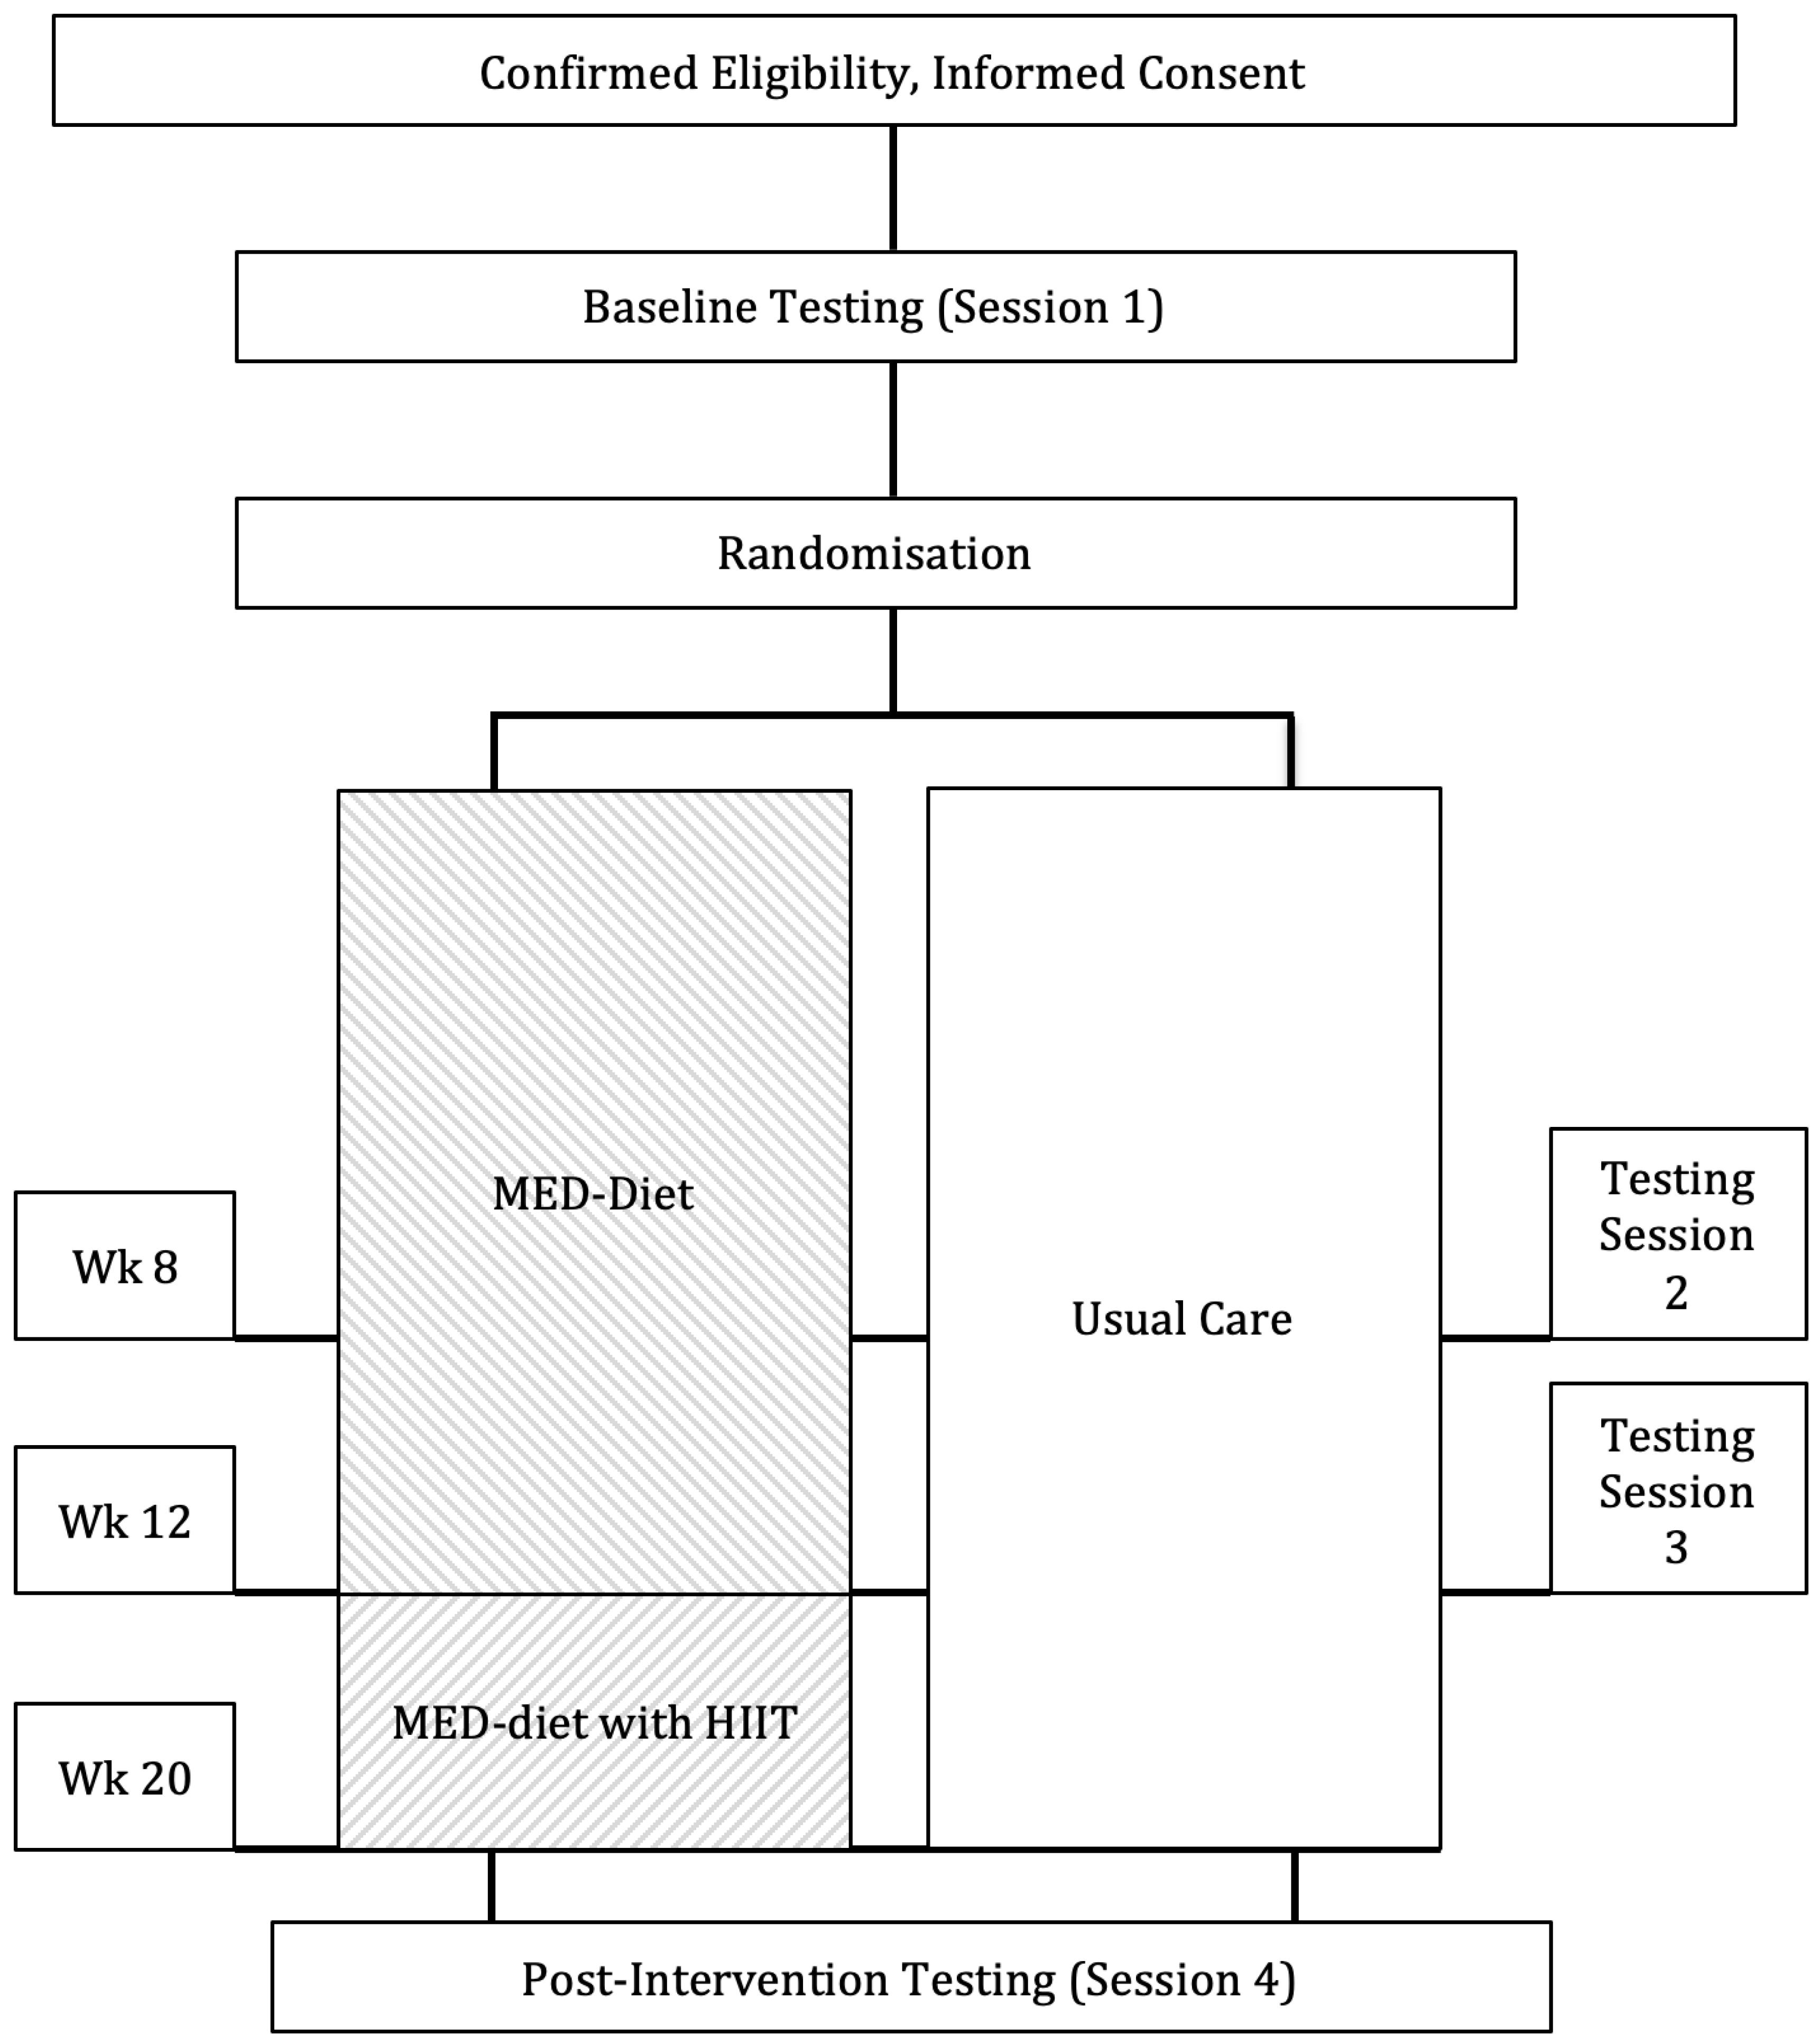
2.1. Study Design and Randomisation
2.2. Intervention Nutrition and Exercise Prescription
2.3. Usual Care (Control Group)
2.4. Outcomes
Cardiorespiratory Fitness
2.5. Physical Traits and Body Composition
2.6. Intervention Fidelity
- (a)
- All intervention and usual care adverse events were reported to the primary investigator as a measure of intervention safety. Adverse events were defined as an untoward injury or medical occurrence from the intervention (MED-diet) or outcome measures which interfered with the capacity of the participant to carry out their usual activities. Adverse events were also monitored at each nutrition consultation for common signs and symptoms of dietary change (e.g., gastrointestinal tolerance).
- (b)
- Intervention completion was measured by the number of participants completing baseline, 12- and 20-week testing sessions.
- (c)
- Attendance at the MED-diet consultations was measured by the number of sessions attended, divided by the number of sessions prescribed.
- (d)
- Adherence to the MED-diet was measured by the Mediterranean-diet adherence screener (MEDAS) [28]; a 14-question (yes/no) response to the frequency of food groups was included in the MED-diet. The total responses of ‘yes’ were tallied to provide an overall dietary adherence to the MED-diet. Question 8 (how much wine do you drink; ≥7 glasses = adherence) was omitted from the MEDAS due to the intervention promoting a reduction in alcohol intake. High adherence was classified as meeting a priori cut point of ≥75% of the 13-question MEDAS.
- (e)
- Adherence to exercise intensity was quantified by two measures. Mean HR was calculated using a combination of data points collected throughout the exercise intervals and recovery periods. Mean HR was calculated using all data points collected at 1-s epochs throughout the designated interval or recovery period. Time to reach 85% of HRpeak was measured at the start of each interval and recorded in minutes: seconds. Adherence was determined by reaching 85% HRpeak and quantified by the time spent exercising ≥85% HRpeak for each interval. Rating of perceived exertion (RPE) for each interval was also used as a measure of exercise intensity.
2.7. Cancer-Related Fatigue and Quality of Life
2.8. Change in Dietary Intake
2.9. Statistical Analysis
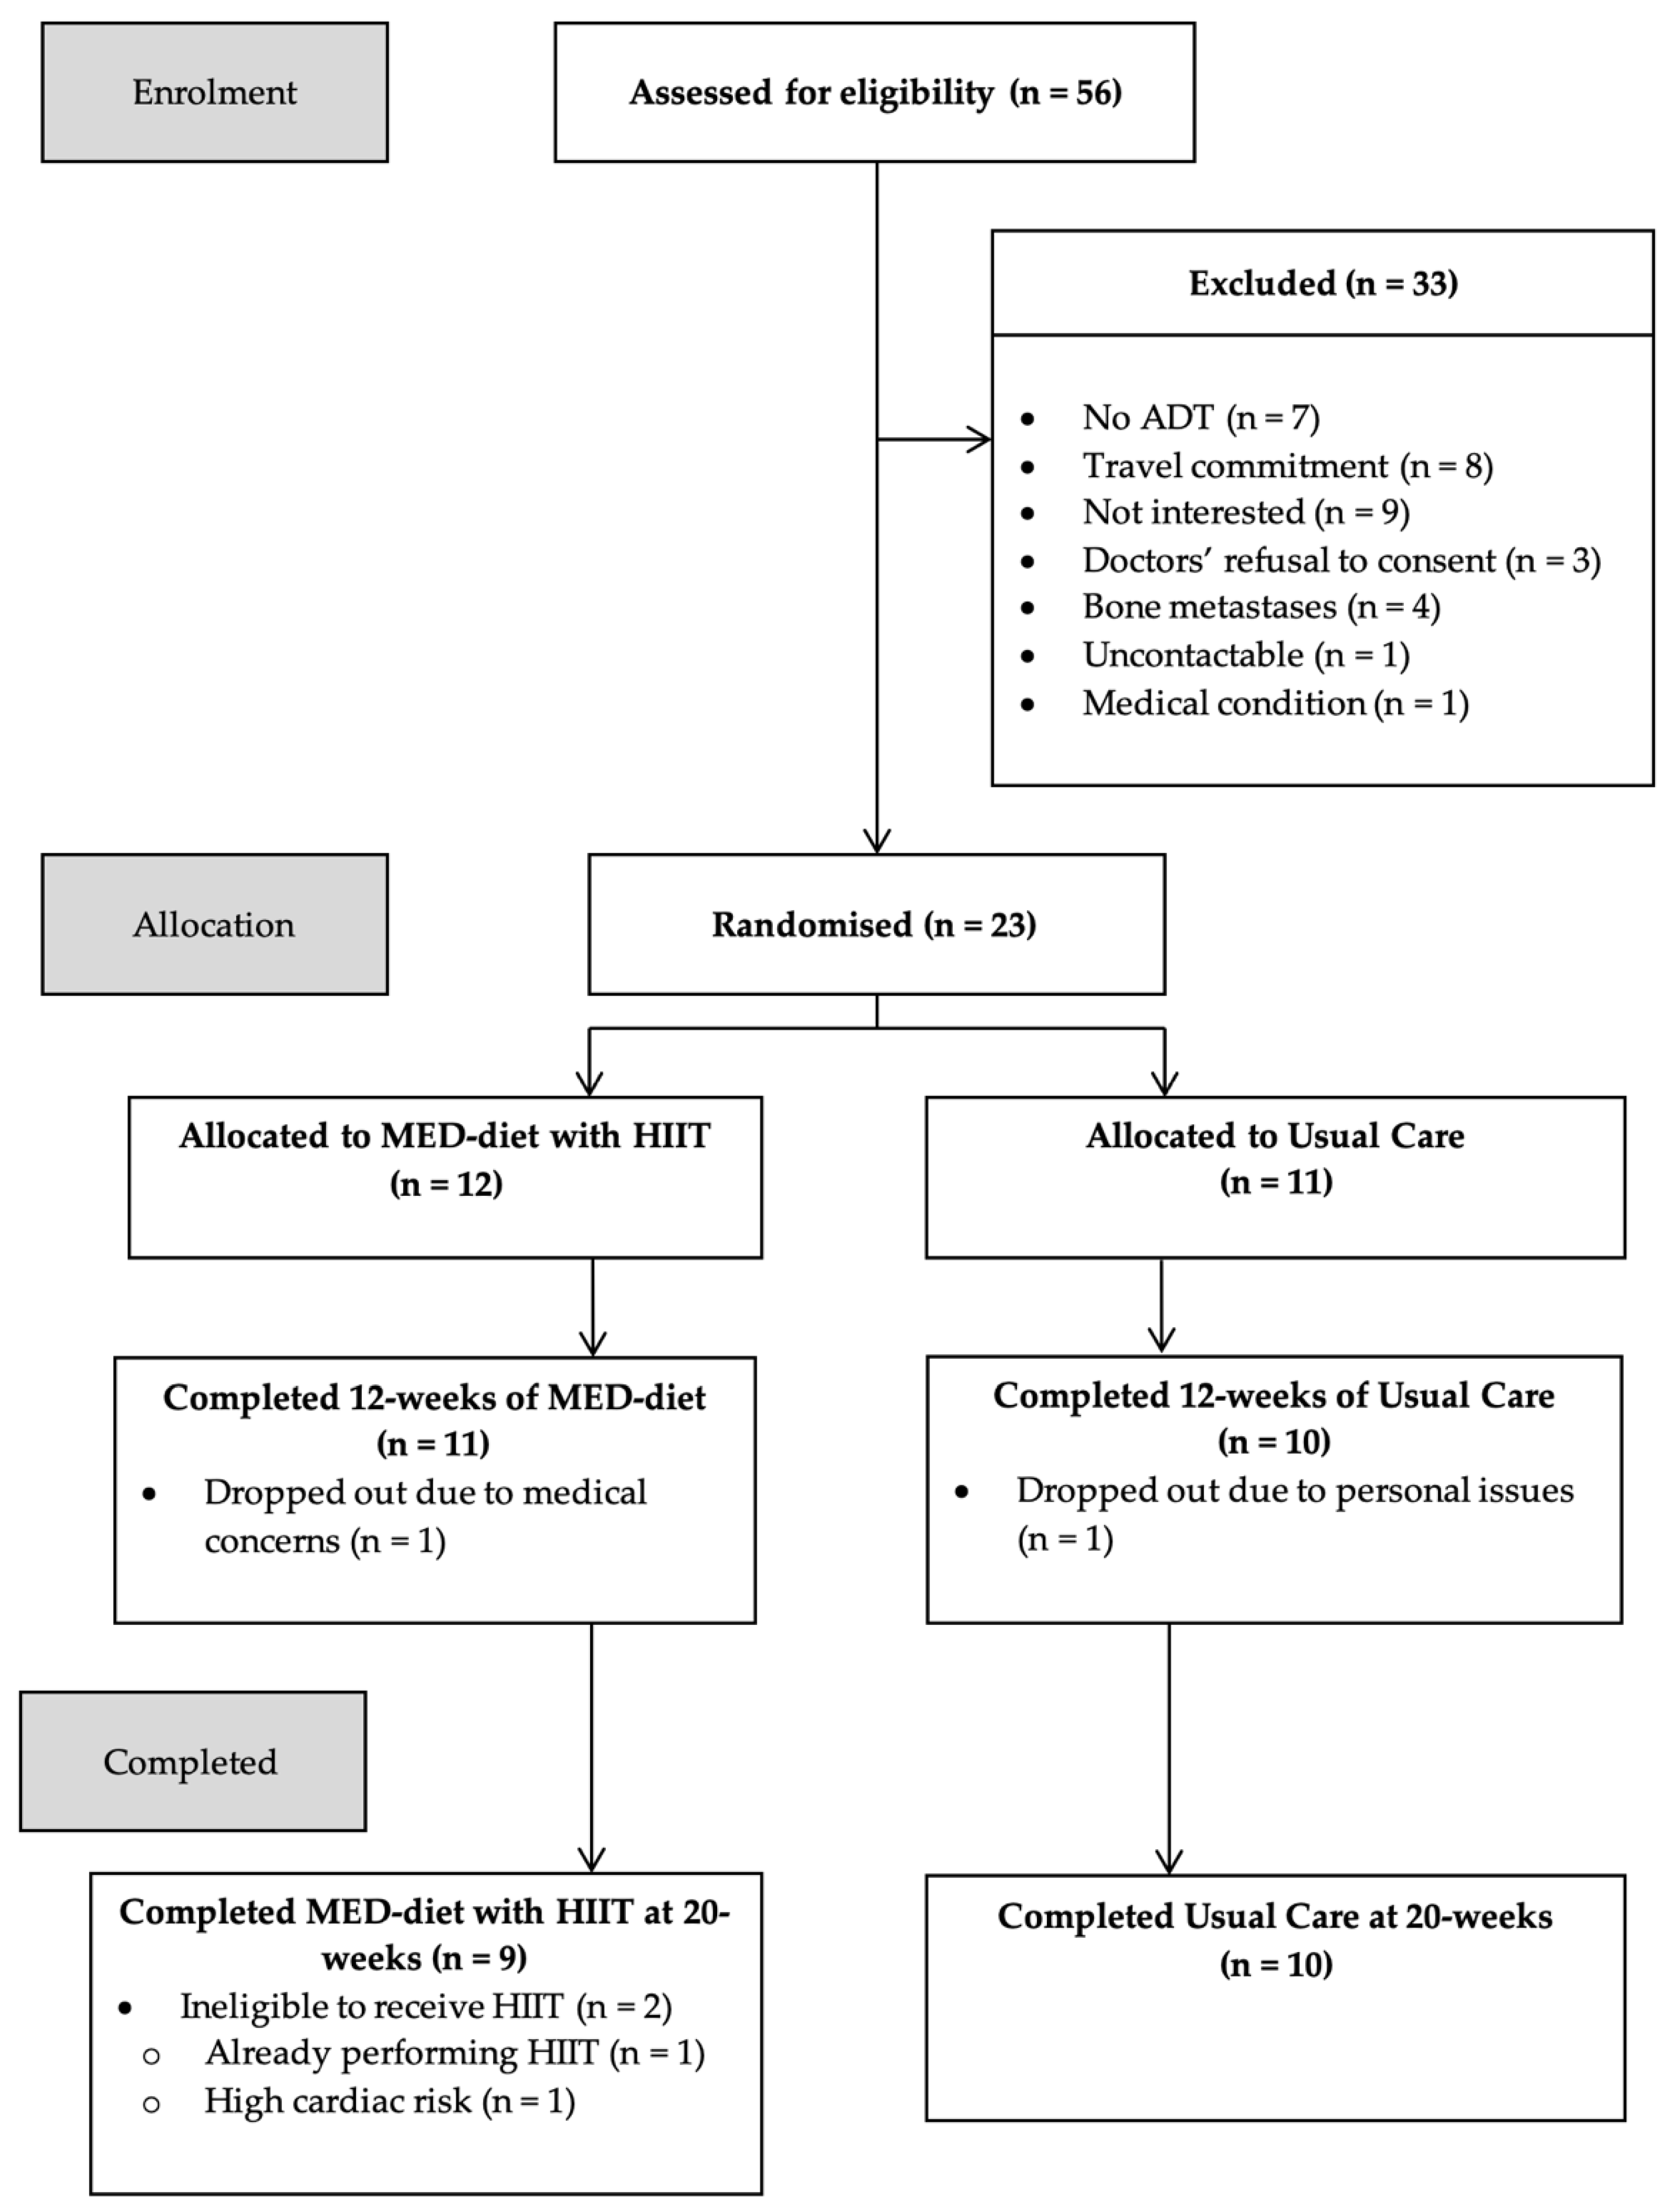
3. Results
3.1. Intervention Adherence
3.2. Cardiorespiratory Fitness
3.3. Body Composition
3.4. Quality of Life
4. Discussion
5. Conclusions
Author Contributions
Funding
Institutional Review Board Statement
Informed Consent Statement
Data Availability Statement
Acknowledgments
Conflicts of Interest
References
- Australian Institute of Health and Welfare. Cancer in Australia 2019; AIHW: Canberra, Australia, 2019.
- Lu-Yao, G.L.; Albertsen, P.C.; Moore, D.F.; Shih, W.; Lin, Y.; DiPaola, R.S.; Yao, S.-L. Fifteen-year survival outcomes following primary androgen-deprivation therapy for localized prostate cancer. JAMA Intern. Med. 2014, 174, 1460–1467. [Google Scholar] [CrossRef] [Green Version]
- Galvão, D.A.; Spry, N.A.; Taaffe, D.R.; Newton, R.U.; Stanley, J.; Shannon, T.; Rowling, C.; Prince, R. Changes in muscle, fat and bone mass after 36 weeks of maximal androgen blockade for prostate cancer. BJU Int. 2008, 102, 44–47. [Google Scholar] [CrossRef] [PubMed]
- van Londen, G.J.; Levy, M.E.; Perera, S.; Nelson, J.B.; Greenspan, S.L. Body composition changes during androgen deprivation therapy for prostate cancer: A 2-year prospective study. Crit. Rev. Oncol. Hematol. 2008, 68, 172–177. [Google Scholar] [CrossRef] [PubMed] [Green Version]
- Hu, J.-R.; Duncan, M.S.; Morgans, A.K.; Brown, J.D.; Meijers, W.C.; Freiberg, M.S.; Salem, J.-E.; Beckman, J.A.; Moslehi, J.J. Cardiovascular Effects of Androgen Deprivation Therapy in Prostate Cancer: Contemporary Meta-Analyses. Arterioscler. Thromb. Vasc. Biol. 2020, 40, e55–e64. [Google Scholar] [CrossRef]
- Hackshaw-McGeagh, L.E.; Perry, R.E.; Leach, V.A.; Qandil, S.; Jeffreys, M.; Martin, R.; Lane, J.A. A systematic review of dietary, nutritional, and physical activity interventions for the prevention of prostate cancer progression and mortality. Cancer Causes Control 2015, 26, 1521–1550. [Google Scholar] [CrossRef] [Green Version]
- Rock, C.L.; Doyle, C.; Demark-Wahnefried, W.; Meyerhardt, J.; Courneya, K.S.; Schwartz, A.L.; Bandera, E.V.; Hamilton, K.K.; Grant, B.; McCullough, M.; et al. Nutrition and physical activity guidelines for cancer survivors. CA Cancer J. Clin. 2012, 62, 242–274. [Google Scholar] [CrossRef] [PubMed] [Green Version]
- Barnes, K.A.; Ball, L.E.; Galvão, D.A.; Newton, R.U.; Chambers, S.K. Nutrition care guidelines for men with prostate cancer undergoing androgen deprivation therapy: Do we have enough evidence? Prostate Cancer Prostatic Dis. 2019, 22, 221–234. [Google Scholar] [CrossRef]
- Owen, P.J.; Daly, R.M.; Livingston, P.M.; Fraser, S.F. Lifestyle guidelines for managing adverse effects on bone health and body composition in men treated with androgen deprivation therapy for prostate cancer: An update. Prostate Cancer Prostatic Dis. 2017, 20, 137–145. [Google Scholar] [CrossRef] [Green Version]
- Wallen, M.P.; Hennessy, D.; Brown, S.; Evans, L.; Rawstorn, J.C.; Wong Shee, A.; Hall, A. High-intensity interval training improves cardiorespiratory fitness in cancer patients and survivors: A meta-analysis. Eur. J. Cancer Care 2020, 29, e13267. [Google Scholar] [CrossRef]
- Mugele, H.; Freitag, N.; Wilhelmi, J.; Yang, Y.; Cheng, S.; Bloch, W.; Schumann, M. High-intensity interval training in the therapy and aftercare of cancer patients: A systematic review with meta-analysis. J. Cancer Surviv. 2019, 13, 205–223. [Google Scholar] [CrossRef]
- Devin, J.L.; Sax, A.T.; Hughes, G.I.; Jenkins, D.; Aitken, J.; Chambers, S.K.; Dunn, J.; Bolam, K.A.; Skinner, T. The influence of high-intensity compared with moderate-intensity exercise training on cardiorespiratory fitness and body composition in colorectal cancer survivors: A randomised controlled trial. J. Cancer Surviv. 2016, 10, 467–479. [Google Scholar] [CrossRef] [PubMed]
- MacInnis, M.J.; Gibala, M.J. Physiological adaptations to interval training and the role of exercise intensity. J. Physiol. 2017, 595, 2915–2930. [Google Scholar] [CrossRef] [PubMed] [Green Version]
- Sofi, F.; Macchi, C.; Abbate, R.; Gensini, G.F.; Casini, A. Mediterranean diet and health status: An updated meta-analysis and a proposal for a literature-based adherence score. Public Health Nutr. 2014, 17, 2769–2782. [Google Scholar] [CrossRef] [PubMed] [Green Version]
- Kenfield, S.A.; DuPre, N.; Richman, E.L.; Stampfer, M.J.; Chan, J.M.; Giovannucci, E.L. Mediterranean diet and prostate cancer risk and mortality in the Health Professionals Follow-up Study. Eur. Urol. 2014, 65, 887–894. [Google Scholar] [CrossRef] [Green Version]
- Itsiopoulos, C.; Hodge, A.; Kaimakamis, M. Can the Mediterranean diet prevent prostate cancer? Mol. Nutr. Food Res. 2009, 53, 227–239. [Google Scholar] [CrossRef] [PubMed]
- Bruno, E.; Krogh, V.; Gargano, G.; Grioni, S.; Bellegotti, M.; Venturelli, E.; Panico, S.; de Magistris, M.S.; Bonanni, B.; Zagallo, E.; et al. Adherence to Dietary Recommendations after One Year of Intervention in Breast Cancer Women: The DIANA-5 Trial. Nutrients 2021, 13, 2990. [Google Scholar] [CrossRef] [PubMed]
- Baguley, B.J.; Skinner, T.L.; Jenkins, D.G.; Wright, O.R.L. Mediterranean-style dietary pattern improves cancer-related fatigue and quality of life in men with prostate cancer treated with androgen deprivation therapy: A pilot randomised control trial. Clin. Nutr. 2021, 40, 245–254. [Google Scholar] [CrossRef]
- Skouroliakou, M.; Grosomanidis, D.; Massara, P.; Kostara, C.; Papandreou, P.; Ntountaniotis, D.; Xepapadakis, G. Serum antioxidant capacity, biochemical profile and body composition of breast cancer survivors in a randomized Mediterranean dietary intervention study. Eur. J. Nutr. 2018, 57, 2133–2145. [Google Scholar] [CrossRef]
- Martínez-González, M.A.; Gea, A.; Ruiz-Canela, M. The Mediterranean Diet and Cardiovascular Health. Circ. Res. 2019, 124, 779–798. [Google Scholar] [CrossRef]
- Eldridge, S.M.; Chan, C.L.; Campbell, M.J.; Bond, C.M.; Hopewell, S.; Thabane, L.; Lancaster, G.A. CONSORT 2010 statement: Extension to randomised pilot and feasibility trials. BMJ 2016, 355, i5239. [Google Scholar] [CrossRef] [Green Version]
- Baguley, B.J.; Skinner, T.L.; Leveritt, M.D.; Wright, O.R. Nutrition therapy with high intensity interval training to improve prostate cancer-related fatigue in men on androgen deprivation therapy: A study protocol. BMC Cancer 2017, 17, 1. [Google Scholar] [CrossRef] [PubMed] [Green Version]
- American College of Sports Medicine. ACSM’s new preparticipation health screening recommendations from ACSM’s guidelines for exercise testing and prescription, ninth edition. Practice Guideline. Curr. Sports Med. Rep. 2013, 12, 215–217. [Google Scholar] [CrossRef] [PubMed]
- Wasserman, K.; Hansen, J.; Sue, D.; Casaburi, R.; Whipp, B. Principles of Exercise Testing and Interpretation: Including Pathophysiology and Clinical Applications; Wolters Kluwer Health/Lippincott Williams & Wilkins: Amsterdam, The Netherlands, 2012. [Google Scholar]
- Borg, G.A. Psychophysical bases of perceived exertion. Med. Sci. Sports Exerc. 1982, 14, 377–381. [Google Scholar] [CrossRef] [PubMed]
- American Association of Cardiovascular Pulmonary Rehabilitation. Guidelines for Cardiac Rehabilitation and Secondary Prevention Programs; Human Kinetics: Champaign, IL, USA, 2004. [Google Scholar]
- Stewart, A.; Marfell-Jones, M.; Olds, T.; De Ridder, J.H. International Standards of Anthropometric Assessment; ISAK: Potchefstroom, South Africa, 2011. [Google Scholar]
- Martínez-González, M.A.; García-Arellano, A.; Toledo, E.; Salas-Salvadó, J.; Buil-Cosiales, P.; Corella, D.; Covas, M.I.; Schröder, H.; Arós, F.; Gómez-Gracia, E.; et al. A 14-item Mediterranean diet assessment tool and obesity indexes among high-risk subjects: The PREDIMED trial. PLoS ONE 2012, 7, e43134. [Google Scholar] [CrossRef] [Green Version]
- Yellen, S.B.; Cella, D.F.; Webster, K.; Blendowski, C.; Kaplan, E. Measuring fatigue and other anemia-related symptoms with the Functional Assessment of Cancer Therapy (FACT) measurement system. Research Support, Non-U.S. Gov’t. J. Pain Symptom Manag. 1997, 13, 63–74. [Google Scholar] [CrossRef]
- Ware, J.E., Jr.; Sherbourne, C.D. The MOS 36-item short-form health survey (SF-36). I. Conceptual framework and item selection. Research Support, Non-U.S. Gov’t Research Support, U.S. Gov’t, P.H.S. Med. Care 1992, 30, 473–483. [Google Scholar] [CrossRef]
- Martin, G.S. The Interviewer-Administered, Open-Ended Diet History Method for Assessing Usual Dietary Intakes in Clinical Research: Relative and Criterion Validation Studies; The University of Wollongong: Wollongong, Australia, 2004. [Google Scholar]
- Cella, D.; Eton, D.T.; Lai, J.-S.; Peterman, A.H.; Merkel, D.E. Combining Anchor and Distribution-Based Methods to Derive Minimal Clinically Important Differences on the Functional Assessment of Cancer Therapy (FACT) Anemia and Fatigue Scales. J. Pain Symptom Manag. 2002, 24, 547–561. [Google Scholar] [CrossRef]
- Godin, G.; Shephard, R.J. A simple method to assess exercise behavior in the community. Can. J. Appl. Sport Sci. 1985, 10, 141–146. [Google Scholar]
- Lakoski, S.G.; Willis, B.L.; Barlow, C.E.; Leonard, D.; Gao, A.; Radford, N.B.; Farrell, S.W.; Douglas, P.S.; Berry, J.D.; Defina, L.F.; et al. Midlife Cardiorespiratory Fitness, Incident Cancer, and Survival After Cancer in Men: The Cooper Center Longitudinal Study. JAMA Oncol. 2015, 1, 231–237. [Google Scholar] [CrossRef]
- Bourke, L.; Smith, D.; Steed, L.; Hooper, R.; Carter, A.; Catto, J.; Albertsen, P.C.; Tombal, B.; Payne, H.A.; Rosario, D.J. Exercise for Men with Prostate Cancer: A Systematic Review and Meta-analysis. Eur. Urol. 2016, 69, 693–703. [Google Scholar] [CrossRef] [Green Version]
- Kang, D.-W.; Fairey, A.S.; Boulé, N.G.; Field, C.J.; Wharton, S.A.; Courneya, K.S. Effects of Exercise on Cardiorespiratory Fitness and Biochemical Progression in Men With Localized Prostate Cancer Under Active Surveillance: The ERASE Randomized Clinical Trial. JAMA Oncol. 2021, 7, 1487–1495. [Google Scholar] [CrossRef]
- Mohamad, H.; McNeill, G.; Haseen, F.; N’Dow, J.; Craig, L.C.; Heys, S.D. The effect of dietary and exercise interventions on body weight in prostate cancer patients: A systematic review. Nutr. Cancer 2015, 67, 43–60. [Google Scholar] [CrossRef] [PubMed]
- Toohey, K.; Pumpa, K.L.; Arnolda, L.; Cooke, J.; Yip, D.; Craft, P.S.; Semple, S. A pilot study examining the effects of low-volume high-intensity interval training and continuous low to moderate intensity training on quality of life, functional capacity and cardiovascular risk factors in cancer survivors. PeerJ 2016, 4, e2613. [Google Scholar] [CrossRef] [PubMed] [Green Version]
- Devin, J.L.; Jenkins, D.G.; Sax, A.T.; Hughes, G.I.; Aitken, J.; Chambers, S.K.; Dunn, J.; Bolam, K.A.; Skinner, T. Cardiorespiratory Fitness and Body Composition Responses to Different Intensities and Frequencies of Exercise Training in Colorectal Cancer Survivors. Clin. Colorectal Cancer 2018, 17, e269–e279. [Google Scholar] [CrossRef] [Green Version]
- Lavín-Pérez, A.M.; Collado-Mateo, D.; Mayo, X.; Liguori, G.; Humphreys, L.; Copeland, R.J.; Jiménez, A. Effects of high-intensity training on the quality of life of cancer patients and survivors: A systematic review with meta-analysis. Sci. Rep. 2021, 11, 15089. [Google Scholar] [CrossRef] [PubMed]
- Baguley, B.J.; Bolam, K.A.; Wright, O.R.L.; Skinner, T.L. The Effect of Nutrition Therapy and Exercise on Cancer-Related Fatigue and Quality of Life in Men with Prostate Cancer: A Systematic Review. Nutrients 2017, 9, 1003. [Google Scholar] [CrossRef] [PubMed] [Green Version]


| All (n = 23) | Intervention (n = 12) | Usual Care (n = 11) | |
|---|---|---|---|
| Age (years) | 65.9 ± 7.8 | 66.6 ± 7.6 | 65.1 ± 7.9 |
| Height (cm) | 177.7 ± 6.7 | 177.2 ± 7.5 | 178.3 ± 5.7 |
| BMI (kg/m2) | 28.9 ± 3.4 | 27.4 ± 3.0 | 30.6 ± 2.9 |
| Married (%) | 56.5 | 54.5 | 58.3 |
| Past smoker (%) | 56.5 | 63.3 | 58.3 |
| Meeting PA guidelines (%) | 43.4 | 27.2 | 58.3 |
| Gleason Score | 8.4 ± 1.1 | 8.1 ± 0.9 | 8.7 ± 1.2 |
| Prostate Specific Antigen concentration (ng/mL) | 1.1 ± 1.3 | 1.3 ± 1.2 | 1.0 ± 1.3 |
| Time since diagnosis (months) | 64.8 ± 53.2 | 77.1 ± 58.8 | 51.3 ± 42.4 |
| Time on ADT (months) | 33.8 ± 35.6 | 36.4 ± 38.3 | 31.0 ± 32.2 |
| Previous radiation (%) | 65.2 | 66.6 | 63.6 |
| Duration of radiation (months) | 2.2 ± 1.6 | 2.4 ± 2.1 | 2.0 ± 0.1 |
| Previous chemotherapy (%) | 17.3 | 16.6 | 18.1 |
| Duration of chemotherapy (months) | 3.2 ± 1.6 | 4.0 ± 2.0 | 2.5 ± 0.5 |
| Previous prostatectomy (%) | 30.4 | 8.6 | 45.4 |
| Group | n | Baseline | p Value | n | 12 Weeks | p Value (0 vs. 12 Weeks) | p Value a (INT vs. UC) | n | 20 Weeks | p Value (0 vs. 20 Weeks) | p Value (12 vs. 20 Weeks) | p Value b (INT vs. UC) | |
|---|---|---|---|---|---|---|---|---|---|---|---|---|---|
| Energy (MJ/day) | INT | 12 | 10.3 (9.1, 10.9) | 0.689 | 11 | 8.6 (7.6, 9.5) | 0.032 | 0.057 | 9 | 8.2 (7.2, 9.2) | 0.014 | >0.999 | 0.019 |
| UC | 11 | 9.7 (8.8, 10.7) | 10 | 9.9 (8.9, 10.9) | >0.999 | 10 | 9.9 (8.9, 10.9) | >0.999 | >0.999 | ||||
| Protein (g/day) | INT | 12 | 110.1 (99.7, 120) | 0.601 | 11 | 108.8 (97.9, 119) | >0.999 | 0.850 | 9 | 103.7 (91.7, 115.7) | >0.999 | >0.999 | 0.211 |
| UC | 11 | 106.1 (95.2, 117) | 10 | 107.3 (95.9, 118) | >0.999 | 10 | 114.2 (102.8, 125.6) | >0.999 | >0.999 | ||||
| Fat (g/day) | INT | 12 | 91.7 (78.7, 104) | 0.776 | 11 | 76.5 (63.0, 90.0) | 0.316 | 0.048 | 9 | 79.8 (65.1, 94.5) | 0.766 | >0.999 | 0.190 |
| UC | 11 | 89.0 (75.4, 102) | 10 | 96.3 (82.1, 110) | >0.999 | 10 | 93.4 (79.2, 107.5) | >0.999 | >0.999 | ||||
| Saturated fat (g/day) | INT | 12 | 33.6 (28.7, 38.9) | 0.477 | 11 | 17.2 (11.6, 22.8) | <0.001 | <0.001 | 9 | 20.6 (14.5, 26.7) | 0.002 | 0.674 | 0.001 |
| UC | 11 | 30.8 (24.8, 36.4) | 10 | 34.0 (28.1, 39.9) | >0.999 | 10 | 34.8 (28.9, 40.7) | >0.999 | >0.999 | ||||
| Polyunsaturated fat (g/day) | INT | 12 | 15.9 (12.5, 19.2) | 0.952 | 11 | 20.8 (17.4, 24.3) | 0.043 | 0.065 | 9 | 18.4 (14.8, 22.1) | 0.183 | 0.222 | 0.280 |
| UC | 11 | 16.0 (12.5, 19.5) | 10 | 16.2 (12.6, 19.8) | >0.999 | 10 | 15.6 (11.9, 19.3) | 0.833 | 0.765 | ||||
| Monounsaturated fat (g/day) | INT | 12 | 39.2 (31.5, 47.0) | 0.770 | 11 | 37.5 (29.5, 45.5) | >0.999 | 0.442 | 9 | 36.0 (27.2, 44.7) | 0.526 | 0.767 | 0.763 |
| UC | 11 | 40.9 (32.9, 48.9) | 10 | 42.0 (33.6, 50.4) | >0.999 | 10 | 34.1 (25.3, 42.9) | 0.198 | 0.140 | ||||
| LCN3FA (g/day) | INT | 12 | 0.80 (0.43, 1.18) | 0.800 | 11 | 1.42 (1.03, 1.81) | 0.033 | 0.013 | 9 | 1.2 (0.7, 1.6) | 0.090 | 0.344 | 0.145 |
| UC | 11 | 0.73 (0.34, 1.13) | 10 | 0.69 (0.28, 1.10) | >0.999 | 10 | 0.7 (0.3, 1.1) | 0.943 | 0.803 | ||||
| ALA (g/day) | INT | 12 | 1.71 (0.80, 2.61) | 0.984 | 11 | 2.68 (1.74, 3.62) | 0.272 | 0.184 | 9 | 3.1 (2.1, 4.1) | 0.013 | 0.483 | 0.587 |
| UC | 11 | 1.72 (0.78, 2.66) | 10 | 1.77 (0.79, 2.75) | >0.999 | 10 | 1.7 (0.7, 2.7) | 0.933 | 0.998 | ||||
| Linoleic acid (g/day) | INT | 12 | 13.0 (10.4, 15.6) | 0.917 | 11 | 15.4 (12.7, 18.0) | 0.573 | 0.301 | 9 | 14.1 (11.2, 16.9) | 0.479 | 0.392 | 0.490 |
| UC | 11 | 13.2 (10.5, 15.9) | 10 | 13.3 (10.6, 16.1) | >0.999 | 10 | 12.6 (9.7, 15.5) | 0.725 | 0.648 | ||||
| Cholesterol (g/day) | INT | 12 | 338 (259, 417) | 0.369 | 11 | 316 (233, 399) | >0.999 | 0.834 | 9 | 244 (153, 335) | 0.104 | 0.221 | 0.244 |
| UC | 11 | 286 (203, 368) | 10 | 303 (217, 390) | >0.999 | 10 | 320 (229, 412) | 0.554 | 0.774 | ||||
| Carbohydrates (g/day) | INT | 12 | 238 (209, 267) | 0.820 | 11 | 197 (167, 227) | 0.064 | 0.231 | 9 | 180.0 (147.3, 212.6) | 0.009 | 0.978 | 0.065 |
| UC | 11 | 233 (203, 264) | 10 | 224 (192, 256) | >0.999 | 10 | 222.9 (191.2, 254.6) | >0.999 | >0.999 | ||||
| Fibre (g/day) | INT | 12 | 34.6 (30.8, 38.4) | 0.976 | 11 | 47.0 (43.0, 50.9) | <0.001 | <0.001 | 9 | 44.7 (40.5, 49.0) | <0.001 | 0.330 | 0.010 |
| UC | 11 | 34.6 (30.6–38.5) | 10 | 34.9 (30.8, 39.0) | >0.999 | 10 | 36.9 (32.7, 41.0) | >0.999 | >0.999 | ||||
| Ethanol (g/day) | INT | 12 | 15.3 (9.26, 21.5) | 0.401 | 11 | 4.9 (1.4, 11.3) | 0.018 | 0.051 | 9 | 3.2 (1.3, 10.0) | 0.002 | 0.635 | 0.012 |
| UC | 11 | 13.4 (6.96, 19.8) | 10 | 14.2 (7.51, 20.9) | >0.999 | 10 | 15.6 (8.9, 22.3) | 0.551 | 0.706 | ||||
| Fruit (servings/day) | INT | 12 | 2.21 (1.68, 2.75) | 0.960 | 11 | 2.46 (1.91, 3.01) | >0.999 | 0.019 | 9 | 2.3 (1.7, 2.9) | >0.999 | >0.999 | 0.223 |
| UC | 11 | 2.23 (1.68, 2.79) | 10 | 1.50 (0.92, 2.07) | 0.122 | 10 | 1.7 (1.2, 2.3) | 0.640 | 0.986 | ||||
| Vegetables (servings/day) | INT | 12 | 4.28 (3.33, 5.22) | 0.943 | 11 | 8.22 (7.24, 9.20) | <0.001 | 0.001 | 9 | 7.3 (6.3, 8.2) | <0.001 | 0.328 | 0.061 |
| UC | 11 | 4.23 (3.42, 5.22) | 10 | 4.84 (3.81, 5.87) | 0.872 | 10 | 5.9 (4.9, 7.0) | 0.020 | 0.223 | ||||
| Refined grain (servings/day) | INT | 12 | 3.35 (2.40, 4.30) | 0.690 | 11 | 1.92 (0.93, 2.90) | 0.090 | 0.011 | 9 | 2.0 (0.9, 3.1) | 0.134 | >0.999 | 0.487 |
| UC | 11 | 3.62 (2.64, 4.61) | 10 | 3.81 (2.77, 4.85) | >0.999 | 10 | 2.5 (1.5, 3.5) | 0.391 | >0.999 | ||||
| Nuts and seeds (servings/day) | INT | 12 | 0.92 (0.33, 1.51) | 0.401 | 11 | 1.89 (1.28, 2.51) | 0.114 | 0.717 | 9 | 1.7 (1.0, 2.3) | 0.376 | >0.999 | 0.013 |
| UC | 11 | 1.28 (0.67, 1.90) | 10 | 1.73 (1.08, 2.37) | 0.893 | 10 | 0.5 (0.1, 1.1) | 0.336 | 0.036 | ||||
| Fish (servings/day) | INT | 12 | 0.61 (0.38, 0.84) | 0.897 | 11 | 0.90 (0.67, 1.13) | 0.121 | 0.006 | 9 | 0.7 (0.4, 0.9) | 0.904 | 0.295 | 0.702 |
| UC | 11 | 0.59 (0.35, 0.83) | 10 | 0.44 (0.20, 0.67) | >0.999 | 10 | 0.6 (0.4, 0.8) | >0.999 | >0.999 | ||||
| Red meat (servings/day) | INT | 12 | 0.75 (0.48, 1.03) | 0.398 | 11 | 0.33 (0.06, 0.61) | 0.071 | 0.205 | 9 | 0.2 (0.0, 0.5) | 0.038 | >0.999 | 0.016 |
| UC | 11 | 0.59 (0.31, 0.86) | 10 | 0.60 (0.30, 0.89) | >0.999 | 10 | 0.8 (0.4, 1.1) | >0.999 | >0.999 | ||||
| Processed meat (servings/day) | INT | 12 | 0.36 (0.25, 0.47) | 0.632 | 11 | 0.04 (0.01, 0.15) | <0.001 | <0.001 | 9 | 0.0 (0.0, 0.2) | >0.999 | 0.001 | 0.007 |
| UC | 11 | 0.32 (0.21, 0.43) | 10 | 0.38 (0.27, 0.49) | >0.999 | 10 | 0.3 (0.2, 0.4) | >0.999 | >0.999 | ||||
| Poultry (servings/day) | INT | 12 | 0.43 (0.20, 0.65) | 0.985 | 11 | 0.47 (0.25, 0.70) | >0.999 | 0.669 | 9 | 0.6 (0.3, 0.8) | >0.999 | >0.999 | 0.078 |
| UC | 11 | 0.42 (0.20, 0.65) | 10 | 0.40 (0.16, 0.64) | >0.999 | 10 | 0.2 (0.0, 0.5) | >0.999 | >0.999 | ||||
| Dairy (servings/day) | INT | 12 | 2.84 (2.12, 3.56) | 0.353 | 11 | 1.58 (0.83, 2.33) | 0.033 | 0.508 | 9 | 1.7 (0.9, 2.6) | 0.136 | >0.999 | 0.248 |
| UC | 11 | 2.35 (1.60, 3.10) | 10 | 1.95 (1.16, 2.74) | >0.999 | 10 | 2.4 (1.6, 3.2) | >0.999 | >0.999 |
| Group | n | Baseline | p Value | n | 12 Weeks | p Value (0 vs. 12 Weeks) | p Value a (INT vs. UC) | n | 20 Weeks | p Value (0 vs. 20 Weeks) | p Value (12 vs. 20 Weeks) | p Value b (INT vs. UC) | |
|---|---|---|---|---|---|---|---|---|---|---|---|---|---|
| Cardiorespiratory fitness | |||||||||||||
| VO2peak (L/min) | INT | 12 | 2.02 (1.89, 2.16) | 0.740 | 11 | 2.07 (1.94, 2.21) | 0.521 | 0.492 | 9 | 2.34 (2.19, 2.48) | <0.001 | <0.001 | 0.002 |
| UC | 11 | 2.06 (1.93, 2.19) | 10 | 2.00 (1.87, 2.14) | 0.487 | 10 | 2.02 (1.88, 2.15) | 0.608 | 0.857 | ||||
| VO2peak (mL·kg−1.min−1) | INT | 12 | 22.1 (20.4, 23.7) | 0.961 | 11 | 23.6 (21.9, 25.2) | 0.104 | 0.161 | 9 | 26.8 (25.0, 28.5) | <0.001 | <0.001 | <0.001 |
| UC | 11 | 22.0 (20.5, 23.9) | 10 | 21.9 (20.2, 23.5) | 0.874 | 10 | 21.8 (20.1, 23.5) | 0.821 | 0.947 | ||||
| 400 m walk test (s) | INT | 12 | 260.6 (241.3, 279.8) | 0.872 | 11 | 246.0 (226.2, 265.8) | 0.103 | 0.945 | 9 | 241.0 (220.6, 261.4) | 0.203 | 0.589 | 0.457 |
| UC | 11 | 268.6 (248.4, 288.8) | 10 | 247.0 (226.8, 267.2) | 0.106 | 10 | 251.9 (231.7, 272.1) | 0.064 | 0.585 | ||||
| Body composition (kg) | |||||||||||||
| Total body mass | INT | 12 | 92.0 (90.9,93.1) | 0.784 | 11 | 88.7 (87.5, 89.8) | <0.001 | 0.001 | 9 | 87.8 (86.5, 89.0) | <0.001 | 0.371 | <0.001 |
| UC | 11 | 92.2 (91.1, 93.4) | 10 | 91.6 (90.4, 92.8) | >0.999 | 10 | 91.1 (89.9, 92.3) | 0.461 | >0.999 | ||||
| Lean muscle mass | INT | 12 | 53.2 (52.2, 54.1) | 0.750 | 11 | 52.0 (51.0, 53.0) | 0.397 | 0.060 | 9 | 52.0 (50.9, 53.0) | 0.397 | >0.999 | 0.102 |
| UC | 11 | 53.4 (52.4, 54.3) | 10 | 53.4 (52.3, 54.4) | >0.999 | 10 | 53.2 (52.2, 54.2) | >0.999 | >0.999 | ||||
| Fat mass | INT | 12 | 29.5 (28.3, 30.7) | 0.696 | 11 | 27.8 (26.6, 29.0) | 0.032 | 0.096 | 9 | 27.2 (25.9, 28.5) | 0.005 | 0.796 | 0.192 |
| UC | 11 | 29.8 (28.6, 31.1) | 10 | 29.3 (28.1, 30.6) | >0.999 | 10 | 28.5 (27.2, 29.7) | 0.206 | 0.178 | ||||
| FACIT 1 | |||||||||||||
| General (0–108) | INT | 12 | 83.1 (78.7, 87.4) | 0.888 | 11 | 90.5 (85.9, 95.0) | 0.038 | 0.006 | 9 | 91.3 (86.4, 96.3) | 0.032 | >0.999 | 0.167 |
| UC | 11 | 82.6 (78.1, 87.2) | 10 | 81.2 (76.5, 86.0) | >0.999 | 10 | 86.5 (81.8, 91.3) | 0.569 | 0.343 | ||||
| Total (0–160) | INT | 12 | 120.3 (113.8, 26.9) | 0.771 | 11 | 133.4 (126.6, 140.3) | 0.013 | 0.002 | 9 | 133.8 (126.3, 141.3) | 0.015 | >0.999 | 0.141 |
| UC | 11 | 118.9 (112.1, 125.8) | 10 | 117.1 (110.0, 124.3) | >0.999 | 10 | 126.1 (118.9, 133.2) | 0.515 | 0.270 | ||||
| TOI (0–108) | INT | 12 | 83.2 (77.1, 89.2) | 0.762 | 11 | 91.9 (85.6, 98.2) | 0.081 | 0.024 | 9 | 91.5 (84.7, 98.4) | 0.132 | >0.999 | 0.371 |
| UC | 11 | 81.8 (75.5, 88.2) | 10 | 81.1 (74.5, 87.8) | >0.999 | 10 | 87.1 (80.5, 93.8) | 0.739 | 0.633 | ||||
| Fatigue (0–52) | INT | 12 | 37.1 (33.9, 40.3) | 0.684 | 11 | 42.9 (39.6, 46.3) | 0.025 | 0.005 | 9 | 42.5 (38.8, 46.1) | 0.064 | >0.999 | 0.312 |
| UC | 11 | 36.2 (32.8, 39.5) | 10 | 35.7 (32.2, 39.3) | >0.999 | 10 | 39.8 (36.3, 43.4) | 0.378 | 0.317 | ||||
| Physical Wellbeing (0–28) | INT | 12 | 23.3 (21.9, 24.7) | 0.614 | 11 | 25.1 (23.6, 26.6) | 0.145 | 0.036 | 9 | 25.0 (23.4, 26.6) | 0.206 | >0.999 | 0.247 |
| UC | 11 | 22.8 (21.3, 24.6) | 10 | 22.8 (21.3, 24.4) | >0.999 | 10 | 23.7 (22.2, 25.3) | >0.999 | >0.999 | ||||
| Social Wellbeing (0–28) | INT | 12 | 19.7 (17.4, 22.1) | 0.889 | 11 | 21.9 (19.5, 24.4) | 0.666 | 0.052 | 9 | 23.1 (20.4, 25.7) | 0.214 | >0.999 | 0.078 |
| UC | 11 | 20.0 (17.5, 22.4) | 10 | 18.4 (15.9, 21.0) | >0.999 | 10 | 19.7 (17.2, 22.3) | >0.999 | >0.999 | ||||
| Emotional Wellbeing (0–24) | INT | 12 | 18.5 (17.3, 19.7) | 0.964 | 11 | 20.8 (19.5, 22.0) | 0.024 | 0.083 | 9 | 20.5 (18.6, 21.4) | 0.256 | 0.798 | 0.320 |
| UC | 11 | 18.5 (17.2, 19.7) | 10 | 19.1 (17.8, 20.5) | 0.804 | 10 | 21.0 (19.7, 22.4) | 0.015 | 0.125 | ||||
| Functional Wellbeing (0–28) | INT | 12 | 21.5 (19.8, 23.3) | 0.747 | 11 | 22.5 (20.7, 24.4) | >0.999 | 0.177 | 9 | 23.2 (21.1, 25.2) | 0.894 | >0.999 | 0.295 |
| UC | 11 | 21.1 (19.3, 23.0) | 10 | 20.7 (18.7, 22.6) | >0.999 | 10 | 21.7 (19.7, 23.6) | >0.999 | >0.999 | ||||
| SF-36 1 | |||||||||||||
| Physical Function (0–100) | INT | 12 | 80.8 (71.7, 89.9) | 0.617 | 11 | 78.3 (68.8, 87.7) | 0.680 | 0.571 | 9 | 89.7 (79.3, 100.1) | 0.669 | 0.498 | 0.304 |
| UC | 11 | 77.4 (67.9, 87.0) | 10 | 82.2 (72.2, 92.1) | >0.999 | 10 | 82.2 (72.2, 92.1) | >0.999 | >0.999 | ||||
| Role Function (0–100) | INT | 12 | 72.6 (64.8, 80.4) | 0.438 | 11 | 72.8 (64.7, 80.9) | >0.999 | 0.685 | 9 | 80.7 (71.8, 89.6) | 0.616 | 0.616 | 0.858 |
| UC | 11 | 68.1 (60.0, 76.3) | 10 | 75.2 (66.7, 83.8) | 0.510 | 10 | 79.6 (71.1, 88.2) | 0.141 | 0.811 | ||||
| Bodily Pain (0–100) | INT | 12 | 76.5 (65.6, 87.3) | 0.622 | 11 | 77.8 (66.3, 89.1) | >0.999 | 0.895 | 9 | 80.3 (68.1, 92.5) | >0.999 | >0.999 | 0.407 |
| UC | 11 | 72.5 (61.2, 83.9) | 10 | 76.8 (65.0, 88.6) | >0.999 | 10 | 73.2 (61.4, 85.0) | >0.999 | >0.999 | ||||
| General (0–100) | INT | 12 | 57.2 (47.2, 67.3) | 0.737 | 11 | 66.3 (55.9, 76.7) | 0.710 | 0.588 | 9 | 59.7 (48.5, 70.9) | >0.999 | >0.999 | 0.688 |
| UC | 11 | 59.7 (49.2, 70.2) | 10 | 62.2 (51.3, 73.1) | >0.999 | 10 | 62.9 (52.0, 73.8) | >0.999 | >0.999 | ||||
| Vitality (0–100) | INT | 12 | 58.7 (52.4, 65.0) | 0.966 | 11 | 71.6 (64.5, 77.7) | 0.001 | 0.003 | 9 | 75.9 (68.7, 83.1) | 0.015 | 0.838 | 0.002 |
| UC | 11 | 58.5 (51.9, 65.1) | 10 | 56.5 (49.6, 63.4) | 0.645 | 10 | 59.7 (52.8, 66.6) | >0.999 | >0.999 | ||||
| Social Functioning (0–100) | INT | 12 | 86.1 (79.0, 93.1) | 0.733 | 11 | 87.1 (79.8, 94.4) | >0.999 | 0.138 | 9 | 91.8 (83.9, 99.6) | >0.999 | >0.999 | 0.482 |
| UC | 11 | 84.3 (77.0, 91.7) | 10 | 79.1 (71.4, 86.7) | 0.820 | 10 | 87.8 (80.2, 95.5) | >0.999 | 0.230 | ||||
| Role Emotion (0–100) | INT | 12 | 79.8 (73.4, 86.2) | 0.893 | 11 | 85.4 (78.7, 92.1) | 0.521 | 0.780 | 9 | 94.4 (87.0, 101.9) | 0.024 | 0.385 | 0.230 |
| UC | 11 | 79.2 (72.5, 85.9) | 10 | 84.1 (77.0, 91.1) | >0.999 | 10 | 88.2 (81.2, 95.3) | 0.407 | >0.999 | ||||
| Mental Health (0–100) | INT | 12 | 80.3 (75.7, 84.8) | 0.925 | 11 | 84.4 (79.6, 89.2) | 0.748 | 0.071 | 9 | 88.1 (82.9, 93.4) | 0.112 | 0.785 | 0.127 |
| UC | 11 | 80.0 (75.2, 84.7) | 10 | 78.0 (73.0, 83.0) | >0.999 | 10 | 82.5 (77.5, 87.5) | >0.999 | >0.999 | ||||
| PH Composite (0–100) | INT | 12 | 48.6 (45.1, 52.0) | 0.649 | 11 | 48.7 (45.1, 52.3) | >0.999 | 0.737 | 9 | 50.0 (46.1, 54.0) | >0.999 | >0.999 | 0.695 |
| UC | 11 | 47.4 (43.8, 51.0) | 10 | 49.6 (45.8, 53.4) | >0.999 | 10 | 49.0 (45.2, 52.8) | >0.999 | >0.999 | ||||
| MH Composite (0–100) | INT | 12 | 51.6 (49.1, 54.1) | 0.923 | 11 | 55.2 (52.6, 57.8) | 0.188 | 0.011 | 9 | 57.6 (54.7, 60.4) | 0.015 | 0.704 | 0.042 |
| UC | 11 | 51.6 (49.0, 54.2) | 10 | 50.3 (47.6, 53.0) | >0.999 | 10 | 53.4 (50.7, 56.2) | >0.999 | 0.656 |
Publisher’s Note: MDPI stays neutral with regard to jurisdictional claims in published maps and institutional affiliations. |
© 2022 by the authors. Licensee MDPI, Basel, Switzerland. This article is an open access article distributed under the terms and conditions of the Creative Commons Attribution (CC BY) license (https://creativecommons.org/licenses/by/4.0/).
Share and Cite
Baguley, B.J.; Adlard, K.; Jenkins, D.; Wright, O.R.L.; Skinner, T.L. Mediterranean Style Dietary Pattern with High Intensity Interval Training in Men with Prostate Cancer Treated with Androgen Deprivation Therapy: A Pilot Randomised Control Trial. Int. J. Environ. Res. Public Health 2022, 19, 5709. https://doi.org/10.3390/ijerph19095709
Baguley BJ, Adlard K, Jenkins D, Wright ORL, Skinner TL. Mediterranean Style Dietary Pattern with High Intensity Interval Training in Men with Prostate Cancer Treated with Androgen Deprivation Therapy: A Pilot Randomised Control Trial. International Journal of Environmental Research and Public Health. 2022; 19(9):5709. https://doi.org/10.3390/ijerph19095709
Chicago/Turabian StyleBaguley, Brenton J., Kirsten Adlard, David Jenkins, Olivia R. L. Wright, and Tina L. Skinner. 2022. "Mediterranean Style Dietary Pattern with High Intensity Interval Training in Men with Prostate Cancer Treated with Androgen Deprivation Therapy: A Pilot Randomised Control Trial" International Journal of Environmental Research and Public Health 19, no. 9: 5709. https://doi.org/10.3390/ijerph19095709