Article

The Association between Apparent Temperature and Hospital Admissions for Cardiovascular Disease in Limpopo Province, South Africa

1
Department of Global Public Health, Karolinska Institutet, 171 77 Stockholm, Sweden
2
Epidemiology and Public Health Department, Swiss Tropical and Public Health Institute, 4123 Allschwil, Switzerland
3
Faculty of Science, University of Basel, 4001 Basel, Switzerland
4
Environment and Health Research Unit, South African Medical Research Council, Johannesburg 2094, South Africa
5
Environmental Health Department, Faculty of Health Sciences, University of Johannesburg, Johannesburg 2094, South Africa
6
Population Health Sciences, University of Bristol, Bristol BS8 2PS, UK
7
Non-Communicable Diseases Research Unit, South African Medical Research Council, Durban 4091, South Africa
8
Department of Medicine, University of Cape Town, Cape Town 7925, South Africa
9
Environment and Health Research Unit, South African Medical Research Council, Pretoria 0001, South Africa
10
Department of Geography, Geoinformatics and Meteorology, University of Pretoria, Pretoria 0001, South Africa
*
Author to whom correspondence should be addressed.
These authors contributed equally to this work.
Int. J. Environ. Res. Public Health 2023, 20(1), 116; https://doi.org/10.3390/ijerph20010116
Submission received: 2 November 2022 / Revised: 14 December 2022 / Accepted: 16 December 2022 / Published: 22 December 2022

Abstract

:
Cardiovascular diseases (CVDs) have a high disease burden both globally and in South Africa. They have also been found to be temperature-sensitive globally. The association between temperature and CVD morbidity has previously been demonstrated, but little is known about it in South Africa. It is important to understand how changes in temperature in South Africa will affect CVD morbidity, especially in rural regions, to inform public health interventions and adaptation strategies. This study aimed to determine the short-term effect of apparent temperature (Tapp) on CVD hospital admissions in Mopani District, Limpopo province, South Africa. A total of 3124 CVD hospital admissions records were obtained from two hospitals from 1 June 2009 to 31 December 2016. Daily Tapp was calculated using nearby weather station measurements. The association was modelled using a distributed lag non-linear model with a negative binomial regression over a 21-day lag period. The fraction of morbidity attributable to non-optimal Tapp, i.e., cold (6–25 °C) and warm (27–32 °C) Tapp was reported. We found an increase in the proportion of admissions due to CVDs for warm and cold Tapp cumulatively over 21 days. Increasing CVD admissions due to warm Tapp appeared immediately and lasted for two to four days, whereas the lag-structure for the cold effect was inconsistent. A proportion of 8.5% (95% Confidence Interval (CI): 3.1%, 13.7%) and 1.1% (95% CI: −1.4%, 3.5%) of the total CVD admissions was attributable to cold and warm temperatures, respectively. Warm and cold Tapp may increase CVD admissions, suggesting that the healthcare system and community need to be prepared in the context of global temperature changes.

1. Introduction

Cardiovascular disease (CVD), the leading cause of death globally, is a major threat to human health and well-being. CVD is a broad term used to encompass a group of multi-factorial diseases affecting the structure and function of the heart and the vasculature system. In 2019, CVDs were estimated to account for 32% and 15% of the global mortality and morbidity, respectively [1]. Non-modifiable (age, sex, and genetics), modifiable behavioural risk factors such as physical inactivity; unhealthy dietary patterns; tobacco; and alcohol consumption as well as external determinants, including stress, noise and air pollution, and socio-economic status are known contributors to CVD incidences [1,2,3]. CVDs are a public health issue, especially in low- and middle-income countries (LMICs), with over 75% of global CVD deaths occurring in these regions, partially due to inequitable healthcare services and insufficient awareness of early intervention programmes [1].
Over the years, a growing body of research has found temperature to be an environmental factor affecting CVD mortality [3,4,5,6,7]. The risk of severe illness or morbidity due to CVDs increases at very high or very low ambient temperatures, although this is context-dependant [8,9]. The thermoregulatory response of the cardiovascular system is thought to play a role in driving the temperature-CVD association. As a response to heat stress, the superficial blood vessels dilate, increasing blood flow to the skin, and which increases cardiac workload. With prolonged heat exposure and inability to lose bodily heat by sweating an increase in core temperature occurs. The inability of the cardiac output to compensate for this leads to a cardiovascular event, usually through heat intolerance. A core body temperature above 38 °C results in heat exhaustion with impaired physical and cognitive functions and higher than 40 °C leads to heat stroke and increased risks of organ damage and mortality [3,10,11]. In contrast, exposure to cold causes an increase in the cardiac workload and a sustained increase in systemic blood pressure resulting in cardiovascular dysregulation, through vasoconstriction that reduces blood flow to the heart [3,12]. Further, altered blood constitution and consequent increase in haemo-concentration and fibrinogen as a response to cold, favours coagulation and increases the risk of thromboses [13]. This response is also driven by the cold-related autonomous nervous system activation, occasionally leading to arrhythmias [14].
There are several studies showing the effects of temperature on mortality and morbidity, although fewer tend to focus on the latter [5,6,15,16,17,18]. Studies have shown an increased short-term effect of temperature on CVD mortality; some have shown a V-, U- or J-shaped relationship, which suggests an increase in the risk for CVD above and below an optimal temperature [19,20,21,22]. Optimal temperature is defined as the temperature with the lowest risk for CVD mortality and temperatures above and below this are referred to as warm and cold temperatures, respectively [21,23]. However, with respect to CVDs, optimal temperature and the extent to which temperatures affect them, varies by climate, region and population [21,23].
Taken in the context of anthropogenic climate change, global mean surface temperatures are largely projected to increase, with an increase in temperature extremes, i.e., days of extreme heat and cold, intensifying in frequency and duration [24]. The rapid pace of this global warming has emerged as a major threat to human health and is a developing public health challenge [4]. Non-optimal temperatures are now among the top 10 leading causes of mortality worldwide, according to a recent Global Burden of Disease study [25]. Given the large burden of CVDs and associations between temperature and CVD, there is reason for concern that the prevalence of CVD and short-term effects, such as hospital admissions, may increase in the future with frequent extremes of temperature [16,17,18,26]. The impacts are likely to have the greatest effect in vulnerable communities and in LMICs [27,28]. Physical factors such as rural settings, low educational attainment, and air pollution have been recognized to increase the susceptibility to temperature-related CVDs [29,30,31,32].
South Africa is facing a double burden in this context; warming over South Africa is happening at twice the global rate and ischaemic heart diseases (IHDs) and related co-morbidities like diabetes are the only diseases that have seen an increased prevalence over the past decade [33,34]. In 2019, CVDs accounted for 16% of all deaths and 7% of all disability-adjusted life years (DALYs) in South Africa [33]. People from low socio-economic groups and those living in remote or rural areas are at increased risk for poorer CVD outcomes, partially due to inadequate access to medical facilities compared to their urban counterparts [1,35,36]. Few studies have considered the relation between temperature and mortality or morbidity in South Africa. Using data for 1997 to 2013, a study found that 3.4% of the nation-wide mortality was due to non-optimal temperature, with 3% attributable to cold and 0.4% attributable to warm temperatures [21]. Two studies considered CVD morbidity using hospital admissions data and the effect modification of temperature on the association between air pollution and CVD admissions for different regions of South Africa and reported contrasting findings [31,37]. As the average temperature projections for South Africa suggesting between 4 to 6 °C increases in temperature by 2100, the risk of hospital admissions for CVD-related illnesses attributable to temperature requires further investigation for improved prevention and preparedness [38,39].
Given the variation in findings across and within countries, the aim of this study was to perform an exploratory analysis investigating the short-term association between apparent temperature (Tapp) and CVD hospital admissions in Mopani District Municipality, Limpopo province, South Africa and the proportion of CVD admissions attributable to non-optimal Tapp.

2. Materials and Methods

2.1. Study Setting

Mopani district is located in Limpopo province in north-eastern South Africa. Mopani district is predominantly rural with high levels of unemployment, with approximately 55% of the population living below the upper poverty line of ZAR 1227 (equivalent to ~73 USD) per month [40]. Climate studies suggest that this region is vulnerable to the health impacts of heat exposure due to projections predicting significant increases in temperature and heatwave events [38,41,42]. Daily hospital admission data was collected from two large hospitals, namely Nkhensani Hospital and Maphutha L. Malatjie (Figure 1) which are two out of six secondary level health-care facilities in the district. The dataset has been used in previous studies to consider diarrhoeal disease [43], respiratory disease [44], malaria and asthma [45] but not CVD hospital admissions.

2.2. Data Sources

2.2.1. Health Data

The variables in the hospital admission data included date of admission and discharge, time spent in hospital, age and sex. The dataset was not classified using the International Classification of Disease-10 (ICD-10) codes and only the initial diagnosis on admission was available. Therefore, the ICD-10 IX (diseases on the circulatory system) classification list was employed to identify CVD cases for all ages in consultation with a general medical doctor from South Africa. The list with the broadly classified CVDs used in this study is included in the Supplementary Material (Table S1). While the dataset covered the period of 2002 to 2016, we chose to include only the cases from 2009 to 2016 owing to a high amount of missingness for the period prior to that, partially due to misplaced admission books.
There was a total of 37,090 all-cause admissions from 2009 to 2016. Of that, a total of 4097 CVD admission cases were included in this study, from which 1726 cases were missing the date of admission. As the date of admission was considered to be the outcome date, we imputed the missing information by subtracting the average length of hospital stay (17 days) from the date of discharge (if reported). A total of 43.6% of the cases could be imputed and the remaining 56.4% of the cases with neither date of admission nor date of discharge available were excluded from the analysis (23.6% of the overall sample). From the CVD admissions without missing information on those variables, 51.57% and 48.43% were males and females, and 21.07% and 78.93% were <45 years and ≥45years of age, respectively.
A final sample of 3124 CVD admissions occurring in the study period between 1 June 2009 and 31 December 2016 was included in the analysis. All admission records were aggregated to daily counts and merged with daily Tapp data (see below). 147 days with no hospital admissions were treated as missing data and excluded from the model.

2.2.2. Weather Data

Meteorological data were obtained from Thohoyandou where a weather station was located approximately 40 km outside of the Mopani district. Data on mean daily temperature (°C) and relative humidity (%) were directly extracted from the dataset. In a previous study, temperatures measured at the Thohoyandou weather station and in dwellings in Giyani (the location of the hospitals) were well correlated (R = 0.98, p <0.001), suggesting that meteorological conditions did not vary substantially between the station and the communities under study [44].
Missing meteorological variables were imputed with chained equations followed by predictive mean matching. Variables used to predict missing weather variables were average temperature (Tavrg), relative humidity (RH), wind speed (WS) and total rainfall. For days where no weather data was available, Tapp, was calculated using an exponential rolling average of the three days before and after, where more weight was given to Tapp of more recent days. Out of the 2771 days in the study period, Tapp was imputed for 19 days with the predictive mean matching method and for two days with the rolling average.
Tapp, a metric that combines temperature and relative humidity, was chosen as the exposure variable, as it ought to represent the ‘real-feel’ of temperature. Tapp was calculated using the Steadman equation shown below, where hPa is the vapour pressure [46].
T app = T avg + 0.33 hPa 0.7 WS 4
hPa = RH 100 6.105 e ( 17.27 T avg ) ( 237.7 + T avg )

2.3. Statistical Analyses

2.3.1. Statistical Model

Following Vicedo-Cabrera et al. [47], we conducted a time-series analysis to quantify the short-term association between Tapp and the proportion of admissions due to CVDs. The daily share of admissions due to CVDs was modelled with negative binomial regression in the distributed-lag non-linear modelling (DLNM) framework. The negative binomial regression model allowed for overdispersion of daily CVD counts, while DLNM allowed simultaneous modelling of non-linear exposure–response relationships and delayed effects. The model equation is as follows:
Log   ( CVD   admissions t ) =   α + log ( total   admissions t ) + f ( T appt t , β 1 ) + β 2 ns ( t , 8 df ) + η 1 DOW t + ϵ t
where 𝛼 is the model intercept, f ( T appt t , β 1 ) is a delayed lag non-linear function incorporating a cross-basis matrix that defines the relationship between Tapp and log ( CVD   admissions ) at time t , β 2 ns ( t , 8 df ) is a vector of coefficients β 2 for a natural spline function of t with 8 degrees of freedom to account for long-term trends, η 1 is a coefficient for DOW t (day of the week at time t and ϵ t is the residual. f ( T appt t , β 1 ) is modelled by a crossbasis matrix which consists of the exposure–response (Tapp-CVD) and lag-response (lag-CVD) functions.
The exposure–response relationship was modelled with a natural cubic spline with two internal knots at 15 °C and 26 °C. The knot placement was based on how frequently the Tapp occurred during the study period. The best set of knots in a range of frequent Tapp were then chosen from among a few candidate specifications using Akaike Information Criterion (AIC) (Table S2).
The lag-response relationship was modelled with a natural cubic spline with three equally spaced internal knots on the log scale, because this allowed for more flexibility at shorter lags in the model where we expected the most pronounced effects. A lag period of 21 days was motivated by previous studies and is considered as the short-term effect of Tapp on CVD [21,23,48].
The model was adjusted for the log of daily counts of total hospital admissions to reduce the imprecision that could have arisen as a result of the digitization of handwritten admission data. We also adjusted for day of the week (DOW) and time. DOW was modelled as a categorical variable with seven categories while time was modelled as an integer variable using a natural cubic spline with 8 degrees of freedom.
As the interest of this study was to investigate the short-term (21 days) association between Tapp and CVD admissions, long-term patterns such as hospital access and seasonality, were likely to obscure the short-term association [49]. Hence, by adjusting the model for time, only the short-term variations of CVD admissions caused by Tapp were investigated.

2.3.2. Relative Risk and Optimal Temperature

The bi-dimensional (exposure-lag-response) relationship was reduced to a one-dimensional (exposure-response) relationship by calculating overall cumulative risk ratios (RR). For each Tapp, the RR cumulated over the whole 21-day lag period was calculated. The RRs were calculated using the optimal Tapp as the reference. The optimal Tapp was derived from the overall cumulative exposure-response curve over the 21-day lag period, as suggested by a previous study [50]. It is the lowest point of the overall cumulative curve in a range of frequently occurring Tapp, where the risk for CVD admissions is lowest. Tapp, which occurred infrequently during the study period, were not chosen as the optimal Tapp even if they had the lowest risk for CVD admissions from the cumulative curve, as cumulative risks at more extreme temperature ranges were imprecisely estimated and likely to be sensitive to the choice of exposure–response function. This means that extreme Tapp was not chosen as the optimal Tapp, due to their infrequent occurrence during the study period. Tapp above and below the optimal Tapp are referred to as warm and cold Tapp, respectively. Non-optimal Tapp is defined as all cold and warm Tapps together.

2.3.3. Attributable Fraction

The share of CVD admissions due to non-optimal Tapp was calculated by summing up the CVD admissions from all days of the series, relative to the optimal Tapp. The ratio with the total CVD admission resulted in the attributable fraction (AF). The AF for cold and hot Tapp was calculated by summing up the contributions from days colder or hotter than the optimal Tapp, respectively. Empirical 95% confidence intervals (CI) were conducted using the Monte Carlo simulation over 1000 repetitions. All of those calculations were done using the attrdl.R script developed by Gasparrini [51].

2.3.4. Sensitivity Analysis

Sensitivity analysis was performed to check the robustness of the model by changing the duration of the lag period and using the datasets without imputed dates of admissions from 1 June 2009 to 31 December 2016 and from 1 January 2002 to 31 December 2016. As studies often use a quasi-Poisson regression model instead of the negative binomial regression model, an additional sensitivity analysis was conducted to compare these two models. In this study, a negative binomial model was chosen over a quasi-Poisson regression model so that AIC is available to discriminate between candidate models, and because it allows for a more flexible relationship between the variance and the mean.

3. Results

Descriptive Results

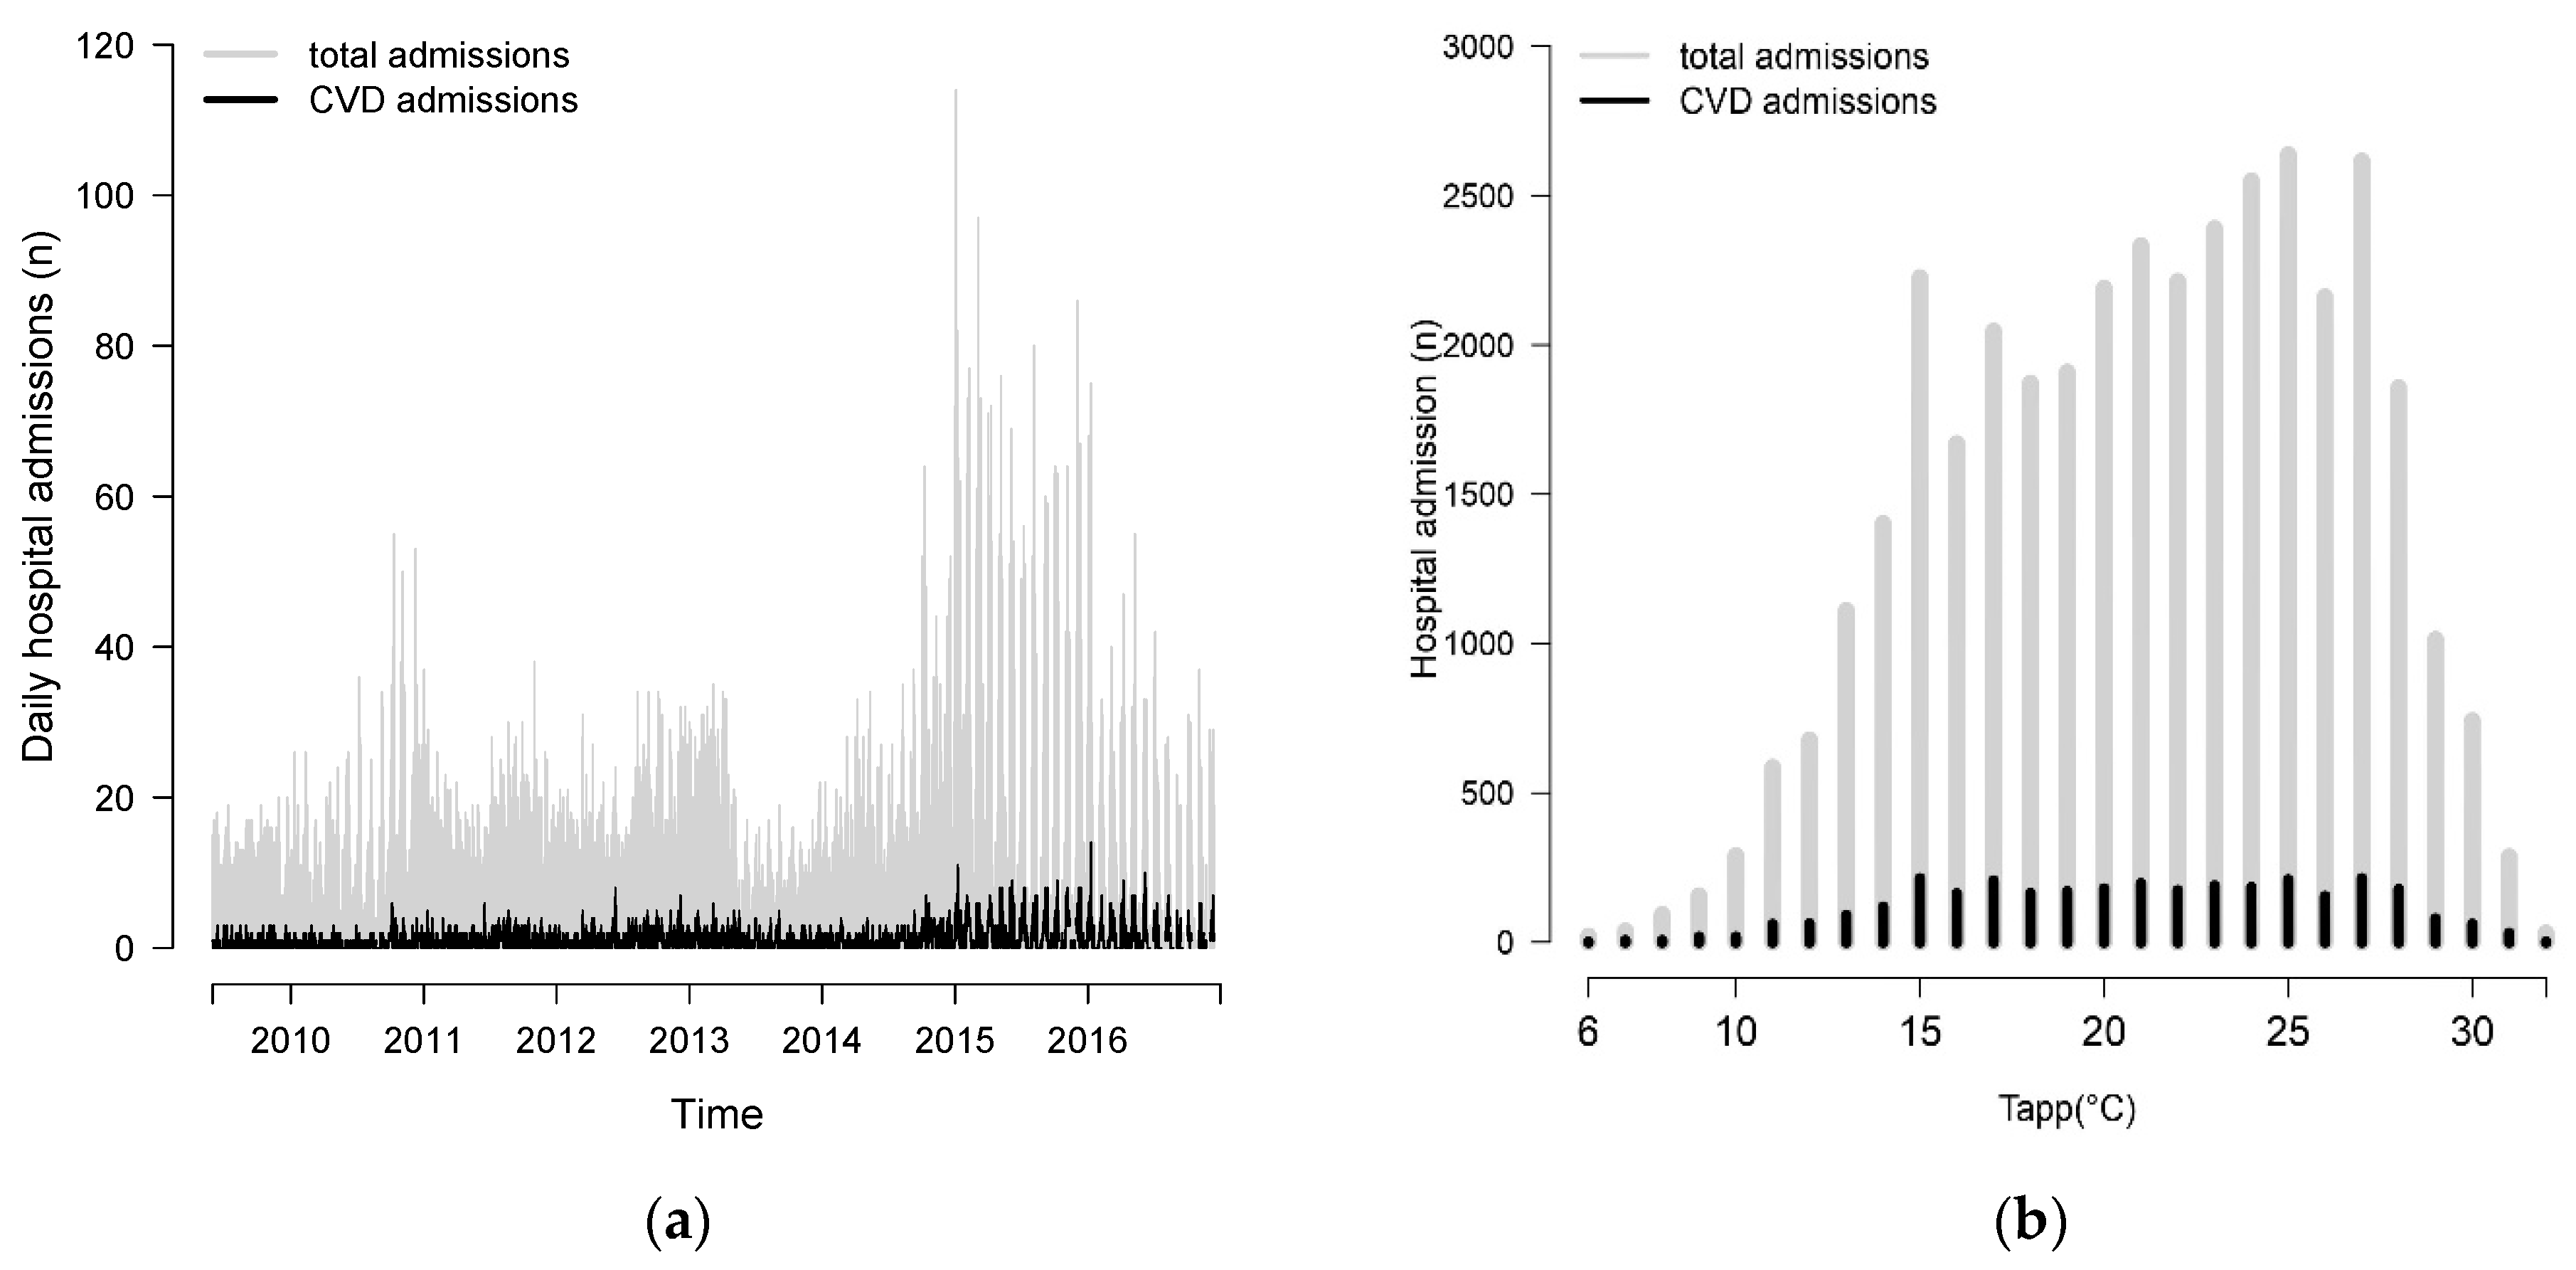
There were 3124 admissions for CVD during the study period. Figure 2 shows an overview of the distribution pattern of daily CVD hospital admission counts during the study. Figure 2a shows the pattern of daily counts of total and CVD admission during the study period. Seasonal trends were not observed in the daily hospital admissions counts. However, high admission counts were observed between the years 2015 and 2016. Figure 2b shows the distribution of the 37,090 total admissions and 3124 CVD admissions over the Tapp range. It is visible that, towards the warm Tapp extremes, the number of total as well as CVD admissions decreased. Seasonal trends of Tapp ranged from 6 °C to 32 °C, with the 50th percentile at 21 °C (Figure 3). Yearly averages ranged from 19 °C to 21 °C with an overall mean of 20 °C.
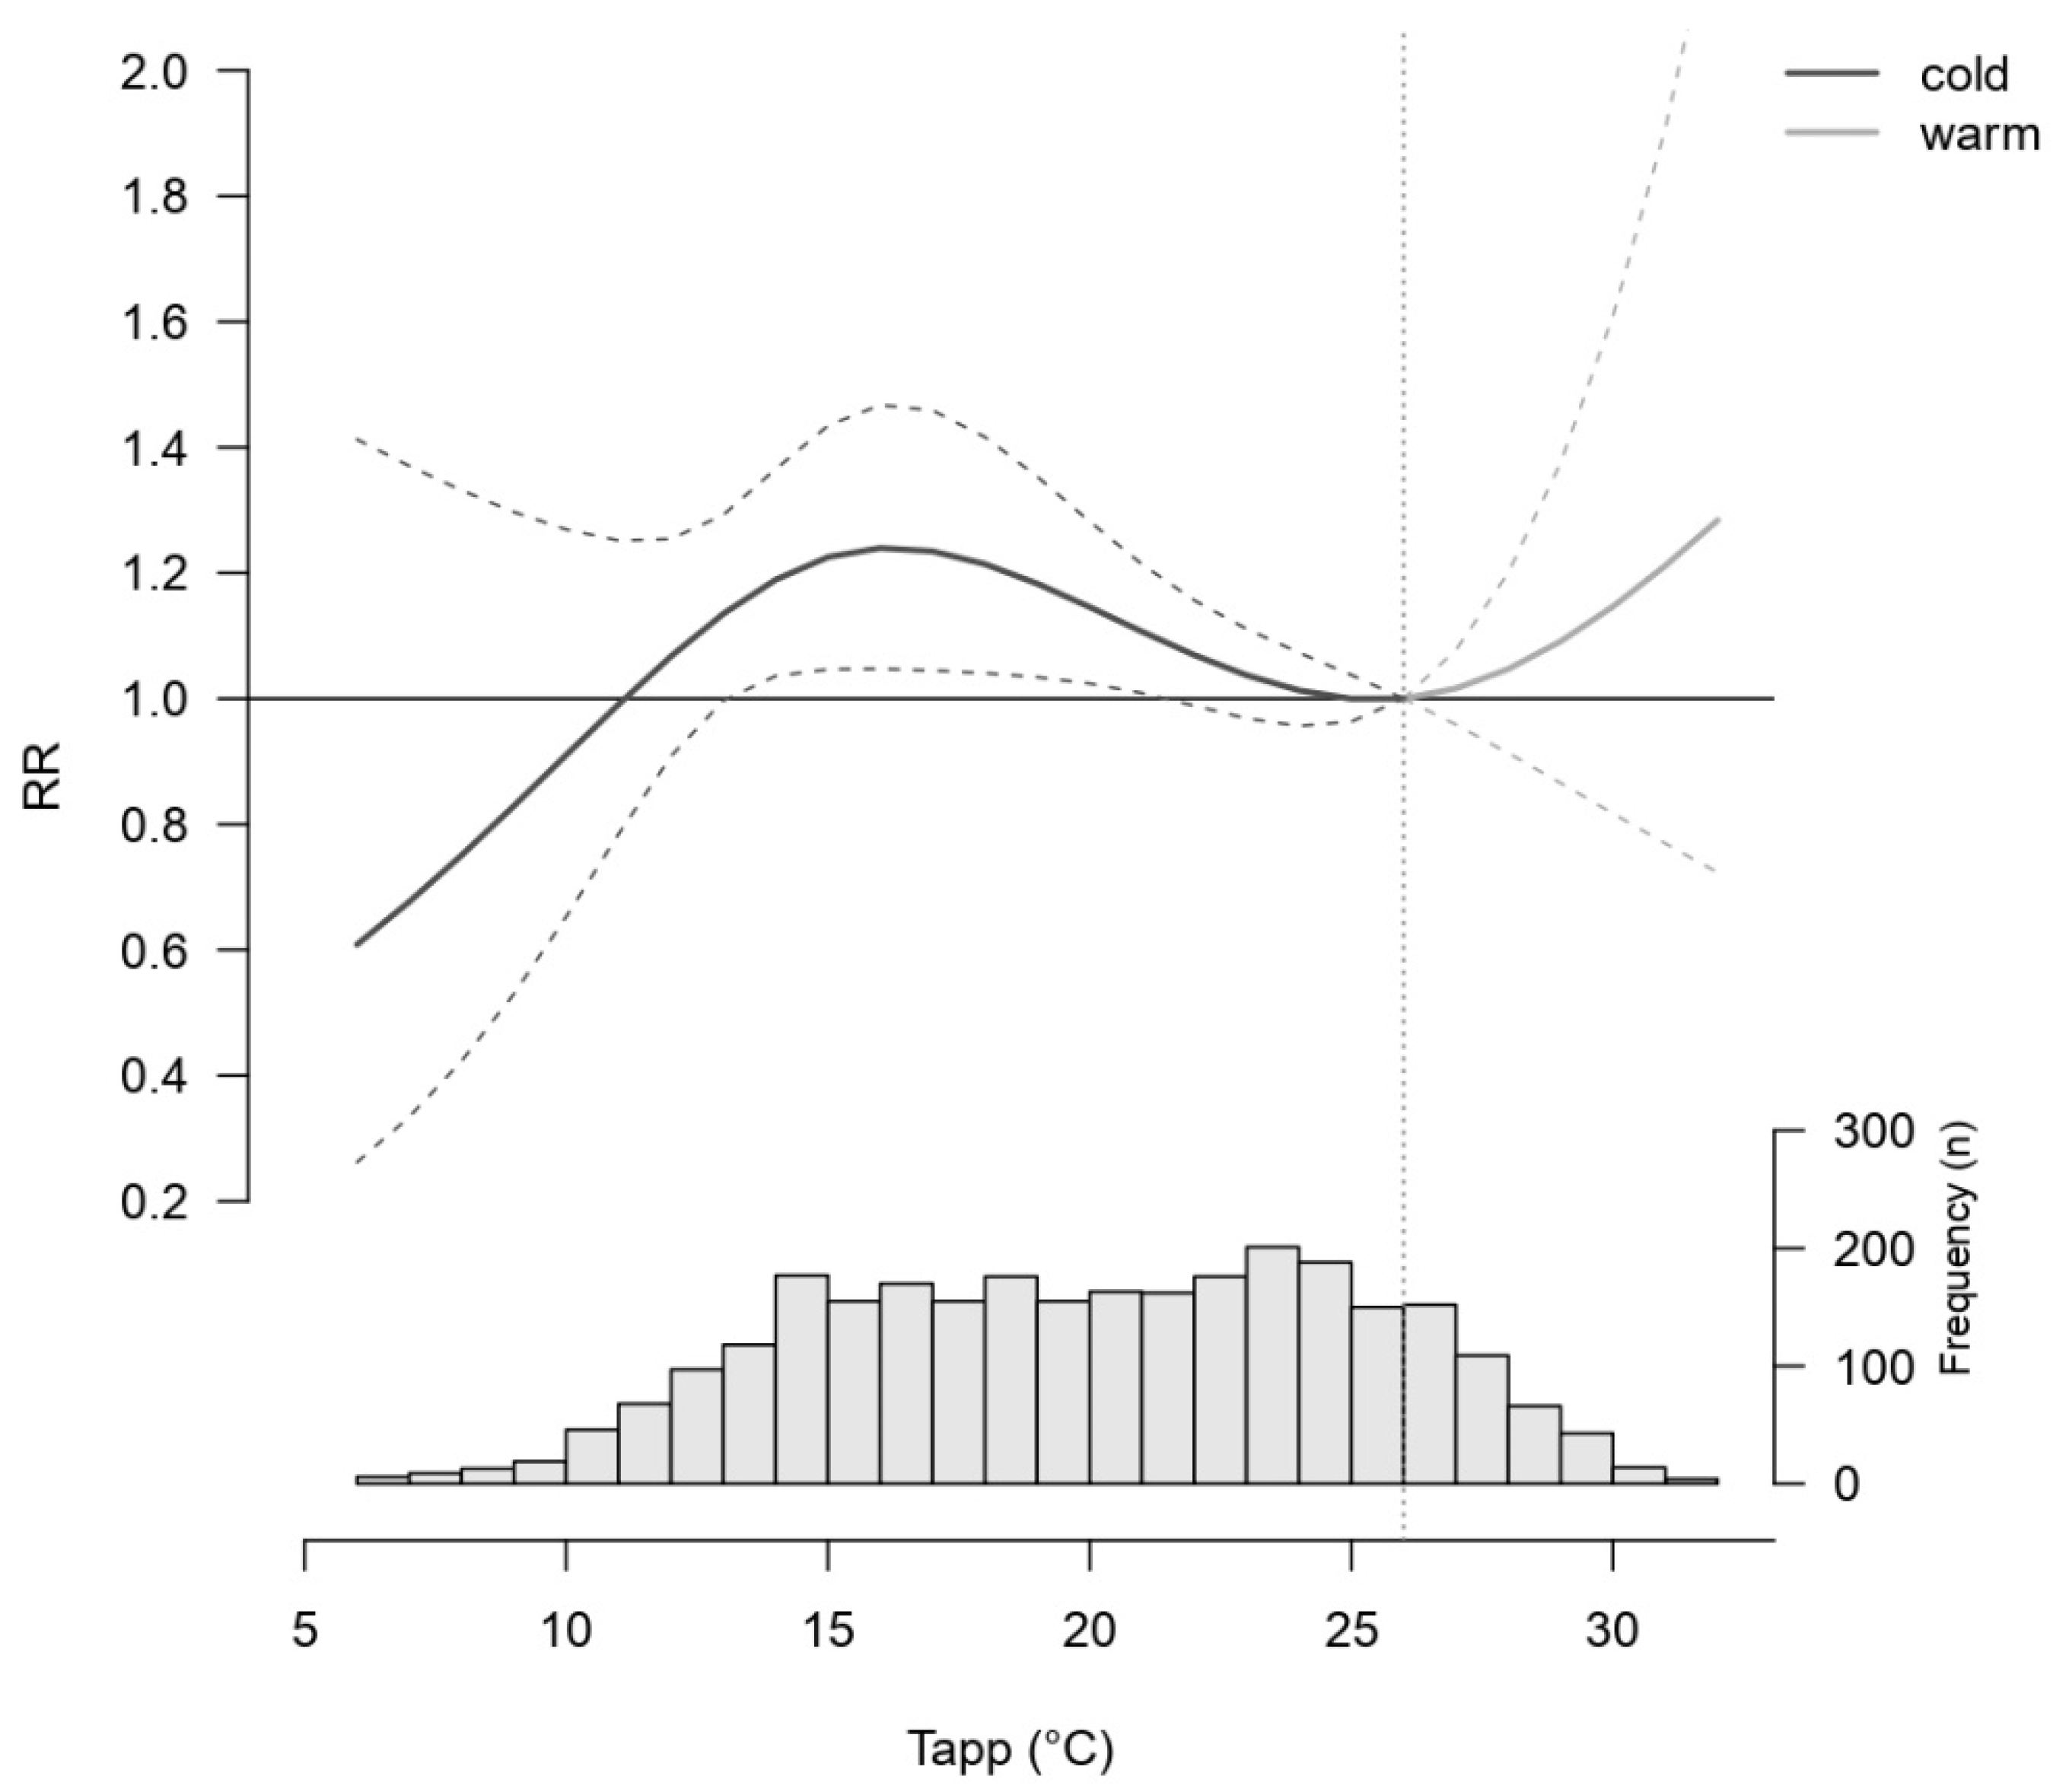
Figure 4 shows the effect of Tapp on the risk of CVD admissions cumulated over 21 lag days. The optimal Tapp is identified at 26 °C (corresponding to the 83rd percentile of Tapp distribution) and is used as the reference value against which the risk for other Tapp is compared.
The histogram shows that most days have a Tapp below the optimal Tapp of 26 °C. The cumulative curve displays that the risk for CVD admissions increases steadily from 27 °C–32 °C, with 32 °C showing a 33% (95% CI: 0.75, 2.36) increased risk for a CVD admission compared to 26 °C. However, wide 95% CIs reveal the uncertainty of those findings.
Cold Tapp from 12 °C–24 °C showed an increased risk in CVD admissions relative to 26 °C, with an increase between 14 °C–21 °C (Figure 4). The cold Tapp with the highest risk for CVD admissions was 16 °C, which showed a 25% (95% CI: 1.05, 1.48) higher risk for CVD admissions cumulated over 21 days compared to 26 °C. On the other hand, cold Tapp between 6 °C–11 °C seemed to be protective towards CVD admissions accumulated over 21 days, relative to 26 °C. However, the 95% CIs were wide in this Tapp range due to fewer data points, rendering these particular findings non-significant.
The cumulative graph in Figure 4 also shows that RRs for 25 °C and 26 °C were approximately one, which indicates a ‘comfort zone’, rather than one optimal Tapp (see extracted RRs and 95% CIs in Table S2). The lag-response structure analysis was conducted for 9 °C, 16 °C, 28 °C and 30 °C relative to the optimal Tapp of 26 °C (Figure 5).
We observed a reduced risk for CVD admissions at 9 °C after five lag days, however there were few days with this temperature. At 16 °C, 28 °C and 30 °C, there was an immediate peak in the risk for CVD admissions at lag zero. The risk for CVD admissions is the highest for 16 °C, with a significant 23% (95% CI:1.04,1.44) increased risk for CVD admissions compared to 26 °C at lag zero. The increase in risk of 28 °C and 30 °C lasted for two and four days relative to the effect of 26 °C, respectively (see Tables S3 and S4 for the extracted RRs and 95% CIs).
Our sensitivity analyses, presented in the Supplementary Material, changing knot placements, lag durations and regression models showed that our final model was insensitive to these changes. Further detailed summary of the chosen model is presented in Table S5.
Table 1 shows the AF for CVD admissions attributable to non-optimal Tapp during the study period. 9.5% (95% CI: 3.4%, 15.7%) of the CVD admissions to the two hospitals in Limpopo were attributable to non-optimal Tapp (Table 1). Cold Tapp account for most of the total CVD admissions with an 8.5% (95% CI: 3.1%, 13.7%) AF, whereas warm Tapp account for 1.16% (95% CI: -1.43%, 3.51%) of the total CVD admissions.

4. Discussion

We found an association between Tapp and the share of hospital admissions due to CVDs at both warm and cold non-optimal temperatures. Warm (i.e., 27 °C to 32 °C) as well as cold Tapp (i.e., 12 °C to 24 °C) had the potential to increase the share of CVD hospital admissions cumulated over 21 days, with cold temperatures being responsible for the biggest fraction of CVD admissions. The effect of warm Tapp was found to be immediate and short-lived for around two to four days after exposure. Cold Tapp between 14 °C and 25 °C showed an immediate but long-lasting (5 to 9 days) increased risk while very cold Tapp between 6 °C and 9 °C showed a delayed (one day) and short-lived (2 days) increased risk for CVD admissions. The seemingly ‘protective’ effect seen at very cold temperatures after the short period of increased risk could potentially be attributable to the harvesting effect, where increased risk of CVD admissions for the most vulnerable population is brought forward in time [52,53]. The initial increased risk of CVD admissions could be attributed to findings that performing physical activity during cold temperatures has been shown to trigger angina pectoris and myocardial infarction and cold temperatures have been found to lead to thrombosis [54]. However, given the wide CI intervals and less days with very cold temperatures, this could also be a statistical artefact. Therefore, more studies are needed from this region to elaborate the findings.
We found a longer lasting cold effect of around 5 to 9 days for Tapps between 14 °C and 25 °C was found, which is in accordance with other studies on this topic [55]. Cold temperatures in South Africa have been shown to be responsible for 3.0% of the national mortality proportion and warm temperatures for only 0.4% [21]. Hence, if other diseases are exacerbated by cold temperatures, hospitals might easily be overburdened and can no longer admit patients. This situation could be further complicated by the fact that Limpopo province is one of the provinces with the least established healthcare infrastructure in South Africa [56]. The immediate and short lived effect of warm Tapp on the risk of CVD hospital admissions found in this study was also observed in other studies conducted in the United States [54], Vietnam [57], Australia [58] and Denmark [59].
In terms of CVD morbidity, our study suggests that the optimal temperature is in the range of 25 °C to 26 °C. The AF from cold Tapp was found to be responsible for the biggest fraction of the total CVD admissions. This is in accordance with findings of other studies, where cold temperatures were responsible for most of the temperature-related CVD morbidity [60,61,62]. The cold effect might be of greater magnitude compared to the warm effect because housing and lifestyle in a usually warm climate does not adequately protect against cold temperatures. A significant proportion of residents in Mopani district live in poverty and would therefore lack the resources such as electric or gas heaters to protect themselves from cold weather and the associated health impacts on CVDs [56,63,64].
Our study had several strengths. First, we investigated the association between Tapp and CVD mortality over a long time period and few missing data points, while accounting for environmental confounders such as humidity in the model. Second, the sophisticated modelling approach allowed us to flexibly examine this association by considering both temperature and lag duration at the same time. Third, we were able to demonstrate the burden of both cold and hot non-optimal temperatures, which, to our knowledge, was hitherto not investigated in this region.
This study considered several limitations. Data quality of hospital admission records was inconsistent due to handwritten data reporting systems, leading to potential missing information. To counter this, we modelled the proportion of admissions due to CVDs rather than their absolute number. There is a chance of non-differential outcome misclassification since the CVD data were only classified by a physician’s first clinical assessment upon admission and not medically confirmed. The prevalence of CVDs might be underestimated because the hospital admission records only captured hospitalized CVD cases, thus discounting cases that did not need hospitalization or sought traditional healers. Imputing missing data might have introduced non-differential exposure misclassification. However, sensitivity analysis showed the methods to be robust and the conclusions drawn from the findings to be unaffected. The daily exposure to Tapp was assumed to be the same for everyone in Limpopo. Potential confounders such as age, sex, socioeconomic status or different types of CVDs, which have been shown to respond differently to temperature, could not be taken into consideration [65]. There may have been some patients who passed away before arriving at the hospital and this would contribute to a possible underestimation. Private hospitals were not considered in this study, potentially excluding a proportion of higher socio-economic status individuals assuming they are more often treated in private hospitals, where access is dependent on affordability [66]. Nevertheless, this concerns a small proportion of the population of the country since the private sector serves only 16% of the entire population of South Africa [66].
To strengthen the findings of this study on the associations between Tapp and CVD morbidity in Limpopo, further research should gather additional variables to identify the most vulnerable groups, based on factors such as age, sex, type of CVD and socio-economic status. Such studies are important for surveillance systems of population health and for health-care planning. Factors such as gender differences play a major role in the association between temperature and CVDs, especially in conjunction with age. Men and women have different physiological and thermoregulatory responses following heat and cold exposure, with men generally being able to tolerate heat better and females being more vulnerable to heat [67,68,69,70]. The information would better inform interventions, e.g., to develop early warning systems of the effects of cold and heat to prepare health professionals and the communities to encourage them to take precautions based on their predisposed vulnerabilities. There is a need to improve surveillance systems to track diseases like CVD and especially those likely to be influenced by climate change. Hospital admissions data collection systems should be digitized, and physicians and hospital staff should be trained to record patient details and diagnosis in a uniform manner. Such systems will not only benefit tracking within the healthcare systems but will also be invaluable for research purposes to generate evidence for decision and policy making.

5. Conclusions

In this study, the non-linear association between Tapp and the relative frequency of CVD admissions in Limpopo province of South Africa was characterised. We demonstrated that both cold and hot non-optimal Tapp is associated with an increase in the risk of CVD morbidity, with cold non-optimal Tapp attributable to a larger fraction of cases. The warm effect was immediate and short lived while the cold effect had a delayed presentation and lasted longer. Our study provides a more nuanced glimpse into the temperature attributable CVD issues facing Limpopo in the coming decades in light of climate change.

Supplementary Materials

The following supporting information can be downloaded at: https://www.mdpi.com/article/10.3390/ijerph20010116/s1, Table S1: Definitive list of cardiovascular diseases considered in this study from two public hospitals in Limpopo, South Africa; Table S2: Knot placement at different apparent temperatures (Tapp) and the corresponding Akaike Information Criteria (AIC) for the negative binomial regression model and distributed lag non-linear model; Table S3: The relative risk (RR) of apparent temperature (Tapp) on cardiovascular disease hospital admissions cumulated over 21 days of lag, relative to 26 °C in Limpopo, South Africa (N = 3124). The upper (u95) and lower (l95) bound of the 95% confidence intervals are presented. The frequency (Freq.) of each Tapp occurring throughout the study period from 1 June 2009 until 31 December 2016 in Limpopo is shown; Table S4: The relative risk (RR) of cardiovascular disease hospital admissions in Limpopo, South Africa, by lag days at specific apparent temperatures (N = 3124). The tables show the upper (u95) and lower (l95) bounds of the 95% confidence interval. The RRs are relative to 26 °C; Table S5: Model coefficients, standard errors (SE) and p-values for the negative binomial regression model (N = 3124). v1, v2 and v3 correspond to the gradient of the exposure- response association in the first, second and third interval of a spline, respectively. “l1” corresponds to the gradient of the lagged association in the first interval of a spline, “l2” to that in the second interval, and so on. The coefficients for the adjustment of days of the week, long term trends and total admissions are also represented; Figure S1: A descriptive overview of the distribution of daily total (N = 57,619) and cardiovascular disease (CVD) (N = 4368) hospital admission counts from 1 January 2002 until 31 December 2016 from two public hospitals in Limpopo, South Africa; Figure S2: The relative risk (RR) of cardiovascular disease hospital admissions by apparent temperature (Tapp) cumulated over 21 days of lag, relative to 26 °C (N = 3124) in Limpopo, South Africa. The black and grey thick lines represent the RR using a negative binomial regression model and a quasi-poisson regression model, respectively. The dotted lines represent the 95% confidence intervals and the grey vertical dotted line marks the optimum Tapp at 26 °C. The histogram at the bottom shows the frequency of each Tapp occurring in Limpopo between 1 June 2009 and 31 December 2016; Figure S3: The relative risk (RR) of cardiovascular disease (CVD) hospital admissions by apparent temperature (Tapp) cumulated over different lag periods, relative to 26 °C in Limpopo, South Africa (N = 3124). The black and grey thick lines show the effect of apparent temperature (Tapp) on CVD hospital admissions cumulated over 21 and 10 days of lag, respectively. The dotted lines represent the 95% confidence intervals and the grey vertical dotted line marks the optimum Tapp at 26 °C. The histogram at the bottom shows the frequency of each Tapp occurring in Limpopo between 1 June 2009 and 31 December 2016; Figure S4: The relative risk (RR) of cardiovascular disease hospital admissions by apparent temperature (Tapp) cumulated over 21 days of lag, relative to 26 °C in Limpopo, South Africa. The black and grey thick lines represent the RR using the imputed dataset (N = 3124) and raw dataset (N = 2371), respectively. The dotted lines represent the 95% confidence intervals and the grey vertical dotted line marks the optimum Tapp at 26 °C. The histogram at the bottom shows the frequency of each Tapp occurring in Limpopo between 1 June 2009 and 31 December 2016; Figure S5: The relative risk (RR) of cardiovascular disease hospital admissions by apparent temperature (Tapp) cumulated over 21 days of lag, relative to 26 °C in Limpopo, South Africa. The black and grey thick lines represent the RR using data from 1 June 2009 until 31 December 2016 (N = 3124) and non-imputed data from 1.January 2002 until 31.December 2016 (N = 2642), respectively. The dotted lines represent the 95% confidence intervals and the grey vertical dotted line marks the optimum Tapp at 26 °C. The histogram at the bottom shows the frequency of each Tapp occurring in Limpopo between 1 January 2002 and 31 December 2016.

Author Contributions

Conceptualization: G.C., C.Y.W., S.S., T.K., Z.K., A.M. and N.P.; Data curation: C.Y.W.; Formal analysis: J.L.B., H.P., M.K., S.S. and T.K.; Funding acquisition: G.C. and C.Y.W.; Investigation: J.L.B.; Methodology: J.L.B., M.K., H.P., S.S., T.K. and Z.K.; Project administration: G.C.; Supervision: G.C., Y.L. and C.Y.W.; Writing—original draft: J.L.B., S.S. and C.Y.W.; Writing—review & editing: All authors. All authors have read and agreed to the published version of the manuscript.

Funding

S.S. was funded by the European Union’s Horizon 2020 research and innovation programme under the Marie Skłodowska-Curie grant agreement No 801076. Permission to obtain the hospital admissions data for the study was granted by the Limpopo Department of Health (REF 4/2/2) and the management staff of Nkhensani Hospital and Maphutha L. Malatjie Hospital. The South African Medical Research Council Research Ethics Committee approved the study protocol (EC005-3/2014).

Institutional Review Board Statement

The South African Medical Research Council Ethics Committee approved the study (EC005-3/2014).

Informed Consent Statement

Informed consent was obtained from the Provincial Department of Health and Hospital Management. Patient consent was waivered since data provided to the research leader were anonymised.

Data Availability Statement

Weather data can be obtained from the South African Weather Service and the codes used in this study are available upon request from the authors.

Acknowledgments

We would like to thank Smakaleng F Monyai and Daniel Kipo for their help with the formatting the manuscript.

Conflicts of Interest

The authors declare no conflict of interest.

References

  1. WHO. Cardiovascular Diseases Factsheet. 2021. Available online: https://www.who.int/en/news-room/fact-sheets/detail/cardiovascular-diseases-(cvds) (accessed on 17 March 2022).
  2. Papageorgiou, N. Cardiovascular Diseases-Genetic Susceptibility, Environmental Factors and their Interaction; Academic Press: Cambridge, MA, USA, 2016. [Google Scholar]
  3. De Blois, J.; Kjellstrom, T.; Agewall, S.; Ezekowitz, J.A.; Armstrong, P.W.; Atar, D. The Effects of Climate Change on Cardiac Health. Cardiology 2015, 131, 209–217. [Google Scholar] [CrossRef] [PubMed]
  4. Cissé, G.; McLeman, R.; Adams, H.; Aldunce, P.; Bowen, K.; Campbell-Lendrum, D.; Clayton, S.; Ebi, K.L.; Hess, C.H.; Liu, Q.; et al. Health, wellbeing, and the changing structure of communities. In Climate Change 2022: Impacts, Adaptation, and Vulnerability. Contribution of Working Group II to the Sixth Assessment Report of the Intergovernmental Panel on Climate Change; Pörtner, H.-O., Tignor, M., Poloczanska, E.S., Mintenbeck, K., Alegría, A., Craig, M., Langsdorf, S., Löschke, S., Möller, V., Okem, A., et al., Eds.; Cambridge University Press: Cambridge, UK; New York, NY, USA, 2022; pp. 1041–1170. [Google Scholar] [CrossRef]
  5. Vicedo-Cabrera, A.M.; Scovronick, N.; Sera, F.; Royé, D.; Schneider, R.; Tobias, A.; Astrom, C.; Guo, Y.; Honda, Y.; Hondula, D.M.; et al. The burden of heat-related mortality attributable to recent human-induced climate change. Nat. Clim. Chang. 2021, 11, 492–500. [Google Scholar] [CrossRef] [PubMed]
  6. Zhao, Q.; Guo, Y.; Ye, T.; Gasparrini, A.; Tong, S.; Overcenco, A.; Urban, A.; Schneider, A.; Entezari, A.; Vicedo-Cabrera, A.M.; et al. Global, regional, and national burden of mortality associated with non-optimal ambient temperatures from 2000 to 2019: A three-stage modelling study. Lancet Planet. Health 2021, 5, e415–e425. [Google Scholar] [CrossRef] [PubMed]
  7. Gasparrini, A.; Guo, Y.; Hashizume, M.; Lavigne, E.; Zanobetti, A.; Schwartz, J.; Tobias, A.; Tong, S.; Rocklöc, J.; Forsberg, B.; et al. Mortality risk attributable to high and low ambient temperature: A multicountry observational study. Lancet 2015, 386, 369–375. [Google Scholar] [CrossRef]
  8. Zafeiratou, S.; Samoli, E.; Dimakopoulou, K.; Rodpoulou, S.; Abalitis, A.; Gasparrini, A.; Stafoggia, M.; De’ Donato, D.; Rao, S.; Monteiro, A. A systematic review on the association between total and cardiopulmonary mortality/morbidity or cardiovascular risk factors with long-term exposure to increased or decreased ambient temperature. Sci. Total. Environ. 2021, 772, 145383. [Google Scholar] [CrossRef]
  9. Tobias, A.; Hashizume, M.; Honda, Y.; Sera, F.; Ng, C.F.S.; Kim, Y.; Royce, D.; Chung, Y.; Dang, T.N.; Kim, H.; et al. Geographical variations of the minimum mortality temperature at a global scale: A multicountry study. Environ. Epidemiol. 2021, 5, e169. [Google Scholar] [CrossRef]
  10. Liu, C.; Yavar, Z.; Sun, Q. Cardiovascular response to thermoregulatory challenges. Am. J. Physiol. Heart Circ. Physiol. 2015, 309, H1793–H1812. [Google Scholar] [CrossRef] [Green Version]
  11. Sokolnicki, L.A.; Strom, N.A.; Roberts, E.K.; Kingsley-Berg, S.A.; Basu, A.; Charloudian, N. Skin blood flow and nitric oxide during body heating in type 2 diabetes mellitus. J. Appl. Physiol. 2009, 106, 566–570. [Google Scholar] [CrossRef] [Green Version]
  12. Ikäheimo, T.M. Cardiovascular diseases, cold exposure and exercise. Temperature 2018, 5, 123–146. [Google Scholar] [CrossRef]
  13. Keatinge, W.; Coleshaw, S.R.; Cotter, F.; Murphy, M.; Chelliah, R. Increases in platelet and red cell counts, blood viscosity, and arterial pressure during mild surface cooling: Factors in mortality from coronary and cerebral thrombosis in winter. BMJ 1984, 289, 1405–1408. [Google Scholar] [CrossRef] [Green Version]
  14. Shattock, M.J.; Tipton, M.J. ‘Autonomic conflict’: A different way to die during cold water immersion? J. Physiol. 2012, 590, 3219–3230. [Google Scholar] [CrossRef] [PubMed]
  15. Madaniyazi, L.; Armstrong, B.; Chung, Y.; Ng, C.F.S.; Seposo, X.; Kim, Y.; Tobias, A.; Guo, Y.; Sera, F.; Honda, Y.; et al. Seasonal variation in mortality and the role of temperature: A multi-country multi-city study. Int. J. Epidemiol. 2022, 51, 122–133. [Google Scholar] [CrossRef] [PubMed]
  16. Ye, X.; Wolff, R.; Yu, W.; Vaneckova, P.; Pan, X.; Tong, S. Ambient Temperature and Morbidity: A Review of Epidemiological Evidence. Environ. Health Perspect. 2012, 120, 19–28. [Google Scholar] [CrossRef] [PubMed] [Green Version]
  17. Agarwal, S.; Qin, Y.; Shi, L.; Wei, G.; Zhu, H. Impact of temperature on morbidity: New evidence from China. J. Environ. Econ. Manag. 2021, 109, 102495. [Google Scholar] [CrossRef]
  18. Turner, L.R.; Barnett, A.G.; Connell, D.; Tong, S. Ambient temperature and cardiorespiratory morbidity: A systematic review and meta-analysis. Epidemiology 2012, 23, 594–606. [Google Scholar] [CrossRef] [PubMed] [Green Version]
  19. Yu, W.; Hu, W.; Megnersen, K.; Guo, Y.; Pan, X.; Connell, D.; Tong, S. Time course of temperature effects on cardiovascular mortality in Brisbane, Australia. Heart 2011, 97, 1089–1093. [Google Scholar] [CrossRef] [Green Version]
  20. Guo, Y.; Gasparrini, A.; Li, S.; Sera, F.; Vicedo-Cabrera, A.M.; de Sousa, M.; Coelho, Z.S.; Saldiva, P.H.N.; Lavigne, E.; Tawatsupa, B.; et al. Quantifying excess deaths related to heatwaves under climate change scenarios: A multicountry time series modelling study. PLoS Med. 2018, 15, e1002629. [Google Scholar] [CrossRef]
  21. Scovronick, N.; Sera, F.; Acquaotta, F.; Garzena, D.; Fratianni, S.; Wright, C.Y.; Gasparrini, A. The association between ambient temperature and mortality in South Africa: A time-series analysis. Environ. Res. 2018, 161, 229–235. [Google Scholar] [CrossRef]
  22. Phung, D.; Guo, Y.; Thai, P.; Rutherford, S.; Wang, X.; Nguyen, M.; Manh Do, C.; Nguyen, N.H.; Alam, N.; Chu, C. The effects of high temperature on cardiovascular admissions in the most populous tropical city in Vietnam. Environ. Pollut. 2016, 208, 33–39. [Google Scholar] [CrossRef]
  23. Yang, J.; Yin, P.; Zhou, M.; Ou, C.-Q.; Guo, Y.; Gasparrini, A.; Liu, Y.; Yue, Y.; Gu, S.; Sang, S.; et al. Cardiovascular mortality risk attributable to ambient temperature in China. Heart 2015, 101, 1966–1972. [Google Scholar] [CrossRef]
  24. Rogelj, J.; Shindell, D.; Jiang, K.; Fifita, S.; Forster, P.; Ginzburg, V.; Handa, C.; Kheshgi, H.; Kobayashi, S.; Kriegler, E.; et al. Mitigation Pathways Compatible with 1.5 °C in the Context of Sustainable Development. In Global Warming of 1.5 °C. An IPCC Special Report on the Impacts of Global Warming of 1.5 °C Above Pre-Industrial Levels and Related Global Greenhouse Gas Emission Pathways, in the Context of Strengthening the Global Response to the Threat of Climate Change, Sustainable Development, and Efforts to Eradicate Poverty; Masson-Delmotte, V., Zhai, P., Pörtner, H.-O., Roberts, D., Skea, J., Shukla, P.R., Pirani, A., Moufouma-Okia, W., Péan, C., Pidcock, R., et al., Eds.; IPCC: Geneva, Switzerland, 2018. [Google Scholar]
  25. Global Burden of Disease 2019 Risk Factors Collaborators. Global burden of 87 risk factors in 204 countries and territories, 1990–2019: A systematic analysis for the Global Burden of Disease Study 2019. Lancet 2020, 396, 1223–1249. [Google Scholar] [CrossRef] [PubMed]
  26. Wang, Y.R.; Dong, J.-Y.; Yang, R.-Q.; Li, N. Air Temperature Affects the Hospital Admission for Cardiovascular Diseases among Rural Residents in Dingxi City. Zhongguo Yi Xue Ke Xue Yuan Xue Bao 2022, 44, 188–198. [Google Scholar] [CrossRef] [PubMed]
  27. Bowry, A.D.; Lewey, J.; Dugani, S.B.; Choudhry, N.K. The burden of cardiovascular disease in low- and middle-income countries: Epidemiology and management. Can. J. Cardiol. 2015, 31, 1151–1159. [Google Scholar] [CrossRef] [PubMed]
  28. Malekzadeh, A.; Michels, K.; Wolfman, C.; Anand, N.; Sturke, R. Strengthening research capacity in LMICs to address the global NCD burden. Glob. Health Action 2020, 13, 1846904. [Google Scholar] [CrossRef] [PubMed]
  29. Odame, E.A.; Li, Y.; Zheng, S.; Vaidyanathan, A.; Silver, K. Assessing Heat-Related Mortality Risks among Rural Populations: A Systematic Review and Meta-Analysis of Epidemiological Evidence. Int. J. Environ. Res. Public Health 2018, 15, 1597. [Google Scholar] [CrossRef] [Green Version]
  30. Sui, X.; Zhang, J.; Zhang, Q.; Sun, S.; Lei, R.; Zhang, C.; Cheng, H.; Ding, L.; Ding, R.; Xiao, C.; et al. The short-term effect of PM2.5/O3 on daily mortality from 2013 to 2018 in Hefei, China. Environ. Geochem. Health 2021, 43, 153–169. [Google Scholar] [CrossRef]
  31. Lokotola, C.L.; Wright, C.Y.; Wichmann, J. Temperature as a modifier of the effects of air pollution on cardiovascular disease hospital admissions in Cape Town, South Africa. Environ. Sci. Pollut. Res. 2020, 27, 16677–16685. [Google Scholar] [CrossRef]
  32. Shirinde, J.; Wichmann, J. Temperature modifies the association between air pollution and respiratory disease mortality in Cape Town, South Africa. Int. J. Environ. Health Res. 2022, 1–10. [Google Scholar] [CrossRef]
  33. IHME. South Africa Country Profile. 2019. Available online: https://www.healthdata.org/south-africa (accessed on 10 June 2022).
  34. Lyon, B. Southern Africa Summer Drought and Heat Waves: Observations and Coupled Model Behavior. J. Clim. 2009, 22, 6033–6046. [Google Scholar] [CrossRef]
  35. Burger, R.; Christian, C. Access to health care in post-apartheid South Africa: Availability, affordability, acceptability. Health Econ. Policy Law 2018, 15, 43–55. [Google Scholar] [CrossRef] [Green Version]
  36. Ntuli, S.T.; Maimela, E.; Alberts, M.; Choma, S.; Dikotope, S. Prevalence and associated risk factors of hypertension amongst adults in a rural community of Limpopo Province, South Africa. Afr. J. Prim. Health Care Fam. Med. 2015, 7, 5. [Google Scholar] [CrossRef] [PubMed] [Green Version]
  37. Shirinde, J.; Wichmann, J.; Voyi, K. Association between wheeze and selected air pollution sources in an air pollution priority area in South Africa: A cross-sectional study. Environ. Health 2014, 13, 32. [Google Scholar] [CrossRef] [PubMed] [Green Version]
  38. Engelbrecht, F.; Adegoke, J.; Bopape, M.-J.M.; Naidoo, M.; Garland, R.; Thatcher, M.; McGregor, J.; Katzfey, J.; Werner, M.; Ichoku, C. Projections of rapidly rising surface temperatures over Africa under low mitigation. Environ. Res. Lett. 2015, 10, 085004. [Google Scholar] [CrossRef] [Green Version]
  39. Garland, R.M.; Matooane, M.; Engelbrecht, F.A.; Bopape, M.-J.M.; Landman, W.A.; Naidoo, M.; Van der Merwe, J.; Wright, C.Y. Regional Projections of Extreme Apparent Temperature Days in Africa and the Related Potential Risk to Human Health. Int. J. Environ. Res. Public Health 2015, 12, 12577–12604. [Google Scholar] [CrossRef] [Green Version]
  40. Department of Cooperative Governance & Traditional Affairs. Mopani District Municipality Profile and Analysis. 2021. Available online: https://www.cogta.gov.za/ddm/wp-content/uploads/2020/11/Mopani-October-2020.pdf (accessed on 15 July 2022).
  41. Mbokodo, I.; Bopape, M.-J.; Chikoore, H.; Engelbrecht, F.; Nethengwe, N. Heatwaves in the Future Warmer Climate of South Africa. Atmosphere 2020, 11, 712. [Google Scholar] [CrossRef]
  42. Kruger, A.C.; Sekele, S.S. Trends in extreme temperature indices in South Africa: 1962-2009. Int. J. Clim. 2013, 33, 661–676. [Google Scholar] [CrossRef]
  43. Ikeda, T.; Kapwata, T.; Behera, S.K.; Manakwa, N.; Hashizume, M.; Sweijd, N.; Mathee, A.; Wright, C.Y. Climatic Factors in Relation to Diarrhoea Hospital Admissions in Rural Limpopo, South Africa. Atmosphere 2019, 10, 522. [Google Scholar] [CrossRef] [Green Version]
  44. Pedder, H.; Kapwata, T.; Howard, G.; Naidoo, R.N.; Kunene, Z.; Morris, R.W.; Mathee, A.; Wright, C.Y. Lagged Association between Climate Variables and Hospital Admissions for Pneumonia in South Africa. Int. J. Environ. Res. Public Health 2021, 18, 6191. [Google Scholar] [CrossRef]
  45. Kapwata, T.; Wright, C.Y.; du Preez, D.J.; Kunene, Z.; Mathee, A.; Ikeda, T.; Landman, W.; Maharaj, R.; Sweijd, N.; Minakawa, N.; et al. Exploring rural hospital admissions for diarrhoeal disease, malaria, pneumonia, and asthma in relation to temperature, rainfall and air pollution using wavelet transform analysis. Sci. Total. Environ. 2021, 791, 148307. [Google Scholar] [CrossRef]
  46. Steadman, R. Norms of Apparent Temperature in Australia; Australian Meteorological Magazine, 1994; Volume 43, pp. 1–16. Available online: http://www.bom.gov.au/jshess/docs/1994/steadman.pdf (accessed on 2 December 2022).
  47. Cabrera, A.M.V.; Sera, F.; Gasparrini, A. Hands-on Tutorial on a Modeling Framework for Projections of Climate Change Impacts on Health. Epidemiology 2019, 30, 321–329. [Google Scholar] [CrossRef] [Green Version]
  48. Guo, Y.; Barnett, A.G.; Pan, X.; Yu, W.; Tong, S. The Impact of Temperature on Mortality in Tianjin, China: A Case-Crossover Design with a Distributed Lag Nonlinear Model. Environ. Health Perspect. 2011, 119, 1719–1725. [Google Scholar] [CrossRef] [PubMed] [Green Version]
  49. Bhaskaran, K.; Gasparrini, A.; Hajat, S.; Smeeth, L.; Armstrong, B. Time series regression studies in environmental epidemiology. Int. J. Epidemiol. 2013, 42, 1187–1195. [Google Scholar] [CrossRef] [PubMed]
  50. Honda, Y.; Kondo, M.; McGregor, G.; Kim, H.; Hijioka, Y.; Yoshikawa, M.; Oka, K.; Takano, S.; Hales, S.; Kovats, R.S. Heat-related mortality risk model for climate change impact projection. Environ. Health Prev. Med. 2014, 19, 56–63. [Google Scholar] [CrossRef] [PubMed]
  51. Gasparrini, A.; Leone, M. Attributable risk from distributed lag models. BMC Med. Res. Methodol. 2014, 14, 55. [Google Scholar] [CrossRef] [PubMed] [Green Version]
  52. Hajat, S.; Armstrong, B.G.; Gouveia, N.; Wilkson, P. Mortality displacement of heat-related deaths: A comparison of Delhi, Sao Paulo, and London. Epidemiology 2005, 16, 613–620. [Google Scholar] [CrossRef] [PubMed]
  53. Qiao, Z.; Guo, Y.; Yu, W.; Tong, S. Assessment of Short- and Long-Term Mortality Displacement in Heat-Related Deaths in Brisbane, Australia, 1996–2004. Environ. Health Perspect. 2015, 123, 766–772. [Google Scholar] [CrossRef] [Green Version]
  54. Schwartz, J.; Samet, J.M.; Patz, J.A. Hospital admissions for heart disease: The effects of temperature and humidity. Epidemiology 2004, 15, 755–761. [Google Scholar] [CrossRef]
  55. Mohammadi, D.; Zadeh, M.Z.; Sakhvidi, M.J.Z. Short-term exposure to extreme temperature and risk of hospital admission due to cardiovascular diseases. Int. J. Environ. Health Res. 2021, 31, 344–354. [Google Scholar] [CrossRef]
  56. Stuckler, D.; Basu, S.; McKee, M. Health care capacity and allocations among South Africa’s provinces: Infrastructure-inequality traps after the end of apartheid. Am. J. Public Health 2011, 101, 165–172. [Google Scholar] [CrossRef]
  57. Giang, P.N.; Dung, D.V.; Giang, K.B.; Vinhc, H.V.; Rocklöv, J. The effect of temperature on cardiovascular disease hospital admissions among elderly people in Thai Nguyen Province, Vietnam. Glob. Health Action 2014, 7, 23649. [Google Scholar] [CrossRef] [Green Version]
  58. Vaneckova, P.; Bambrick, H. Cause-Specific Hospital Admissions on Hot Days in Sydney, Australia. PLoS ONE 2013, 8, e55459. [Google Scholar] [CrossRef] [PubMed] [Green Version]
  59. Wichmann, J.; Andersen, A.; Ketzel, M.; Ellermann, T.; Loft, S. Apparent Temperature and Cause-Specific Emergency Hospital Admissions in Greater Copenhagen, Denmark. PLoS ONE 2011, 6, e22904. [Google Scholar] [CrossRef] [PubMed] [Green Version]
  60. Tian, L.; Qui, H.; Sun, S.; Lin, H. Emergency Cardiovascular Hospitalization Risk Attributable to Cold Temperatures in Hong Kong. Circ. Cardiovasc. Qual. Outcomes 2016, 9, 135–142. [Google Scholar] [CrossRef] [PubMed]
  61. Urban, A.; Davídkovová, H.; Kyselý, J. Heat- and cold-stress effects on cardiovascular mortality and morbidity among urban and rural populations in the Czech Republic. Int. J. Biometeorol. 2014, 58, 1057–1068. [Google Scholar] [CrossRef] [PubMed]
  62. Stewart, S.; Keates, A.K.; Redfern, A.; McMurray, J.J.V. Seasonal variations in cardiovascular disease. Nat. Rev. Cardiol. 2017, 14, 654–664. [Google Scholar] [CrossRef]
  63. Rosengren, A.; Smyth, A.; Rangarajan, S.; Ramasundarahettige, C.; Bangdiwala, S.I.; AlHabib, K.F.; Avezum, A.; Boström, K.B.; Chifamba, J.; Gulec, S.; et al. Socioeconomic status and risk of cardiovascular disease in 20 low-income, middle-income, and high-income countries: The Prospective Urban Rural Epidemiologic (PURE) study. Lancet Glob. Health 2019, 7, e748–e760. [Google Scholar] [CrossRef] [Green Version]
  64. Limpopo Treasury. Limpopo Socio-Economic Review and Outlook 2018/19 2018. p. 55. Available online: http://www.limtreasury.gov.za/lim_admin_trea/pages/sites/treasury_lim/documents/budget_statement/Limpopo%20Socio-Economic%20Review%20and%20Outlook%202018-19.pdf (accessed on 2 December 2022).
  65. Schulte, F.; Roosli, M.; Ragettli, M.S. Heat-related cardiovascular morbidity and mortality in Switzerland: A clinical perspective. Swiss Med. Wkly. 2021, 151, w30013. [Google Scholar] [CrossRef]
  66. Naidoo, S. The South African national health insurance: A revolution in health-care delivery! J. Public Health 2012, 34, 149–150. [Google Scholar] [CrossRef]
  67. Achebak, H.; Devolder, D.; Ballester, J. Trends in temperature-related age-specific and sex-specific mortality from cardiovascular diseases in Spain: A national time-series analysis. Lancet Planet. Health 2019, 3, e297–e306. [Google Scholar] [CrossRef]
  68. El Khoudary, S.R.; Aggarwal, B.; Beckie, T.M.; Hodis, H.N.; Johnson, A.E.; Langer, R.D.; Limacher, M.C.; Manson, J.E.; Stefanick, M.L.; Allison, M.A.; et al. Menopause transition and cardiovascular disease risk: Implications for timing of early prevention: A scientific statement from the American Heart Association. Circulation 2020, 142, e506–e532. [Google Scholar] [CrossRef]
  69. Bittel, J.; Henane, R. Comparison of thermal exchanges in men and women under neutral and hot conditions. J. Physiol. 1975, 250, 475–489. [Google Scholar] [CrossRef] [PubMed] [Green Version]
  70. Wagner, J.A.; Horvath, S.M. Cardiovascular reactions to cold exposures differ with age and gender. J. Appl. Physiol. 1985, 58, 187–192. [Google Scholar] [CrossRef] [PubMed]
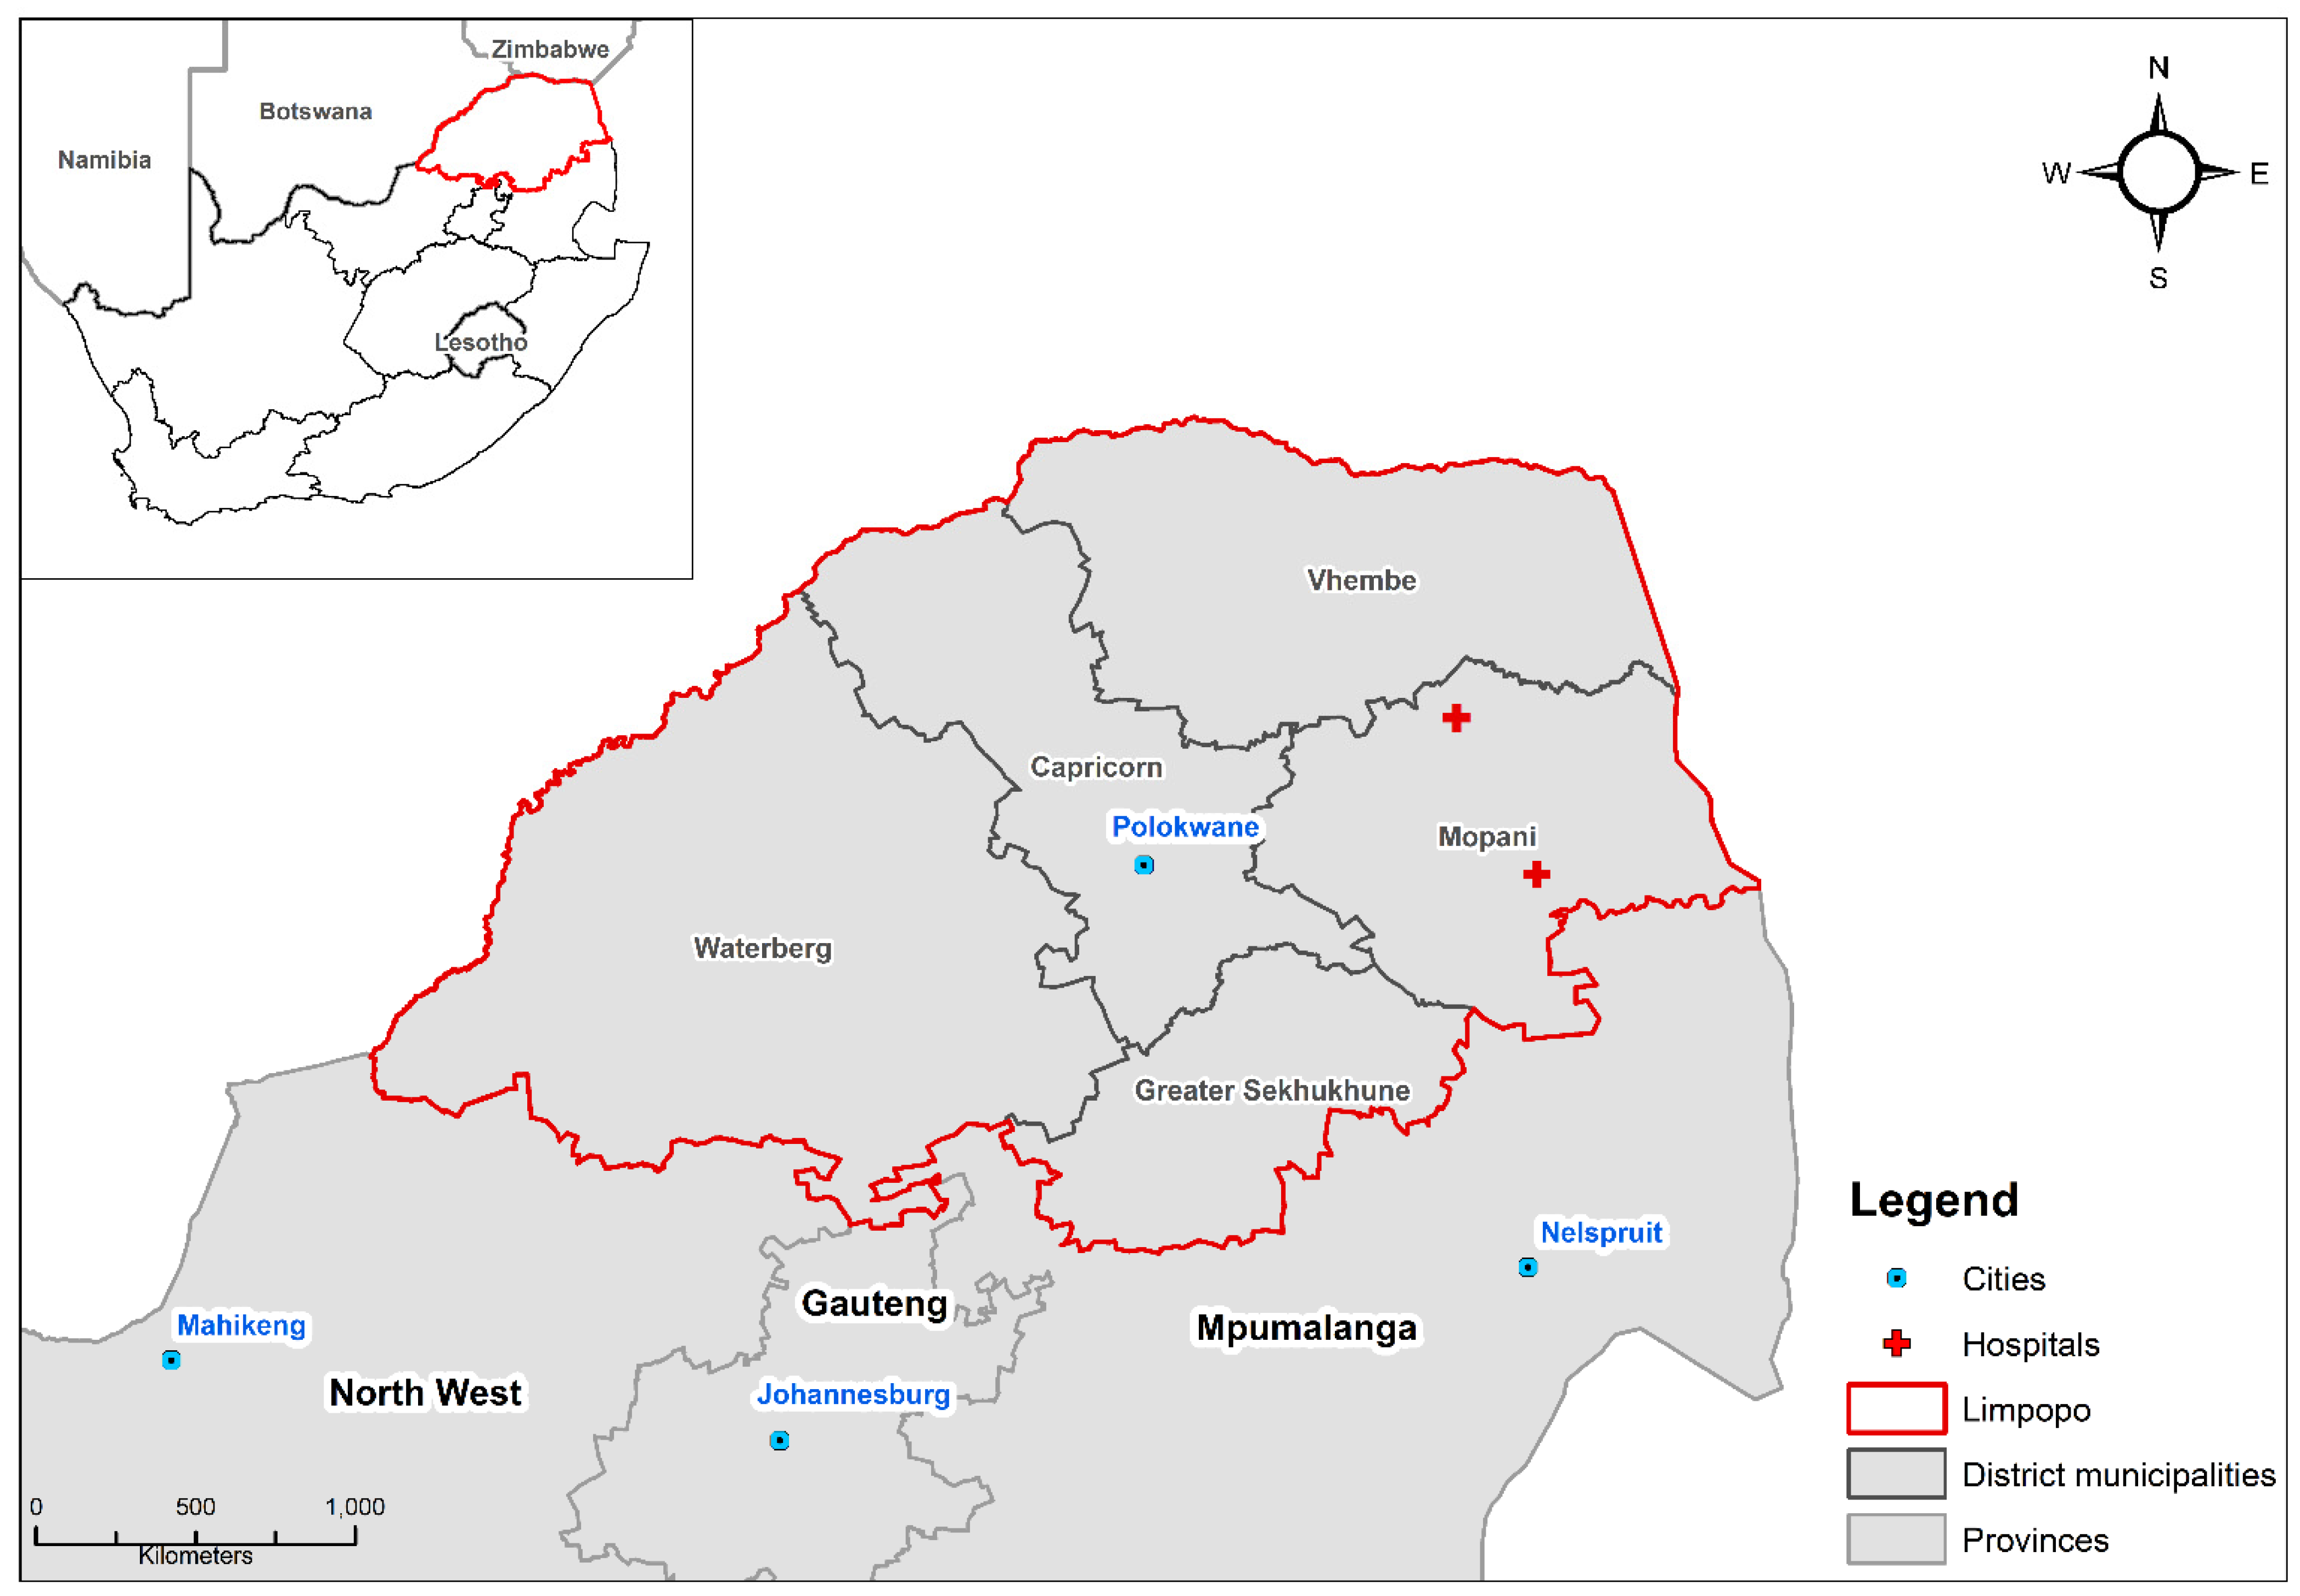
Figure 1. Location of the two hospitals in the study site of Mopani District, Limpopo province, South Africa.
Ijerph 20 00116 g001
Figure 2. (a) The distribution of daily total (N = 37,090) and CVD (N = 3124) hospital admission counts during the study period, and (b) the distribution of total and CVD hospital admission counts in relation to Tapp.
Ijerph 20 00116 g002
Figure 3. Trends in calculated Tapp during the study period. Each dot represents the daily Tapp calculated with weather data from the Thohoyandou weather station.
Ijerph 20 00116 g003
Figure 4. The relative risk (RR) of CVD hospital admissions from apparent temperature (Tapp) accumulated over 21 days of lag. The grey vertical dotted line marks the optimal Tapp of 26 °C, against which the risk for other Tapp was compared. The graph represents the RR for cold (dark) and warm (grey) Tapp. The dotted lines represent the 95% confidence interval. The histogram shows the frequency of each Tapp during the study period.
Ijerph 20 00116 g004
Figure 5. The relative risk (RR) of CVD hospital admissions by lag days at; (a) 9 °C; (b) 16 °C, (c) 28 °C; and (d) 30 °C in Limpopo, South Africa. The dotted lines show the 95% CI. The RRs are compared to an optimal Tapp of 26 °C.
Ijerph 20 00116 g005
Table 1. The attributable fraction of CVD hospital admissions (N = 3124) from the two hospitals during the study period due to non-optimal cold and warm Tapp. The lower and upper 95% confidence intervals (CI) are presented.
AFLower 95% CIUpper 95% CI
Non-optimal Tapps9.54%3.47%15.73%
Cold Tapps8.5%3.16%13.72%
Warm Tapps1.16%−1.43%3.51%
Disclaimer/Publisher’s Note: The statements, opinions and data contained in all publications are solely those of the individual author(s) and contributor(s) and not of MDPI and/or the editor(s). MDPI and/or the editor(s) disclaim responsibility for any injury to people or property resulting from any ideas, methods, instructions or products referred to in the content.