Article

Moderation of Services’ EKC through Transportation Competitiveness: PQR Model in Global Prospective

1
Department of Economics and Statistics, University of Management and Technology, Lahore 54770, Pakistan
2
Department of Economics, Division of Management and Administrative Science, University of Education Lahore, Lahore 54770, Pakistan
3
School of Engineering and Natural Sciences, Istanbul Medipol University, Istanbul 34810, Turkey
4
Department of Computer Science, University of Calgary, Calgary, AB T2N 1N4, Canada
5
Department of Health Informatics, University of Southern Denmark, 5230 Odense, Denmark
*
Author to whom correspondence should be addressed.
Int. J. Environ. Res. Public Health 2023, 20(1), 293; https://doi.org/10.3390/ijerph20010293
Submission received: 22 November 2022 / Revised: 19 December 2022 / Accepted: 21 December 2022 / Published: 24 December 2022

Abstract

:
The continuously increasing GHG emissions have created environmental pollution and several challenges to ecosystems and biodiversity. The challenges of climate change are multipronged, resulting in melting glaciers, flash floods, and severe heat waves. In this regard, the adaptive and mitigation strategies to manage the consequences of climate change are highly important. The transport sector creates a quarter of carbon emissions, and this share is continuously increasing. Accordingly, this research study uses transport competitiveness to determine carbon emissions of the transport sector for 121 countries covering the time period from 2008 to 2018. The Panel Quantile Regression (PQR) technique is engaged to analyze the study results. The findings highlight that transport competitiveness tends to increase carbon emissions of the transport sector across quantile groups 1 and 3, while it reduces carbon emissions in quantile group 2. The U-shaped services’ EKC is validated in quantile groups 2 and 4. The moderation engaged, i.e., transportation competitiveness, changes the turning point of the services’ EKC across quantile groups 2 and 4. However, in the high-CO2 quantile group, the moderation impact of transport competitiveness is strongest as it reduces the sensitivity by flattening the services’ EKC. Furthermore, the planned expansion of the population and improved institutional quality tend to mitigate carbon emissions across different quantile groups. The policy relevance/implications that are based on the study results/findings are made part of the research paper.

1. Introduction

The transport sector is essential as it facilitates the mobility of people and the trade of goods, which creates economic development [1,2,3]. The backward and forward linkages of the transportation sector connected with different economic sectors generate employment and encourage economic growth [4,5,6]. Despite the merits of the transportation sector in promoting economic growth, it consumes a significant share of fossil fuels and generates 25 percent of the total Greenhouse Gas (GHG) emissions [3,7,8]. The increased globalization and rapidly growing urbanization have increased the use of fossil fuels in the transport sector, substantially growing carbon emissions over time [2,3,6]. The rising GHG emissions of the transportation sector have dire consequences as it creates several environmental, health, and food security issues [3,9,10,11,12,13].
The transport sector includes different modes of transportation such as road, rail, sea, and air transportation [3,14]. These different modes of transportation are pre-requisites for the delivery of traded goods, which plays a central role in economic growth. For instance, road transportation is essential for agricultural and industrial growth as roads facilitate the transportation of raw material to agricultural farms/industrial units [14,15]. Similarly, rail transportation ensures the supply of raw material and finished goods to agricultural farms/industrial units for speedy production processes. Sea and air transportation is frequently used for international trade, which promotes the benefits of absolute/comparative advantage [3,15,16,17]. The majority of the different types of transportation uses fossil fuels, which releases carbon emissions. However, the transport sector creates almost a quarter of total emissions and plays a significant role in environmental pollution. Furthermore, the high rate of services sector growth is also triggering the expansion of the transport sector, and it is expected that carbon emissions of the transport sector will continue to grow in the future [3,17]. The rising GHG emissions have increased the world mean temperature levels beyond the desired threshold levels and poses serious environmental threats to natural habitats. Furthermore, a large number of animal and plant species are endangered from the adverse impacts of climate change [3,14,15,17].
The rapidly growing emissions released by the transport sector motivated researchers/policymakers to think about the environmental sustainability of this sector in multiple ways [3,18,19,20]. One way is to introduce renewable fuel in the transport sector, and the second is to incentivize this sector to develop zero-emissions green technologies [3,20,21,22,23]. In this regard, some countries of the world have agreed to manufacture electric cars with net-zero emissions up to 2050 [3,20,23]. The regulation of energy prices, tax rebates for promoting green technologies, recycling, and carbon taxing have helped the environmental sustainability of the transport sector across different countries [24,25,26,27]. The sustainability of the transportation sector requires capacity-building of institutions, corruption-free governance, and the very coordinated interaction of the transport sector with motivation to mitigate carbon emissions [20,22,28].
In the recent past, electric vehicles (EVs) have gained tremendous popularity on several grounds as compared to the Internal Combustion Engine (ICE) [17,29,30]. The ICE uses fossil fuels and directly contributes to environmental pollution [29,31]. EVs have a certain advantage of renewable energy use, which helps achieve net-zero emissions targets. However, the pace of production and usage of EVs is a little slower due to various reasons such as higher production cost and slower consumer adoptability [17,29,31]. The limited distance traveled by EVs on one charge is also a major hurdle in the slow growth of EVs. Furthermore, the slower expansion of EV utilization infrastructure is a significant hurdle in the slow adoption of EVs in the majority of countries [29,30]. In the context of international bindings, it is predicted that 100 million electric vehicles are expected to be on the road by 2035. Furthermore, predictions have also been made by different agencies to raise global EV production to 548 million by 2040 [17,29,31]. Charging stations also need to be modernized for quick charging to save the time of EV users. International standardization is also required for the manufacturing of EVs and charging stations [17,29,30].
The concept of carbon neutrality is very important due to the increasing use of fossil fuels, which ultimately increases carbon emissions [32,33]. The concepts of carbon neutrality and biocapacity are interlinked as they refer to environmental sustainability [33,34]. The leading factors that include addressing carbon neutrality includes the adoption of various carbon mitigation strategies such as the use of renewable fuels in production processes and the promotion of green technologies in the transport sector [32,34]. Furthermore, carbon taxing and rebates on the usage of environmental production technologies provide financial incentives to mitigate carbon emissions [33,34,35].
In the last 20 years, the services sector’s share in the World’s Gross Domestic Product (GDP) has increased from 50 percent to 64 percent, indicating that this sector has grown significantly (World Development Indicators, World Bank). The services sector cannot be graded as a zero-emissions sector, as it is mostly services, such as tourism and transportation, that use fossil fuels, creating carbon emissions [36,37,38]. Furthermore, the process of supply chains used to deliver goods also uses different transportation facilities, which ultimately tends to create carbon emissions [36,37,39]. The embodied carbon emissions are also observed in the services sector as most of the developed countries transfer their production technologies to developing countries [3,20,28,39]. The backward and forward linkages of the services sector with other sectors create a pull effect that significantly impacts the environment [36,37,39]. The services sector is the second-largest carbon footprint creator in the economy of China [36,39,40].
This research study uses transport competitiveness to determine carbon emissions of the transport sector, while competitiveness related to the transport sector indicates the expansion of the transport sector and enhancement of quality of the transport sector [3,17]. The improvement in quality of the transport sector is inclined to increase cost efficiencies and the adoption of green technologies for carbon mitigations, because a broader concept of transport competitiveness is used to determine the carbon emissions of the transport sector [41,42]. However, the literature indicates that different countries are adopting different policies to promote EVs by reducing petrol/diesel-fuel-based vehicles. Furthermore, a significant portion of emissions, i.e., above 90 percent, is based on road transportation, which frequently uses fossil fuels and plays a significant role in creating urban pollution [17,42,43,44]. It is obvious that EVs do not emit carbon emissions, but it is necessary to examine, during various phases of EVs, how much emissions are reported. In this regard, different studies have generated evidence that EVs generate lesser emissions during their complete life cycle process as compared to other gasoline-fuel-based vehicles [30,42,43,45].
The recent assessment report of the Intergovernmental Panel on Climate Change (IPCC) expressed that human actions to promote economic growth are responsible for Greenhouse Gas (GHG) emissions [3,21,22,23]. The report further highlights that rising GHG emissions are responsible for environmental pollution, raising the Earth’s temperature and causing climate change. The transport sector emits 25 percent of global GHG emissions [3]. The World Economic Forum (WEF) records an index related to transport competitiveness by executing a managerial survey annually for more than 150 countries. The transportation competitiveness index measures the two aspects related to the transportation sector. First, it assesses the extensiveness of different means of transportation used by a country, and secondly, transportation competitiveness considers the quality aspect of different means of transportation. Therefore, this study focuses on exploring the role of transportation competitiveness to determine the transportation sector’s carbon emissions. To our knowledge, transport competitiveness is not used in research to explain the variations in the transport sector’s emissions with the services sector.
This research fills the existing research gap in several ways. First, this research study engages the role of the services sector to determine the services’ Environmental Kuznets Curve (EKC) based on the emissions of the transport sector. Secondly, the study analyzes how transport sector moderation impacts its emissions. Thirdly, the study highlights the dynamics of changes in the services’ EKC by engaging a moderator (transportation competitiveness). Furthermore, this research study also incorporates the impact of institutional strengthening and population expansion to determine the transport sector’s carbon emissions. The theoretical grounds of the research study are based on two famous environmental models known as the Environmental Kuznets Curve (EKC) and the Stochastic Impact by Regression on Population, Affluence and Technology (STIRPAT) framework [46,47,48,49,50,51,52].
The three important research objectives to meet the identified research gaps are as follows:
  • To ascertain the impact of transport competitiveness in determining the transport sector’s emissions;
  • To empirically confirm the services-based EKC for transport sector emissions;
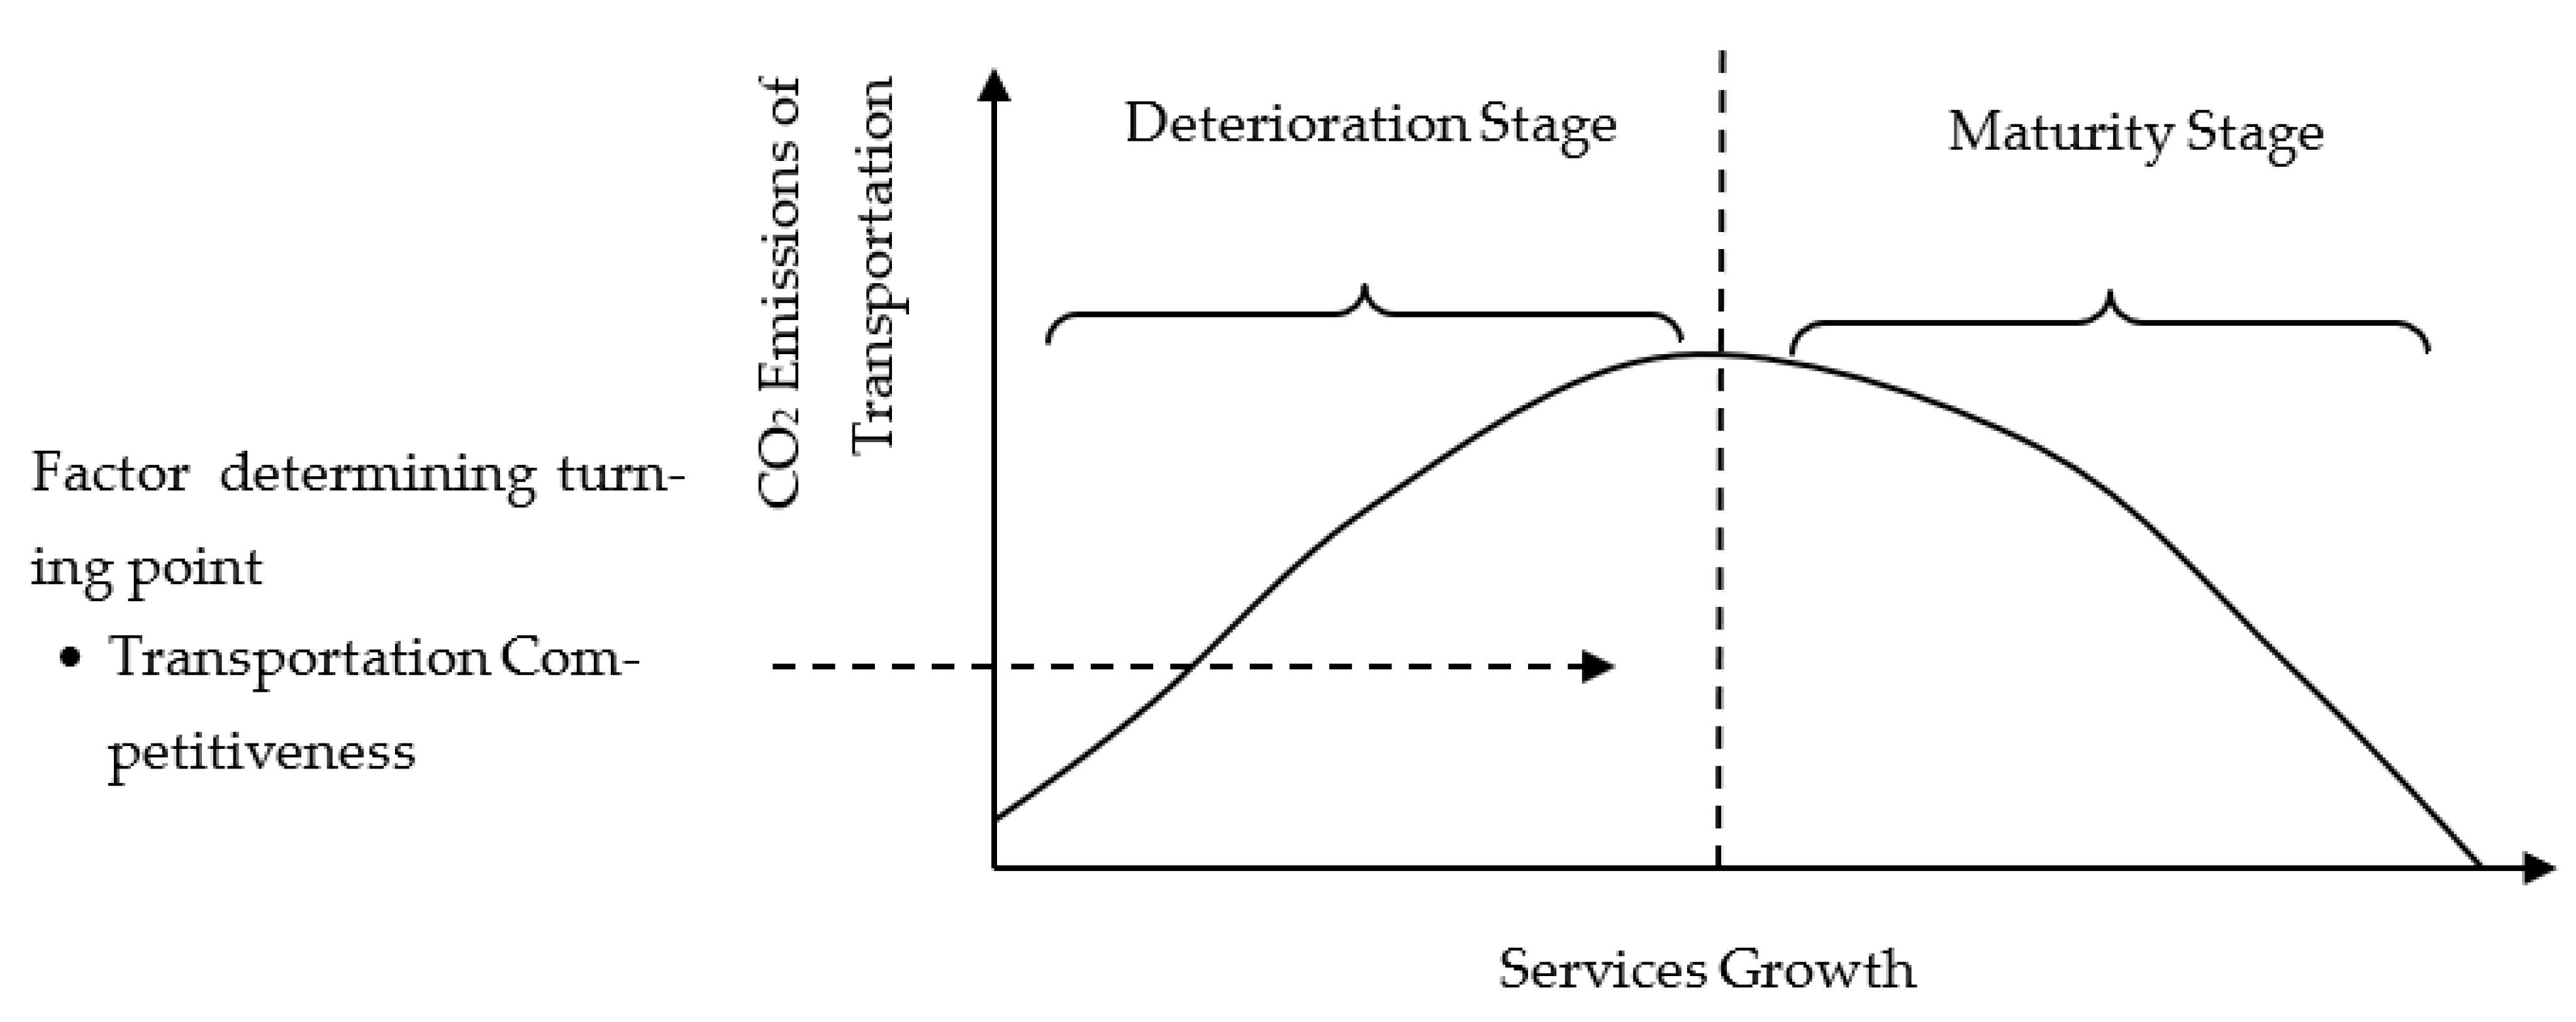
  • To envisage the impact of a moderator (transport competitiveness) in ascertaining the changes in turning points and steepening/flattening of the services’ EKC.
The sequence of the remaining research study includes literature of the related studies, which is highlighted in the second section of the research paper. The theoretical framework and research methodology are presented in the third and fourth sections, respectively. The results/discussions regarding the analysis are portrayed in the fourth section of this research paper. The conclusions/policy implications based on the analyzed results are depicted in the fifth section.

2. Literature Review

An updated review of the literature provides insights about the research topic. In this regard, an attempt is made to ascertain an effective literature review by covering different dynamics of the research study. Accordingly, the literature review section includes recent papers validating the EKC and STIRPAT model, followed by relevant studies regarding the moderation of carbon emissions.
Simon Kuznets advocated the theory of the EKC in 1955 to explain the behavior of income growth and inequality. Subsequently, this theory was tested in the field of environmental economics by a large number of researchers on different datasets [13,47,49,50,51,52]. The literature further indicates that the theory of the EKC is validated for its different shapes. In this regard, the inverted U-shaped EKC was confirmed for different countries by taking different datasets [3,53,54,55,56,57]. Similarly, the U-shaped EKC was confirmed by several researchers for various datasets [3,13,58,59,60,61,62]. The sectoral-based EKC for different sectors was validated by different researchers [3,63,64,65,66,67]. The literature also indicates that some researchers have used service value addition to validate the EKC [13,62,67].
The Stochastic Impact by Regression on Population, Affluence and Technology (STIRPAT) is employed in environmental analysis to ascertain the role of various variables on the environment [48,52,62,68,69,70]. In the STIRPAT model, carbon emissions are frequently used as a dependent variable for environmental pollution [8,18,71,72]. The population is a necessary part of the STIRPAT framework to determine environmental pollution as planned population expansion mitigates carbon emissions [55,61,62,73]. Some research studies have also been found use the service value addition to determine the sectoral impact on environmental pollution [13,62]. Institutional quality is an important determinant of carbon emissions, as improved institutional quality tends to lessen emissions of the transport sector [74,75,76,77], and poor institutional quality increases carbon emissions [3,78,79,80].
In environmental economics, different variables are used as moderators for observing changes in income and emissions. In this regard, the moderation of energy consumption and financial development of the EKC for Turkey was used, and the moderation of financial development has resulted in a stronger emergence of the inverted U-type EKC [81]. In the case of BRICS countries, a moderating role of corruption in determining the income-induced carbon emissions was observed. The study results indicated that controlling corruption could positively mitigate income-based carbon emissions [82]. The moderation of R&D investment for income-induced emissions in thirty provinces of China was observed, and the study found that R&D investment has a significant role in mitigating income-based carbon emissions by promoting green/renewable technologies in different provinces of China [83].
The moderation of renewable energy for foreign direct investment and GDP in the case of Pakistan was engaged. The findings of the research study elaborated that foreign direct investment and GDP growth tend to increase carbon emissions when moderated by renewable energy consumption [84]. The impact of financial development for Malaysia was assessed for moderating the EKC. The study results indicated that the EKC is not confirmed, while financial development significantly moderates income-induced carbon emissions [85]. Energy consumption was used as a moderator for the GDP growth of middle-income countries, and the moderation of energy consumption is observed for economic development in reducing carbon emissions [86]. The moderation of financial development was engaged for 115 countries to validate the EKC across different income groups of countries. The study results regarding the moderation of financial development revealed the observance of stronger EKCs across different income groups [87]. The effect/moderation of urbanization for validation of the EKC was used in the case of Turkey, and the study results indicated that the moderation of urbanization was observed in an inverted U-shaped EKC [88]. The moderation of natural resource dependence for determining the EKC of Malaysia was used, and the study results indicated that the moderation of natural resources impacts income-based EKCs [89].
Researchers used the data from 31 African countries to envisage the moderation of tourism for economic growth, and the study results revealed that tourism further exacerbates economic-growth-based carbon emissions [90]. The moderation of globalization on energy consumption, financial growth, economic development, and human capital for emissions of G20 countries was assessed. The study results indicated that moderation of globalization positively impacted the role of HR and financial growth for carbon emissions [91]. The moderation of technology and its composition of EKC in the case of global countries was assessed [92]. The moderation of financial growth for different indicators such as economic development, energy use, and urban development in determining the carbon emissions of Turkey was assessed [93]. A study conducted to ascertain the impact/moderation of reusable energy and HR for GHG emissions revealed that the moderation/impact of reusable energy for pesticide usage indicates the mitigation of GHG emissions [94]. The moderation effect of institutional governance on emissions for 30 provinces of China was assessed, and the study results revealed that institutional quality weakens the economic development process, which may bring an early peak of emissions in China [95].
The literature review of different research studies established the research/study gap that the competitiveness of the transport sector has not been considered in determining the transport sector’s carbon emissions. The recent literature on moderating variables for carbon emissions also indicates that the role of competitiveness for the transport sector has not been considered to assess the variations in the latent mechanism of the services’ EKC. More precisely, to our knowledge, the existing literature does not indicate that competitiveness of the transport sector, as a moderator, is employed to explain variations in the EKC and carbon emissions nexus. Based on the literature and research gap, the objectives are reassembled to identify the role of competitiveness of the transport sector in ascertaining its impact on the transport sector’s emissions. The emergence of transportation-based carbon emissions and the services’ value-addition EKC is tested. Finally, the moderation/impact of competitiveness of the transport sector is considered to determine the variations in transportation and services’ value-addition nexus.

3. Theoretical Framework

To address the research goals/objectives, the theoretical framework is prepared based on the EKC and STIRPAT frameworks. In this regard, two options of the theoretical foundation are considered. The first is validating the inverted U-shaped EKC based on transportation carbon emissions and services’ value addition. Figure 1 indicates the inverted U-shaped relationship between the services sector’s value addition and transportation sector’s carbon emissions. The second possibility of the theoretical framework represents the U-shaped EKC, indicating two stages of development (Figure 2).

4. Materials and Methods

A comprehensive methodology is adopted considering a panel of 121 countries (Appendix A). These countries are based on the World Economic Forum (WEF)’s recorded transportation competitiveness data. The WEF recorded this transportation competitiveness data in 2008 for member countries. The study period is confined to 2018 because the COVID-19 pandemic was reported to start in 2019 and the transportation activities were suspended. The dynamic grouping of the data is prepared based on emissions of the transport sector. In this regard, four different dynamic quantile groups are prepared using annual data of emissions of the transport sector for sample countries. These categories of groups are named as low CO2, low medium CO2, high medium CO2, and high CO2. These categories/groups are prepared on the basis of actual values of emissions of the transport sector for each year. Consequently, the sample countries are expected to change/jump category/groups if they show progress over time. Furthermore, the dynamic panel grouping is made on the basis of the actual values of each country in respective time periods, and countries may change group. This grouping is better as compared to the static grouping made by the World Bank on income groups, etc., used for panel data analysis [3,96,97]. The static grouping is made on the basis of one value for a country and its previous position in which the specific country’s fall is totally ignored [17,98,99]. Furthermore, this dynamic grouping is not overlapped, as dynamic panel quantile grouping allows movement of a country from one year to another and, in this regard, a more realistic grouping can be made [3,17,96,97,98,99]. The study variables with the relevant source are presented in Table 1.
As indicated in Table 1, the dependent variable is considered as carbon emissions of the transportation sector. The data for this variable are measured in metric tons per capita and are downloaded from the Emissions Database for Global Atmospheric Research (EDGAR). The services’ value addition and square of services’ value addition are independent variables, and their data are taken from World Development Indicators (WDIs). To explain the variations in environmental pollution, several researchers have used this variable in their analysis [13,62]. Researchers in environmental analysis frequently use variables related to the population. In this research study, population density is used as one of the explanatory variables for environmental pollution in the transportation sector [55,61,62]. The high institutional quality index ensures the proper implementation of rules and regulations to mitigate carbon emissions. By keeping in view the importance of institutional quality, this variable is included in the analysis to determine carbon emissions in the transportation sector [3,74,75,76,77]. The World Economic Forum (WEF) recorded member countries’ transportation competitiveness index in 2008. WEF collects data for transportation competitiveness through the execution of a perception survey annually. The transportation competitiveness index measures the expansion of the transport sector and its quality. Considering the importance of the transportation competitiveness index, the impact/moderation of competitiveness of the transport sector is included in the model to determine the transport sector’s carbon emissions.
CO2(T) = f (SVC, SVC2, TC, POP, TEC)
Based on the functional form of the research study, the standard form of the equation is as follows:
CO2it = β0 + β1 SVCit + β2 SVC2it + β3 SVCit × TCit + β4 SVC2it × TCit + β5 TCit + β6 PDENit + β7 INSTit + μit
The non-linear term of the services sector is included in the model to empirically validate the services’ EKC based on carbon emissions of the transportation sector. For the inverted U-shaped EKC, β1 > 0 and β2 < 0 have to be significant. However, in the U-shaped EKC, β1 < 0 and β2 > 0 are significant. The moderation of transportation competitiveness is included in the model to determine the changes in the direction of the slope of the services’ EKC and its relative flattening/steepening [3,100]. To determine the changes in the direction of the slope of the EKC, we differentiate Equation (2) concerning SVC and then, by equating it to zero, we obtain:
SVC* = (−β1 − β3TC)/(2β2 + 2β4TC)
Equation (3) shows that the turning point of the services’ EKC depends on the value of the moderator (transportation competitiveness). To determine the changes in the turning point, we differentiate Equation (3) concerning transportation competitiveness and obtain the following equation:
δSVC*/δTC = (β1 β4 − β2 β3)/2(β2 + β4TC)2
The denominator of Equation (4) is positive due to the square term. Therefore, the changes in the turning point are contingent on the numerator term (β1 β4 − β2 β3). If the numerator term, i.e., (β1 β4 − β2 β3), is positive, then the turning point will tend to the right side and vice versa. This derivation indicates that the changes in slope direction of the services’ EKC are not only contingent on β3 but also on β1, β2, and β4 [3,14,100,101]. On the contrary, the flattening or steepening of the services’ EKC is straightforward as it only depends on β4. The cross-product of the square term of services growth with the moderator, i.e., transportation competitiveness, indicates the flattening or steepening of the services’ EKC and depends on β4. If β4 is positive and significant, then the services’ EKC will tend toward flattening for the inverted U-shaped services’ EKC. The steepening will occur for the inverted U-shaped services’ EKC when β4 is negative and significant. Similarly, in the U-shaped services’ EKC, the positive and negative significance of β4 indicates the steepening and flattening of the services’ EKC for transportation competitiveness, respectively [3,100,101].
The Dawson method prepares graphs to validate the moderation of transportation competitiveness. The regression coefficients of services growth, square of services growth, and cross-products are used [3,102]. The graph displays the movement of the services curve at low and high levels of transportation competitiveness and represents the variations in curvilinear behavior of services growth at various levels of the transport competitiveness (moderator) [3,14].
The basic foundations of IPAT identity and the STIRPAT framework are used to derive the research study model in its logarithm form. The STIRPAT framework is derived on the basis of standard IPAT identity, which is as follows:
Iit = a Pitb Aitc Titd eit
where “Ii” denotes the environmental impact, “Pi” denotes population size, “Ai” shows affluence, and “Ti” is the technology. By using a natural log, the following standard form of the STIRPAT model is derived:
ln Iit = a + b (ln Pit) + c (ln Ait) + d (ln Tit) + ln eit
It is also appropriate that once the standard STIRPAT model is derived, additional variables can also be added according to the scope and dimensions of the research study [3,13,15,70]. Accordingly, the extended STIRPAT model of the study based on the variables highlighted in Table 1 is as follows:
ln (CO2it) = β0 + β1 (ln SVCit) + β2 (ln SVC2it) + β3 (ln SVCit × TCit) + β4 (ln SVC2it × TCit) + β5 (TCit) + β6 (ln PDENit) + β7 (INSTit) + μit
The Panel Quantile Regression (PQR) estimates the study results. The PQR estimation technique has many benefits over conventional regression estimation techniques. The PQR estimation technique uses the median as the average rather than the mean because the mean is affected by extreme values in the dataset [3]. In panel datasets having large cross-sections, it is observed that most of the variables are non-normal, but the PQR is a very suitable technique for the estimation of results having non-normal variables as it inhabits the median as a measure of average [3]. The PQR estimation procedure dates back to 1978 when Koenker and Bassett advocated for this estimation model in their seminal paper [103].
Furthermore, the PQR estimation technique is not distribution-sensitive and produces robust results [3,104,105]. The PQR model provides results based on countries considered in quantiles and may be useful in preparing a policy for the countries of quantile panels [3,96,98,99,106]. In environmental analysis, many researchers have used the PQR model to analyze the results, especially to determine the key determinants of carbon emissions [99,106]. As discussed earlier, the PQR model provides robust results when dealing with panel data having non-normal variables. The recently available literature shows that PQR is extensively engaged in analyzing panel data for considering various quantiles for envisaging environmental pollution [3,96,97,106,107].

5. Results and Discussion

The basic statistics included in the research study are calculated to ascertain the information regarding the concentration and dispersion of the data. The measures of average include mean/average, median, mode, and percentiles, while the indicators for dispersion are standard deviation, interquartile range, and skewness/kurtosis. The summary of these various statistics of central tendency and measures of dispersion regarding different variables is elaborated in Table 2. The variance inflation factor (VIF) is also calculated for identifying multicollinearity based on the correlation coefficient for the study variables (Table 3). VIF shows that none of the values of VIF > 10 indicate any issue of multicollinearity [3,13].
The skewness/kurtosis normality test is used to test the normality of the data series considered for analysis. The significance of this normality test for all the variables indicates that data series considered in the analysis are reportedly non-normal, and the outcomes of these test values are summarized in Table 4. As a consequence of the non-normality of data series of the variables, the Panel Quantile Regression (PQR) estimation procedure is engaged for estimation purpose as this technique is not distribution-sensitive and can generate robust results [104,105]. The analyzed results of the PQR estimation technique are portrayed in Table 5.
The study results are analyzed in four quantile categories/groups, which are developed based on transport sector emissions for a group of sample countries. These quantile groups are named based on the level of emissions of the transportation sector. The services sector’s value addition significantly increases emissions in quantile groups 1 and 3. This may indicate that the growth of the services sector in quantile groups 1 and 3 requires more transportation to commute people and goods from one place to another, increasing the transport sector’s carbon emissions. However, in quantile groups 2 and 4, the services sector significantly tends to lessen emissions of the transportation sector, indicating that services sector growth promotes transportation that has the potential to mitigate carbon emissions across the high-CO2-emitting group of countries [3,13,62].
The non-linear services value addition is considered in the study/research model to empirically confirm the EKC proposition [3,13,62]. The signs of the coefficients for services growth and its square term in group 1 have not changed, which shows non-confirmation of the EKC. For group 2, the signs of the coefficient of services growth and its square term have changed from negative to positive, indicating the validation of the U-shaped EKC [13,62]. The EKC proposition is not confirmed in group 3, as the square term of the services growth coefficient is insignificant. Finally, the EKC hypothesis in the U-shape is supported in group 4 as both coefficients of the services growth and its square term are significant and have negative and positive signs, respectively [13,62]. The validation of the U-shaped services’ EKC across groups 2 and 3 indicates that the services sector is growing beyond the sustainability phase, and expanding the services sector exacerbates environmental pollution. This indicates that expanding services require more commutation facilities, which further increases transport sector emissions. The non-validation of the EKC across quantile groups 1 and 3 indicates that the expansion of the services sector is not in line with sustainability principles [3,13,62].
The survey results indicate that transportation competitiveness significantly upsurges emissions of the transport sector in categories/groups 1 and 3. However, in quantile group 2, the competitiveness of the transport sector tends to lessen the transport sector’s emissions, while it reports insignificance in quantile category/group 4. The impact of competitiveness of the transport sector in generating emissions is strongest for quantile group 1, indicating that the services sector is growing, but environmental protection has not been prioritized. In quantile group 2, transportation competitiveness tends to lessen emissions of the transport sector, indicating that the quality of different modes of transportation is considered a priority to protect the environment from carbon emissions [3,13,62].
The moderation of transportation competitiveness is also considered by including the cross-product terms. The outcomes of moderation are summarized in Table 6 and Figure 3. It is revealed that the EKC is not validated in groups 1 and 3. However, the U-shaped EKC is confirmed for quantile groups 2 and 4. In the case of quantile group 2, the moderator (transport competitiveness) shifts the turning point toward the left side and further steepens the services’ EKC. In quantile group 4, the moderator shifts the turning point toward the left side and flattens the EKC. The moderation analysis also specifies that the left side shifting of the turning point of the U-shaped services’ EKC in groups 2 and 4 shows the early maturity of the turning point. This indicates the early completion of the sustainability phase of the U-shaped services’ EKC. However, in group 4, the flattening of the U-shaped services’ EKC indicates that the moderator reduces the sensitivity of carbon emissions by the services’ sector. Group 4 has high-CO2-emission countries, and the most advanced countries are adopting environmental protection policies in the transportation sector. The adoption of green technologies in the transportation sector by group 4 countries has improved transportation competitiveness, implicitly moderating the services sector’s carbon emissions. The Dawson methodology used in Figure 3 also indicates the significant contribution of moderators in determining the carbon emissions across quantile group 2 and group 4. In group 4, it is evident that a higher level of transportation competitiveness at increasing services growth tends to mitigate the transportation sector’s carbon emissions. A possible explanation is adopting green technology and sustainable fuels used in the transportation sector [13,62].
The impact of institutional quality index and population growth/density is also included in the STIRPAT model to assess their detrimental role in explaining transport sector emissions. The institutional quality is observed to significantly lessen the transport sector emissions for quantile groups 1, 2, and 3 [74,75,76,77]. The study indicates that environmental protection policies are more efficiently pursued and implemented in the following countries. However, the institutional quality index is reported as insignificant in quantile group 4. The analysis further reveals that population density is significantly mitigating the transportation sector’s emissions across quantile groups 1, 3, and 4 [55,61,62,73]. The planned expansion of population requires lesser means of transportation for commuting from one place to another as most of the necessary amenities of life such as commercial hubs, and education and health facilities are available within the community premises, which tends to reduce the carbon footprint [3,62].

6. Conclusions

This research study is conducted on a sample of 121 countries to assess the moderation of transportation competitiveness in determining the transport sector’s carbon emissions. This research study’s novelty is engaging transportation competitiveness to study the services sector’s growth and transportation-based emissions nexus. This aspect has not been found during the literature review to the best of our knowledge. Three precise objectives of the research study are considered to address the research gap. First, the role of competitiveness of the transport sector is assessed in determining the environmental pollution created by the transport sector. Secondly, the empirical validation of the services’ EKC is tested, and, finally, the moderation (transportation competitiveness) is envisioned to ascertain variations in the services’ EKC. The more updated estimation approach, i.e., Panel Quantile Regression (PQR), is used. The Dawson methodology is used to confirm the moderation impact of competitiveness for the transport sector. The data of 121 sample countries are divided into four dynamic categories/groups based on emissions of the transport sector.
The competitiveness of the transport sector tends to lessen emissions in category/quantile group 2, indicating that the quality of the transport sector in this group of countries is mitigating carbon emissions. However, in quantile groups 1 and 3, expanding the transportation sector to support the services sector’s growth tends to stimulate the transport sector’s carbon emissions. The U-shaped services’ EKC is confirmed for categories/quantile groups 2 and 4, while, in groups 1 and 3, the services’ EKC is not supported. The moderation (transportation competitiveness) is analyzed for changes in the services’ EKC. The changes in the turning point of the services’ EKC across quantile groups 2 and 4 are observed to shift toward the left side. However, the non-linear moderator steepens the services’ EKC in quantile group 2 and flattens the services’ EKC in quantile group 4. Quantile group 4 is a high-CO2 group and mostly includes countries opting for green technologies such as electric vehicles and zero-emissions commitments. Therefore, in these countries, the quality of transportation has improved, and transportation competitiveness reduces the sensitivity of the services’ EKC by flattening its shape.
The implications of the research study are evident as the quality of different modes of transportation needs to be improved in terms of green technologies and transportation sustainability. This will improve transportation competitiveness, which will help mitigate the services’ growth leading to the transportation sector’s carbon emissions, especially across quantile groups 1 and 3. In quantile groups 1 and 3, where the services’ EKC is not validated, the sample countries need to improve transportation competitiveness to achieve the sustainability phase. The moderation of competitiveness for the transport sector is observed, elucidating increasing transportation quality to lessen carbon emissions. Furthermore, the systematic population growth and improvement in institutional quality across all quantile groups of countries may help to mitigate pollution in the transportation sector. The study results are very helpful for international donors, policymakers, urban developers, and transport planners. The research study has data limitations and a limited scope of transportation competitiveness. In the future, more variables such as renewable energy, institutional quality, and innovations can be used to moderate the transportation sector’s carbon emissions. Furthermore, other sectoral value additions may also be used to determine the emissions of the transport sector.

Author Contributions

Conceptualization, M.S.S. and H.u.R.; methodology, N.A., R.A. and M.M.; software, M.S.S.; validation, H.u.R. and R.A.; formal analysis, M.S.S., R.A. and M.M.; investigation, R.A. and N.A.; data curation, M.M.; writing—original draft preparation, M.S.S.; writing—review and editing, M.M.; visualization, M.S.S. and M.M.; supervision, R.A. and H.u.R. All authors have read and agreed to the published version of the manuscript.

Funding

This research received no external funding.

Institutional Review Board Statement

Not applicable.

Informed Consent Statement

Not applicable.

Data Availability Statement

The following datasets are available in the given link https://databank.worldbank.org/source/world-development-indicators (accessed on 20 December 2021).

Acknowledgments

We would like to acknowledge all the institutions for their support.

Conflicts of Interest

The authors declare no conflict of interest.

Appendix A

Table A1. Sample of Four Quantile Groups Based on Carbon Emissions of Transportation Sector.
Category/Group-1
(Low CO2)
Category/Group-2
(Low Medium CO2)
Category/Group-3
(High Medium CO2)
Category/Group-4
(High CO2)
ArmeniaAlbaniaAustriaAlgeria
BarbadosAzerbaijanAzerbaijanArgentina
BhutanBahrainBangladeshAustralia
BotswanaBangladeshBelgiumBelgium
Brunei DarussalamBeninBoliviaBrazil
BurundiBoliviaBulgariaCanada
CambodiaBosnia and HerzegovinaColombiaChile
ChadBotswanaChileChina
CyprusCambodiaCzech RepublicColombia
EstoniaCameroonDenmarkFrance
GabonCosta RicaEcuadorGermany
GeorgiaCroatiaEthiopiaGreece
GuineaCyprusFinlandIndia
HaitiDominican RepublicGhanaIndonesia
IcelandEl SalvadorGreeceItaly
JamaicaEstoniaGuatemalaJapan
LesothoEthiopiaHungaryMalaysia
LiberiaGeorgiaIrelandMexico
MadagascarGhanaIsraelNetherlands
MalawiGuatemalaJordanNigeria
MaliHondurasKazakhstanPakistan
MaltaJordanKenyaPhilippines
MauritaniaKenyaKuwaitPoland
MauritiusLatviaLuxembourgRussia
MongoliaLebanonMoroccoSaudi Arabia
MozambiqueLithuaniaNew ZealandSouth Africa
NamibiaLuxembourgNigeriaSpain
NepalMongoliaNorwayThailand
NicaraguaMozambiqueOmanTurkey
RwandaNamibiaParaguayUkraine
SenegalNepalPeruUAE
SeychellesNicaraguaPhilippinesUK
Sierra LeonePanamaPortugalUS
TajikistanParaguayQatar
UgandaSenegalRomania
ZambiaSingaporeSingapore
ZimbabweSloveniaSri Lanka
Sri LankaSweden
TajikistanSwitzerland
Trinidad and TobagoTunisia
TunisiaUkraine
Uruguay
Zimbabwe
37 countries (24% of total sample)43 countries (29% of total sample)41 countries (26% of total sample)33 countries (21% of total sample)

References

  1. Banerjee, A.; Duflo, E.; Qian, N. On the road: Access to transportation infrastructure and economic growth in China. J. Dev. Econ. 2020, 145, 102442. [Google Scholar] [CrossRef] [Green Version]
  2. Chen, Z.; Li, X. Economic impact of transportation infrastructure investment under the Belt and Road Initiative. Asia Eur. J. 2021, 19, 131–159. [Google Scholar] [CrossRef]
  3. Sardar, M.S.; Rehman, H.u. Transportation moderation in agricultural sector sustainability—A robust global perspective. Environ. Sci. Pollut. Res. 2022, 29, 60385–60400. [Google Scholar] [CrossRef]
  4. Cigu, E.; Agheorghiesei, D.T.; Toader, E. Transport infrastructure development, public performance and long-run economic growth: A case study for the Eu-28 countries. Sustainability 2019, 11, 67. [Google Scholar] [CrossRef] [Green Version]
  5. Magazzino, C.; Mele, M. On the relationship between transportation infrastructure and economic development in China. Res. Transp. Econ. 2020, 88, 100947. [Google Scholar] [CrossRef]
  6. Pradhan, R.P.; Arvin, M.B.; Nair, M. Urbanization, transportation infrastructure, ICT, and economic growth: A temporal causal analysis. Cities 2021, 115, 103213. [Google Scholar] [CrossRef]
  7. Chaudhry, S.M.; Ahmed, R.; Shafiullah, M.; Huynh, T.L.D. The impact of carbon emissions on country risk: Evidence from the G7 economies. J. Environ. Manag. 2020, 265, 110533. [Google Scholar] [CrossRef]
  8. Aslan, A.; Altinoz, B.; Özsolak, B. The nexus between economic growth, tourism development, energy consumption, and CO2 emissions in Mediterranean countries. Environ. Sci. Pollut. Res. 2021, 28, 3243–3252. [Google Scholar] [CrossRef]
  9. Miao, W.; Huang, X.; Song, Y. An economic assessment of the health effects and crop yield losses caused by air pollution in mainland China. J. Environ. Sci. 2017, 56, 102–113. [Google Scholar] [CrossRef]
  10. Yadav, J.; Kumar, A.; Mohan, R. Dramatic decline of Arctic Sea ice linked to global warming. Nat. Hazards 2020, 103, 2617–2621. [Google Scholar] [CrossRef]
  11. Sinharoy, S.S.; Clasen, T.; Martorell, R. Air pollution and stunting: A missing link? Lancet Glob. Health 2020, 8, e472–e475. [Google Scholar] [CrossRef] [Green Version]
  12. Baz, K.; Cheng, J.; Xu, D.; Abbas, K.; Ali, I.; Ali, H.; Fang, C. Asymmetric impact of fossil fuel and renewable energy consumption on economic growth: A non-linear technique. Energy 2021, 226, 120357. [Google Scholar] [CrossRef]
  13. Arshed, N.; Munir, M.; Iqbal, M. Sustainability assessment using STIRPAT approach to environmental quality: An extended panel data analysis. Environ. Sci. Pollut. Res. 2021, 28, 18163–18175. [Google Scholar] [CrossRef]
  14. Arshed, N.; Sardar, M.S.; Iqbal, M. Can efficient transport moderate real sector productivity? Compet. Rev. Int. Bus. J. 2021, 32. Available online: https://www.emerald.com/insight/content/doi/10.1108/CR-01-2021-0002/full/html (accessed on 20 December 2021). [CrossRef]
  15. Lv, Q.; Liu, H.; Yang, D.; Liu, H. Effects of urbanization on freight transport carbon emissions in China: Common characteristics and regional disparity. J. Clean. Prod. 2019, 211, 481–489. [Google Scholar] [CrossRef]
  16. Obaid, M.; Torok, A.; Ortega, J. A Comprehensive Emissions Model Combining Autonomous Vehicles with Park and Ride and Electric Vehicle Transportation Policies. Sustainability 2021, 13, 4653. [Google Scholar] [CrossRef]
  17. Sardar, M.S.; Asghar, N.; Rehman, H. Moderation of competitiveness in determining environmental sustainability: Economic growth and transport sector carbon emissions in global perspective. Environ. Dev. Sustain. 2022, 1–23. [Google Scholar] [CrossRef]
  18. Amin, A.; Altinoz, B.; Dogan, E. Analyzing the determinants of carbon emissions from transportation in European countries: The role of renewable energy and urbanization. Clean Technol. Environ. Policy 2020, 22, 1725–1734. [Google Scholar] [CrossRef]
  19. Luna, T.F.; Uriona-Maldonado, M.; Silva, M.E.; Vaz, C.R. The influence of e-carsharing schemes on electric vehicle adoption and carbon emissions: An emerging economy study. Transp. Res. Part D Transp. Environ. 2020, 79, 102226. [Google Scholar] [CrossRef]
  20. Umar, M.; Ji, X.; Kirikkaleli, D.; Alola, A.A. The imperativeness of environmental quality in the United States transportation sector amidst biomass-fossil energy consumption and growth. J. Clean. Prod. 2021, 285, 124863. [Google Scholar] [CrossRef]
  21. Sun, H.; Edziah, B.K.; Sun, C.; Kporsu, A.K. Institutional quality, green innovation and energy efficiency. Energy Policy 2019, 135, 111002. [Google Scholar] [CrossRef]
  22. Sun, H.; Hu, L.; Geng, Y.; Yang, G. Uncovering impact factors of carbon emissions from transportation sector: Evidence from China’s Yangtze River Delta Area. Mitig. Adapt. Strateg. Glob. Chang. 2020, 25, 1423–1437. [Google Scholar] [CrossRef]
  23. Wanke, P.; Chen, Z.; Zheng, X.; Antunes, J. Sustainability efficiency and carbon inequality of the Chinese transportation system: A Robust Bayesian Stochastic Frontier Analysis. J. Environ. Manag. 2020, 260, 110163. [Google Scholar] [CrossRef]
  24. Santarromana, R.; Mendonça, J.; Dias, A.M. The effectiveness of decarbonizing the passenger transport sector through monetary incentives. Transp. Res. Part A Policy Pract. 2020, 138, 442–462. [Google Scholar] [CrossRef]
  25. Shan, S.; Ahmad, M.; Tan, Z.; Adebayo, T.S.; Li, R.Y.M.; Kirikkaleli, D. The role of energy prices and non-linear fiscal decentralization in limiting carbon emissions: Tracking environmental sustainability. Energy 2021, 234, 121243. [Google Scholar] [CrossRef]
  26. Liu, J.; Bai, J.; Deng, Y.; Chen, X.; Liu, X. Impact of energy structure on carbon emission and economy of China in the scenario of carbon taxation. Sci. Total Environ. 2021, 762, 143093. [Google Scholar] [CrossRef]
  27. Sun, H.; Awan, R.U.; Nawaz, M.A.; Mohsin, M.; Rasheed, A.K.; Iqbal, N. Assessing the socio-economic viability of solar commercialization and electrification in south Asian countries. Environ. Dev. Sustain. 2021, 23, 9875–9897. [Google Scholar] [CrossRef]
  28. Zhao, X.; Ke, Y.; Zuo, J.; Xiong, W.; Wu, P. Evaluation of sustainable transport research in 2000–2019. J. Clean. Prod. 2020, 256, 120404. [Google Scholar] [CrossRef]
  29. Das, H.S.; Rahman, M.M.; Li, S.; Tan, C.W. Electric vehicles standards, charging infrastructure, and impact on grid integration: A technological review. Renew. Sustain. Energy Rev. 2020, 120, 109618. [Google Scholar] [CrossRef]
  30. Deb, S.; Tammi, K.; Kalita, K.; Mahanta, P. Review of recent trends in charging infrastructure planning for electric vehicles. Wiley Interdiscip. Rev. Energy Environ. 2018, 7, e306. [Google Scholar] [CrossRef]
  31. Davidov, S.; Pantoš, M. Planning of electric vehicle infrastructure based on charging reliability and quality of service. Energy 2017, 118, 1156–1167. [Google Scholar] [CrossRef]
  32. Zhao, X.; Ma, X.; Chen, B.; Shang, Y.; Song, M. Challenges toward carbon neutrality in China: Strategies and countermeasures. Resour. Conserv. Recycl. 2022, 176, 105959. [Google Scholar] [CrossRef]
  33. Wu, X.; Tian, Z.; Guo, J. A review of the theoretical research and practical progress of carbon neutrality. Sustain. Oper. Comput. 2022, 3, 54–66. [Google Scholar] [CrossRef]
  34. Ochoa-Moreno, W.-S.; Quito, B.A.; Moreno-Hurtado, C.A. Foreign Direct Investment and Environmental Quality: Revisiting the EKC in Latin American Countries. Sustainability 2021, 13, 12651. [Google Scholar] [CrossRef]
  35. Zhang, H. Technology Innovation, Economic Growth and Carbon Emissions in the Context of Carbon Neutrality: Evidence from BRICS. Sustainability 2021, 13, 11138. [Google Scholar] [CrossRef]
  36. Zhang, L.; Liu, B.; Du, J.; Liu, C.; Wang, S. CO2 emission linkage analysis in global construction sectors: Alarming trends from 1995 to 2009 and possible repercussions. J. Clean. Prod. 2019, 221, 863–877. [Google Scholar] [CrossRef]
  37. Hou, H.; Wang, J.; Yuan, M.; Liang, S.; Liu, T.; Wang, H.; Xu, H. Estimating the mitigation potential of the Chinese service sector using embodied carbon emissions accounting. Environ. Impact Assess. Rev. 2021, 86, 106510. [Google Scholar] [CrossRef]
  38. Javaid, A.; Arshed, N.; Munir, M.; Amani Zakaria, Z.; Alamri, F.S.; Abd El-Wahed Khalifa, H.; Hanif, U. Econometric Assessment of Institutional Quality in Mitigating Global Climate-Change Risk. Sustainability 2022, 14, 669. [Google Scholar] [CrossRef]
  39. Yuan, R.; Behrens, P.; Rodrigues, J.F. The evolution of inter-sectoral linkages in China’s energy-related CO2 emissions from 1997 to 2012. Energy Econ. 2018, 69, 404–417. [Google Scholar] [CrossRef]
  40. Hou, H.; Bai, H.; Ji, Y.; Wang, Y.; Xu, H. A historical time series for inter-industrial embodied carbon transfers within China. J. Clean. Prod. 2020, 264, 121738. [Google Scholar] [CrossRef]
  41. Peiseler, L.; Serrenho, A.C. How can current German and EU policies be improved to enhance the reduction of CO2 emissions of road transport? Revising policies on electric vehicles informed by stakeholder and technical assessments. Energy Policy 2022, 168, 113124. [Google Scholar] [CrossRef]
  42. Kolbe, K. Mitigating urban heat island effect and carbon dioxide emissions through different mobility concepts: Comparison of conventional vehicles with electric vehicles, hydrogen vehicles and public transportation. Transp. Policy 2019, 80, 1–11. [Google Scholar] [CrossRef]
  43. Hill, G.; Heidrich, O.; Creutzig, F.; Blythe, P. The role of electric vehicles in near-term mitigation pathways and achieving the UK’s carbon budget. Appl. Energy 2019, 251, 113111. [Google Scholar] [CrossRef]
  44. Yu, C.; Tang, D.; Tenkorang, A.P.; Bethel, B.J. The Impact of the Opening of Producer Services on the International Competitiveness of Manufacturing Industry. Sustainability 2021, 13, 11224. [Google Scholar] [CrossRef]
  45. Hashmi, S.H.; Hongzhong, F.; Fareed, Z.; Bannya, R. Testing Non-Linear Nexus between Service Sector and CO2 Emissions in Pakistan. Energies 2020, 13, 526. [Google Scholar] [CrossRef] [Green Version]
  46. Kuznets, S. Economic growth and income inequality. Am. Econ. Rev. 1955, 45, 1–28. [Google Scholar]
  47. Grossman, G.M.; Krueger, A.B. Environmental Impacts of a North American Free Trade Agreement; (No. w3914); National Bureau of Economic Research: Cambridge, MA, USA, 1991; Available online: https://www.nber.org/papers/w3914 (accessed on 15 December 2021).
  48. Dietz, T.; Rosa, E.A. Rethinking the environmental impacts of population, affluence and technology. Hum. Ecol. Rev. 1994, 1, 277–300. Available online: https://www.jstor.org/stable/24706840 (accessed on 15 December 2021).
  49. Selden, T.M.; Song, D. Environmental quality and development: Is there a Kuznets curve for air pollution emissions? J. Environ. Econ. Manag. 1994, 27, 147–162. [Google Scholar] [CrossRef]
  50. Stern, D.I.; Common, M.S.; Barbier, E.B. Economic growth and environmental degradation: The environmental Kuznets curve and sustainable development. World Dev. 1996, 24, 1151–1160. [Google Scholar] [CrossRef]
  51. Kaika, D.; Zervas, E. The Environmental Kuznets Curve (EKC) theory—Part A: Concept, causes and the CO2 emissions case. Energy Policy 2013, 62, 1392–1402. [Google Scholar] [CrossRef]
  52. Yang, L.; Xia, H.; Zhang, X.; Yuan, S. What matters for carbon emissions in regional sectors? A China study of extended STIRPAT model. J. Clean. Prod. 2018, 180, 595–602. [Google Scholar] [CrossRef]
  53. Xie, Q.; Xu, X.; Liu, X. Is there an EKC between economic growth and smog pollution in China? New evidence from semiparametric spatial autoregressive models. J. Clean. Prod. 2019, 220, 873–883. [Google Scholar] [CrossRef]
  54. He, Y.; Lin, B. Investigating environmental Kuznets curve from an energy intensity perspective: Empirical evidence from China. J. Clean. Prod. 2019, 234, 1013–1022. [Google Scholar] [CrossRef]
  55. Phuc Nguyen, C.; Schinckus, C.; Dinh Su, T. Economic integration and CO2 emissions: Evidence from emerging economies. Clim. Dev. 2020, 12, 369–384. [Google Scholar] [CrossRef]
  56. Liu, Y.; Lai, X. EKC and carbon footprint of cross-border waste transfer: Evidence from 134 countries. Ecol. Indic. 2021, 129, 107961. [Google Scholar] [CrossRef]
  57. Bibi, F.; Jamil, M. Testing environment Kuznets curve (EKC) hypothesis in different regions. Environ. Sci. Pollut. Res. 2021, 28, 13581–13594. [Google Scholar] [CrossRef] [PubMed]
  58. Du, G.; Liu, S.; Lei, N.; Huang, Y. A test of environmental Kuznets curve for haze pollution in China: Evidence from the penal data of 27 capital cities. J. Clean. Prod. 2018, 205, 821–827. [Google Scholar] [CrossRef]
  59. Zhang, S. Environmental Kuznets curve revisit in Central Asia: The roles of urbanization and renewable energy. Environ. Sci. Pollut. Res. 2019, 26, 23386–23398. [Google Scholar] [CrossRef]
  60. Jin, T.; Kim, J. Investigating the environmental Kuznets curve for Annex I countries using heterogeneous panel data analysis. Environ. Sci. Pollut. Res. 2020, 27, 10039–10054. [Google Scholar] [CrossRef]
  61. Dogan, E.; Ulucak, R.; Kocak, E.; Isik, C. The use of ecological footprint in estimating the environmental Kuznets curve hypothesis for BRICS by considering cross-section dependence and heterogeneity. Sci. Total Environ. 2020, 723, 138063. [Google Scholar] [CrossRef]
  62. Wang, M.; Arshed, N.; Munir, M.; Rasool, S.F.; Lin, W. Investigation of the STIRPAT model of environmental quality: A case of non-linear quantile panel data analysis. Environ. Dev. Sustain. 2021, 23, 12217–12232. [Google Scholar] [CrossRef]
  63. Moutinho, V.; Varum, C.; Madaleno, M. How economic growth affects emissions? An investigation of the environmental Kuznets curve in Portuguese and Spanish economic activity sectors. Energy Policy 2017, 106, 326–344. [Google Scholar] [CrossRef]
  64. Pata, U.K. The effect of urbanization and industrialization on carbon emissions in Turkey: Evidence from ARDL bounds testing procedure. Environ. Sci. Pollut. Res. 2018, 25, 7740–7747. [Google Scholar] [CrossRef]
  65. Agboola, M.O.; Bekun, F.V. Does agricultural value added induce environmental degradation? Empirical evidence from an agrarian country. Environ. Sci. Pollut. Res. 2019, 26, 27660–27676. [Google Scholar] [CrossRef] [PubMed] [Green Version]
  66. Dogan, E.; Inglesi-Lotz, R. The impact of economic structure to the environmental Kuznets curve (EKC) hypothesis: Evidence from European countries. Environ. Sci. Pollut. Res. 2020, 27, 12717–12724. [Google Scholar] [CrossRef] [PubMed]
  67. Murshed, M.; Nurmakhanova, M.; Elheddad, M.; Ahmed, R. Value addition in the services sector and its heterogeneous impacts on CO2 emissions: Revisiting the EKC hypothesis for the OPEC using panel spatial estimation techniques. Environ. Sci. Pollut. Res. 2020, 27, 38951–38973. [Google Scholar] [CrossRef]
  68. York, R.; Rosa, E.A.; Dietz, T. The ecological footprint intensity of national economies. J. Ind. Ecol. 2004, 8, 139–154. [Google Scholar] [CrossRef]
  69. Zhang, S.; Zhao, T. Identifying major influencing factors of CO2 emissions in China: Regional disparities analysis based on STIRPAT model from 1996 to 2015. Atmos. Environ. 2019, 207, 136–147. [Google Scholar] [CrossRef]
  70. Xu, F.; Huang, Q.; Yue, H.; He, C.; Wang, C.; Zhang, H. Reexamining the relationship between urbanization and pollutant emissions in China based on the STIRPAT model. J. Environ. Manag. 2020, 273, 111134. [Google Scholar] [CrossRef]
  71. Chen, Y.; Wang, Z.; Zhong, Z. CO2 emissions, economic growth, renewable and non-renewable energy production and foreign trade in China. Renew. Energy 2019, 131, 208–216. [Google Scholar] [CrossRef]
  72. Cheikh, N.B.; Zaied, Y.B.; Chevallier, J. On the non-linear relationship between energy use and CO2 emissions within an EKC framework: Evidence from panel smooth transition regression in the MENA region. Res. Int. Bus. Financ. 2021, 55, 101331. [Google Scholar] [CrossRef]
  73. Katircioglu, S.; Katircioglu, S.; Kilinc, C.C. Investigating the role of urban development in the conventional environmental Kuznets curve: Evidence from the globe. Environ. Sci. Pollut. Res. 2018, 25, 15029–15035. [Google Scholar] [CrossRef] [PubMed]
  74. Ali, H.S.; Zeqiraj, V.; Lin, W.L.; Law, S.H.; Yusop, Z.; Bare, U.A.A.; Chin, L. Does quality institutions promote environmental quality? Environ. Sci. Pollut. Res. 2019, 26, 10446–10456. [Google Scholar] [CrossRef] [PubMed] [Green Version]
  75. Salman, M.; Long, X.; Dauda, L.; Mensah, C.N. The impact of institutional quality on economic growth and carbon emissions: Evidence from Indonesia, South Korea and Thailand. J. Clean. Prod. 2019, 241, 118331. [Google Scholar] [CrossRef]
  76. Zakaria, M.; Bibi, S. Financial development and environment in South Asia: The role of institutional quality. Environ. Sci. Pollut. Res. 2019, 26, 7926–7937. [Google Scholar] [CrossRef]
  77. Khan, Z.; Ali, S.; Dong, K.; Li, R.Y.M. How does fiscal decentralization affect CO2 emissions? The roles of institutions and human capital. Energy Econ. 2021, 94, 105060. [Google Scholar] [CrossRef]
  78. Acheampong, A.O.; Adams, S.; Boateng, E. Do globalization and renewable energy contribute to carbon emissions mitigation in Sub-Saharan Africa? Sci. Total Environ. 2019, 677, 436–446. [Google Scholar] [CrossRef]
  79. Sheraz, M.; Deyi, X.; Mumtaz, M.Z.; Ullah, A. Exploring the dynamic relationship between financial development, renewable energy, and carbon emissions: A new evidence from belt and road countries. Environ. Sci. Pollut. Res. 2021, 29, 14930–14947. [Google Scholar] [CrossRef]
  80. Habiba, U.; Xinbang, C.; Ahmad, R.I. The influence of stock market and financial institution development on carbon emissions with the importance of renewable energy consumption and foreign direct investment in G20 countries. Environ. Sci. Pollut. Res. 2021, 28, 67677–67688. [Google Scholar] [CrossRef]
  81. Katircioğlu, S.T.; Taşpinar, N. Testing the moderating role of financial development in an environmental Kuznets curve: Empirical evidence from Turkey. Renew. Sustain. Energy Rev. 2017, 68, 572–586. [Google Scholar] [CrossRef]
  82. Wang, Z.; Zhang, B.; Wang, B. The moderating role of corruption between economic growth and CO2 emissions: Evidence from BRICS economies. Energy 2018, 148, 506–513. [Google Scholar] [CrossRef]
  83. Qi, S.; Peng, H.; Tan, X. The Moderating Effect of R&D investment on income and carbon emissions in China: Direct and spatial spillover insights. Sustainability 2019, 11, 1235. [Google Scholar] [CrossRef]
  84. Naz, S.; Sultan, R.; Zaman, K.; Aldakhil, A.M.; Nassani, A.A.; Abro, M.M.Q. Moderating and mediating role of renewable energy consumption, FDI inflows, and economic growth on carbon dioxide emissions: Evidence from robust least square estimator. Environ. Sci. Pollut. Res. 2019, 26, 2806–2819. [Google Scholar] [CrossRef]
  85. Gill, A.R.; Hassan, S.; Haseeb, M. Moderating role of financial development in environmental Kuznets: A case study of Malaysia. Environ. Sci. Pollut. Res. 2019, 26, 34468–34478. [Google Scholar] [CrossRef] [PubMed]
  86. Ehigiamusoe, K.U.; Lean, H.H.; Smyth, R. The moderating role of energy consumption in the carbon emissions-income nexus in middle-income countries. Appl. Energy 2020, 261, 114215. [Google Scholar] [CrossRef]
  87. Uddin, M.M.M. Does financial development stimulate environmental sustainability? Evidence from a panel study of 115 countries. Bus. Strategy Environ. 2020, 29, 2871–2889. [Google Scholar] [CrossRef]
  88. Kirikkaleli, D.; Kalmaz, D.B. Testing the moderating role of urbanization on the environmental Kuznets curve: Empirical evidence from an emerging market. Environ. Sci. Pollut. Res. 2020, 27, 38169–38180. [Google Scholar] [CrossRef]
  89. Badeeb, R.A.; Lean, H.H.; Shahbaz, M. Are too many natural resources to blame for the shape of the Environmental Kuznets Curve in resource-based economies? Resour. Policy 2020, 68, 101694. [Google Scholar] [CrossRef]
  90. Ehigiamusoe, K.U. Tourism, growth and environment: Analysis of non-linear and moderating effects. J. Sustain. Tour. 2020, 28, 1174–1192. [Google Scholar] [CrossRef]
  91. Sheraz, M.; Deyi, X.; Ahmed, J.; Ullah, S.; Ullah, A. Moderating the effect of globalization on financial development, energy consumption, human capital, and carbon emissions: Evidence from G20 countries. Environ. Sci. Pollut. Res. 2021, 28, 35126–35144. [Google Scholar] [CrossRef]
  92. Liobikienė, G.; Butkus, M. Determinants of greenhouse gas emissions: A new multiplicative approach analyzing the impact of energy efficiency, renewable energy, and sector mix. J. Clean. Prod. 2021, 309, 127233. [Google Scholar] [CrossRef]
  93. Rjoub, H.; Odugbesan, J.A.; Adebayo, T.S.; Wong, W.K. Sustainability of the moderating role of financial development in the determinants of environmental degradation: Evidence from Turkey. Sustainability 2021, 13, 1844. [Google Scholar] [CrossRef]
  94. Sharma, G.D.; Shah, M.I.; Shahzad, U.; Jain, M.; Chopra, R. Exploring the nexus between agriculture and greenhouse gas emissions in BIMSTEC region: The role of renewable energy and human capital as moderators. J. Environ. Manag. 2021, 297, 113316. [Google Scholar] [CrossRef] [PubMed]
  95. Yuan, B.; Li, C.; Yin, H.; Zeng, M. Green innovation and China’s CO2 emissions–the moderating effect of institutional quality. J. Environ. Plan. Manag. 2021, 65, 877–906. [Google Scholar] [CrossRef]
  96. Chowdhury, M.A.F.; Shanto, P.A.; Ahmed, A.; Rumana, R.H. Does foreign direct investments impair the ecological footprint? New evidence from the PQR. Environ. Sci. Pollut. Res. 2021, 28, 14372–14385. [Google Scholar] [CrossRef]
  97. Zheng, H.; Hu, J.; Wang, S.; Wang, H. Examining the influencing factors of CO2 emissions at city level via PQR: Evidence from 102 Chinese cities. Appl. Econ. 2019, 51, 3906–3919. [Google Scholar] [CrossRef]
  98. Zhu, H.; Duan, L.; Guo, Y.; Yu, K. The effects of FDI, economic growth and energy consumption on carbon emissions in ASEAN-5: Evidence from panel quantile regression. Econ. Model. 2016, 58, 237–248. [Google Scholar] [CrossRef] [Green Version]
  99. Wang, S.; Zeng, J.; Liu, X. Examining the multiple impacts of technological progress on CO2 emissions in China: A panel quantile regression approach. Renew. Sustain. Energy Rev. 2019, 103, 140–150. [Google Scholar] [CrossRef]
  100. Haans, R.F.; Pieters, C.; He, Z.L. Thinking about U: Theorizing and testing U-and inverted U-shaped relationships in strategy research. Strateg. Manag. J. 2016, 37, 1177–1195. [Google Scholar] [CrossRef]
  101. Lind, J.T.; Mehlum, H. With or without U? The appropriate test for a U-shaped relationship. Oxf. Bull. Econ. Stat. 2010, 72, 109–118. [Google Scholar] [CrossRef] [Green Version]
  102. Dawson, J.F. Moderation in management research: What, why, when, and how. J. Bus. Psychol. 2014, 29, 1–19. [Google Scholar] [CrossRef]
  103. Koenker, R.; Bassett, G., Jr. Regression quantiles. Econom. J. Econom. Soc. 1978, 46, 33–50. Available online: https://www.jstor.org/stable/1913643 (accessed on 20 December 2021). [CrossRef]
  104. Powell, D. Quantile Regression with Nonadditive Fixed Effects. RAND Labor Popul. Work. Pap. 2015, 1–28. [Google Scholar] [CrossRef]
  105. Baker, M.; Powell, D.; Smith, T.A. QREGPD: Stata Module to Perform Quantile Regression for Panel Data. 2016. Available online: https://econpapers.repec.org/software/bocbocode/S458157.htm (accessed on 20 December 2021).
  106. Khan, H.; Khan, I.; Binh, T.T. The heterogeneity of renewable energy consumption, carbon emission and financial development in the globe: A PQR approach. Energy Rep. 2020, 6, 859–867. [Google Scholar] [CrossRef]
  107. Bhowmik, R.; Rahut, D.B.; Syed, Q.R. Investigating the Impact of Climate Change Mitigation Technology on the Transport Sector CO2 Emissions: Evidence from Panel Quantile Regression. Front. Environ. Sci. 2022, 10, 916356. [Google Scholar] [CrossRef]
Figure 1. Theoretical Framework (Inverted U-Shaped EKC).
Ijerph 20 00293 g001
Figure 2. Theoretical Framework (U-shaped EKC).
Ijerph 20 00293 g002
Figure 3. Interaction of Transportation Competitiveness for Services’ EKC.
Ijerph 20 00293 g003
Table 1. Study Variables.
Abbreviation of VariablesFull Name of VariablesData Sources
CO2Log of Transportation Sector CO2 Emissions (Mt/Capita)EDGAR *
SVCLog of Services Value AddedWDI **
SVC2Log of Square of Services Value AddedWDI **
PDENLog of Population DensityWDI **
TCTransportation Competitiveness IndexWEF ***
INSTInstitutional Quality IndexICRG ****
* Emissions Database for Global Atmospheric Research (EDGAR); ** World Development Indicators (WDI); *** World Economic Forum (WEF); **** International Country Risk Guide (ICRG).
Table 2. Descriptive indicators/Statistics of the Study Variables.
VariablesCO2SVCTCINSTPDEN
N13311288128212821331
Mean2.00403.98284.22144.12994.3050
Median (P50)1.87804.01884.22173.92274.4557
SD1.89780.21941.20300.89041.4328
IQR2.41830.26211.82831.38811.7611
Range10.21191.48585.25583.72758.4541
P250.77983.86913.29113.41803.4813
P753.19824.13125.11944.80625.2425
Skewness0.1539-0.96900.08680.5314-0.1784
Kurtosis2.85884.31752.16172.27693.5289
Table 3. VIF Matrix for Study Variables.
CO2SVCTCINSTPDEN
CO2-----
SVC1.0870-
TC1.13661.2745---
INST1.06251.16363.2059--
PDEN1.00081.06951.03031.0099-
Table 4. Skewness/Kurtosis Tests for Normality.
VariablesObservationsPr (Skewness)Pr (Kurtosis)Adj. Chi2Prob. > Chi2
CO213310.02190.29836.310.0426
SVC12880.00000.0000-0.0000
TC12820.20250.0000-0.0000
INST12820.00000.0000-0.0000
PDEN13310.00800.001116.120.0003
Table 5. Estimation of PQR Results for four Quantile Groups (Dependent Variable: lnCO2).
VariablesQuantile Category/Group-1
(Low CO2)
Quantile Category/Group-2
(Low Medium CO2)
Coefficientp-ValuesCoefficientp-Values
SVC2.56360.0000 *−22.26970.0000 *
SVC20.27970.0050 *2.77480.0000 *
SVC × TC−0.79150.0000 *0.12660.0020 *
SVC2 × TC−0.03040.0000 *0.00530.0000 *
TC4.26210.0000 *−0.62380.0000 *
INST−0.38460.0000 *−0.16950.0000 *
PDEN−0.21070.0000 *0.01780.2390
VariablesQuantile Category/Group-3
(High Medium CO2)
Quantile Category/Group-4
(High CO2)
Coefficientp-ValuesCoefficientp-Values
SVC4.33410.0680 ***−45.33590.0000 *
SVC2−0.30260.22305.63230.0000 *
SVC × TC−0.29030.0080 *0.59130.0000 *
SVC2 × TC0.00860.0000 *−0.05040.0000 *
TC0.85630.0510 ***−0.52560.4160
INST−0.02950.0140 **0.11250.0220 **
PDEN−0.09970.0000 *−0.09290.0000 *
*, **, and *** show levels of significance at 1%, 5%, and 10%, respectively.
Table 6. Moderation (Transportation Competitiveness) for Observing Changes in EKC.
Quantile GroupsCategoryShape of EKCChanges in Turning PointFlattening/Steepening
Group-1Low CO2Not Validated--
Group-2Low Medium CO2U-ShapedLeftSteepening
Group-3High Medium CO2Not Validated--
Group-4High CO2U-ShapedLeftFlattening
Disclaimer/Publisher’s Note: The statements, opinions and data contained in all publications are solely those of the individual author(s) and contributor(s) and not of MDPI and/or the editor(s). MDPI and/or the editor(s) disclaim responsibility for any injury to people or property resulting from any ideas, methods, instructions or products referred to in the content.

