
Ecological and Health Risk Assessments of Heavy Metals Contained in Sediments of Polish Dam Reservoirs


Abstract
:1. Introduction
2. Materials and Methods
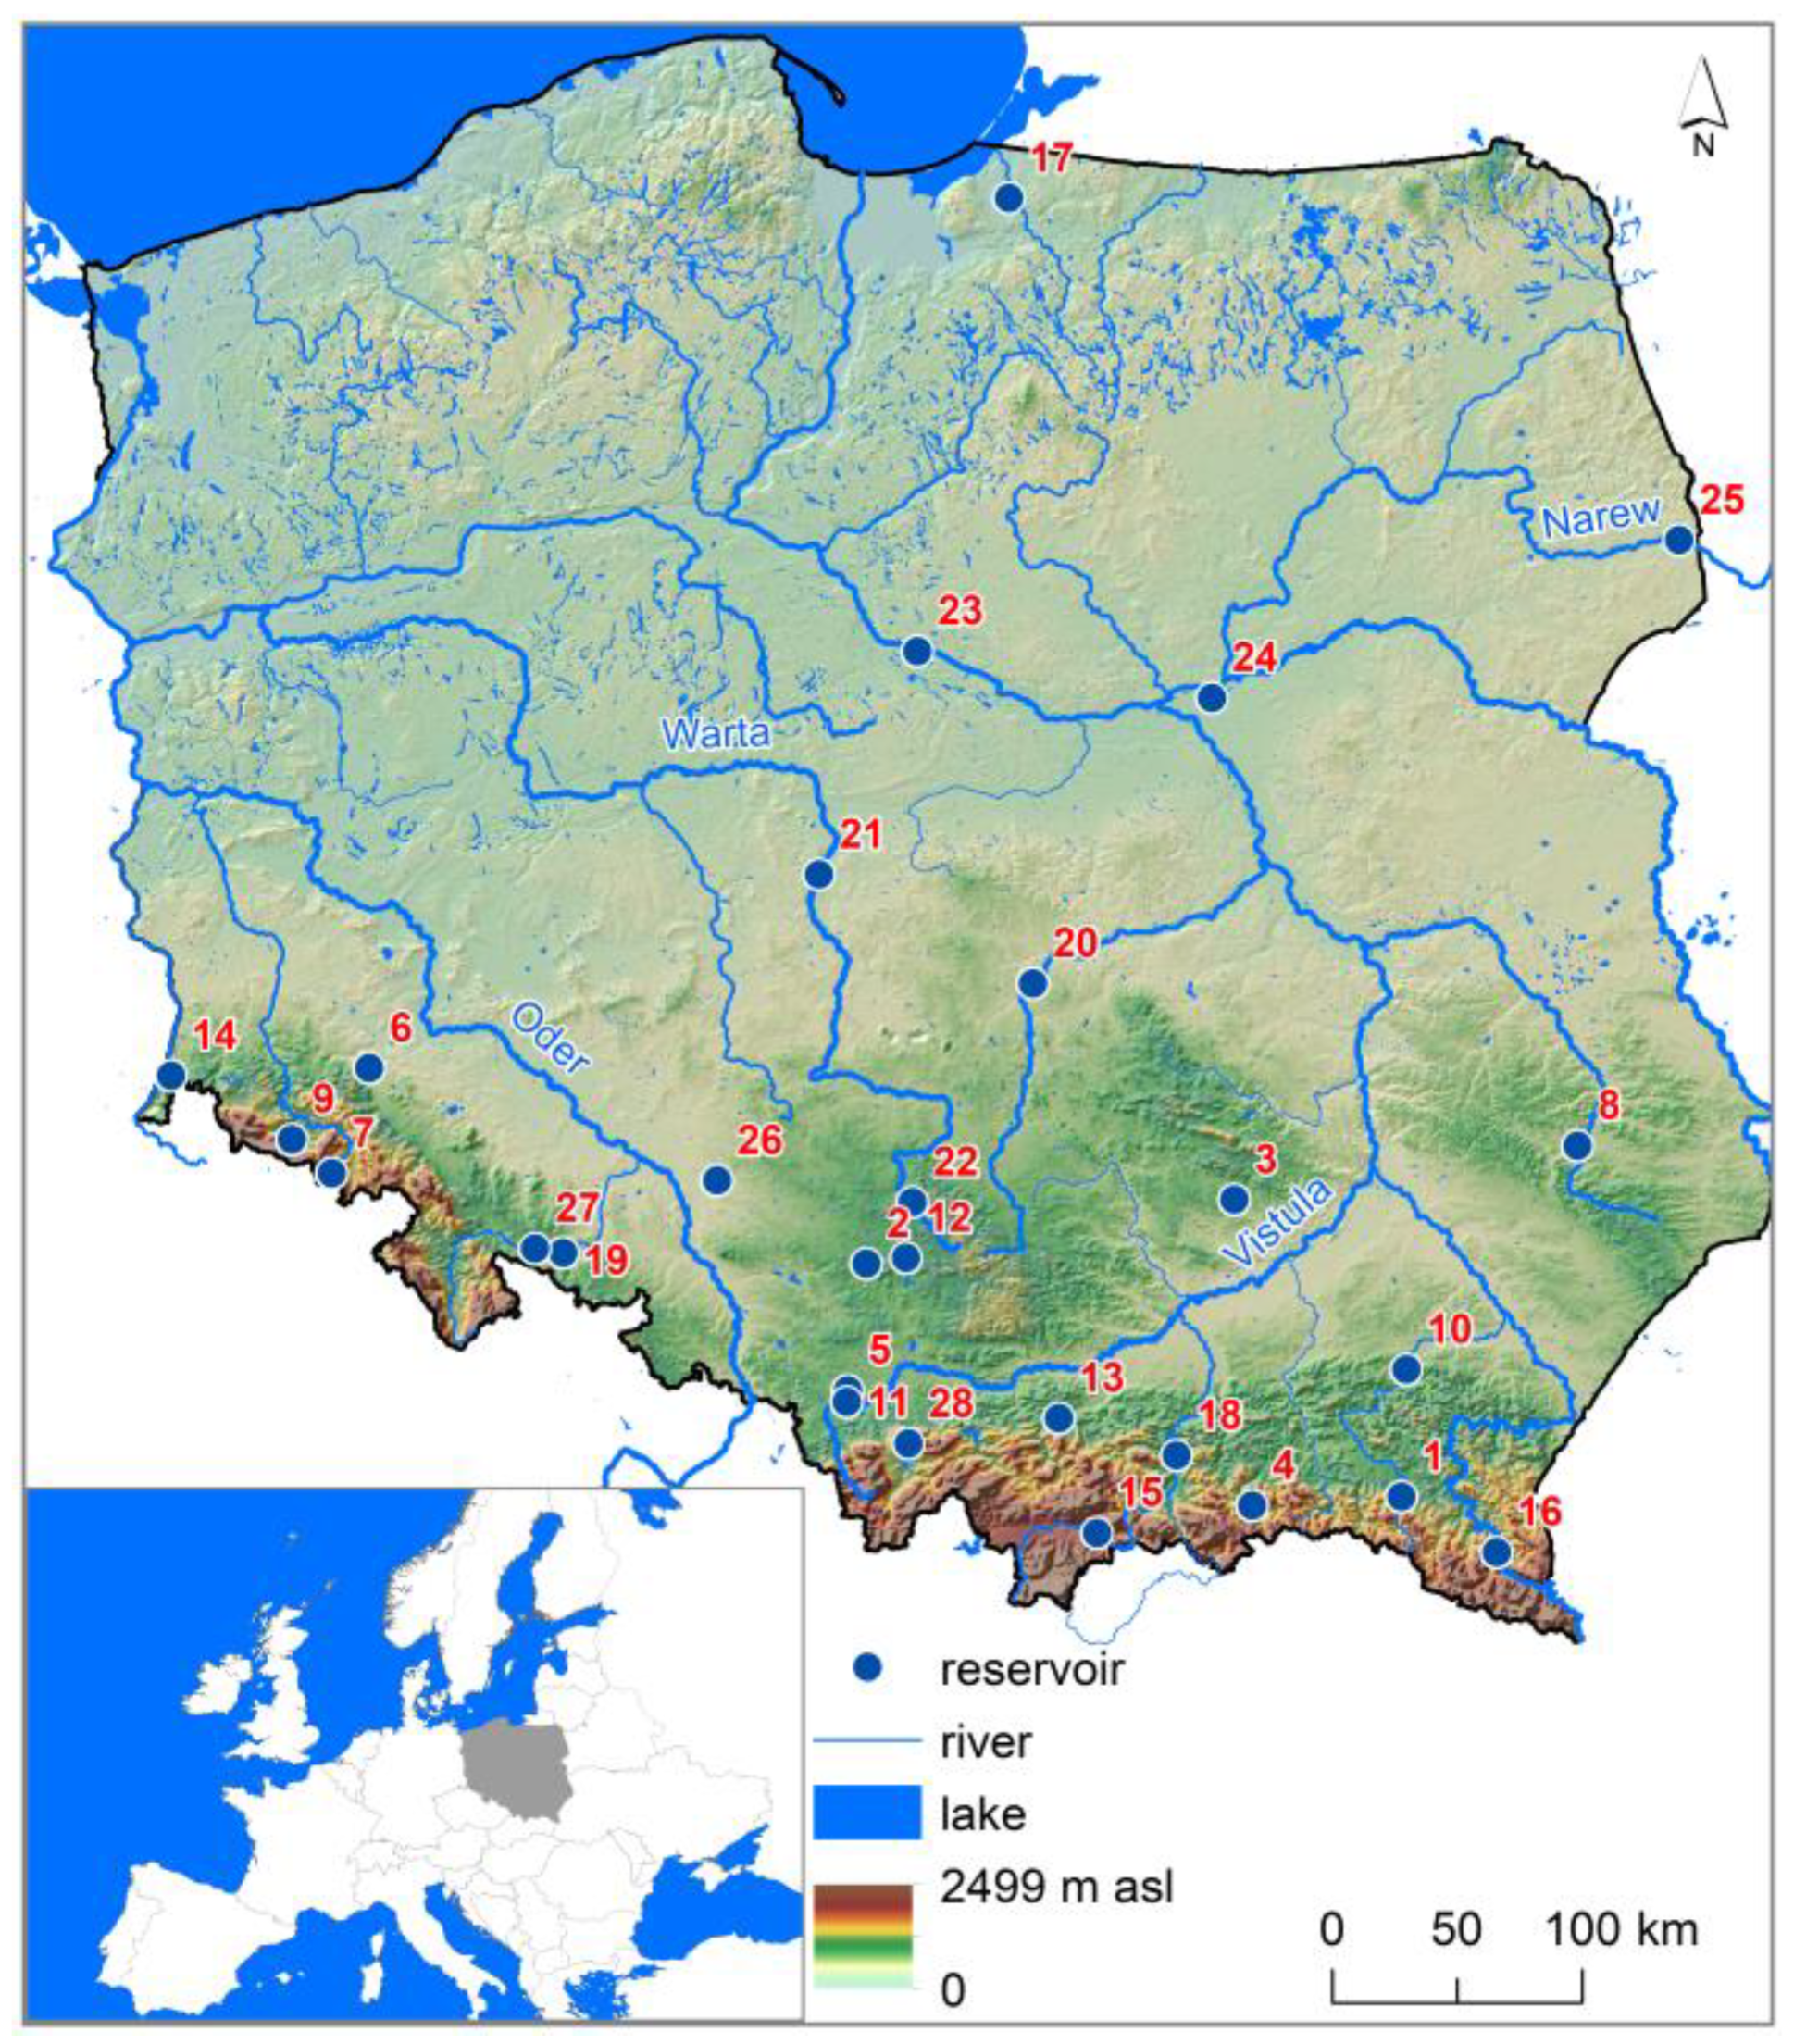
2.1. Study Site Description
2.2. Materials
2.3. Methods
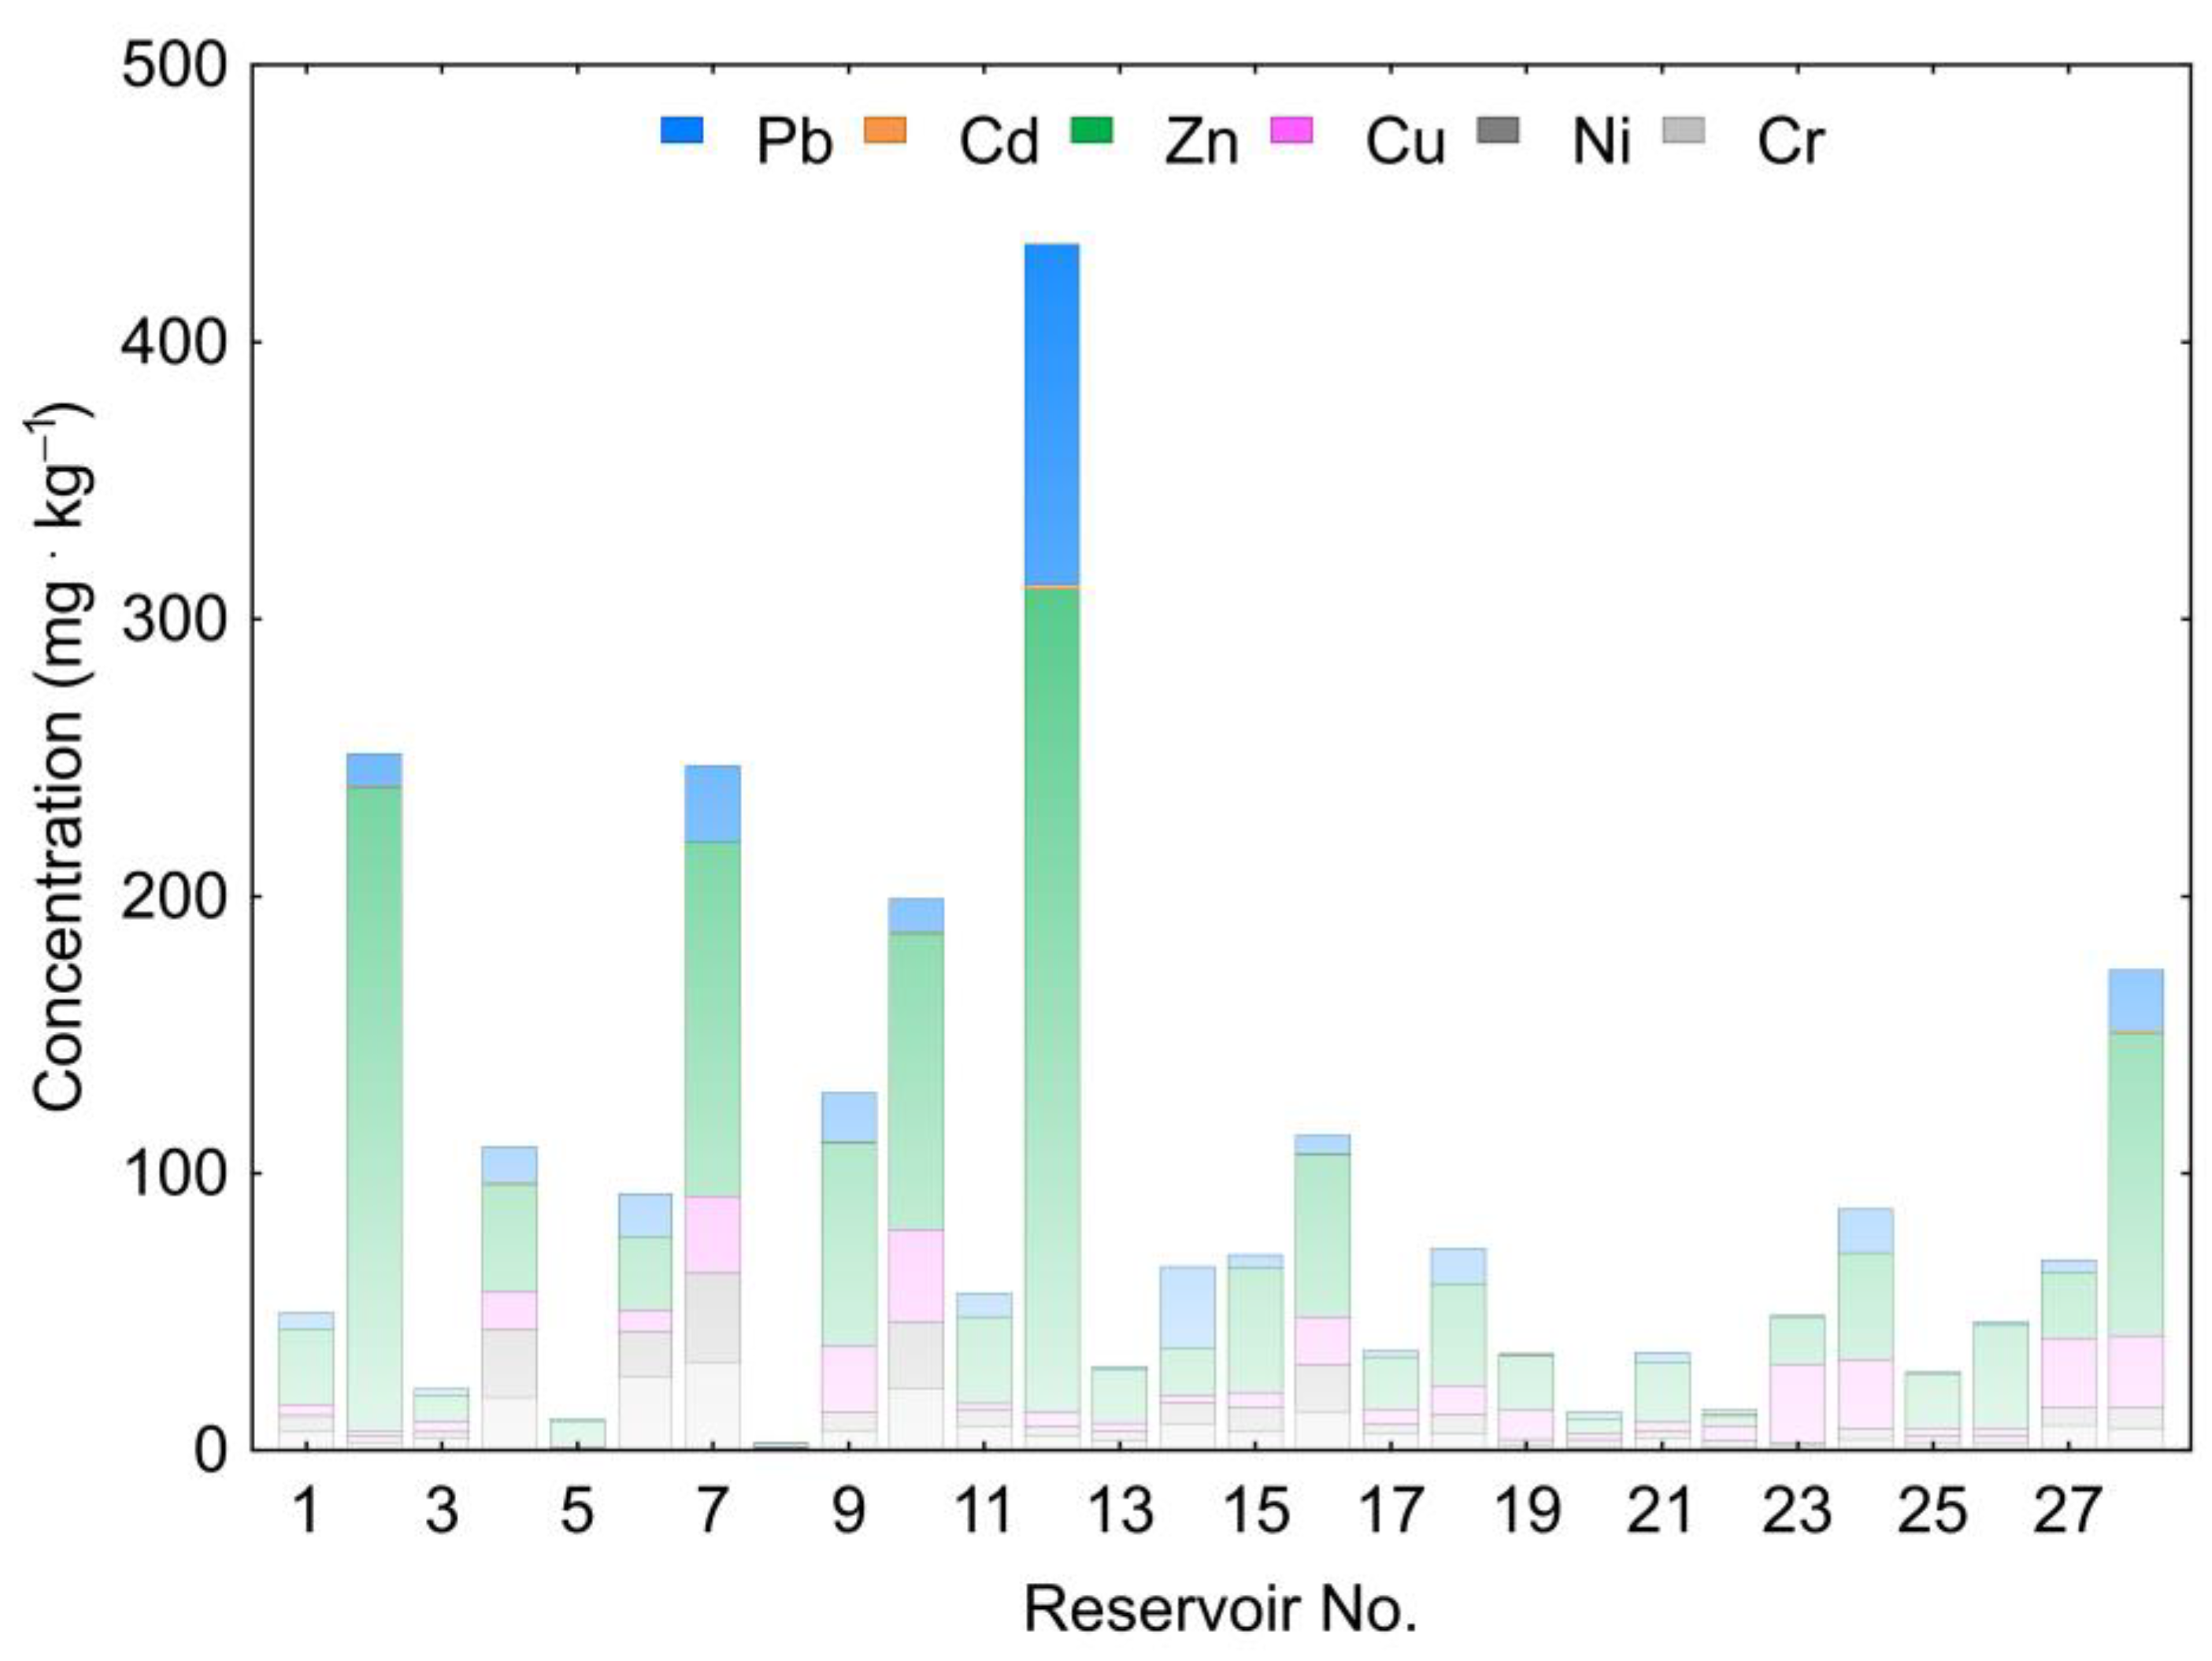
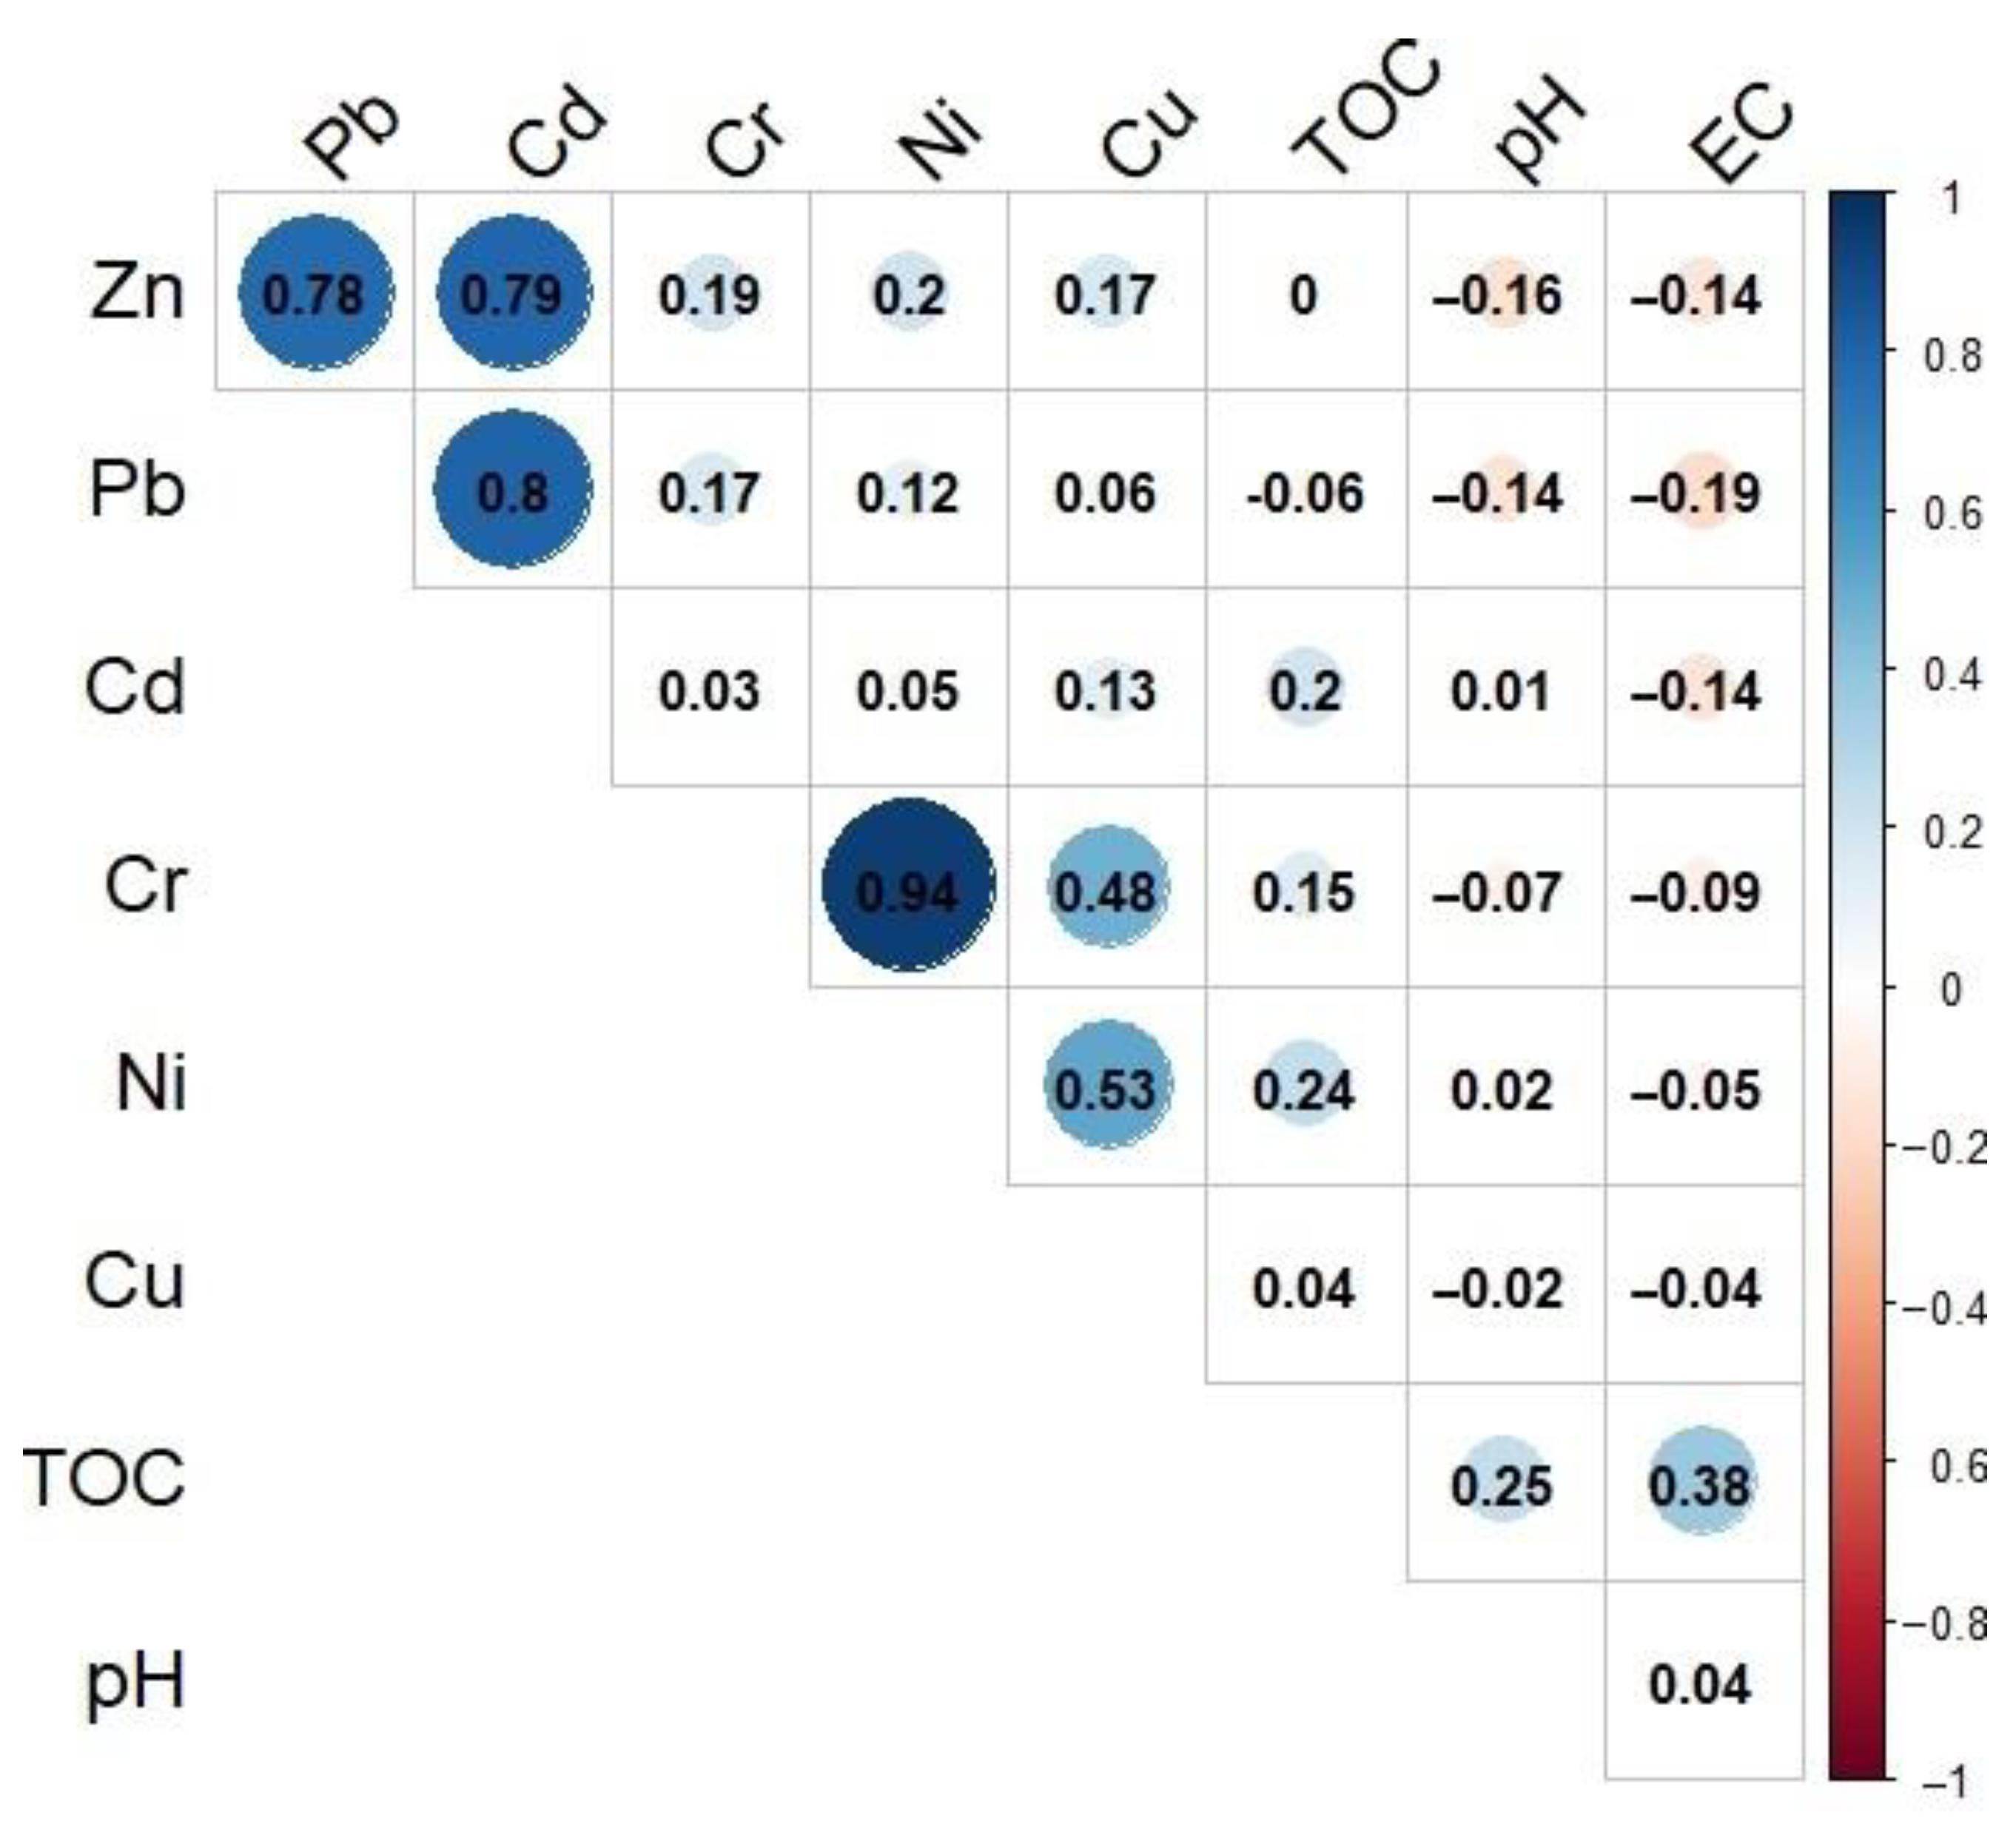
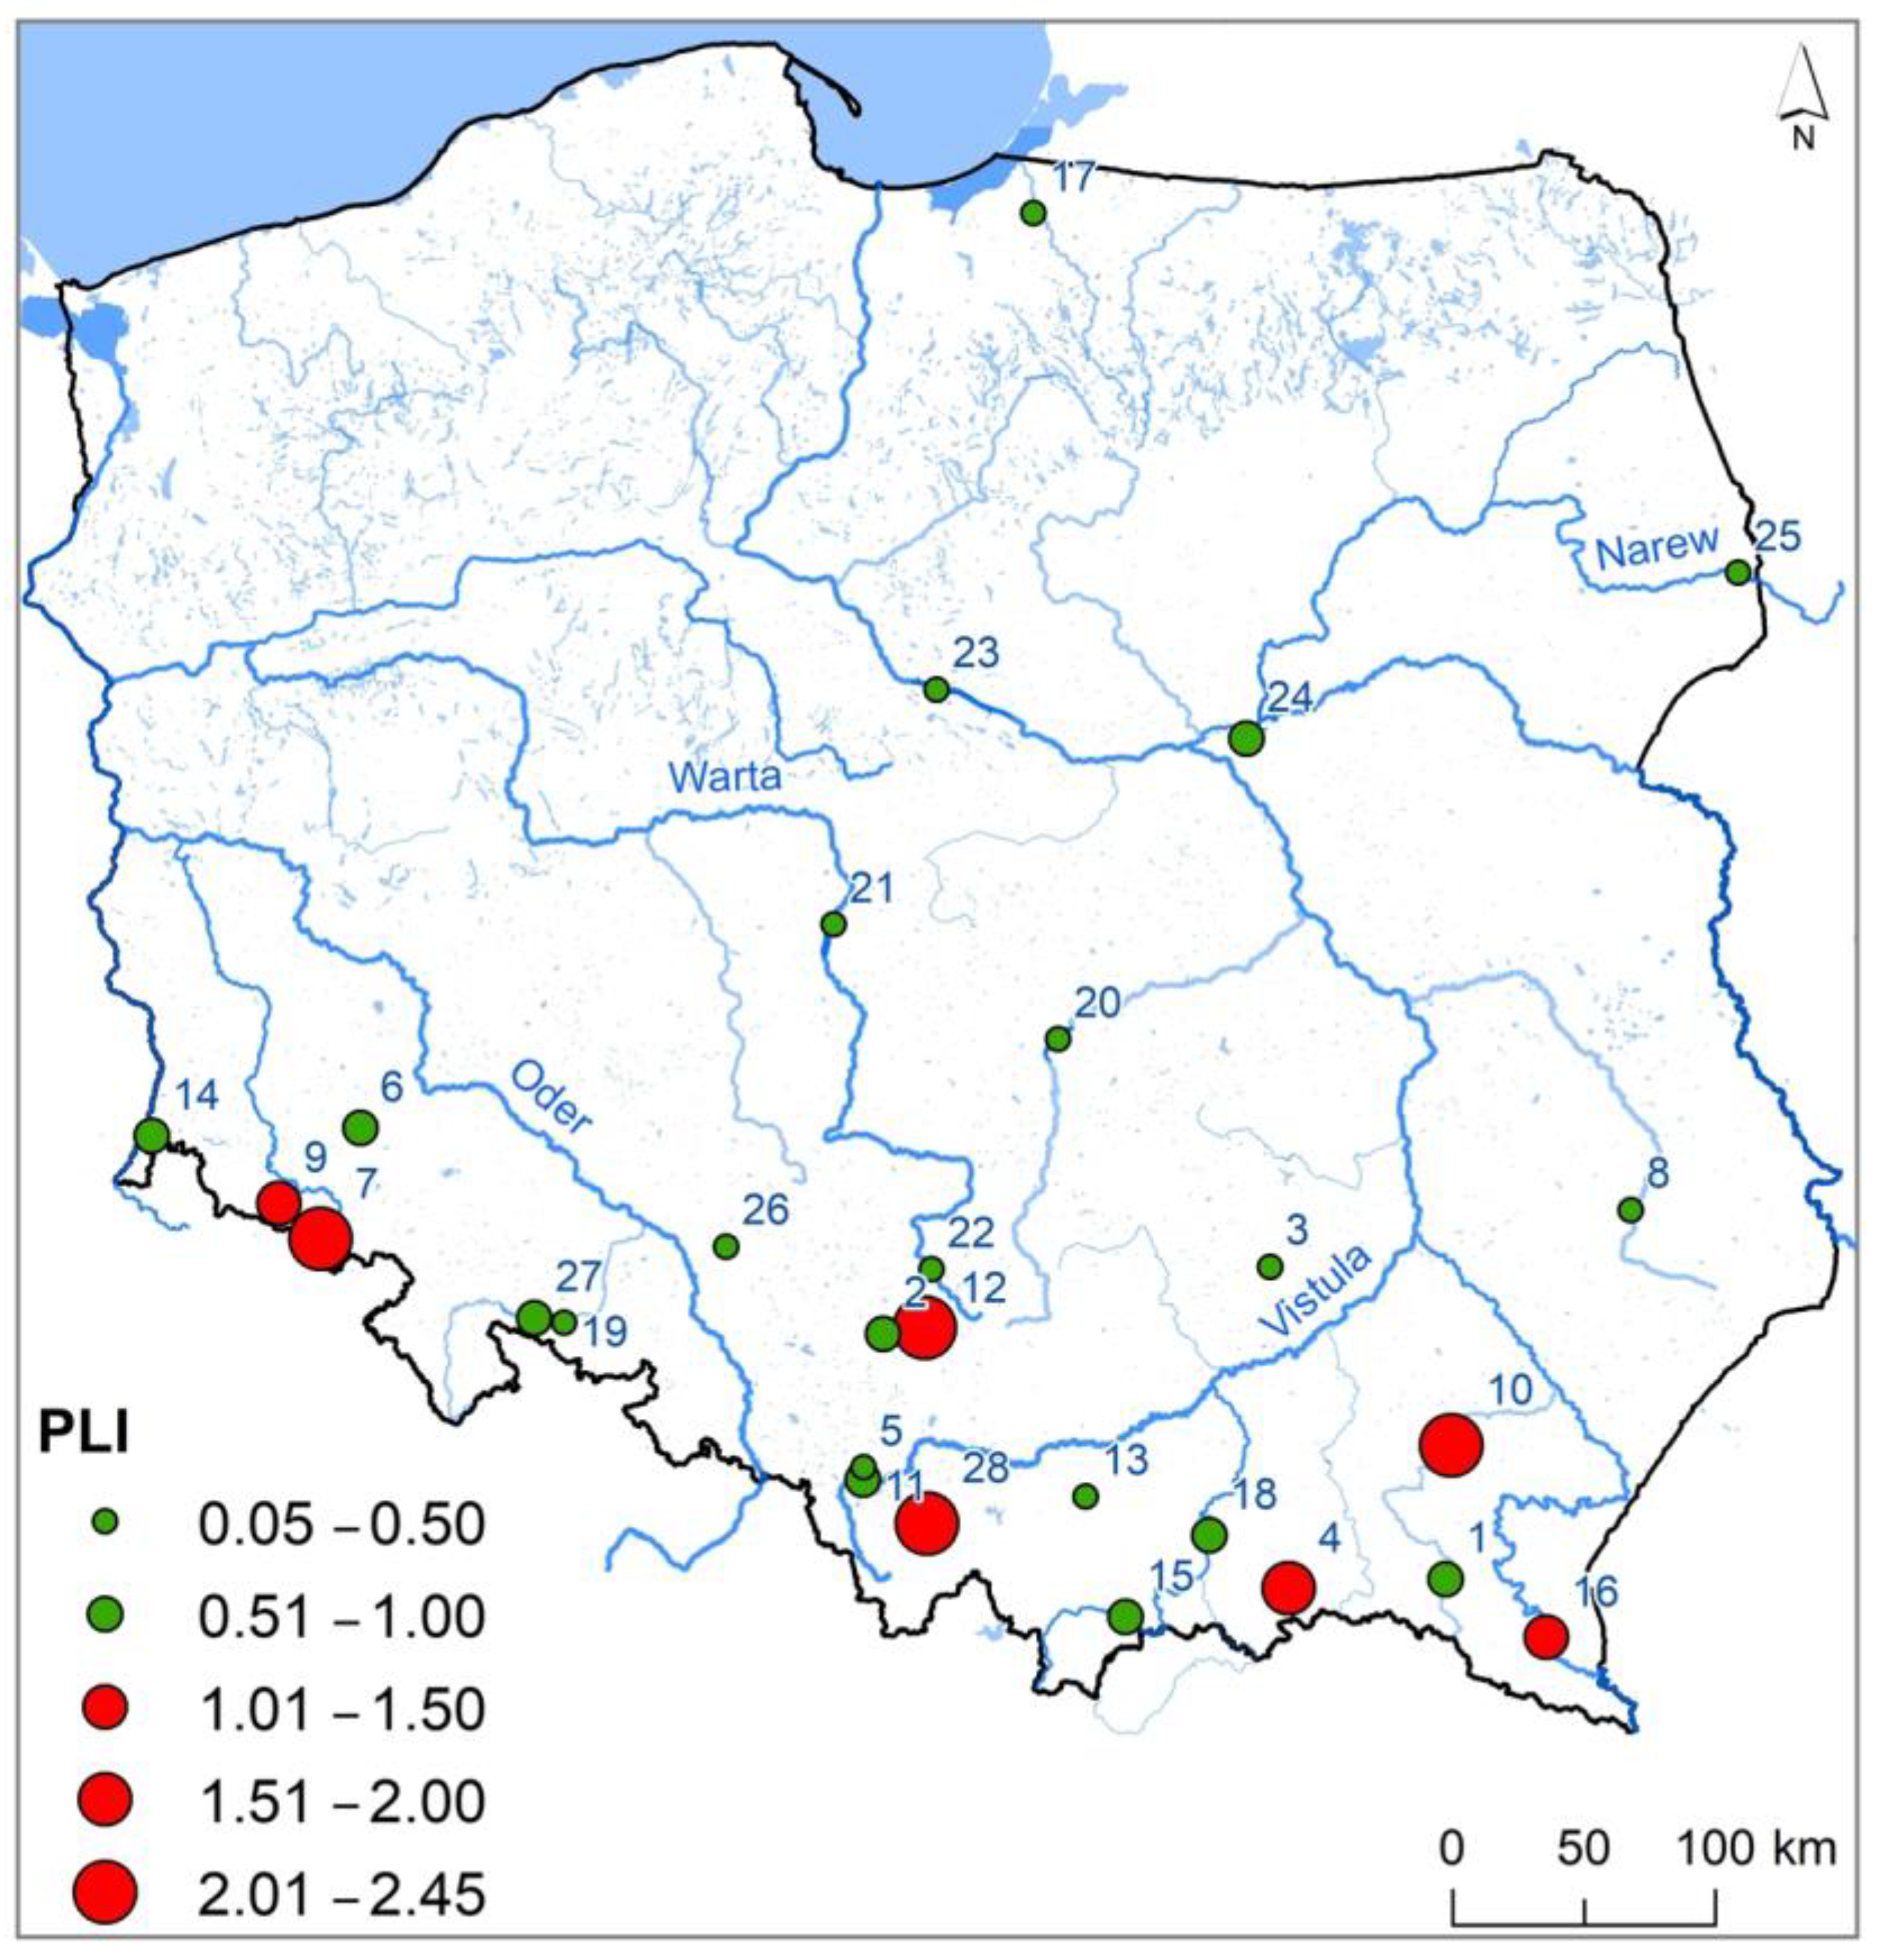
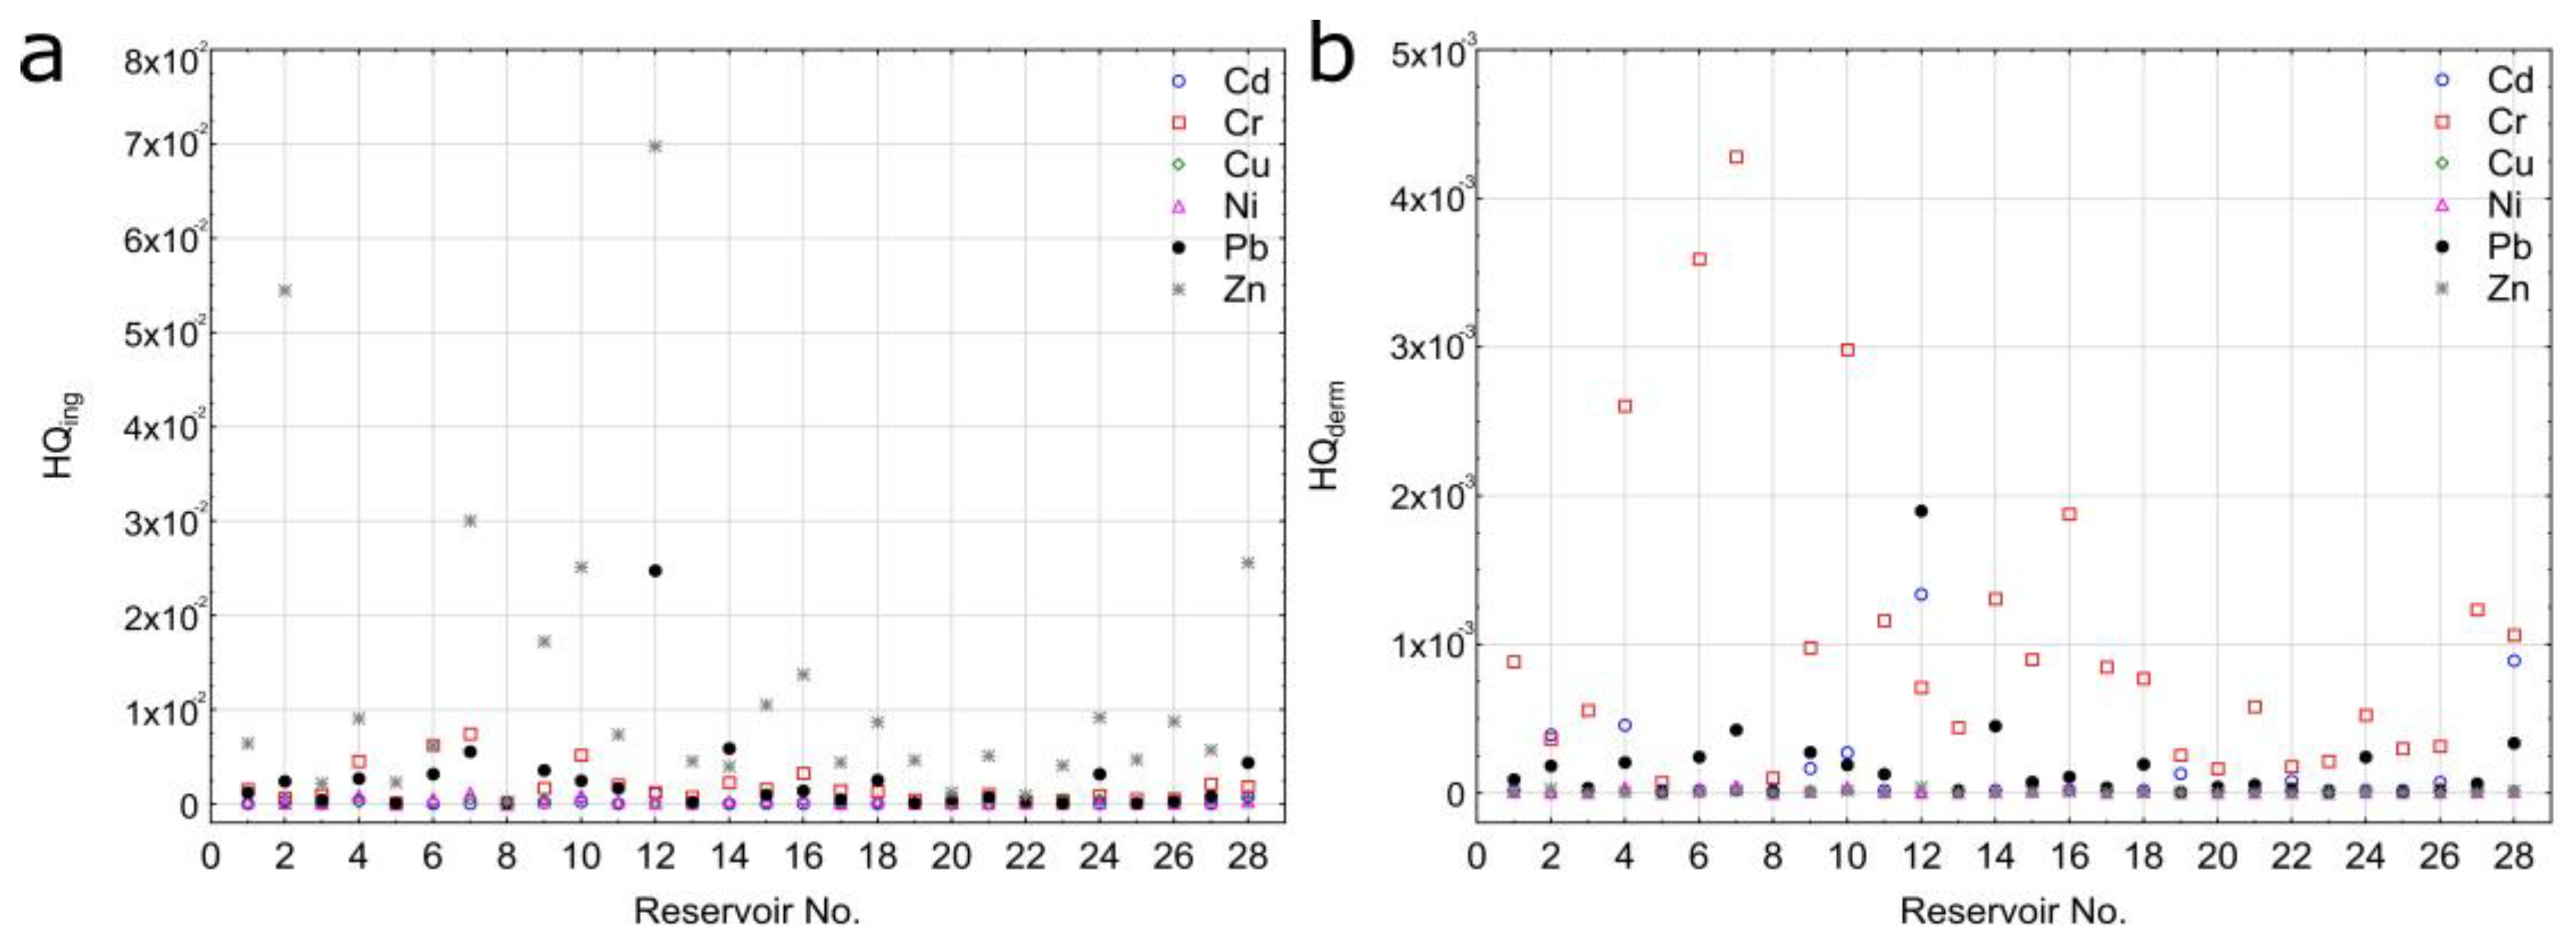
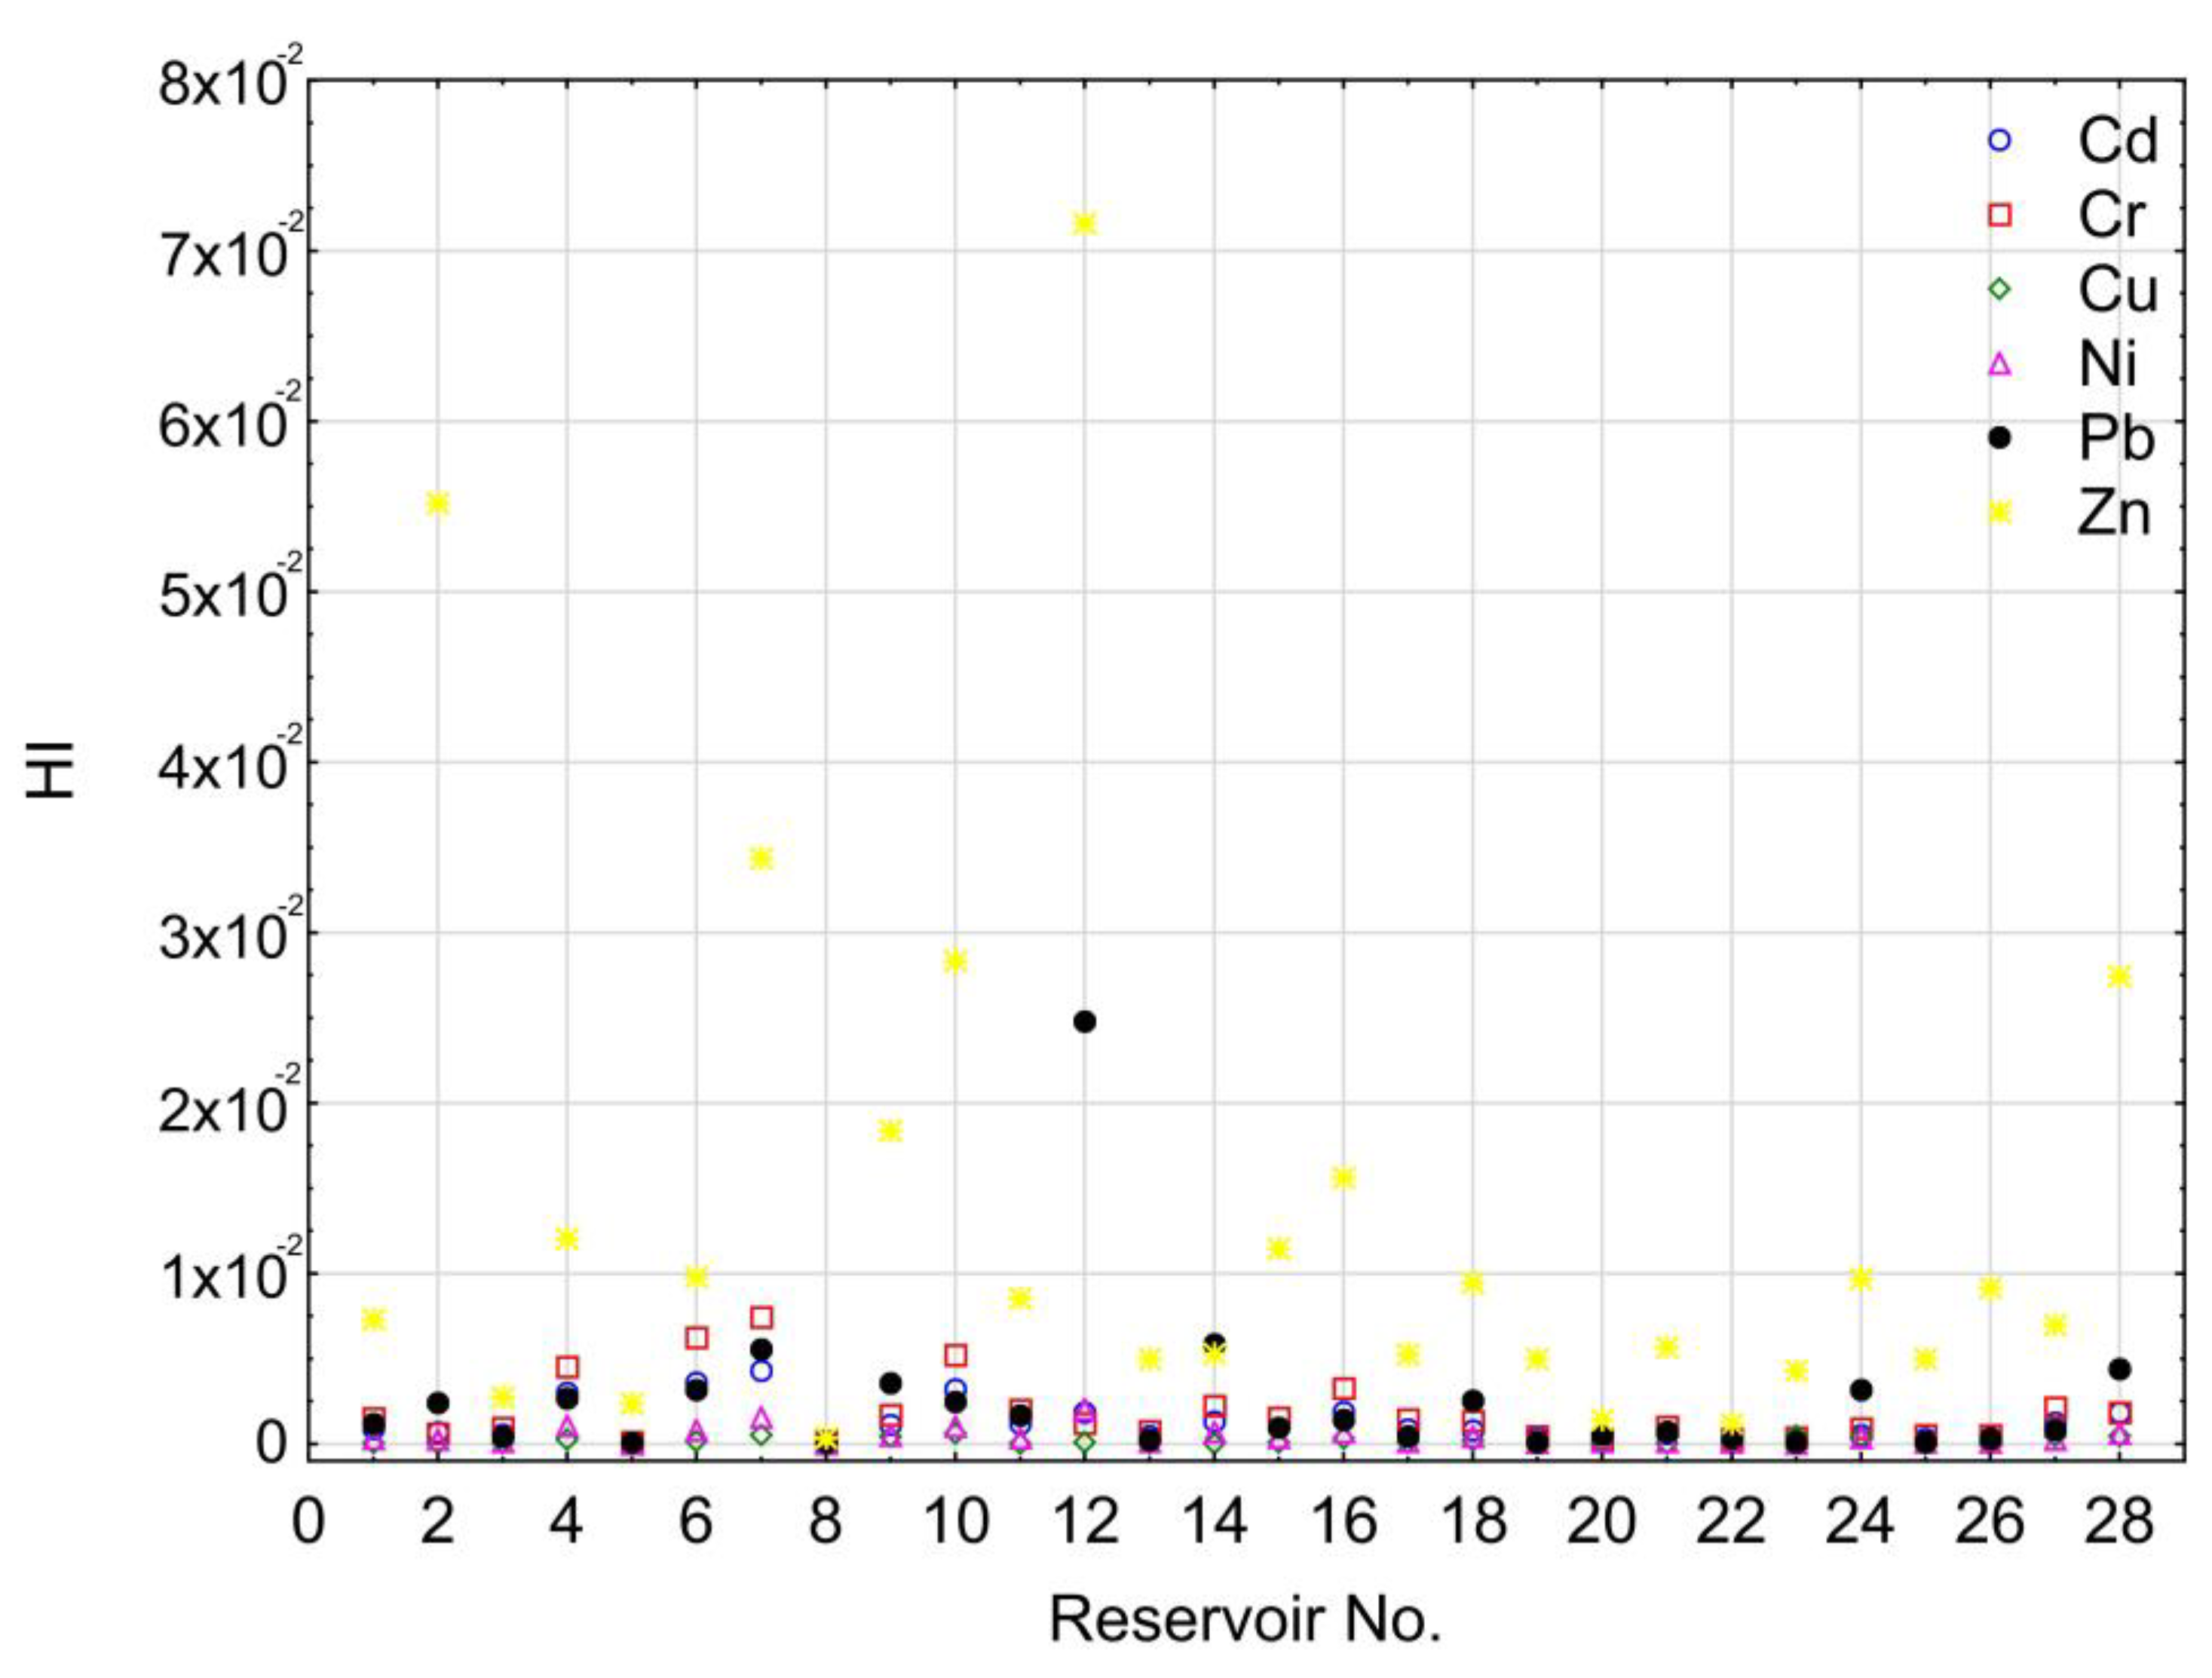
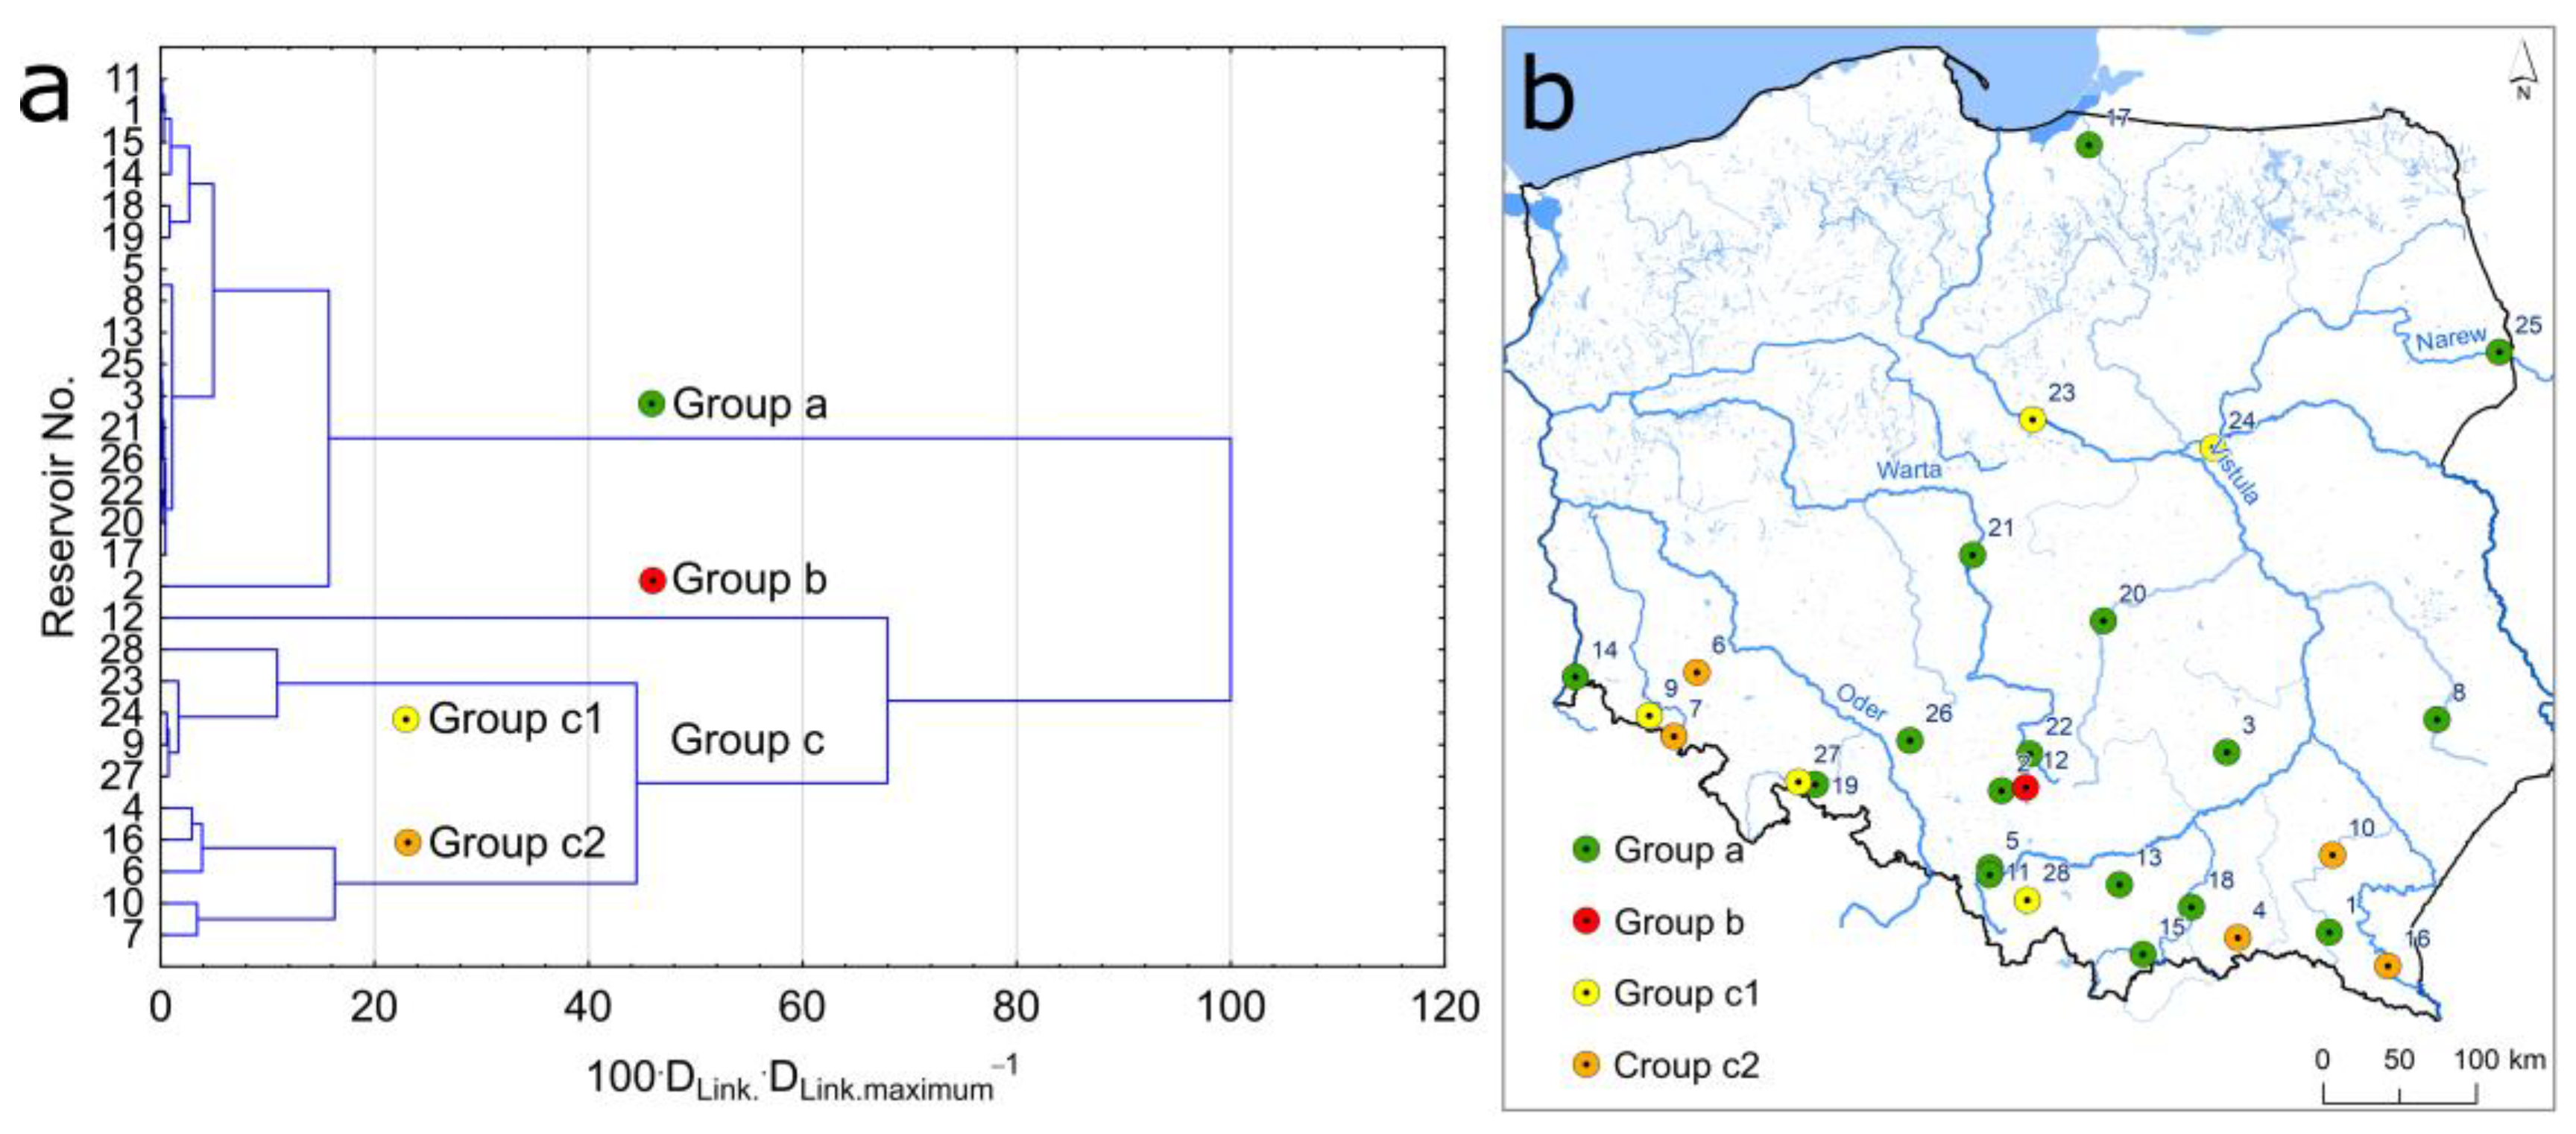
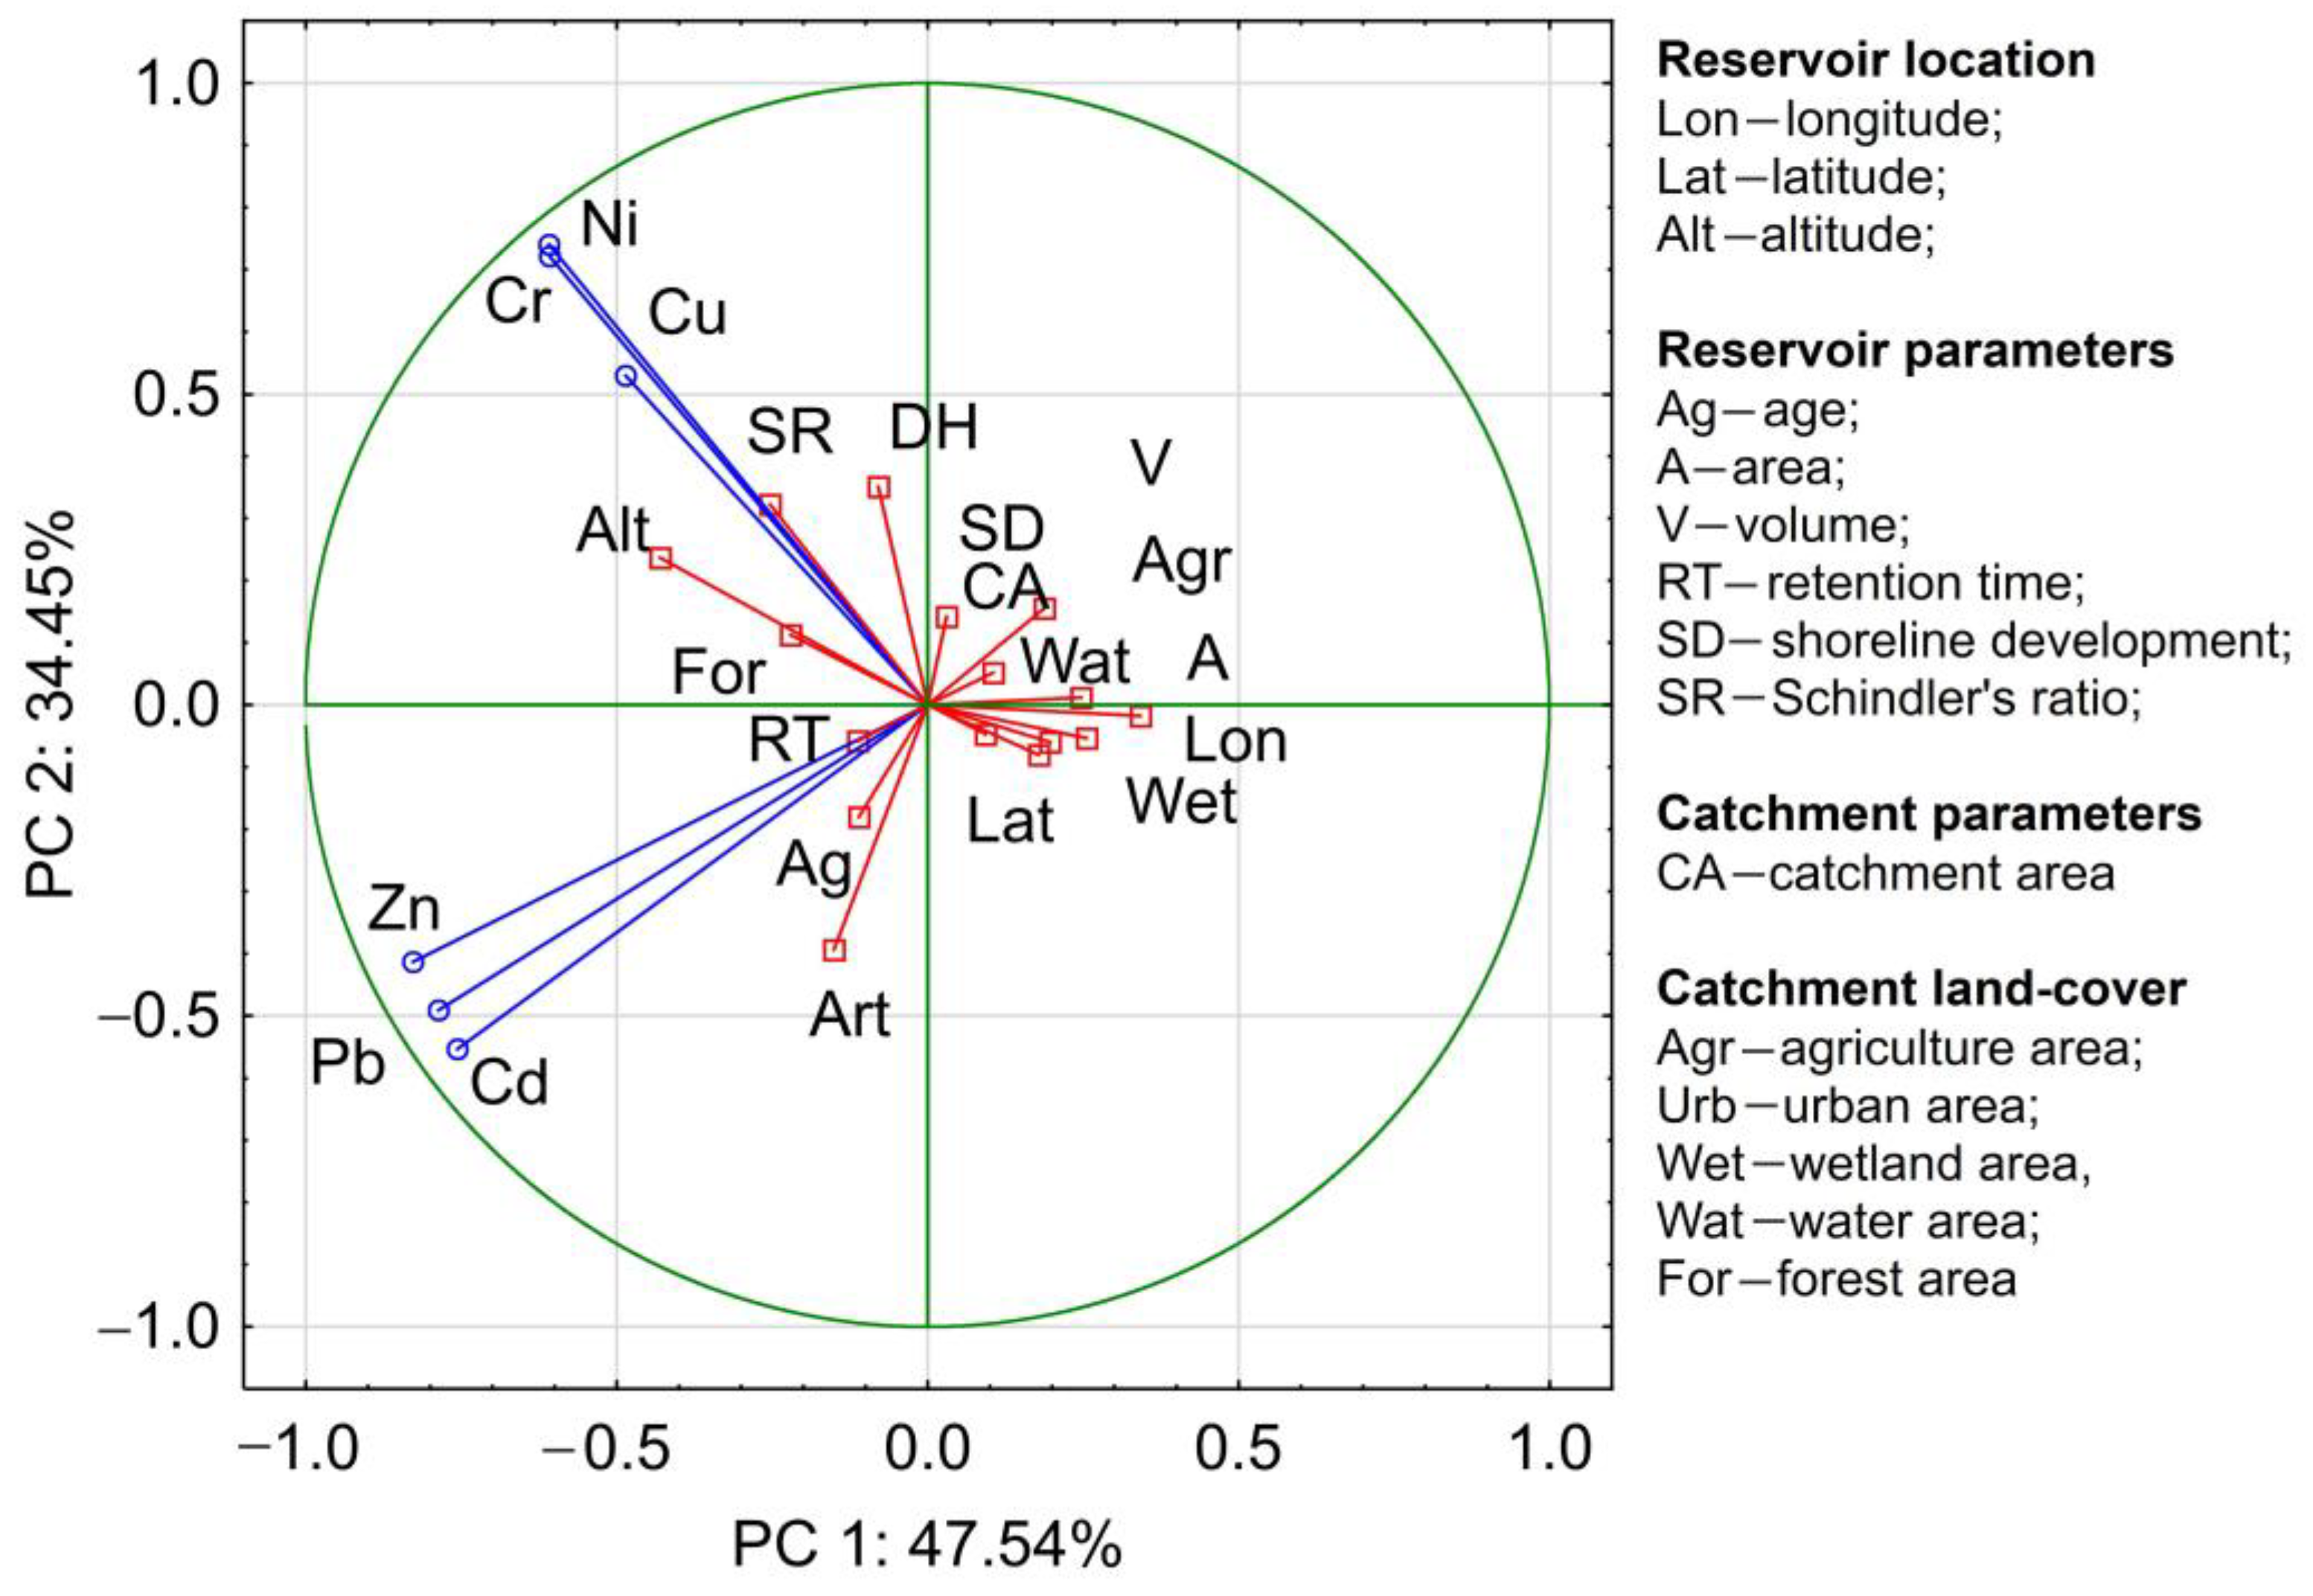
3. Results
4. Discussion
5. Conclusions
- Pollution load index values suggest that bottom sediments in seven reservoirs were polluted. Moreover, in the other 12 reservoirs, contamination factor values point to pollution with individual HMs, primarily Cr, Ni, Cu, and Pb.
- Ecological risk (ER) index values showed a potentially toxic effect on aquatic organisms due to high Cd and Pb concentrations only in two reservoirs.
- Hazard index values for all the analyzed HMs were lower than one due to no carcinogenic risk for dredging workers. It was evidenced that ingestion of HMs leads to a greater risk for dredging workers.
- In terms of the distribution and magnitude of concentrations, the analyzed reservoirs can be divided into two groups. The exception is the Przeczyce Reservoir, having much higher Pb, Zn, and Cd values.
- Reservoirs where bottom sediments showed higher HMs concentrations are dispersed, suggesting the dominant role of local sources. For the Słup, Bukówka, and Sosnówka Reservoirs, HM concentrations can be determined by factors with a regional range.
- The analyzed HMs were divided into two groups, one including Pb, Zn, and Cd; and the other, Cr, Ni, and Cu. This points to the analogical sources of their supply and factors responsible for their transport and accumulation in bottom sediments.
- The analysis showed that Pb, Zn, and Cd concentrations are higher in older reservoirs located in the catchment with a greater proportion of artificial areas. Ni, Cu, and Cr concentrations are higher in reservoirs located in the south of Poland and those with higher Schindler’s ratios.
Supplementary Materials
Author Contributions
Funding
Institutional Review Board Statement
Informed Consent Statement
Data Availability Statement
Acknowledgments
Conflicts of Interest
References
- Bakken, T.H.; Modahl, I.S.; Raadal, H.L.; Bustos, A.A.; Arnøy, S. Allocation of water consumption in multipurpose reservoirs. Water Policy 2016, 18, 932–947. [Google Scholar] [CrossRef] [Green Version]
- Nowak, B.; Ptak, M.; Szyga-Pluta, K.; Sojka, M. Influence of the Jeziorsko dam reservoir on water flow in the Warta River. Buildings 2022, 12, 1624. [Google Scholar] [CrossRef]
- Sojka, M.; Jaskuła, J.; Wicher-Dysarz, J.; Dysarz, T. Analysis of selected reservoirs functioning in the Wielkopolska region. Acta Sci. Pol. Form. Circumiectus 2017, 16, 205–215. [Google Scholar] [CrossRef]
- Branche, E. The multipurpose water uses of hydropower reservoir: The SHARE concept. Comptes Rendus Phys. 2017, 18, 469–478. [Google Scholar] [CrossRef]
- Nowak, B.; Andrzejak, A.; Filipiak, G.; Ptak, M.; Sojka, M. Assessment of the impact of flow changes and water management rules in the dam reservoir on energy generation at the Jeziorsko hydropower plant. Energies 2022, 15, 7695. [Google Scholar] [CrossRef]
- Zhu, H.; Bing, H.; Wu, Y.; Zhou, J.; Sun, H.; Wang, J.; Wang, X. The spatial and vertical distribution of heavy metal contamination in sediments of the Three Gorges Reservoir determined by anti-seasonal flow regulation. Sci. Total Environ. 2019, 664, 79–88. [Google Scholar] [CrossRef]
- Li, X.; Bing, J.; Zhang, J.; Guo, L.; Deng, Z.; Wang, D.; Liu, L. Ecological risk assessment and sources identification of heavy metals in surface sediments of a river–reservoir system. Sci. Total Environ. 2022, 842, 156683. [Google Scholar] [CrossRef]
- Yang, R.; Wu, S.; Wu, X.; Ptak, M.; Li, X.; Sojka, M.; Graf, R.; Dai, J.; Zhu, S. Quantifying the impacts of climate variation, damming and flow regulation on river thermal dynamics: A case study of the Włocławek Reservoir in the Vistula River, Poland. Environ. Sci. Eur. 2022, 34, 1–11. [Google Scholar] [CrossRef]
- Zhao, X.; Gao, B.; Xu, D.; Gao, L.; Yin, S. Heavy metal pollution in sediments of the largest reservoir (Three Gorges Reservoir) in China: A review. Environ. Sci. Pollut. Res. 2017, 24, 20844–20858. [Google Scholar] [CrossRef]
- Frémion, F.; Bordas, F.; Mourier, B.; Lenain, J.F.; Kestens, T.; Courtin-Nomade, A. Influence of dams on sediment continuity: A study case of natural metallic contamination. Sci. Total Environ. 2016, 547, 282–294. [Google Scholar] [CrossRef]
- Sojka, M.; Siepak, M.; Jaskuła, J.; Wicher-Dysarz, J. Heavy Metal Transport in a River-Reservoir System: A Case Study from Central Poland. Pol. J. Environ. Stud. 2018, 27, 1725–1734. [Google Scholar] [CrossRef] [PubMed]
- Gao, L.; Gao, B.; Xu, D.; Peng, W.; Lu, J. Multiple assessments of trace metals in sediments and their response to the water level fluctuation in the Three Gorges Reservoir, China. Sci. Total Environ. 2019, 648, 197–205. [Google Scholar] [CrossRef] [PubMed]
- Ustaoğlu, F.; Tepe, Y.; Aydin, H. Heavy metals in sediments of two nearby streams from Southeastern Black Sea coast: Contami-nation and ecological risk assessment. Environ. Forensics 2020, 21, 145–156. [Google Scholar] [CrossRef]
- Varol, M.; Ustaoğlu, F.; Tokatli, C. Ecological risks and controlling factors of trace elements in sediments of dam lakes in the Black Sea Region (Turkey). Environ. Res. 2022, 205, 112478. [Google Scholar] [CrossRef]
- Tepe, Y.; Şimşek, A.; Ustaoğlu, F.; Taş, B. Spatial–temporal distribution and pollution indices of heavy metals in the Turnasuyu Stream sediment, Turkey. Environ. Monit. Assess. 2022, 194, 818. [Google Scholar] [CrossRef] [PubMed]
- Yüksel, B.; Ustaoğlu, F.; Tokatli, C.; Islam, M.S. Ecotoxicological risk assessment for sediments of Çavuşlu stream in Giresun, Turkey: Association between garbage disposal facility and metallic accumulation. Environ. Sci. Pollut. Res. 2022, 29, 17223–17240. [Google Scholar] [CrossRef] [PubMed]
- Cüce, H.; Kalipci, E.; Ustaoğlu, F.; Dereli, M.A.; Türkmen, A. Integrated Spatial Distribution and Multivariate Statistical Analysis for Assessment of Ecotoxicological and Health Risks of Sediment Metal Contamination, Ömerli Dam (Istanbul, Turkey). Water Air Soil Pollut. 2022, 233, 1–21. [Google Scholar] [CrossRef]
- Jagus, A.; Khak, V.; Rzetala, M.A.; Rzetala, M. Accumulation of heavy metals in the bottom sediments of the Irkutsk Reservoir. Int. J. Environ. Health 2013, 6, 350–362. [Google Scholar] [CrossRef]
- Tytła, M.; Kostecki, M. Ecological risk assessment of metals and metalloids in bottom sediments of a water reservoir located in the key anthropogenic “hot spot” area (Poland). Environ. Earth Sci. 2019, 78, 1–7. [Google Scholar] [CrossRef] [Green Version]
- Zhu, L.; Liu, J.; Xu, S.; Xie, Z. Deposition behavior, risk assessment and source identification of heavy metals in reservoir sediments of Northeast China. Ecotoxicol. Environ. Saf. 2017, 142, 454–463. [Google Scholar] [CrossRef]
- Chen, R.; Chen, H.; Song, L.; Yao, Z.; Meng, F.; Teng, Y. Characterization and source apportionment of heavy metals in the sediments of Lake Tai (China) and its surrounding soils. Sci. Total Environ. 2019, 694, 133819. [Google Scholar] [CrossRef] [PubMed]
- Bing, H.; Zhou, J.; Wu, Y.; Wang, X.; Sun, H.; Li, R. Current state, sources, and potential risk of heavy metals in sediments of Three Gorges Reservoir, China. Environ. Pollut. 2016, 214, 485–496. [Google Scholar] [CrossRef] [PubMed]
- Sojka, M.; Siepak, M.; Gnojska, E. Assessment of heavy metal concentration in bottom sediments of Stare Miasto pre-dam reservoir on the Powa River. Rocz. Ochr. Sr. 2013, 15, 1916. [Google Scholar]
- Bing, H.; Liu, Y.; Huang, J.; Tian, X.; Zhu, H.; Wu, Y. Dam construction attenuates trace metal contamination in water through increased sedimentation in the Three Gorges Reservoir. Water Res. 2022, 217, 118419. [Google Scholar] [CrossRef]
- Eggleton, J.; Thomas, K.V. A review of factors affecting the release and bioavailability of contaminants during sediment disturbance events. Environ. Int. 2004, 30, 973–980. [Google Scholar] [CrossRef]
- Sojka, M.; Jaskuła, J.; Barabach, J.; Ptak, M.; Zhu, S. Heavy metals in lake surface sediments in protected areas in Poland: Concentration, pollution, ecological risk, sources, and spatial distribution. Sci. Rep. 2022, 12, 1–16. [Google Scholar] [CrossRef] [PubMed]
- Sojka, M.; Choiński, A.; Ptak, M.; Siepak, M. Causes of variations of trace and rare earth elements concentration in lakes bottom sediments in the Bory Tucholskie National Park, Poland. Sci. Rep. 2021, 11, 1–18. [Google Scholar] [CrossRef]
- Li, Z.; Huo, J.; Bricker, J.D. Ecological risk assessment for eutrophication and heavy metal pollution of Suyahu Reservoir sediments. Biotechnol. Biotechnol. Equip. 2019, 33, 1053–1062. [Google Scholar] [CrossRef]
- Fanny, C.; Virginie, A.; Jean-François, F.; Jonathan, B.; Marie-Claude, R.; Simon, D. Benthic indicators of sediment quality associated with run-of-river reservoirs. Hydrobiologia 2013, 703, 149–164. [Google Scholar] [CrossRef]
- Öztürk, M.; Özözen, G.; Minareci, O.; Minareci, E. Determination of heavy metals in fish, water, and sediments of Avsar Dam Lake in Turkey. J. Environ. Health Sci. Eng. 2009, 6, 73–80. [Google Scholar]
- Dong, J.; Xia, X.; Liu, Z.; Zhang, X.; Chen, Q. Variations in concentrations and bioavailability of heavy metals in rivers during sediment suspension-deposition event induced by dams: Insights from sediment regulation of the Xiaolangdi Reservoir in the Yellow River. J. Soil Sediment. 2019, 19, 403–414. [Google Scholar] [CrossRef]
- Dhanakumar, S.; Solaraj, G.; Mohanraj, R. Heavy metal partitioning in sediments and bioaccumulation in commercial fish species of three major reservoirs of river Cauvery delta region, India. Ecotoxicol. Environ. Saf. 2015, 113, 145–151. [Google Scholar] [CrossRef] [PubMed]
- Asthana, B.N.; Khare, D. Reservoir sedimentation. In Recent Advances in Dam Engineering, 1st ed.; Springer Cham: New York, NY, USA, 2022; Volume 1, pp. 265–288. [Google Scholar]
- World Commission on Dams. Dams and Development: A New Framework for Decision-Making: The report of the World Commission on Dams; Earthscan: London, UK, 2000. [Google Scholar]
- Pradhan, D.; Ancev, T.; Drynan, R.; Harris, M. Management of water reservoirs (embungs) in West Timor, Indonesia. Water Resour. Manag. 2011, 25, 339–356. [Google Scholar] [CrossRef]
- Schüttrumpf, H.; Detering, M. Innovative sediment handling to restore reservoir capacity. In Dams and Reservoirs under Changing Challenges, 1st ed.; Schleiss, A.J., Boes, R.M., Eds.; CRC Press: Boca Raton, FL, USA, 2011; Volume 1, pp. 345–352. [Google Scholar]
- MacBroom, J.; Schiff, R. Sediment management at small dam removal sites. Rev. Eng. Geol. 2013, 21, 67–79. [Google Scholar]
- Shelley, J.; Boyd, P.; Dahl, T.; Floyd, I.; Ramos-Villanueva, M. Technical Report: Reservoir Sediment Management Workshop for Regulators, Planners, and Managers; Engineer Research and Development Center (ERDC): Vicksburg, MS, USA, 2018. [Google Scholar]
- Wojciechowska, E.; Nawrot, N.; Walkusz-Miotk, J.; Matej-Łukowicz, K.; Pazdro, K. Heavy metals in sediments of urban streams: Contamination and health risk assessment of influencing factors. Sustainability 2019, 11, 563. [Google Scholar] [CrossRef] [Green Version]
- Canpolat, Ö.; Varol, M.; Okan, Ö.Ö.; Eriş, K.K. Sediment contamination by trace elements and the associated ecological and health risk assessment: A case study from a large reservoir (Turkey). Environ. Res. 2022, 204, 112145. [Google Scholar] [CrossRef]
- Alghamdi, B.A.; El Mannoubi, I.; Zabin, S.A. Heavy metals’ contamination in sediments of Wadi Al-Aqiq water reservoir dam at Al-Baha region, KSA: Their identification and assessment. Hum. Ecol. Risk Assess. 2019, 25, 793–818. [Google Scholar] [CrossRef]
- Varol, M. Environmental, ecological and health risks of trace metals in sediments of a large reservoir on the Euphrates River (Turkey). Environ. Res. 2020, 187, 109664. [Google Scholar] [CrossRef]
- Cüce, H.; Kalipci, E.; Ustaoglu, F.; Baser, V.; Türkmen, M. Ecotoxicological health risk analysis of potential toxic elements accu-mulation in the sediments of Kızılırmak River. Int. J. Environ. Sci. Technol. 2022, 19, 10759–10772. [Google Scholar] [CrossRef]
- Kormoker, T.; Karmoker, R.; Uddin, M.; Kabir, H.; Siddique, A.B.; Khan, R.; Islam, S.; Al, A.M.; Alam, M.; Ustaoğlu, F.; et al. Toxic elemental abundances in the sediment of the Jamuna River, Bangladesh: Pollution status, sources, toxicity, and ecological risks assessment. Int. J. Environ. Anal. Chem. 2022, 1–23. (in press). [Google Scholar] [CrossRef]
- Zahra, A.; Hashmi, M.Z.; Malik, R.N.; Ahmed, Z. Enrichment and geo-accumulation of heavy metals and risk assessment of sediments of the Kurang Nallah—Feeding tributary of the Rawal Lake Reservoir, Pakistan. Sci. Total Environ. 2014, 470, 925–933. [Google Scholar] [CrossRef]
- Kumar, V.; Sharma, A.; Pandita, S.; Bhardwaj, R.; Thukral, A.K.; Cerda, A. A review of ecological risk assessment and associated health risks with heavy metals in sediment from India. Int. J. Sediment Res. 2020, 35, 516–526. [Google Scholar] [CrossRef]
- Calmuc, V.A.; Calmuc, M.; Arseni, M.; Topa, C.M.; Timofti, M.; Burada, A.; Iticescu, C.; Georgescu, L.P. Assessment of heavy metal pollution levels in sediments and ecological risk by quality indices, applying a case study: The Lower Danube River, Romania. Water 2021, 13, 1801. [Google Scholar] [CrossRef]
- Szara, M.; Baran, A.; Klimkowicz-Pawlas, A.; Tarnawski, M. Ecotoxicological and chemical properties of the Rożnów reservoir bottom sediment amended with various waste materials. J. Environ. Manag. 2020, 273, 111176. [Google Scholar] [CrossRef] [PubMed]
- Bose, B.P. Dredged Sediments are One of the Valuable Resources: A Review. Int. J. Earth Sci. Knowl. Appl. 2022, 4, 324–331. [Google Scholar]
- Kazberuk, W.; Szulc, W.; Rutkowska, B. Use bottom sediment to agriculture—Effect on plant and heavy metal content in soil. Agronomy 2021, 11, 1077. [Google Scholar] [CrossRef]
- Ben Chabchoubi, I.; Mtibaa, S.; Ksibi, M.; Hentati, O. Health risk assessment of heavy metals (Cu, Zn, and Mn) in wild oat grown in soils amended with sediment dredged from the Joumine Dam in Bizerte, Tunisia. Euro-Mediterr. J. Environ. Integr. 2020, 5, 1–4. [Google Scholar] [CrossRef]
- Urbaniak, M.; Baran, A.; Szara, M.; Mierzejewska, E.; Lee, S.; Takazawa, M.; Kannan, K. Evaluation of ecotoxicological and chemical properties of soil amended with Hudson River (New York, USA) sediment. Environ. Sci. Pollut. R 2020, 27, 7388–7397. [Google Scholar] [CrossRef]
- Statistical Yearbook of the Republic of Poland; Rozkrut, D. (Ed.) Statistics Poland: Warsaw, Poland, 2021; p. 789. [Google Scholar]
- Picińska-Fałtynowicz, J.; Błachuta, J. Wytyczne Metodyczne do Przeprowadzenia Monitoringu i Oceny Potencjału Ekologicznego Zbiorników Zaporowych w Polsce; Inspekcja Ochrony Środowiska: Wrocław, Poland, 2012; p. 65. [Google Scholar]
- PN-ISO 4364:2005; Pomiar Przepływu w Korytach Otwartych. Pobieranie Próbek Materiału Dennego. Polski Komitet Normalizacyjny: Warszawa, Poland, 2005.
- Martin, J.M.; Meybeck, M. Elemental mass-balance of material carried by major world rivers. Mar. Chem. 1979, 7, 173–206. [Google Scholar] [CrossRef]
- Tomlinson, D.L.; Wilson, J.G.; Harris, C.R.; Jeffrey, D.W. Problems in the assessment of heavy-metal levels in estuaries and the formation of a pollution index. Helgoländer Meeresun. 1980, 33, 566–575. [Google Scholar] [CrossRef] [Green Version]
- Bojakowska, I.; Sokołowska, G. Geochemiczne klasy czystości osadów wodnych. Przegląd Geol. 1998, 46, 49–54. [Google Scholar]
- Hakanson, L. An ecological risk index for aquatic pollution control: A sediment ecological approach. Water Res. 1980, 14, 975–1001. [Google Scholar] [CrossRef]
- US EPA. Superfund Public Health Evaluation Manual; US EPA (United States Environmental Protection Agency): Washington, DC, USA, 1986.
- US EPA. Risk Assessment Guidance for Superfund; Volume I. Human Health Evaluation Manual (Part A); EPA/540/189/002; US EPA (United States Environmental Protection Agency): Washington, DC, USA, 1989.
- US EPA. Reference Dose (RfD): Description and Use in Health Risk Assessments; Background Document 1A; Integrated Risk Information System (IRIS); US EPA (United States Environmental Protection Agency): Washington, DC, USA, 1993.
- US EPA. Baseline Human Health Risk Assessment; Vasquez Boulevard and I-70 Superfund Site Denver, Co; US Environmental Protection Agency: Washington, DC, USA, 2001.
- EPA. Risk Assessment Guidance for Superfund; Volume I. Human health evaluation manual (Part E, supplemental guidance for dermal risk assessment); US EPA (United States Environmental Protection Agency): Washington, DC, USA, 2004.
- Qing, X.; Yutong, Z.; Shenggao, L. Assessment of Heavy Metal Pollution and Human Health Risk in Urban Soils of Steel Industrial City (Anshan), Liaoning, Northeast China. Ecotoxicol. Environ. Saf. 2015, 120, 377–385. [Google Scholar] [CrossRef] [PubMed]
- Liu, C.W.; Lin, K.H.; Kuo, Y.M. Application of factor analysis in the assessment of groundwater quality in Blackfoot disease in Taiwan. Sci. Total Environ. 2003, 313, 77–89. [Google Scholar] [CrossRef]
- Chabukdhara, M.; Nema, A.K. Heavy Metals Assessment in Urban Soil around Industrial Clusters in Ghaziabad, India: Probabilistic Health Risk Approach. Ecotoxicol. Environ. Saf. 2013, 87, 57–64. [Google Scholar] [CrossRef]
- Wei, X.; Gao, B.; Wang, P.; Zhou, H.; Lu, J. Pollution characteristics and health risk assessment of heavy metals in street dusts from different functional areas in Beijing, China. Ecotoxicol. Environ. Saf. 2015, 112, 186–192. [Google Scholar] [CrossRef]
- Haghnazar, H.; Belmont, P.; Johannesson, K.H.; Aghayani, E.; Mehraein, M. Human-induced pollution and toxicity of river sediment by potentially toxic elements (PTEs) and accumulation in a paddy soil-rice system: A comprehensive watershed-scale assessment. Chemosphere 2022, 311, 136842. [Google Scholar] [CrossRef]
- Topaldemir, H.; Taş, B.; Yüksel, B.; Ustaoğlu, F. Potentially hazardous elements in sediments and Ceratophyllum demersum: An ecotoxicological risk assessment in Miliç Wetland, Samsun, Türkiye. Environ. Sci. Pollut. Res. 2022. [Google Scholar] [CrossRef]
- Varol, M.; Ustaoğlu, F.; Tokatlı, C. Ecological risk assessment of metals in sediments from three stagnant water bodies in Northern Turkey. Curr. Pollut. Rep. 2022. [Google Scholar] [CrossRef]
- Sojka, M.; Jaskuła, J.; Siepak, M. Heavy metals in bottom sediments of reservoirs in the lowland area of western Poland: Concentrations, distribution, sources, and ecological risk. Water 2018, 11, 56. [Google Scholar] [CrossRef] [Green Version]
- Ahmed, F.; Bibi, M.H.; Asaeda, T.; Mitchell, C.P.; Ishiga, H.; Fukushima, T. Elemental composition of sediments in Lake Jinzai, Japan: Assessment of sources and pollution. Environ. Monit. Assess. 2012, 184, 4383–4396. [Google Scholar] [CrossRef] [PubMed]
- Baran, A.; Tarnawski, M.; Koniarz, T. Spatial distribution of trace elements and ecotoxicity of bottom sediments in Rybnik reservoir, Silesian-Poland. Environ. Sci. Pollut. R 2016, 23, 17255–17268. [Google Scholar] [CrossRef] [PubMed] [Green Version]
- Bing, H.; Wu, Y.; Zhou, J.; Sun, H.; Wang, X.; Zhu, H. Spatial variation of heavy metal contamination in the riparian sediments after two-year flow regulation in the Three Gorges Reservoir, China. Sci. Total Environ. 2019, 649, 1004–1016. [Google Scholar] [CrossRef] [PubMed]
- Clark, E.V.; Odhiambo, B.K.; Ricker, M.C. Comparative analysis of metal concentrations and sediment accumulation rates in two Virginian reservoirs, USA: Lakes Moomaw and Pelham. Water Air Soil Pollut. 2014, 225, 1860. [Google Scholar] [CrossRef]
- García-Ordiales, E.; Esbrí, J.M.; Covelli, S.; López-Berdonces, M.A.; Higueras, P.L.; Loredo, J. Heavy metal contamination in sediments of an artificial reservoir impacted by long-term mining activity in the Almadén mercury district (Spain). Environ. Sci. Pollut. Res. 2016, 23, 6024–6038. [Google Scholar] [CrossRef]
- Lee, P.K.; Kang, M.J.; Yu, S.; Ko, K.S.; Ha, K.; Shin, S.C.; Park, J.H. Enrichment and geochemical mobility of heavy metals in bottom sediment of the Hoedong reservoir, Korea and their source apportionment. Chemosphere 2017, 184, 74–85. [Google Scholar] [CrossRef] [PubMed]
- Makokha, V.A.; Qi, Y.; Shen, Y.; Wang, J. Concentrations, distribution, and ecological risk assessment of heavy metals in the East Dongting and Honghu Lake, China. Expo. Health 2016, 8, 31–41. [Google Scholar] [CrossRef]
- Saleem, M.; Iqbal, J.; Akhter, G.; Shah, M.H. Fractionation, bioavailability, contamination and environmental risk of heavy metals in the sediments from a freshwater reservoir, Pakistan. J. Geochem. Explor. 2018, 184, 199–208. [Google Scholar] [CrossRef]
- Smal, H.; Ligęza, S.; Wójcikowska-Kapusta, A.; Baran, S.; Urban, D.; Obroślak, R.; Pawłowski, A. Spatial distribution and risk assessment of heavy metals in bottom sediments of two small dam reservoirs (south-east Poland). Arch. Environ. Prot. 2015, 41, 67–80. [Google Scholar] [CrossRef]
- Swarnalatha, K.; Letha, J.; Ayoob, S.; Nair, A.G. Risk assessment of heavy metal contamination in sediments of a tropical lake. Environ. Monit. Assess. 2015, 187, 1–14. [Google Scholar] [CrossRef]
- Wang, C.; Liu, S.; Zhao, Q.; Deng, L.; Dong, S. Spatial variation and contamination assessment of heavy metals in sediments in the Manwan Reservoir, Lancang River. Ecotoxicol. Environ. Saf. 2012, 82, 32–39. [Google Scholar] [CrossRef]
- Wu, Q.; Qi, J.; Xia, X. Long-term variations in sediment heavy metals of a reservoir with changing trophic states: Implications for the impact of climate change. Sci. Total Environ. 2017, 609, 242–250. [Google Scholar] [CrossRef]
- Majerová, L.; Bábek, O.; Navrátil, T.; Nováková, T.; Štojdl, J.; Elznicová, J.; Matys Grygar, T. Dam reservoirs as an efficient trap for historical pollution: The passage of Hg and Pb through the Ohře River, Czech Republic. Environ. Earth Sci. 2018, 77, 1–12. [Google Scholar] [CrossRef]
- Kükrer, S.; Çakır, Ç.; Kaya, H.; Erginal, A.E. Historical record of metals in Lake Küçükçekmece and Lake Terkos (Istanbul, Turkey) based on anthropogenic impacts and ecological risk assessment. Environ. Forensics 2019, 20, 385–401. [Google Scholar] [CrossRef]
- Wang, Y.; Yang, L.; Kong, L.; Liu, E.; Wang, L.; Zhu, J. Spatial distribution, ecological risk assessment and source identification for heavy metals in surface sediments from Dongping Lake, Shandong, East China. Catena 2015, 125, 200–205. [Google Scholar] [CrossRef]
- Wang, X.; Zhang, L.; Zhao, Z.; Cai, Y. Heavy metal contamination in surface sediments of representative reservoirs in the hilly area of southern China. Environ. Sci. Pollut. R 2017, 24, 26574–26585. [Google Scholar] [CrossRef]
- Qian, B.; Tang, C.; Yang, Y.; Xiao, X. Pollution characteristics and risk assessment of heavy metals in the surface sediments of Dongting Lake water system during normal water period. Eur. J. Remote Sens. 2021, 54, 211–221. [Google Scholar] [CrossRef]
- Haq, A.U.; Muhammad, S. Spatial distribution of heavy metals contamination and risk indices evaluation in sediments of Indus River and its tributaries, Pakistan. Geocarto Int. 2021, 1–17. (in press). [Google Scholar] [CrossRef]
- Liu, N.; Liu, H.; Wu, P.; Meng, W.; Li, X.; Chen, X. Distribution characteristics and potential pollution assessment of heavy metals (Cd, Pb, Zn) in reservoir sediments from a historical artisanal zinc smelting area in Southwest China. Environ. Sci. Pollut. R. 2022, 29, 14288–14298. [Google Scholar] [CrossRef]
- Zhao, Q.; Ding, S.; Lu, X.; Liang, G.; Hong, Z.; Lu, M.; Jing, Y. Water-sediment regulation scheme of the Xiaolangdi Dam influences redistribution and accumulation of heavy metals in sediments in the middle and lower reaches of the Yellow River. Catena 2022, 210, 105880. [Google Scholar] [CrossRef]
- Dysarz, T.; Wicher-Dysarz, J.; Sojka, M. Two approaches to forecasting of sedimentation in the Stare Miasto reservoir, Poland. In Reservoir Sedimentation, 1st ed.; Schleiss, A.J., de Cesare, G., Franca, M.J., Pfister, M., Eds.; Taylor & Francis Group: London, UK, 2014; Volume 1, pp. 119–127. [Google Scholar]
- Ptak, M.; Choiński, A.; Sojka, M.; Zhu, S. Changes in water resources of selected lakes in Poland in the period 1916–2020 as information to increase their availability. Sustainability 2021, 13, 1–11. [Google Scholar] [CrossRef]
- Davidson, G.R.; Bennett, S.J.; Beard, W.C.; Waldo, P. Trace elements in sediments of an aging reservoir in rural Mississippi: Potential for mobilization following dredging. Water Air Soil Poll. 2005, 163, 281–292. [Google Scholar] [CrossRef]
- Saleem, M.; Iqbal, J.; Shah, M.H. Non-carcinogenic and carcinogenic health risk assessment of selected metals in soil around a natural water reservoir, Pakistan. Ecotoxicol. Environ. Saf. 2014, 108, 42–51. [Google Scholar] [CrossRef]
- Nawrot, N.; Wojciechowska, E.; Mohsin, M.; Kuittinen, S.; Pappinen, A.; Rezania, S. Trace metal contamination of bottom sediments: A review of assessment measures and geochemical background determination methods. Minerals 2021, 11, 872. [Google Scholar] [CrossRef]
- Hahn, J.; Opp, C.; Ganzenmüller, R.; Ewert, A.; Schneider, B.; Zitzer, N.; Laufenberg, G. Catchment soils as a factor of trace metal accumulation in sediments of the reservoir Klingenberg (eastern Ore Mountains, Germany). J. Environ. Sci. 2019, 86, 1–14. [Google Scholar] [CrossRef]
- Buccione, R.; Fortunato, E.; Paternoster, M.; Rizzo, G.; Sinisi, R.; Summa, V.; Mongelli, G. Mineralogy and heavy metal assessment of the Pietra del Pertusillo reservoir sediments (Southern Italy). Environ. Sci. Pollut. Res. 2021, 28, 4857–4878. [Google Scholar] [CrossRef]


| No. | Reservoir | River | Operation Start | Area (km2) | Volume (106 m3) | Dam Height (m) | Retention Time (d) |
|---|---|---|---|---|---|---|---|
| 1 | Besko | Wisłok | 1978 | 1.3 | 14.2 | 38.0 | 60 |
| 2 | Kozłowa Góra | Brynica | 1938 | 5.8 | 15.8 | 7.0 | 307 |
| 3 | Chańcza | Czarna Staszowska | 1985 | 4.7 | 23.8 | 15.0 | 218 |
| 4 | Klimkówka | Ropa | 1994 | 3.1 | 43.5 | 37.7 | 148 |
| 5 | Łąka | Przszczynka | 1985 | 4.2 | 12 | 6.0 | 80 |
| 6 | Słup | Nysa Szalona | 1978 | 4.9 | 38.6 | 19.2 | 22 |
| 7 | Bukówka | Bóbr | 1987 | 2 | 16.8 | 22.0 | 194 |
| 8 | Nielisz | Wieprz | 2008 | 8.3 | 25.6 | 8.6 | 107 |
| 9 | Sosnówka | Czerwonka | 2001 | 1.8 | 14 | 30.0 | 162 |
| 10 | Rzeszów | Wisłok | 1974 | 0.42 | 0.84 | 0.6 | |
| 11 | Goczałkowice | Mała Wisła | 1956 | 32 | 168.4 | 14.0 | 80 |
| 12 | Przeczyce | Czarna Przemsza | 1963 | 4.7 | 20.7 | 7.4 | 109 |
| 13 | Dobczyce | Raba | 1986 | 10.7 | 137.7 | 31.0 | 146 |
| 14 | Niedów | Witka | 1962 | 1.9 | 4.9 | 12.0 | 12.6 |
| 15 | Czorsztyn | Dunajec | 1997 | 12.3 | 231.9 | 54.5 | 116 |
| 16 | Solina | San | 1968 | 21.1 | 474 | 60.0 | 299 |
| 17 | Pierzchały | Pasłęka | 1916 | 2.4 | 11.5 | 10.0 | 8.5 |
| 18 | Rożnów | Dunajec | 1942 | 16 | 159.3 | 31.5 | 31 |
| 19 | Nysa | Nysa Kłodzka | 1971 | 20.7 | 124.7 | 13.3 | 59 |
| 20 | Sulejów | Pilica | 1973 | 23.8 | 84.3 | 11.3 | 38 |
| 21 | Jeziorsko | Warta | 1986 | 42.3 | 202.8 | 11.5 | 56 |
| 22 | Poraj | Warta | 1978 | 5.1 | 25.1 | 12.2 | 97 |
| 23 | Włocławek | Wisła | 1970 | 70.4 | 408 | 12.7 | 4.5 |
| 24 | Dębe | Narew | 1963 | 30.5 | 94.3 | 7.0 | 8.2 |
| 25 | Siemianówka | Narew | 1995 | 32.5 | 79.5 | 9.2 | 198 |
| 26 | Turawa | Mała Panew | 1948 | 20.8 | 106.2 | 13.6 | 115 |
| 27 | Otmuchów | Nysa Kłodzka | 1933 | 19.8 | 143 | 19.8 | 61 |
| 28 | Międzybrodzie | Soła | 1936 | 3.7 | 32 | 21.2 | 22 |
| Parameter | Definition | Value for Workers | Unit |
|---|---|---|---|
| IngR | Ingestion rate | 100 * | mg·day−1 |
| EF | Exposure frequency | 180 * | days·years−1 |
| ED | Exposure duration | 35 * | years |
| CF | Conversion factor | 10−6 | kg·mg−1 |
| BW | Body weight | 70 | kg |
| AT | Average time of exposure | 12,775 | days |
| SA | Skin surface area parameter | 2300 | cm2 |
| AF | Skin adherence factor | 0.5 | mg·cm−2·day−1 |
| ABF | Dermal absorption factor | 0.001 | - |
| Statistics | Cd | Cr | Cu | Ni | Pb | Zn | pH | EC | TOC |
|---|---|---|---|---|---|---|---|---|---|
| Number | 28 | 28 | 28 | 28 | 28 | 28 | 28 | 28 | 28 |
| Minimum | 0.025 | 0.53 | 0.20 | 0.20 | 0.50 | 1.11 | 6.50 | 36 | 0.5 |
| Mean | 0.187 | 7.74 | 10.62 | 7.30 | 12.47 | 52.67 | 7.84 | 126 | 7.3 |
| Median | 0.025 | 5.49 | 5.28 | 3.80 | 5.38 | 26.80 | 7.80 | 94 | 5.9 |
| Maximum | 1.650 | 31.70 | 33.20 | 32.20 | 123.0 | 297.0 | 8.80 | 564 | 30.4 |
| Standard deviation | 0.371 | 8.01 | 10.40 | 8.06 | 23.21 | 68.45 | 0.62 | 108 | 6.9 |
| Reservoir Location | Cd | Cr | Cu | Ni | Pb | Zn | Reference |
|---|---|---|---|---|---|---|---|
| Jeżewo, Poland | 0.4 | 6.5 | 10.1 | 5.9 | 17.6 | 903.7 | Sojka et al. [72] |
| Jutrosin, Poland | 0.2 | 3.1 | 3.6 | 3.7 | 6.2 | 23.1 | Sojka et al. [72] |
| Pakosław, Poland | 0.1 | 2.0 | 2.0 | 2.0 | 2.6 | 221.7 | Sojka et al. [72] |
| Rydzyna, Poland | 0.1 | 3.5 | 4.2 | 4.4 | 5.9 | 436.5 | Sojka et al. [72] |
| Środa, Poland | 0.2 | 4.8 | 4.6 | 3.5 | 7.4 | 357.5 | Sojka et al. [72] |
| Września, Poland | 0.4 | 6.1 | 9.4 | 5.5 | 15.2 | 678.4 | Sojka et al. [72] |
| Jinzai, Japan | - | 42.0 | 34.0 | 28.0 | 24.0 | 215.0 | Ahmed et al. [73] |
| Rybnik, Poland | 3.7 | 32.2 | 258.3 | 20.4 | 67.6 | 439.4 | Baran et al. [74] |
| Three Gorges, China | 1.0 | 86.4 | 49.5 | 38.6 | 54.5 | 185.1 | Bing et al. [75] |
| Pelham, USA | - | 46.0 | 51.0 | - | 19.0 | 86.0 | Clark et al. [76] |
| Grand Anicut, India | - | 139.4 | 39.9 | 7.7 | 5.4 | 85.6 | Dhanakumar et al. [32] |
| Anaikarai, India | - | 45.4 | 10.3 | 2.0 | 2.2 | 24.7 | Dhanakumar et al. [32] |
| Castilseras, Spain | - | 59.4 | 14.3 | 43.3 | 43.0 | 105.9 | Garcia-Orcidales et al. [77] |
| Hoedong, Korea | 1.6 | 28.7 | 57.6 | 17.2 | 60.5 | 247.8 | Lee et al. [78] |
| East Dongting Lake, China | 2.7 | 33.1 | 46.4 | 30.8 | 38.2 | 154.6 | Makokha et al. [79] |
| Honghu Lake, China | 0.1 | 25.2 | 78.9 | 23.8 | 20.7 | 145.5 | Makokha et al. [79] |
| Mangla Lake, Pakistan | 84.5 | 32.1 | 25.0 | 79.7 | 82.6 | 9.5 | Saleem et al. [80] |
| Brody Iłżeckiem, Poland | 2.5 | 41.4 | 16.6 | 14.3 | 69.2 | 345.0 | Smal et al. [81] |
| Zalew Zemborzycki, Poland | 0.5 | 5.9 | 7.1 | 6.1 | 54.2 | 43.1 | Smal et al. [81] |
| Stare Miasto, Poland | 0.3 | 0.3 | 1.7 | 2.7 | 3.2 | 10.9 | Sojka et al. [11] |
| Alkkulam-Veil Lake, India | 0.3 | 183.2 | 53.8 | 83.7 | 59.1 | 123.5 | Swarnalatha et al. [82] |
| Manwan, China | 1.4 | 54.7 | 38.9 | - | 47.1 | 156.7 | Wang et al. [83] |
| Miyun, China | 0.0 | 21.7 | - | 26.1 | - | 19.3 | Wu et al. [84] |
| Biliuhe, China | 2.0 | 95.6 | 35.3 | - | 62.9 | 128.0 | Zhu et al. [20] |
| Dahuofang, China | 2.4 | 116.3 | 73.0 | - | 52.5 | 175.0 | Zhu et al. [20] |
Disclaimer/Publisher’s Note: The statements, opinions and data contained in all publications are solely those of the individual author(s) and contributor(s) and not of MDPI and/or the editor(s). MDPI and/or the editor(s) disclaim responsibility for any injury to people or property resulting from any ideas, methods, instructions or products referred to in the content. |
© 2022 by the authors. Licensee MDPI, Basel, Switzerland. This article is an open access article distributed under the terms and conditions of the Creative Commons Attribution (CC BY) license (https://creativecommons.org/licenses/by/4.0/).
Share and Cite
Sojka, M.; Ptak, M.; Jaskuła, J.; Krasniqi, V. Ecological and Health Risk Assessments of Heavy Metals Contained in Sediments of Polish Dam Reservoirs. Int. J. Environ. Res. Public Health 2023, 20, 324. https://doi.org/10.3390/ijerph20010324
Sojka M, Ptak M, Jaskuła J, Krasniqi V. Ecological and Health Risk Assessments of Heavy Metals Contained in Sediments of Polish Dam Reservoirs. International Journal of Environmental Research and Public Health. 2023; 20(1):324. https://doi.org/10.3390/ijerph20010324
Chicago/Turabian StyleSojka, Mariusz, Mariusz Ptak, Joanna Jaskuła, and Vlerë Krasniqi. 2023. "Ecological and Health Risk Assessments of Heavy Metals Contained in Sediments of Polish Dam Reservoirs" International Journal of Environmental Research and Public Health 20, no. 1: 324. https://doi.org/10.3390/ijerph20010324
APA StyleSojka, M., Ptak, M., Jaskuła, J., & Krasniqi, V. (2023). Ecological and Health Risk Assessments of Heavy Metals Contained in Sediments of Polish Dam Reservoirs. International Journal of Environmental Research and Public Health, 20(1), 324. https://doi.org/10.3390/ijerph20010324