

Prediction of Multiple Clinical Complications in Cancer Patients to Ensure Hospital Preparedness and Improved Cancer Care
 , ,
, ,
Abstract
:1. Introduction
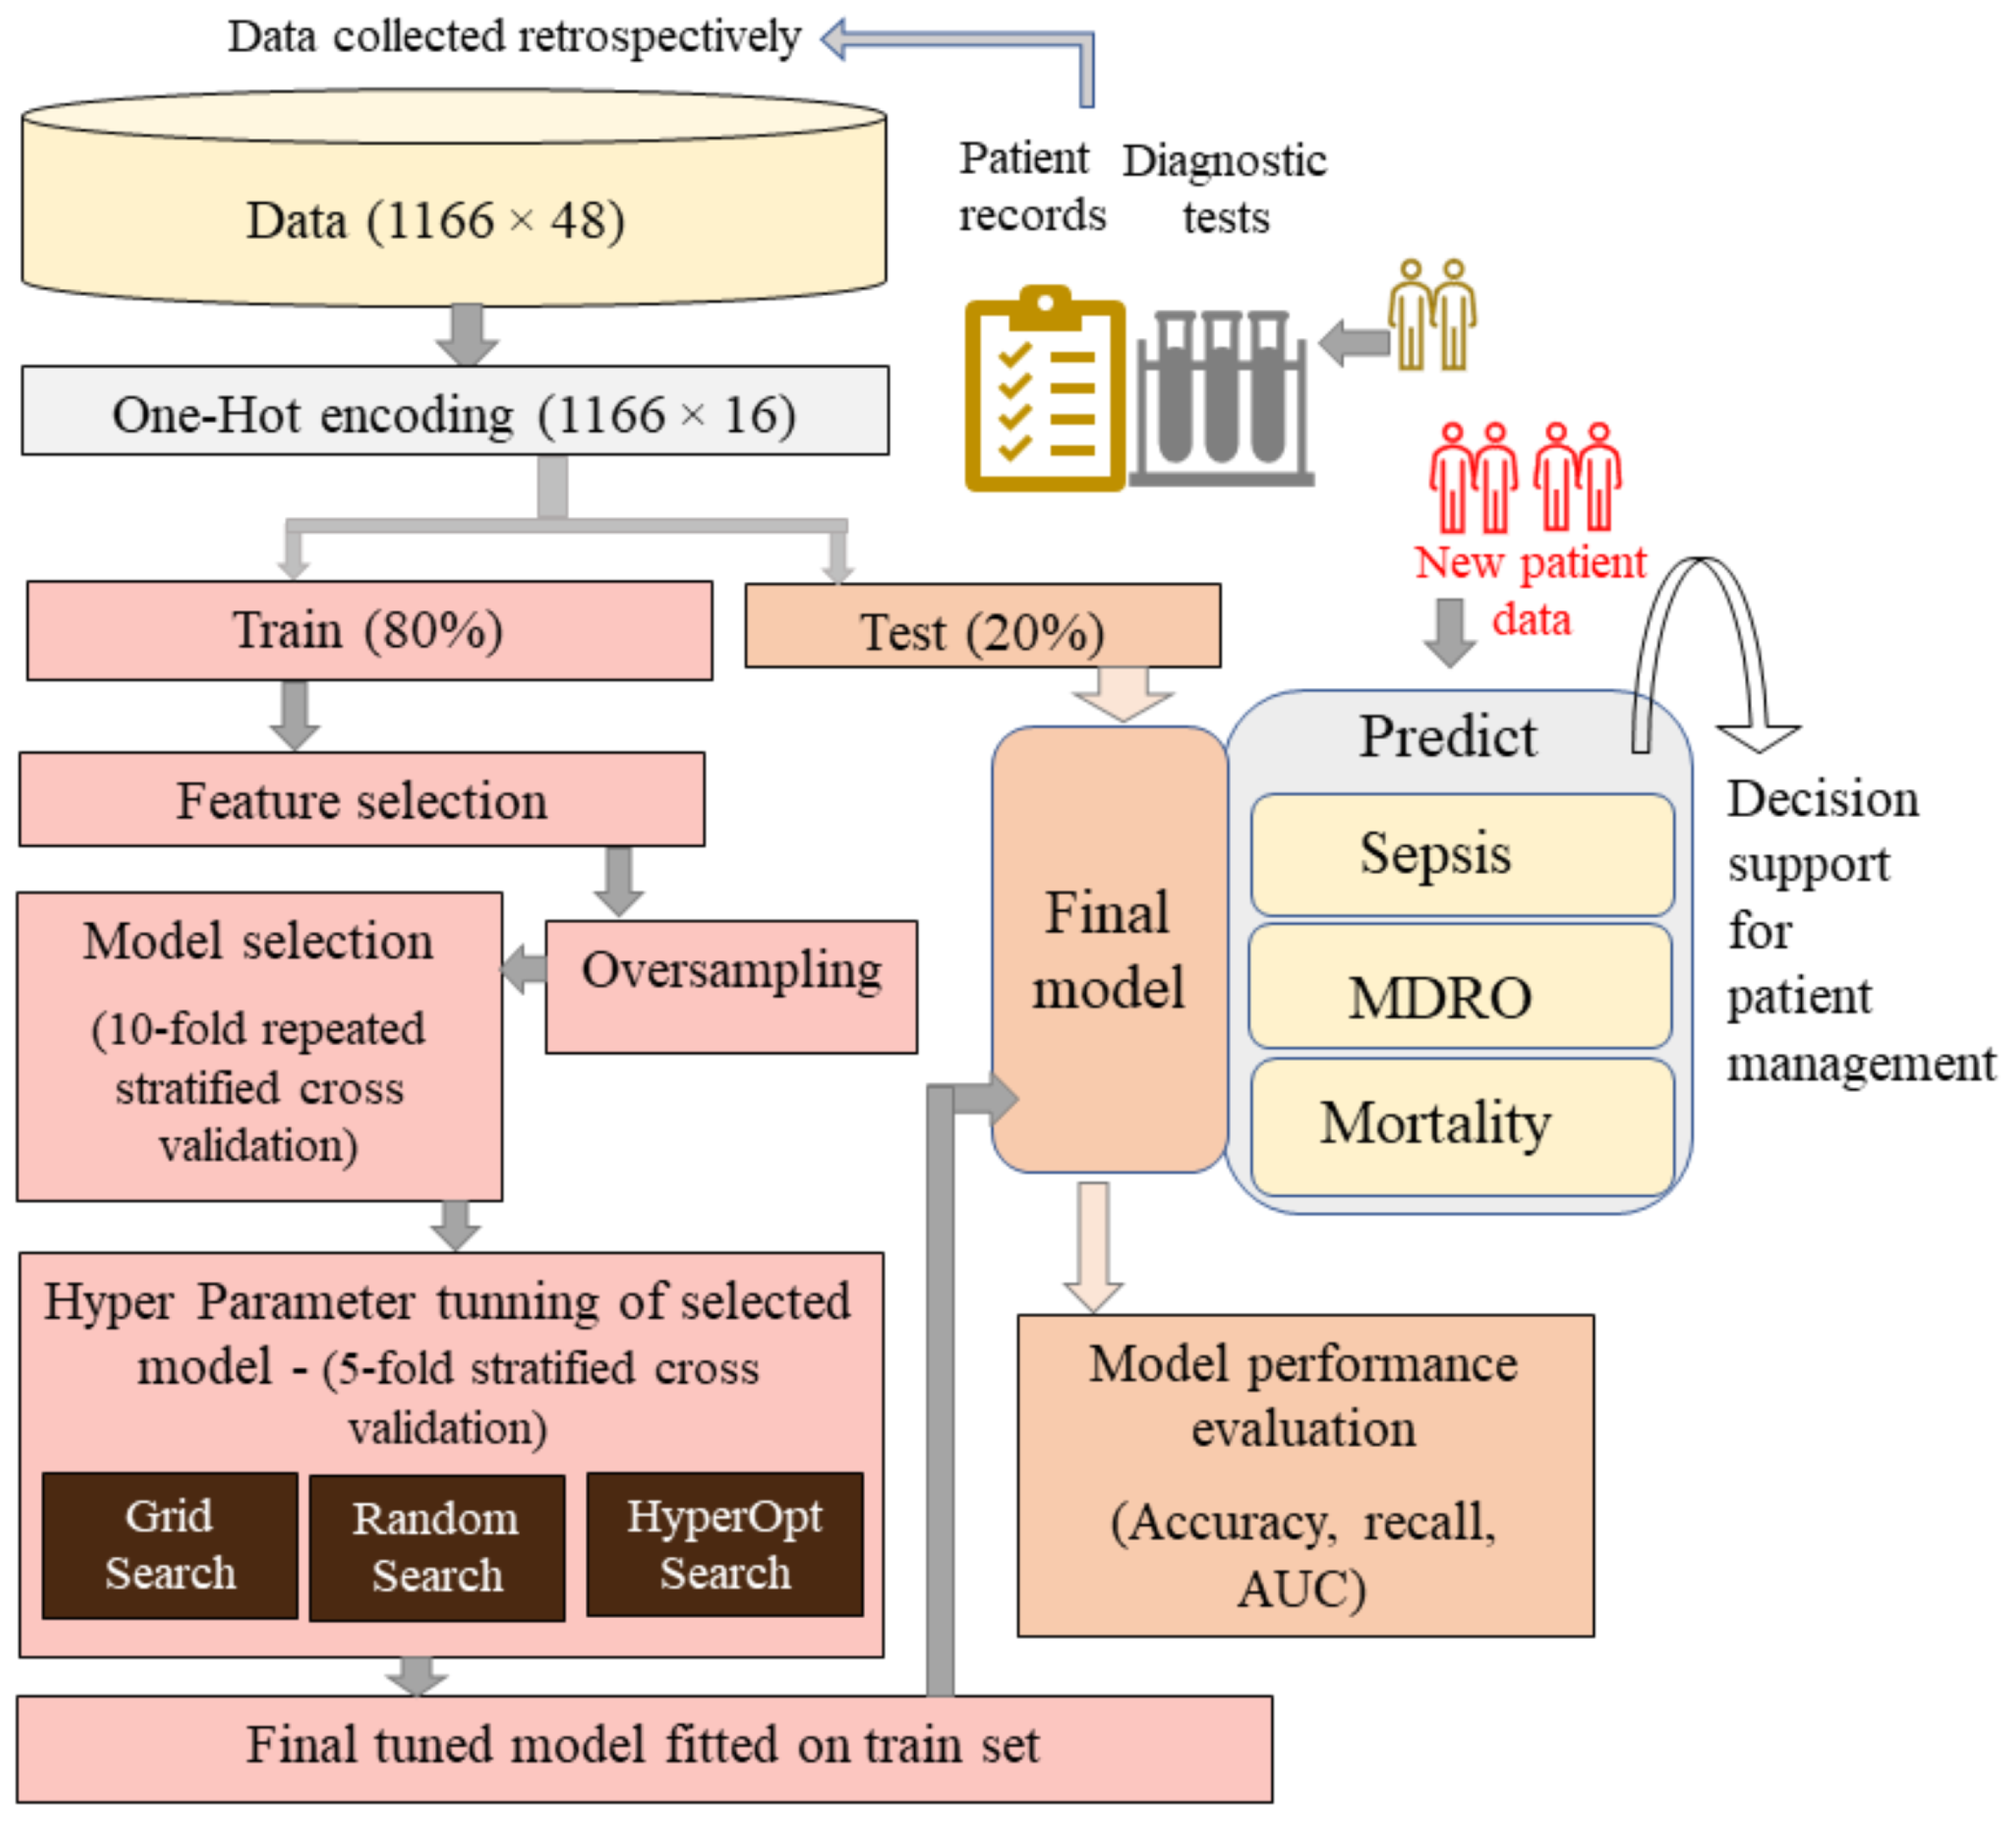
2. Methodology
2.1. Data and Study Population
2.2. Preprocessing
2.3. Model Selection
2.4. Hyperparameter Tuning
3. Results
4. Discussion
5. Conclusions
Supplementary Materials
Author Contributions
Funding
Institutional Review Board Statement
Informed Consent Statement
Data Availability Statement
Conflicts of Interest
Abbreviations
| NCCCR | The National Center for Cancer Care and Research |
| FN | Febrile Neutropenia |
| AUC | Area Under the Curve |
| MDRO | Multi-Drug-Resistant Organism |
| SDG | Sustainable Development Goals |
| WHO | World Health Organization |
| ALL | Acute Lymphoid Leukemia |
| AML | Acute Myeloid Leukemia |
| LYM | Lymphoma |
| MDS | Myelodysplastic Syndromes |
| BSI | Bloodstream Infection |
| UTI | Urinary Tract Infection |
| ML | Machine Learning |
| AI | Artificial Intelligence |
| MASCC | Multinational Association for Supportive Care in Cancer |
| ANN | Artificial Neural Network |
| GCSF | Granulocyte Colony-Stimulating Factor |
| CBC | Complete Blood Count |
| CRP | C-reactive protein |
| LSVM | Linear support vector machine |
| LR | ridge-Logistic Regression |
| GBT | Gradient-Boosting Tree |
| GN | Gram-negative |
| GP | Gram-positive |
| SMOTE | Synthetic Minority Oversampling Technique |
| BO | Bayesian Optimization |
| TPE | Tree Parzen Estimator |
| QBRI | Qatar Biomedical Research Institute |
| HMC | Hamad Medical Corporation |
References
- Sung, H.; Ferlay, J.; Siegel, R.; Laversanne, M.; Soerjomataram, I.; Jemal, A.; Bray, F. Global cancer statistics 2020: GLOBOCAN estimates of incidence and mortality worldwide for 36 cancers in 185 countries. CA Cancer J. Clin. 2021, 71, 209–249. [Google Scholar] [CrossRef] [PubMed]
- Padmanabhan, R.; Kheraldine, H.; Meskin, N.; Vranic, S.; Al Moustafa, A. Crosstalk between HER2 and PD-1/PD-L1 in breast cancer: From clinical applications to mathematical models. Cancers 2020, 12, 636. [Google Scholar] [CrossRef] [PubMed] [Green Version]
- Padmanabhan, R.; Meskin, N.; Al Moustafa, A. Mathematical Models of Cancer and Different Therapies; Springer: Singapore, 2021. [Google Scholar]
- Delebarre, M.; Dessein, R.; Lagrée, M.; Mazingue, F.; Sudour-Bonnange, H.; Martinot, A.; Dubos, F. Differential risk of severe infection in febrile neutropenia among children with blood cancer or solid tumor. J. Infect. 2019, 79, 95–100. [Google Scholar] [CrossRef]
- Jang, J.; Yoo, G.; Lee, T.; Uh, Y.; Kim, J. Identification of the robust predictor for sepsis based on clustering analysis. Sci. Rep. 2022, 12, 2336. [Google Scholar] [CrossRef] [PubMed]
- Lind, M.; Mooney, S.; Carone, M.; Althouse, B.; Liu, C.; Evans, L.; Patel, K.; Vo, P.; Pergam, S.; Phipps, A. Development and validation of a machine learning model to estimate bacterial sepsis among immunocompromised recipients of stem cell transplant. JAMA Netw. Open 2021, 4, e214514. [Google Scholar] [CrossRef] [PubMed]
- Van Wyk, F.; Khojandi, A.; Kamaleswaran, R. Improving prediction performance using hierarchical analysis of real-time data: A sepsis case study. IEEE J. Biomed. Health Inform. 2019, 23, 978–986. [Google Scholar] [CrossRef]
- Martinez-Nadal, G.; Puerta-Alcalde, P.; Gudiol, C.; Cardozo, C.; Albasanz-Puig, A.; Marco, F.; Laporte-Amargos, J.; Moreno-Garcia, E.; Domingo-Domenech, E.; Chumbita, M. Others Inappropriate empirical antibiotic treatment in high-risk neutropenic patients with bacteremia in the era of multidrug resistance. Clin. Infect. Dis. 2020, 70, 1068–1074. [Google Scholar]
- Arman, G.; Zeyad, M.; Qindah, B.; Abu Taha, A.; Amer, R.; Abutaha, S.; Koni, A.; Zyoud, S. Frequency of microbial isolates and pattern of antimicrobial resistance in patients with hematological malignancies: A cross-sectional study from Palestine. BMC Infect. Dis. 2022, 22, 146. [Google Scholar] [CrossRef]
- Zhang, Y.; Zheng, Y.; Dong, F.; Ma, H.; Zhu, L.; Shi, D.; Li, X.; Li, J.; Hu, J. Epidemiology of Febrile Neutropenia Episodes with Gram-Negative Bacteria Infection in Patients Who Have Undergone Chemotherapy for Hematologic Malignancies: A Retrospective Study of 10 Years’ Data from a Single Center. Infect. Drug Resist. 2020, 13, 903. [Google Scholar] [CrossRef] [Green Version]
- Siegel, J.; Rhinehart, E.; Jackson, M.; Chiarello, L. Management of multidrug-resistant organisms in health care settings, 2006. Am. J. Infect. Control 2007, 35, S165–S193. [Google Scholar] [CrossRef]
- Li, R.; Wang, L.; Suganthan, P.; Sourina, O. Sample-Based Data Augmentation Based on Electroencephalogram Intrinsic Characteristics. IEEE J. Biomed. Health Inform. 2022, 26, 4996–5003. [Google Scholar] [CrossRef]
- Xu, Z.; Shen, D.; Nie, T.; Kou, Y. A hybrid sampling algorithm combining M-SMOTE and ENN based on random forest for medical imbalanced data. J. Biomed. Inform. 2020, 107, 103465. [Google Scholar] [CrossRef] [PubMed]
- Padmanabhan, R.; Meskin, N.; Haddad, W. Reinforcement learning-based control of drug dosing for cancer chemotherapy treatment. Math. Biosci. 2017, 293, 11–20. [Google Scholar] [CrossRef] [PubMed]
- El Alaoui, Y.; Elomri, A.; Qaraqe, M.; Padmanabhan, R.; Taha, R.; El Omri, H.; Omri, A.; Aboumarzouk, O. Others a Review of Artificial Intelligence Applications in Hematology Management: Current Practices and Future Prospects. J. Med. Internet Res. 2022, 24, e36490. [Google Scholar] [CrossRef] [PubMed]
- Cho, B.; Kim, K.; Bilegsaikhan, S.; Suh, Y. Machine learning improves the prediction of febrile neutropenia in Korean inpatients undergoing chemotherapy for breast cancer. Sci. Rep. 2020, 10, 14803. [Google Scholar] [CrossRef]
- Wiberg, H.; Yu, P.; Montanaro, P.; Mather, J.; Birz, S.; Schneider, M.; Bertsimas, D. Prediction of Neutropenic Events in Chemotherapy Patients: A Machine Learning Approach. JCO Clin. Cancer Inform. 2021, 5, 904–911. [Google Scholar] [CrossRef]
- Zhan, M.; Chen, Z.; Ding, C.; Qu, Q.; Wang, G.; Liu, S.; Wen, F. Machine learning to predict high-dose methotrexate-related neutropenia and fever in children with B-cell acute lymphoblastic leukemia. Leuk. Lymphoma 2021, 62, 2502–2513. [Google Scholar] [CrossRef]
- Jakob, C.; Classen, A.; Stecher, M.; Fuhrmann, S.; Franke, B.; Fuchs, F.; Walker, S.; Cornely, O.; Vehreschild, J. 2187. Prediction of Patient Outcome During Febrile Neutropenia Despite Anti-infective Treatment Using Machine Learning Algorithms. Open Forum Infect. Dis. 2019, 6, S744. [Google Scholar] [CrossRef] [Green Version]
- Agius, R.; Brieghel, C.; Andersen, M.; Pearson, A.; Ledergerber, B.; Cozzi-Lepri, A.; Louzoun, Y.; Andersen, C.; Bergstedt, J.; Stemann, J. Others Machine learning can identify newly diagnosed patients with CLL at high risk of infection. Nat. Commun. 2020, 11, 363. [Google Scholar] [CrossRef] [Green Version]
- Hui, E.; Leung, L.; Poon, T.; Mo, F.; Chan, V.; Ma, A.; Poon, A.; Hui, E.; Mak, S.; Lai, M. Others Prediction of outcome in cancer patients with febrile neutropenia: A prospective validation of the Multinational Association for Supportive Care in Cancer risk index in a Chinese population and comparison with the Talcott model and artificial neural network. Support. Care Cancer 2011, 19, 1625–1635. [Google Scholar]
- Xiang, L.; Wang, H.; Fan, S.; Zhang, W.; Lu, H.; Dong, B.; Liu, S.; Chen, Y.; Wang, Y.; Zhao, L. Others Machine Learning for Early Warning of Septic Shock in Children with Hematological Malignancies Accompanied by Fever or Neutropenia: A Single Center Retrospective Study. Front. Oncol. 2021, 11, 2190. [Google Scholar] [CrossRef] [PubMed]
- Alali, M.; Mayampurath, A.; Dai, Y.; Bartlett, A. A prediction model for bacteremia and transfer to intensive care in pediatric and adolescent cancer patients with febrile neutropenia. Sci. Rep. 2022, 12, 7429. [Google Scholar] [CrossRef] [PubMed]
- Du, X.; Min, J.; Shah, C.; Bishnoi, R.; Hogan, W.; Lemas, D. Predicting in-hospital mortality of patients with febrile neutropenia using machine learning models. Int. J. Med. Inform. 2020, 139, 104140. [Google Scholar] [CrossRef] [PubMed]
- Garrido-Merchán, E.; Hernández-Lobato, D. Dealing with categorical and integer-valued variables in bayesian optimization with gaussian processes. Neurocomputing 2020, 380, 20–35. [Google Scholar] [CrossRef] [Green Version]
- Pettit, N.; Boadu, D.; Bischof, J. Emergency department management of chemotherapy related febrile neutropenia: An opportunity to improve care. Am. J. Emerg. Med. 2021, 50, 5–9. [Google Scholar] [CrossRef]


| Features (n = 1166) | Values |
|---|---|
| Age (mean ± std. dev) | |
| Infection | |
| Bloodstream infection, n (%) | 427 (36.62%) |
| Chest infection, n (%) | 260 (22.22%) |
| Sinus infection, n (%) | 11 (0.94%) |
| Skin infection, n (%) | 78 (6.68%) |
| Colitis, n (%) | 86 (7.37%) |
| Urinary tract infection, n (%) | 79 (6.8%) |
| Gender | |
| Male, n (%) | 925 (79.33%) |
| Female, n (%) | 241 (20.66%) |
| Diagnostics category | |
| ALL, n (%) | 283 (24.27%) |
| AML, n (%) | 640 (54.88%) |
| LYM, n (%) | 213 (18.26%) |
| MDS, n (%) | 27 (2.31%) |
| Type of microorganism in BSI | |
| 17 (3.98%) | |
| GN, n (%) | 337 (78.92%) |
| GN, GP, n (%) | 19 (4.45%) |
| GP, n (%) | 54 (12.65%) |
| Region | |
| R1- South Asia, n (%) | 497 (42.62%) |
| R2- MENA, n (%) | 424 (36.36%) |
| R3- East Pacific, n (%) | 166 (14.23%) |
| R4- Sub-Sahara Africa, n (%) | 55 (4.71%) |
| R5- Others, n (%) | 24 (2.05%) |
| Treatment phase | |
| Pretreatment, n (%) | 166 (14.23%) |
| Induction for remission, n (%) | 323 (27.70%) |
| Post induction, n (%) | 507 (43.48%) |
| Salvage therapy, n (%) | 51 (4.37%) |
| Palliative, n (%) | 119 (10.21%) |
| Disease status | |
| Complete/partial response, n (%) | 548 (47.00%) |
| Refractory/Relapse, n (%) | 194 (16.64%) |
| Others, n (%) | 424 (36.36%) |
| Outcome | |
| Sepsis, n (%) | 229 (19.64%) |
| MDRO, n (%) | 215 (18.43%) |
| Mortality, n (%) | 66 (12.86%) |
| Features | Sepsis Group (n = 229) | Non-Sepsis Group (n = 937) |
|---|---|---|
| Age | 42.16 ± 15.60 | 39.8 ± 14.19 |
| Sex (male) | 174 (75.98%) | 751 (80.14%) |
| Line-related | 86 (37.55%) | 112 (11.95%) |
| BSI-polymicrobial | 31 (13.54%) | 32 (3.41%) |
| Chest infection | 98 (42.79%) | 162 (17.29%) |
| UTI | 31 (13.54%) | 48 (5.1%) |
| MDRO | 96 (41.92%) | 119 (12.70%) |
| Features | MDRO Group (n = 215) | Non-MDRO Group (n = 951) |
|---|---|---|
| Age | 40.83 ± 14.68 | 40.17 ± 14.46 |
| Sex (male) | 163 (75.81%) | 762 (80.12%) |
| Line-related | 113 (52.56%) | 85 (8.93%) |
| BSI-polymicrobial | 43 (20%) | 20 (2.1%) |
| Chest infection | 65 (30.23%) | 195 (20.50%) |
| Colitis | 32 (14.88%) | 54 (5.67%) |
| UTI | 23 (10.69%) | 56 (5.89%) |
| Skin infection | 30 (13.95%) | 48 (5.04%) |
| Features | Mortal Group (n = 66) | Non-Mortal Group (n = 447) |
|---|---|---|
| Age | 42.28 ± 16.60 | 40.08 ± 14.59 |
| Sex (male) | 53 (80.30%) | 343 (76.73%) |
| Chest infection | 40 (60.60%) | 100 (22.37%) |
| Sepsis | 55 (83.33%) | 51 (11.41%) |
Disclaimer/Publisher’s Note: The statements, opinions and data contained in all publications are solely those of the individual author(s) and contributor(s) and not of MDPI and/or the editor(s). MDPI and/or the editor(s) disclaim responsibility for any injury to people or property resulting from any ideas, methods, instructions or products referred to in the content. |
© 2022 by the authors. Licensee MDPI, Basel, Switzerland. This article is an open access article distributed under the terms and conditions of the Creative Commons Attribution (CC BY) license (https://creativecommons.org/licenses/by/4.0/).
Share and Cite
Padmanabhan, R.; Elomri, A.; Taha, R.Y.; El Omri, H.; Elsabah, H.; El Omri, A. Prediction of Multiple Clinical Complications in Cancer Patients to Ensure Hospital Preparedness and Improved Cancer Care. Int. J. Environ. Res. Public Health 2023, 20, 526. https://doi.org/10.3390/ijerph20010526
Padmanabhan R, Elomri A, Taha RY, El Omri H, Elsabah H, El Omri A. Prediction of Multiple Clinical Complications in Cancer Patients to Ensure Hospital Preparedness and Improved Cancer Care. International Journal of Environmental Research and Public Health. 2023; 20(1):526. https://doi.org/10.3390/ijerph20010526
Chicago/Turabian StylePadmanabhan, Regina, Adel Elomri, Ruba Yasin Taha, Halima El Omri, Hesham Elsabah, and Abdelfatteh El Omri. 2023. "Prediction of Multiple Clinical Complications in Cancer Patients to Ensure Hospital Preparedness and Improved Cancer Care" International Journal of Environmental Research and Public Health 20, no. 1: 526. https://doi.org/10.3390/ijerph20010526